Article

Driving Mechanism of Port-City Spatial Relation Evolution from an Ecological Perspective: Case Study of Xiamen Port of China

1
College of Transport and Communications, Shanghai Maritime University, Shanghai 201306, China
2
CCCC Third Harbor Consultants Co., Ltd, Shanghai 200032, China
*
Authors to whom correspondence should be addressed.
Sustainability 2020, 12(7), 2857; https://doi.org/10.3390/su12072857
Submission received: 29 February 2020 / Revised: 27 March 2020 / Accepted: 31 March 2020 / Published: 3 April 2020
(This article belongs to the Special Issue Port Strategy for Sustainable Development)

Abstract

:
With the economic globalization continuing to advance, coastal port cities have enjoyed increasingly prominent status and roles as the link between the sea and the land and an important window of foreign trade and exchanges. However, port cities, while embracing rapid development, have also produced a significant impact on natural resources and the ecological environment. Ecological environment protection has become a must-consider factor for sustainable development of port cities. To secure coordinated and sustainable development of ports and cities, this paper utilizes the system dynamics theory and approaches the subject from driver analysis. In the traditional port-city collaboration system model, indicators of ecological perspectives such as land resources and environmental protection are introduced to build a dynamic model for the spatial evolution system of port-city coupling system based on ecological protection, and the dynamic mechanism of port-city spatial relation evolution is analyzed in depth with a case study of Dongdu Port Area of Xiamen Port. The model’s simulation results show that from an ecological perspective, the spatial distance between the port and the city is critical to their sustainable and coordinated development. Only after the port-city spatial distance increases moderately can the development efficiency of the port-city system welcomes a relatively significant increase. Managing the port-city distance well has a significant driving effect on capacity enhancement of the port and economic development of the city. This provides a theoretical reference for further studies on port-city coordinated and sustainable development and provides constructive suggestions for the government to make relevant decisions.

1. Introduction

With international trade transactions growing, ports, as key hubs for land–water transportation, play an important role in a city’s economic development. However, the rapid development of ports has also put port cities under a series of ecological challenges such as disordered resources and environmental pollution caused by excessive development [1,2,3]. A port city is a highly populated area, while the ecological environment is what human beings rely on to live by. As people’s awareness of the hazards to the ecological environment keeps rising, protecting port city ecology for sustainable development of ports has become a focus of attention of social development. According to previous research findings [4], the port-cityspatial relation has also changed accordingly as port and city step into different stages of development and plays an important role in port-city coordinated development. For example, China has been promoting its port management system reform in recent years. Taking this opportunity, port cities have enjoyed vigorous development and port-city relations have become increasingly close. Specifically, the spatial changes between port and city are particularly significant: Port and city are gradually moving farther away from each other, stretching the distance between port and city, and the original industrial shoreline of ports is gradually transformed into a waterfront shoreline of cities. This can be attributed to many reasons.
From the perspective of ports, as larger ships feature lower costs of transportation, ships have been following an upsizing trend in recent years. To meet the requirements of ship upsizing, port structure has changed, highlighting the upsizing trend of ports, with specialized ports gradually moving to deep-water areas with better shoreline resources [3]. This gradually pulls port and city apart in their spatial relation. For example, Shanghai Port developed from Huangpu River to Yangtze River, and then to the open seas. The water depth of −16 m has been a very critical factor during the process [5]. Fuzhou Port gradually shifted from the inner port area of Minjiang River estuary to Jiangyin Port Area and Luoyuan Bay Port Area, out of similar considerations [3,6].
From the perspective of city, in addition to developing port transportation, shoreline resources also serve to develop a waterfront shoreline for the city and its residents. This is particularly important for developing the city’s tertiary industry and improving residents’ quality of life [7]. As the scale of the port continues to rise, a large amount of cargo has to be transported across urban areas, which imposes greater pressure on urban commuting traffic, leaving the traffic in port cities more congested and the contradiction between port expansion and urban development increasingly intensified.
From the perspective of ecological benefits, greenness and environment protection have become inevitable trends and urgent requirements for port development under the constraints of resources and environment. Port-front areas are usually home to the industries with serious pollution of dust or noise. The impacts of these industries on the urban environment can be significantly reduced if they move farther away from urban areas [8]. Meanwhile, as cities continue to expand, the shorelines and land resources occupied by port areas will see their values rising, making them more suitable for developing high-end and non-polluting service industries that have higher production values. From the efficient use of resources point of view, the government has the incentive to relocate these original industrial factories and areas as well as the ports to out of the cities.
With the emergence and development of the third- and fourth-generation ports, port services that are dominated by cargo warehousing and handling have failed to meet the increasingly diversified needs of economic activities, while related modern service sectors such as trade, ship financing, maritime insurance, maritime law, shipping transactions, and shipping brokerage have enjoyed rapid development. Ports have gradually changed from transportation centers to comprehensive shipping service centers. However, the development of the shipping service sector depends not only on the city’s logistics, finance, insurance, information, and other soft functions, but also on port infrastructure. Meanwhile, as important hubs, ports can lead industries to agglomerate and then develop new port-front cities, and further enable leap-forward expansion of cities’ economy. If the port-city distance is too large, the longer time for commuting as well as cargo collection, distribution, and transportation, and the too-high economic costs will all adversely impact industrial development and new city development. Therefore, properly managing the port-city distance can maximize the ports’ role in driving cities’ economy while minimizing the adverse impact on cities.
Therefore, despite that port-city separation has become an important development trend of the port-city relation, ports still need to be within a certain distance to their cities to maximize the coupling role between the port and the city. This paper adopts the system dynamics method and starts from the port, city, and ecology perspectives, with Xiamen as an example for study, to introduce indicators such as shoreline resource occupation, land resource occupation, and pollution emissions to build a system dynamics (SD) model of a port-city coupling system based on ecological benefit concepts. Through multi-scenario simulation, the paper makes comparative analysis on the impact of port-cityspatial distance changes on the sustainable development of Xiamen to maximize the economic, environmental, and social benefits and provide theoretical references and policy-making advice for coordinated development of the port city.
The article is structured as follows. Section 2 reviews relevant literature on port-cityrelations, and Section 3 builds a system dynamics model. In Section 4, an empirical analysis is made using Xiamen Port as an example. Finally, in Section 5, main conclusions of the paper and corresponding opinions are presented.

2. Literature Review

The research on port-city relation derives from the port location theory in the 1930s [9]. With the changes of the social economy, the research scope has been expanding to form five major research fields today. This section starts from the five major research fields and focuses on the quantitative research results of the port-city relation, supplemented by a summary of related literature in the past.

2.1. Existing Mechanisms of Port-cityRelations

The first part focuses on port-city spatial structures and connections. Scholars at home and abroad have proposed a range of port system and port space evolution models based on empirical cases of port cities in various countries or regions, such as the Anyport model and the Taaffee six-stage and four-stage models [10,11,12,13,14]. Debrie and Raimbault [4] assumed that economic sectors (stakeholders in transportation, water, housing, energy, industry, etc.) have a significant impact on the development mechanism of the city, and applied an analysis framework based on regional negotiation to two inland port cities to understand how stakeholder interactions change urban geography. Ducruet [15] pointed out that the container revolution and the spatial distribution of new industrial activities were the main factors in port-city relations. The maritime network had produced a significant impact on the port-city interface in the past three decades. He used simple features including geographic coordinates, urban population, logistical activities, port infrastructure, and maritime traffic to highlight regional differences and analyzed port cities on the worldwide scale. The second part focuses on the industrial development of the port area and the port’s impact on the area. Many scholars studied the impacts of the industrial development of ports and port-front areas on the functions, environment, leisure space, and redevelopment of the area from the perspectives of port industry, port logistics, and waterfront living space [16,17,18,19,20]. The third part is the related research on port-city traffic network connections [7,21]. Monios et al. [22], with Port of Gothenburg as an example, studied the location selection of ports’ logistics distribution facilities, and pointed out that city planners should coordinate logistics transportation from a regional perspective and identify the logistics activities that should be located near the port, rather than blindly competing with inland areas for better facility locations. The fourth part discusses the sustainable development of ports and cities and construction of green ecological ports. From the perspective of port and port city development, taking into account the ecological environment protection while developing the port can enhance the sustainability capacity of the city [23,24]. We will discuss the fifth major area of research in the next section, namely the study on quantitative analysis of port-city relations.

2.2. Quantitative Research on Port-cityRelations

Many scholars have carried out quantitative analysis on port-city relations and explored the differences, connections, and interrelations between different cities from a regional angle. Such research is represented by Vallega who selected relevant indicators of port cities; the proportion between them can be obtained through certain data standardization to reflect the type of port city relationship [25]. Vallega found that there existed wide gaps in the port-city relations between different areas of the world. For example, most European port cities emphasized the role of ports for the entire European continent, and the port-city interdependence was relatively weak yet stable. Meanwhile, most Asian port cities relied more on the rapid development of port-related industries in coastal areas and drove constant expansion of the cities’ economic scales through port development [26]. Apart from this, the quantitative research on port-city relations can be roughly divided into three parts. The first part proposes, revises, and applies the relative concentration index (RCI) model. Many scholars utilized the RCI model to classify port cities [27,28,29]. Wu further analyzed the features of changes in port-city relations [30]. The second part reveals the multifaceted nature of port-city relations by constructing a comprehensive index system and applying a diverse quantitative model. The main purpose is to use the grey correlation, the system dynamics model, and the system entropy to study the intensity change of the relations between ports and cities [31,32]. The third part proposes the development theory of port cities and explains the development stages of port cities based on the quantitative intensity features or changes of port-cityconnections. Examples in this regard include Guo and Han who proposed a port-cityspatial evolution model [33], and Karel et al. who proposed a method for analyzing port-cityconnection mechanisms [34].

2.3. Under-Researched Aspects

To sum up, most studies focused on exploring the relations between ports and cities in terms of spatial structure, economic development, transportation networks, etc., but few looked at the ecological benefits of ports. "Ecotypic" ports refer to resource-saving and environment-friendly ports. Construction of ecotypic ports requires the evaluation of the impacts on the urban environment as well as the consumption of land, shorelines, and other important resources while looking at the size and costs of port transportation [23]. Since the state urged the construction of ecotypic ports, changing the spatial distance between ports and cities has become an important measure for many coastal cities to develop ecotypic ports for sustainable development. For example, the Huangpu River Port of Shanghai Port has been largely relocated to Waigaoqiao Port Area and Yangshan Deep-water Port Area; the up-scaling transportation in the north main port area of Tianjin Port has seriously disrupted the green and livable urban construction of Binhai New Area, which leads to the current planning of adjustment and relocation of the port area; Xiamen Dongdu Port Area has transformed some multi-purpose terminals to cruise berths and is planning to move the freight function to out of the island; Ningbo Beilun Port also intends to gradually transfer bulks transshipment operations to Chuanshan Port Area and Majishan Port Area, which are farther away from the city [1,3,6]. Some scholars have tried to evaluate the impact of port-city separation in recent years, but most of them ended up with qualitative descriptions, lacking quantitative research on the changes of factors such as resource consumption, environmental protection, and integrated transport costs that arise from port-city separation. There is no mature systematic theoretical method on how to keep the port-city spatial distance within a moderate range. Therefore, this paper, based on existing research results, focuses on addressing the following problems: 1) How to build a port-city development model based on an ecological perspective; 2) how to quantitatively analyze the impact of port-city spatial distance on urban resources use, environmental protection, and integrated transport costs of ports during port-city interactions; 3) targeted suggestions on how to maintain an appropriate spatial distance for port-city development.

3. Modeling

System dynamics (SD) is a science that combines the theory of system science with computer simulation technology. It is a method to study the system structure and feedback changes. The coupling system of port and city is dynamic in nature, including several subsystems, and the self-correcting and self-reinforcing effects of these subsystems affect the sustainable development of port cities. Port is not only related to social and economic environments, but also closely connected to the ecological environment and resources; therefore, this article applies the method of system dynamics, where the city system, port system, and environment resources system are the three subsystems constituting a harbor city comprehensive system coupling, and incorporates environmental constraints into the model, so as to comprehensively and objectively analyze a harbor city regarding the feasibility of the coupling system of sustainable development measures. The development trend of the port city in the future is simulated by adjusting the parameter changes in the model to maximize the economic benefits, social benefits, and environmental benefits.

3.1. System Structure Relations

The first step in the study of system dynamics is to determine the system boundary; that is, to determine the structure of the system. The port and city coupling system includes three parts: Urban subsystem, port subsystem, and environmental resources subsystem. The urban subsystem refers to the urban economy as the main body (including GDP, fixed-asset investment, volume of trade, etc.). Port subsystem refers to the factors related to port development (including port throughput, freight pressure, port investment, port passing capacity, length of available shoreline, etc.). The environmental resources subsystem mainly consists of two parts: The additional pollution treatment cost caused by port operation activities and the impact of infrastructure construction on the consumption of natural resources. System dynamics is quite suitable for studying the interrelations between main factors in the system. It converts purely static methods into dynamic simulation, featuring flexible equations and non-fixed model structures. This enables effective simulation and research of system dynamics and facilitates comparative analysis of hypothesis to provide a basis and support for decision-making. According to the system analysis and coordination principle, the port-city spatial system can be divided into three subsystems: Urban subsystem, port subsystem, and ecological subsystem. The system framework of the model is shown in Figure 1.
Each subsystem is built up by the state variables from cumulative effects, the speed variables from control effects, auxiliary variables, parameters, coefficients, and constants. Each subsystem not only depends on its internal structure for operation but is also subject to the correlations of other subsystems. The development of city economy is an important guarantee for port construction and operation. With the development of city economy, the city has more funds to invest in the construction of port and its collection and distribution system, providing the port with space for comprehensive logistics activities and inland connection channels, so as to make the port continuously adapt to the needs of higher level development of city economy. The port, as a transportation hub, is the center of the transformation of various means of transportation. A large number of goods are gathered in the port to promote economic development. At the same time, the area around the port also developed the processing industry, which promoted the development of industry and international trade and attracted foreign investment. However, port infrastructure construction may have a negative impact on the ecosystem, thus causing adverse social and environmental impacts and restricting the development of cities and ports.
In the coupled port and city system, the urban subsystem is the driving force to promote economic development and progress. The material wealth created by urban economic activities can improve people’s living quality and living standard, and further attract more people to develop in port cities. The economic value created by economic activities can also drive the development of the port subsystem, and the development of the port will react on the city and drive the economic growth of the city. The environmental resources subsystem is the foundation of the port city’s economic activities, and the carrying capacity of natural resources directly affects the economic development level of the port city. The subsystems and factors of the port and city coupling system are interrelated and influence each other, which have the characteristics of obvious dynamics, complexity, and multiple feedback.

3.2. System Analysis and Indicators

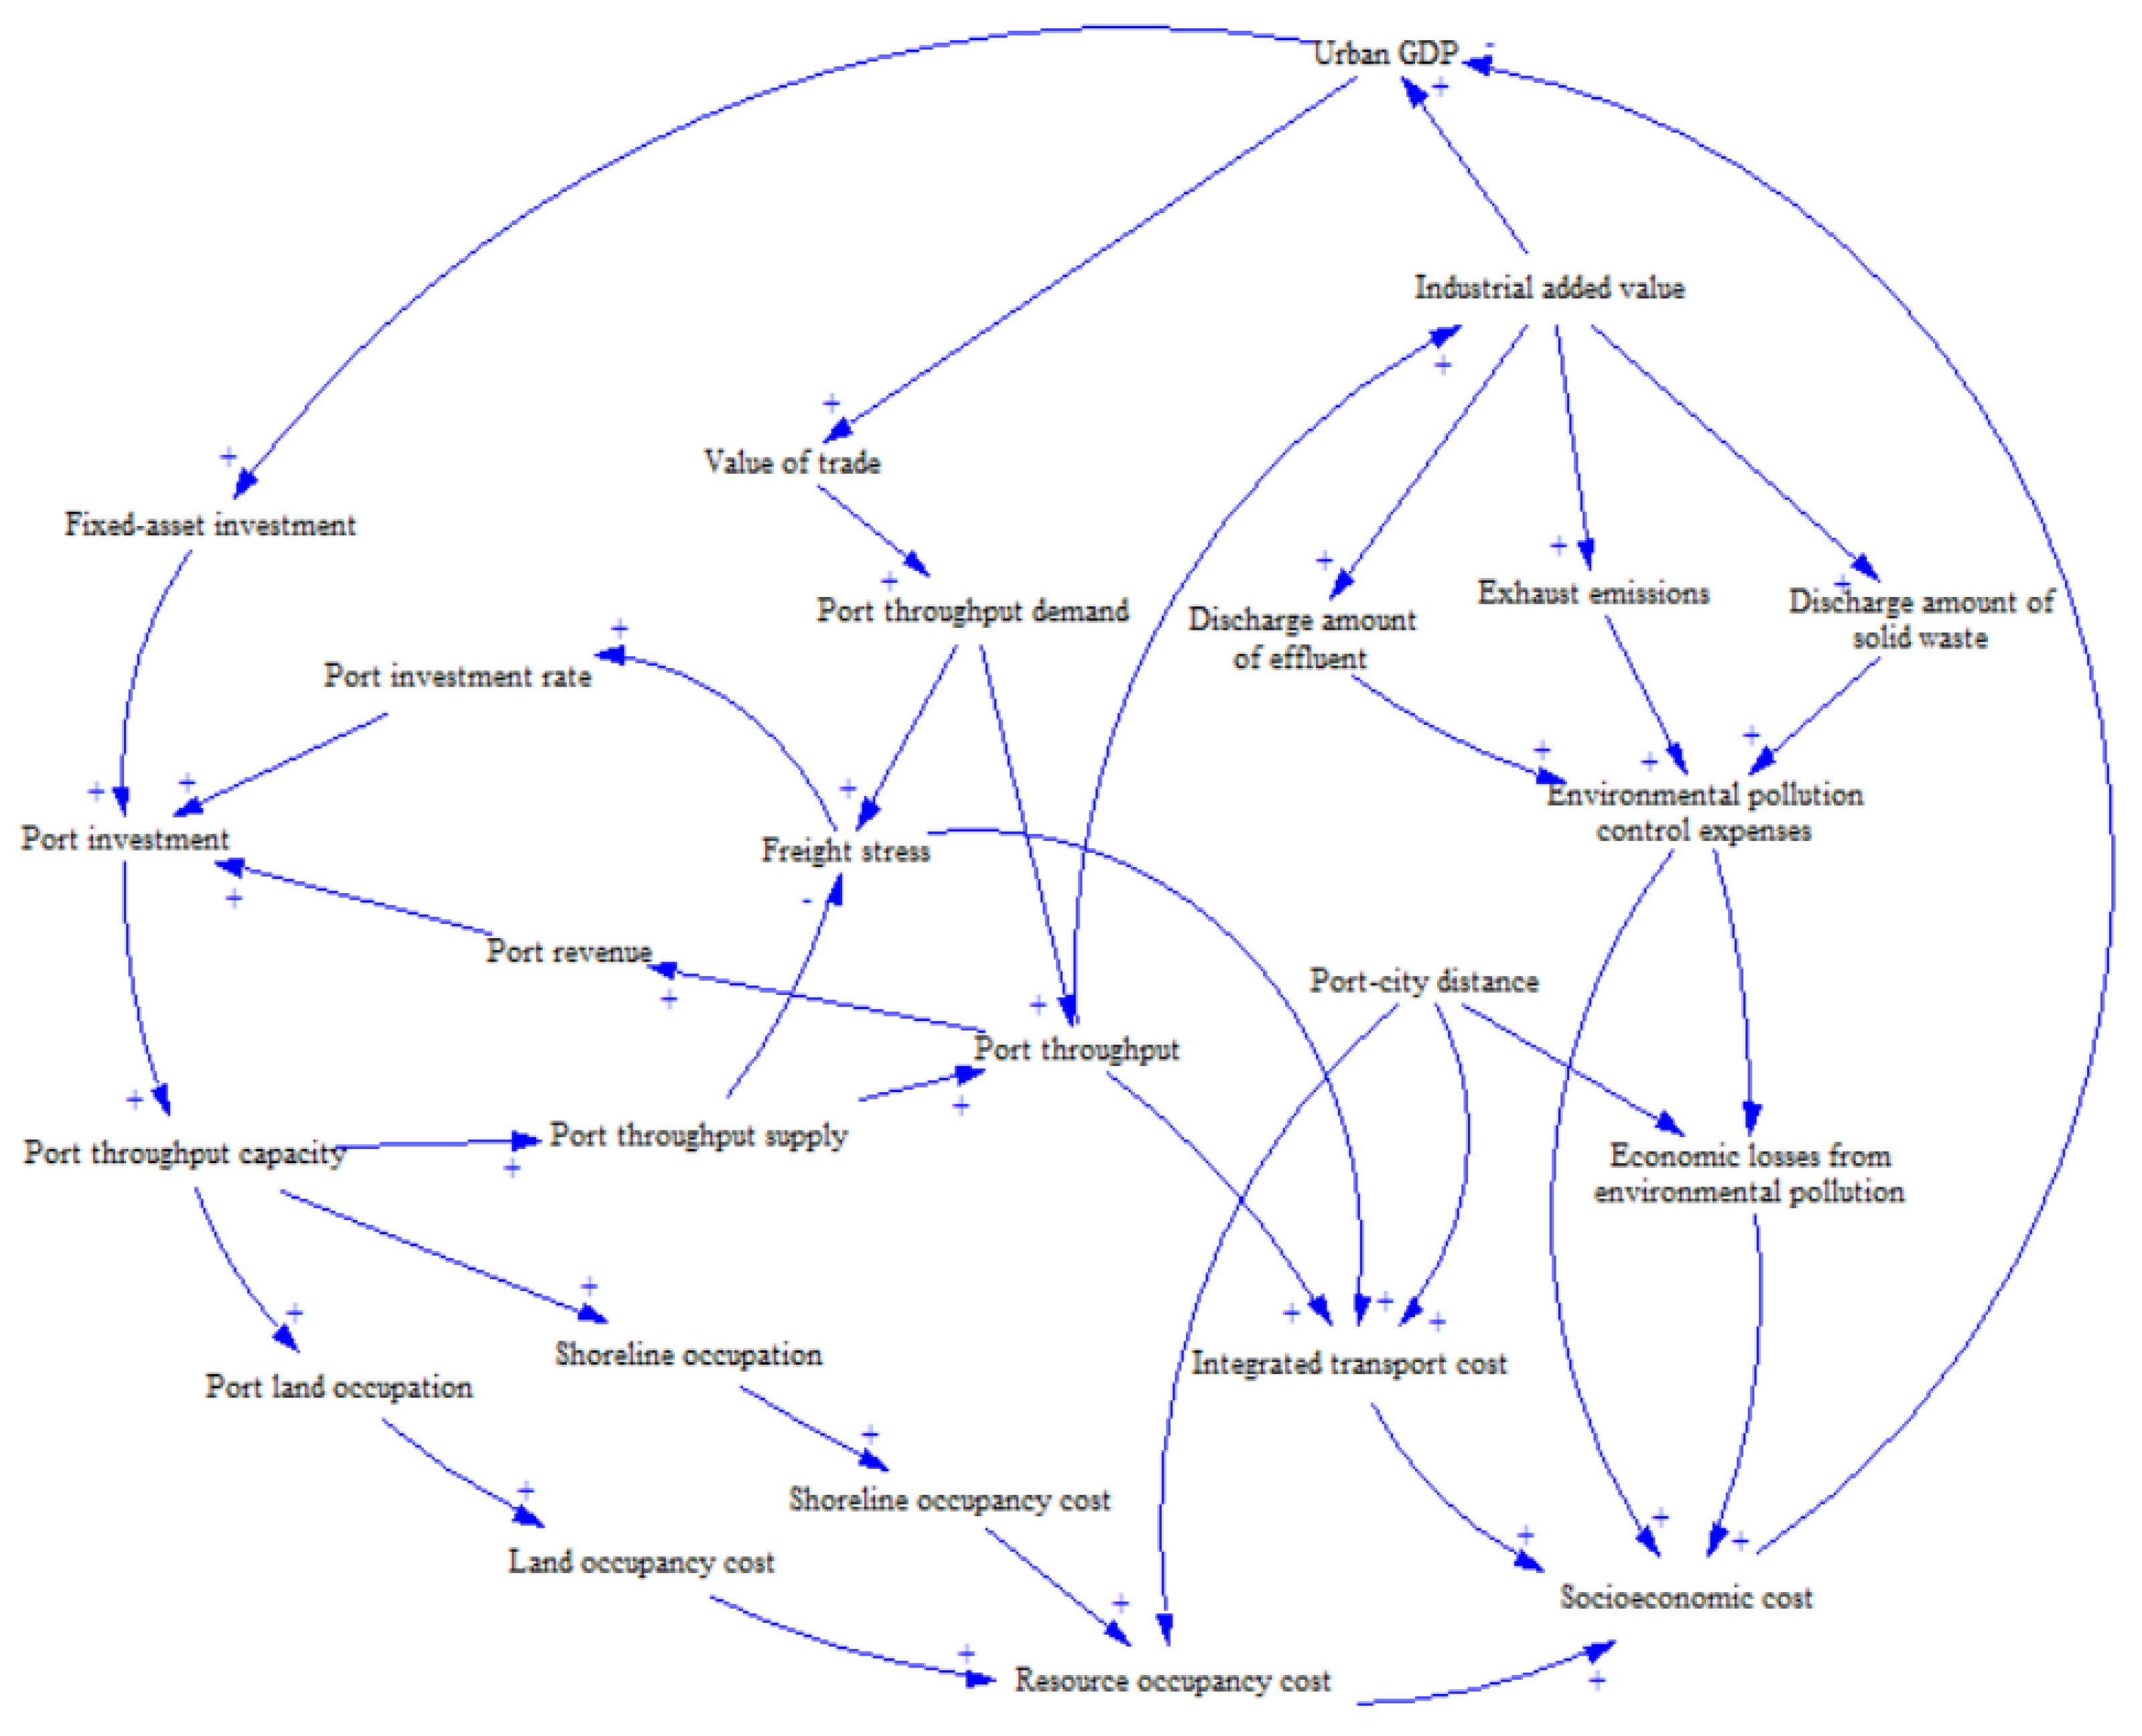
According to the system framework, we can select the indicators that can comprehensively reflect the situations of the three subsystems [23]. In fact, each indicator in the system dynamics model has direct or indirect connections. The indicators form a whole, but we have divided them into three subsystems to analyze the structure and context of the system more clearly, as described below. Finally, according to the correlation of each index in the three subsystems, the Port-cityspatial system causality diagram is obtained as shown in Figure 2.

3.2.1. Urban Subsystem

The urban subsystem reflects the city’s economy and is the primary objective of developing the port. At the same time, as the carrier of port, the development of export-oriented economy and comprehensive transportation system also promoted the development of port. Main indicators include urban GDP, fixed-asset investment, fixed-asset investment of port, and value of trade. Urban GDP reflects the level of economic development in the hinterland; fixed-asset investment includes fixed-asset investment of the port and others to reflect the construction status of infrastructure such as the port; value of trade reflects the potential demand for the port. The urban subsystem includes two feedback loops (Figure 3 and Figure 4). Feedback loop 1 is a negative feedback loop, feedback loop 2 is a positive feedback loop.
On the one hand, the increase of city’s GDP can improve the trade volume and port throughput, so as to accelerate the industrial development, and finally drive the GDP growth. So, the second one is the positive feedback chain. On the other hand, the increase of GDP will lead to the increase of transportation volume, bring more pollution, and thus generate more socioeconomic cost. Therefore, the first one is the negative feedback chain.

3.2.2. Port Subsystem

As an important infrastructure and window of foreign trade, the port plays a great role in promoting the economic development of surrounding areas. Thus, the port subsystem is the key of discussion in this paper. Its relations with the city have always attracted the attention of academia and is a hotspot of research. Main indicators include port throughput, water-borne freight demand, throughput supply of port, freight pressure, port investment, port throughput capacity, port trafficability, and length of available shoreline. The urban subsystem and the port subsystem are linked up by the total production value of traffic and transportation, warehousing as well as post and telecommunications industries, and the total import and export values, to achieve interaction and constraints between the two. The port subsystem consists of three feedback chains (see Figure 5, Figure 6 and Figure 7). Feedback loop 3 and 5 are positive feedback loops, while feedback loop 4 is a negative one.
The increase of port investment can speed up port construction, improve port throughput, promote industrial development, and bring more investment to the port. Therefore, the third one is the positive feedback chain. The increase of shoreline load not only increases port throughput and city GDP, but also brings environmental pollution and increases socioeconomic cost. So, the fourth is the positive feedback chain, and the fifth is the negative feedback chain.

3.2.3. Environmental Resources Subsystem

The environmental resources subsystem plays a restrictive and economy-regulating role in the entire system. Economy and port development cannot go without resources. How to rationally utilize resources and reduce the cost of environmental governance are key to the current economic transformation and development. If no governance measures are taken, the environmental impact is usually negative. Therefore, this subsystem includes a negative feedback chain (feedback loop 6, see Figure 8). This is a negative feedback loop. Indicators of the subsystem include effluent discharge, exhaust emissions, solid waste discharge, environmental governance cost, environmental pollution loss, shoreline occupancy cost, and land occupancy cost. Specifically, effluent and solid waste discharge amounts will drive up the environmental pollution control expenses. Increased port throughput will increase the overall transportation cost of the cargo collection, distribution, and distribution system. Costs of the land and shoreline occupied by port construction will be reflected in the cost of resource occupation. Ultimately, the three factors will collectively constitute the socioeconomic cost in port-city relations.

3.3. Flow Chart Analysis and Equation Establishment of Port-citySpatial Relation System

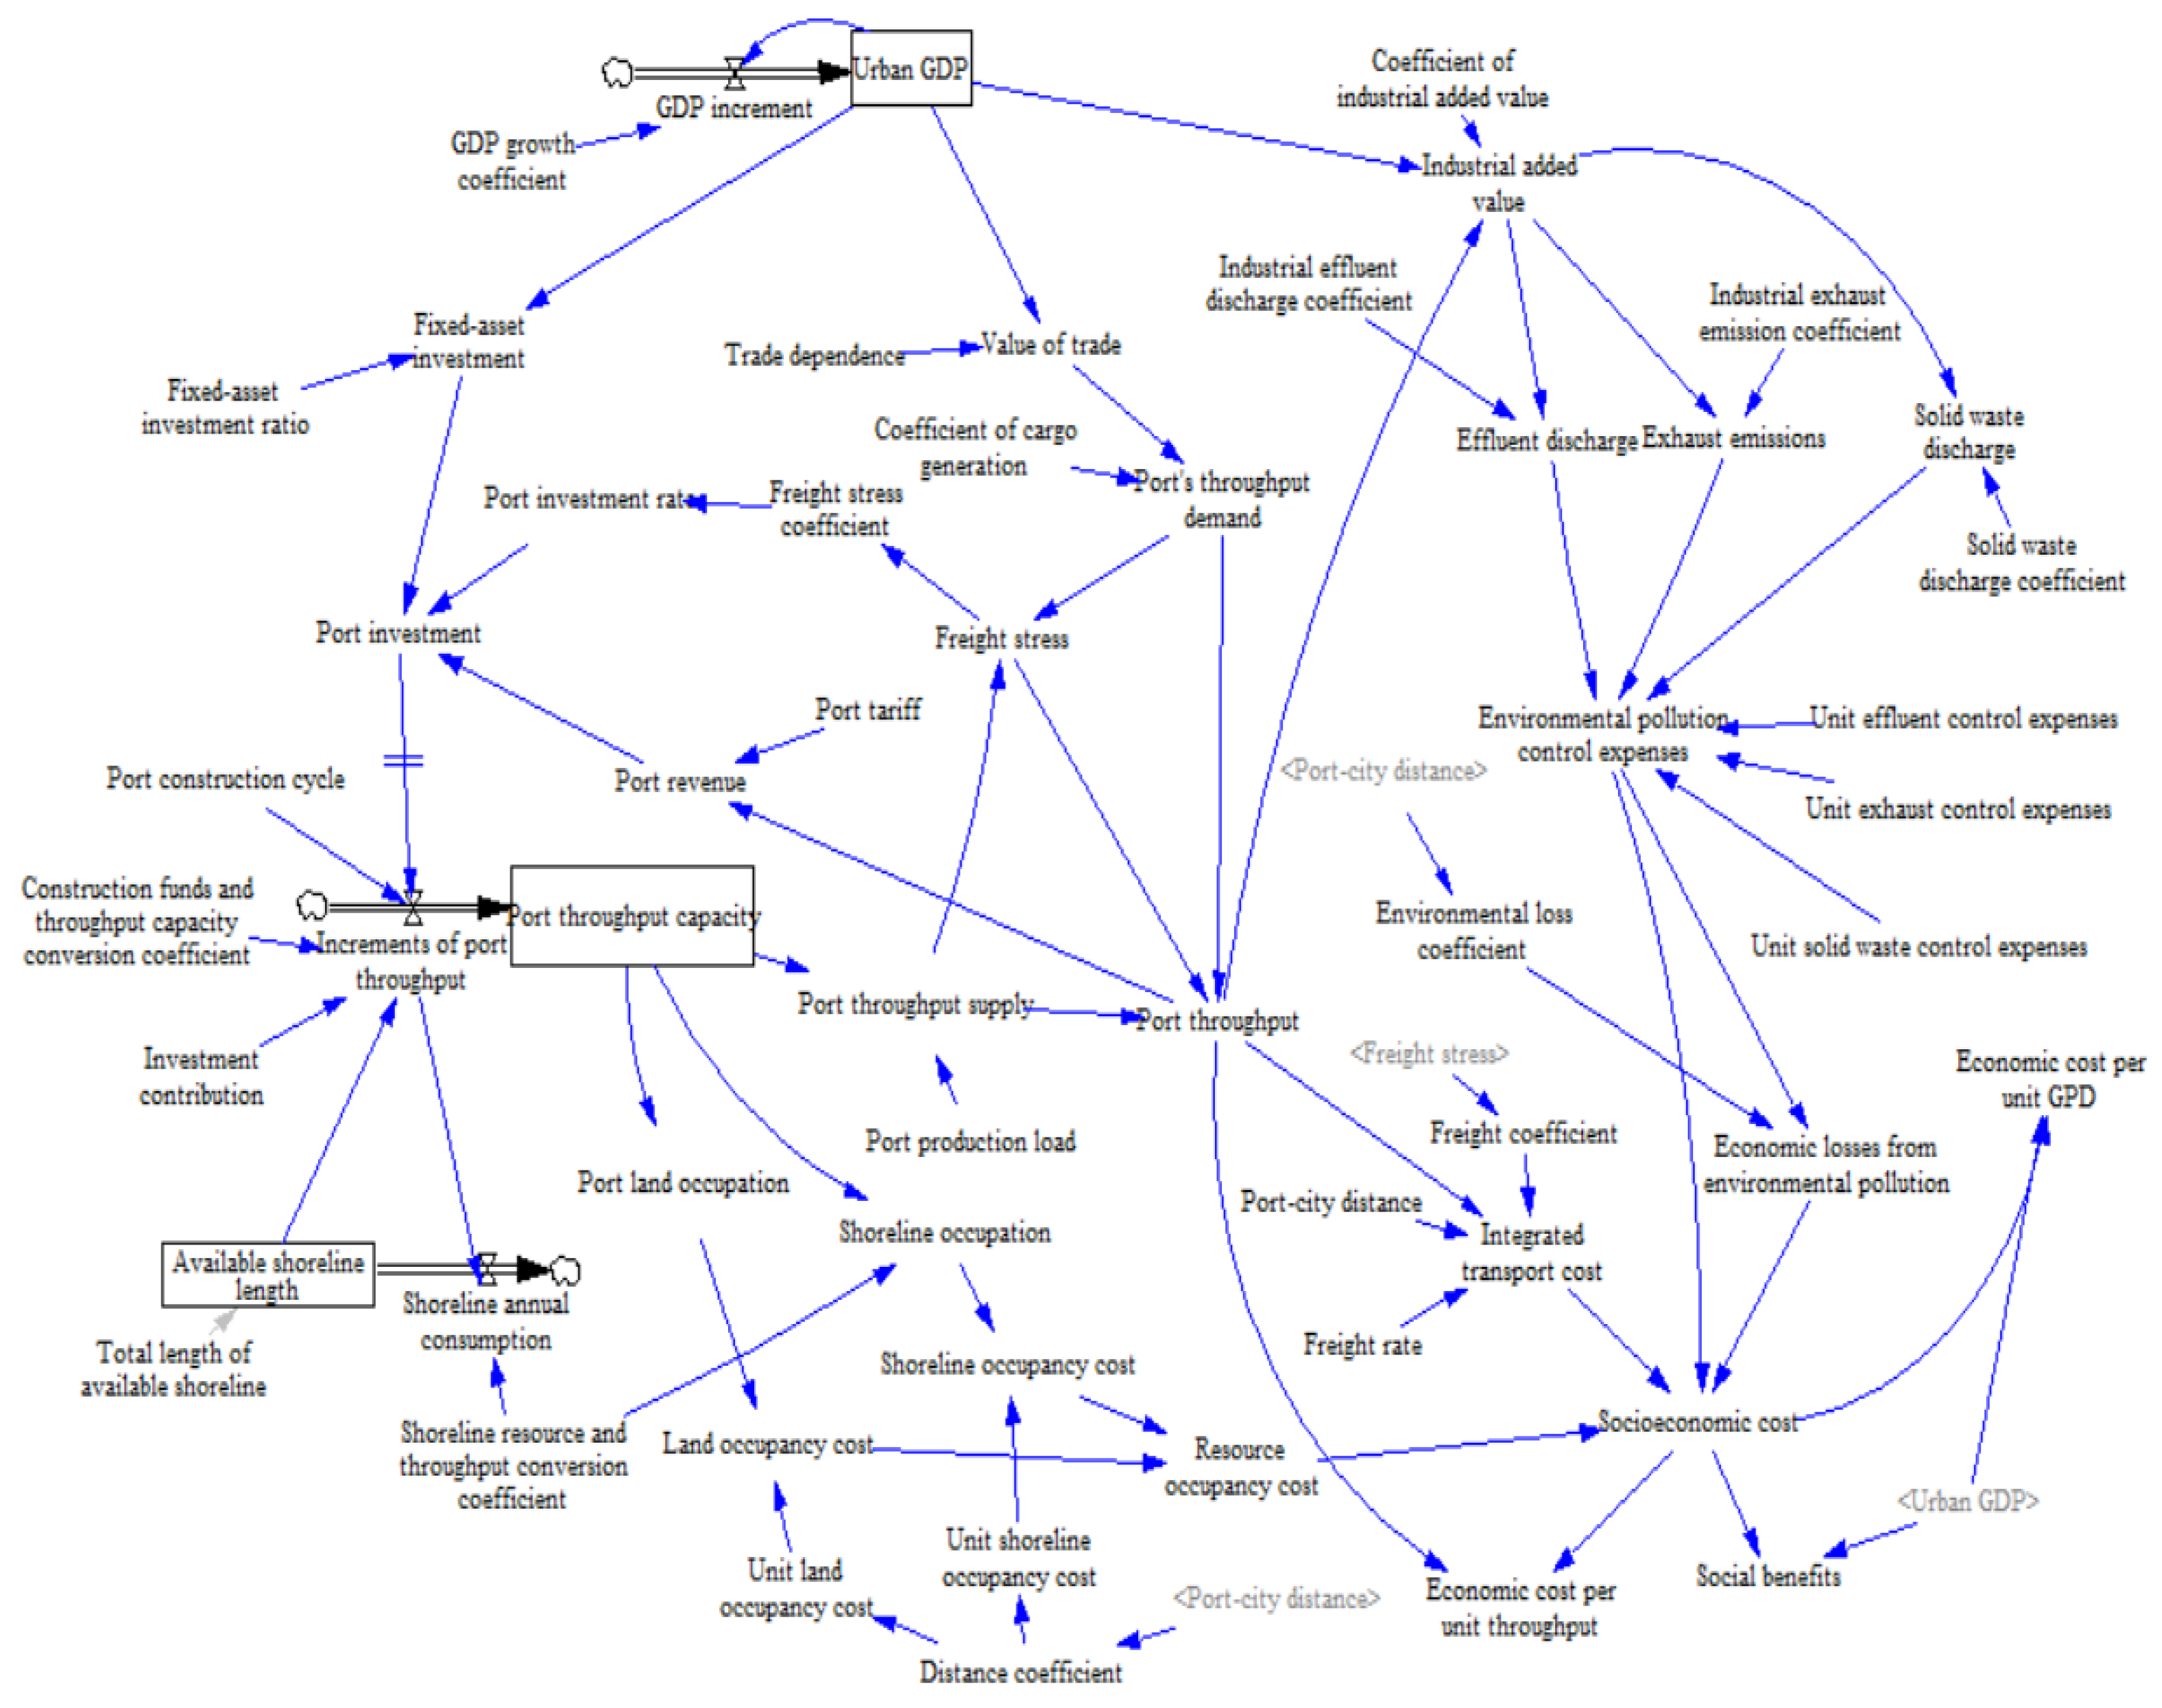
Based on the causality feedback chart and mechanism analysis of various subsystems, a system dynamics model of port-city spatial relations can be constructed (Figure 9). The evolution process of the three port-city spatial subsystems is presented by a dynamic mechanism, an interactive mechanism, and a stress mechanism. The dynamic mechanism is embodied in that, between the urban, port, and ecological subsystems, the rapid economic development and the rapid growth of throughput play a more prominent driving role in the early stage of port-city coordinated development; the interactive mechanism is primarily embodied in the growth and maturing stages of port-city coordination when the port-city system achieves orderly and gradual evolution of the system through functional transformation and coordination and cooperation of various subsystems; the stress mechanism exists in various stages of port-city coordination. Each development stage of the port-city system has a threshold which, once crossed, will lead to a variation of the system. Table 1, Table 2 and Table 3 present the important equations related to socio-economy, ecological environment, and spatial resources in the model. At the end of the paper, the specific meaning of each abbreviation in the table is listed. In the tables, “IF THEN ELSE” means making a conditional judgment on the contents of the following parentheses and selecting the number that matches the condition. Integrate means to integrate the values in brackets.

4. Empirical Case

Container transportation of Xiamen Port is distributed in four port areas of Dongdu, Songyu, Haicang, and Zhaoyin. Dongdu Port Area, as a deep-water port area constructed after the reform and opening up, has made indelible contributions in guiding and serving the industrial layout and development of Huli Industrial Zone and promoting the construction of Xiamen Special Economic Zone. However, with the elevation of socio-economic and urban development levels in Xiamen Island in recent years, the cargo handling operations in Dongdu Port Area have brought many negative effects to the island’s ecological environment and traffic and transportation, aggravating the conflict with the city. In particular, the handling and warehousing of more than 4 million TEU containers on the island each year has greatly impaired the urban environment and occupied valuable land resources on the island; the high number of large container trucks have also imposed great stress on the island’s traffic and increased risks of traffic safety. To address this issue, Xiamen Port urged, in its overall planning, the gradual relocation of the freight function of Dongdu Port Area to Haicang and Xiang’an port areas. The overall layout of Xiamen port is shown in Figure 10.

4.1. Data Sources and Model Validity Check

Main data of this paper came from Xiamen Statistical Yearbooks and Xiamen Port Statistical Yearbooks. The structure and dimension consistency of the model was validated with the help of the Vensim software. A total of 10 years of historical data from 2007 to 2016 were selected, with their historical significance validated. The errors between the system’s indicators and actual values were within the range of 5%. The model sports a sound behavior re-production capability and can truly reflect the actuality of the Xiamen port-city system (see Table 4 and Table 5).

4.2. Simulation Test

4.2.1. Setting of Simulation Parameters

After the system dynamics model is established, simulation test is key to the research. This paper provides quantitative technical support for decision-making of the government and companies by simulating various policy solutions. In fact, when various simulation parameters are taken into account, first the validity of existing data of Xiamen Port is checked. Then, the solutions are compared and selected through parameter hypotheses of several feasible and reasonable solutions. Considering the period length of the data used for history simulation and the uncertainty in the long term to come, the starting year of simulation of the model is set to 2017 and the ending year is set to 2030, with the interval DT = 1 year, and the model step is 0.625.

4.2.2. Scenarios and Solutions

The paper aims to explore port-city coordinated development based on ecological benefits. In fact, port-city development comes from government and company planning. What we need to do is to analyze the consequences from different port-city system planning with the ecological benefits taken into account, to unveil the underlying driving mechanism. Alternatively, we can, without changing the port-city distance, change other factors and compare the extent of impacts from different solutions to see whether there exist differences in the influences of the two cases. The ultimate metrics of the evaluation are the port throughput and GDP at unit socio-economic cost.
Based on this idea, the paper devises the following 15 scenarios. Scenarios 1–5 are based on the current port-city distance. By changing port infrastructure investment (that is, increasing port construction at the original site), use of shoreline resources (that is, improving the port itself and shoreline utilization efficiency), and improvement of environmental governance means (that is, enhancing environmental protection measures and reducing environmental governance cost), we can observe the efficiency change of port-city development. Scenarios 6–10 look at the benefits and impacts from modest increases in the port-city distance (such as relocation of Xiamen Dongdu Port Area to Xiang’an, Houshi, and other port areas). Scenarios 11–15 look at the benefits and impacts from significant changes in the port-city distance (such as relocation of Xiamen Dongdu Port Area to Gulei and other port areas) (see Table 6).

4.2.3. Discussion of Results

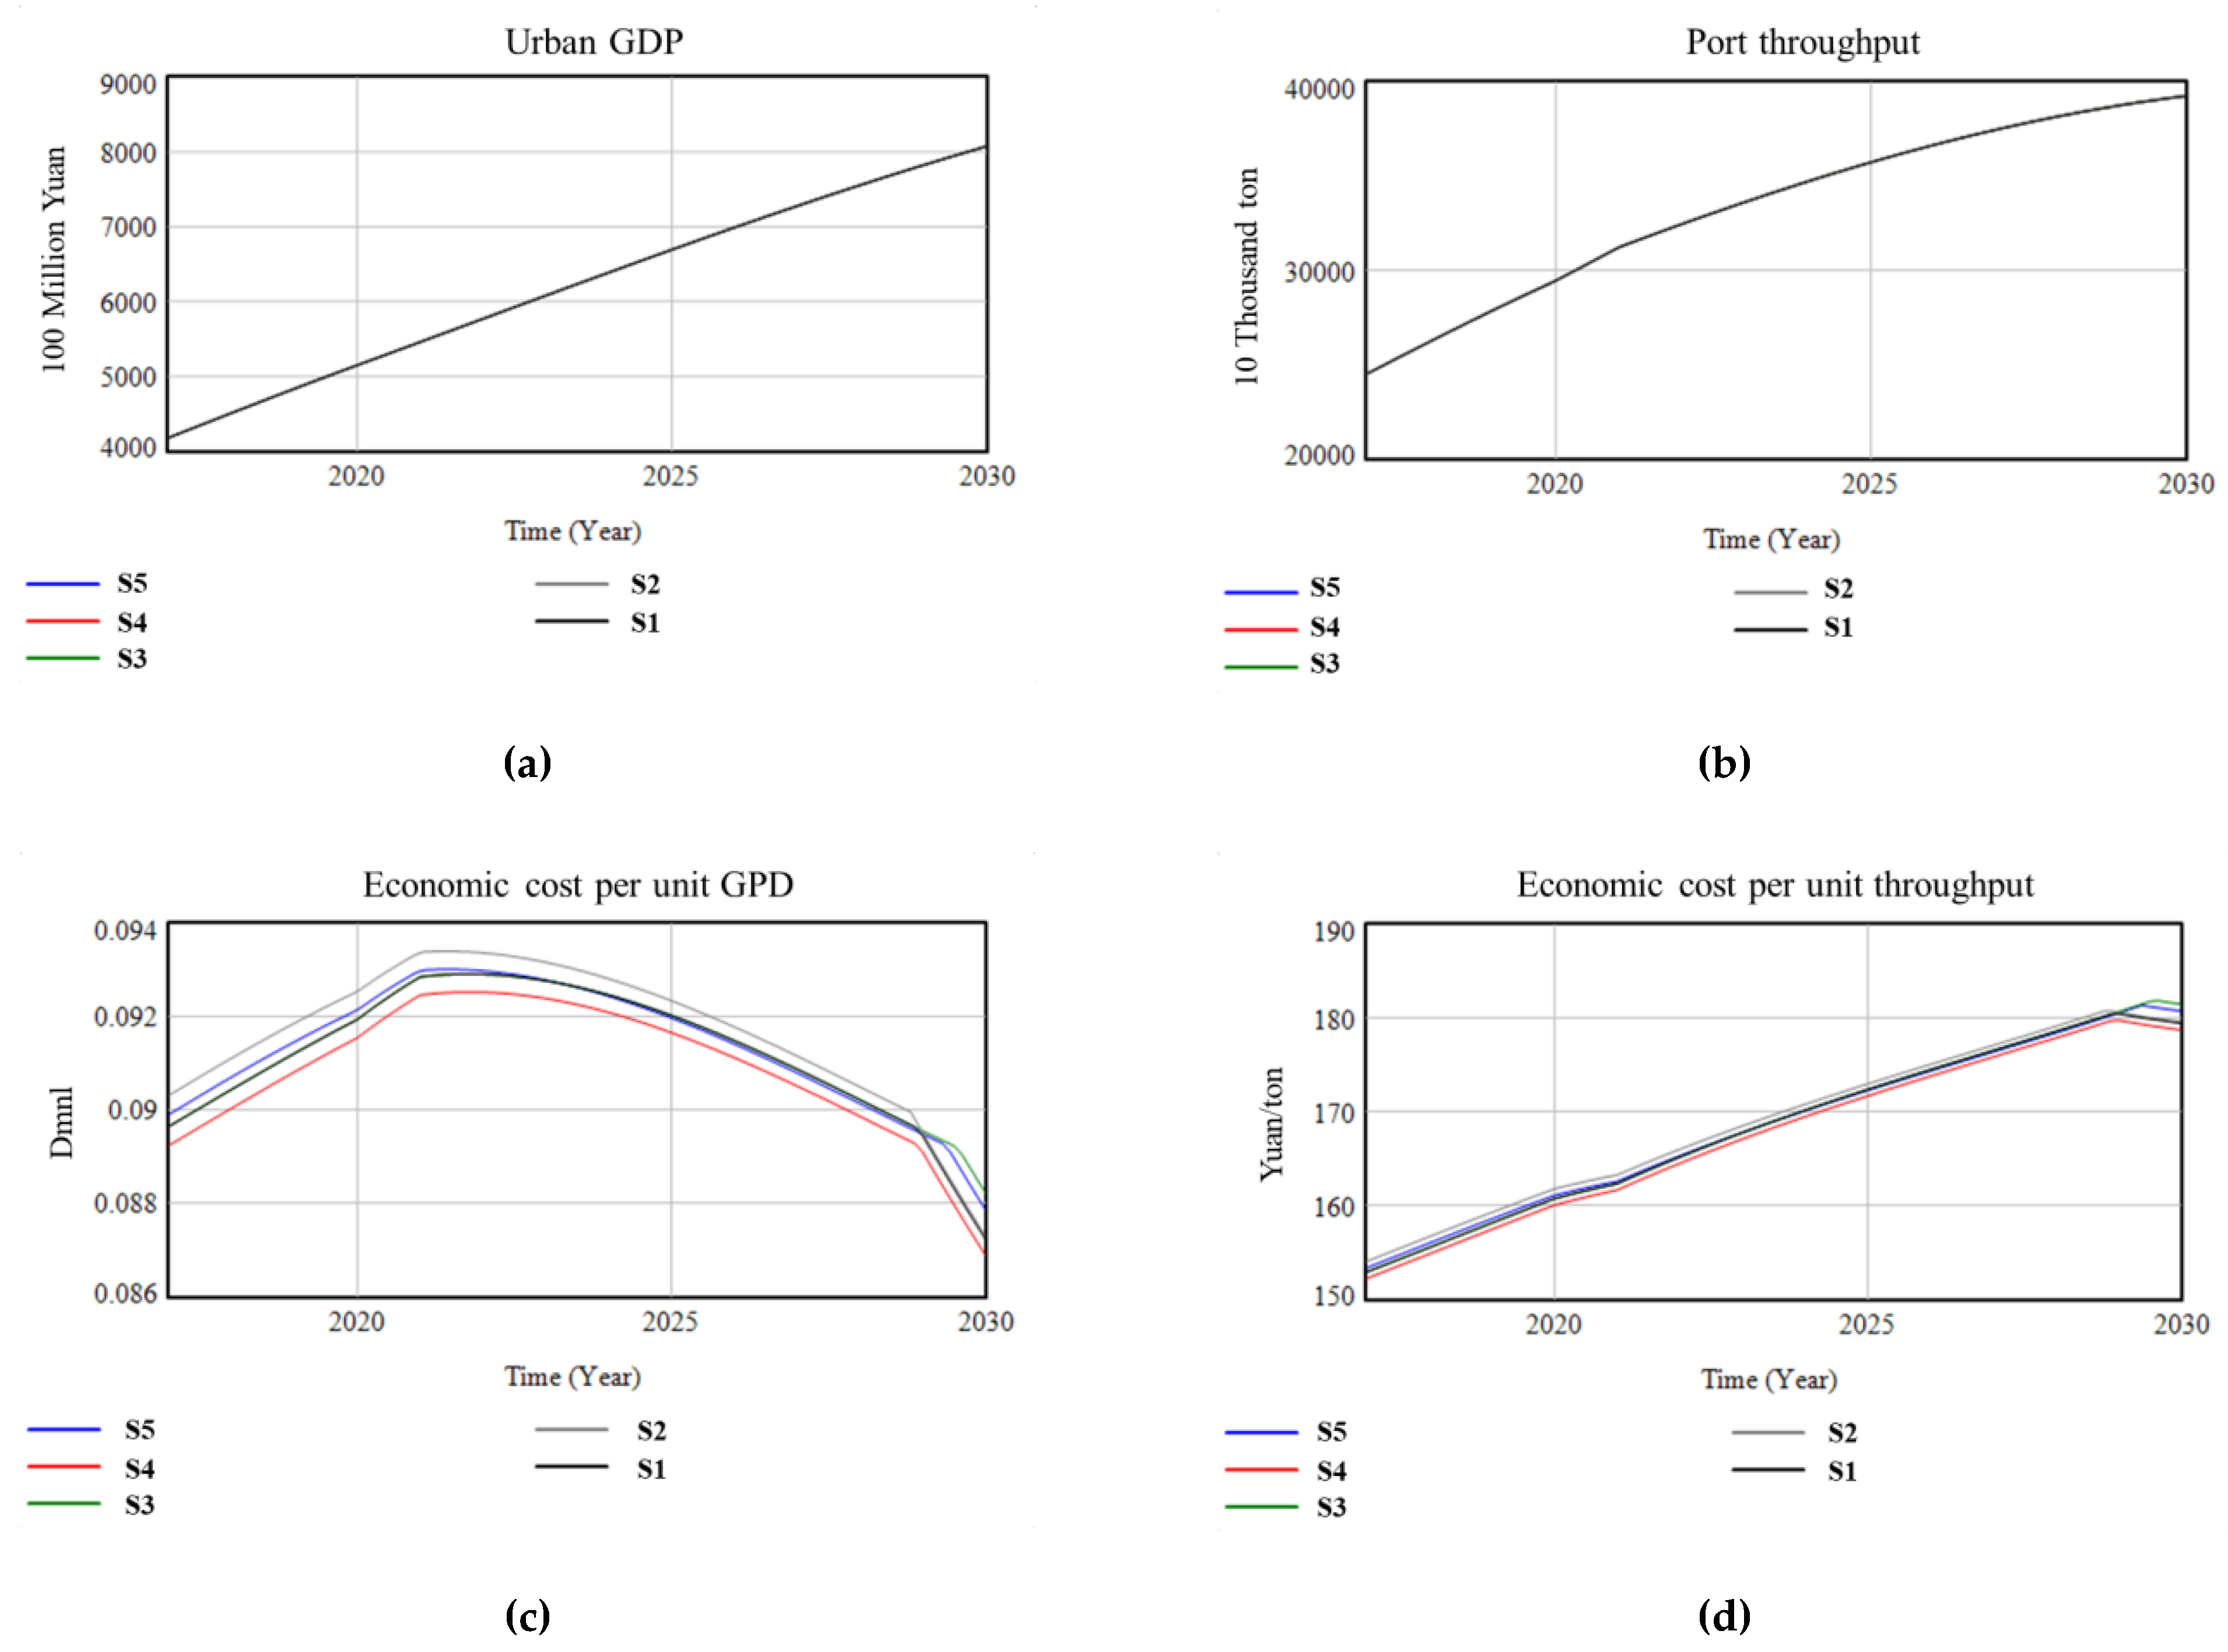
Scenario 1 is a basic scenario that has passed the data validity test. This scenario shows that the urban GDP and throughput increase over time, while the port shoreline resources keep declining. This is a natural development, that is, without changing the existing layout, especially without changing the port-city spatial distance, the city and the port can meet the target planned values of urban GDP and throughput, but their development is based on the premise of resource consumption, which is not conducive to ecological protection. Figure 11 shows the simulation results of scenarios 1–5.
Scenarios 2–5 are based on Scenario 1, with only one or two parameters changed, without changing the port-city distance, to evaluate various major parameters and indicators of port-city development. A comparison with Scenario 1 shows that Scenario 2, which increases port investment and port scale, has a significant impact on GDP and throughput growth, but this also leads to rising unit social cost accordingly. Such growth is at the cost of shoreline and land resources; Scenario 3, instead of building new ports, seeks benefits from technology and management, which can indeed lower the unit social cost, but the room for change and improvement is limited and the hidden safety risks may rise if long-term high benefits are sought after; Scenario 4 neither builds new ports nor mines the potential of ports internally. Instead, it enhances its technical expertise to reduce the environmental pollution control expenses. Overall, this approach can lower the unit social cost while driving up the urban GDP, but like Scenario 3, this approach limits the room for growth; Scenario 5 changes two variables at the same time, yet is similar to the scenarios that have only one variable changed. Overall, the space for growth is limited.
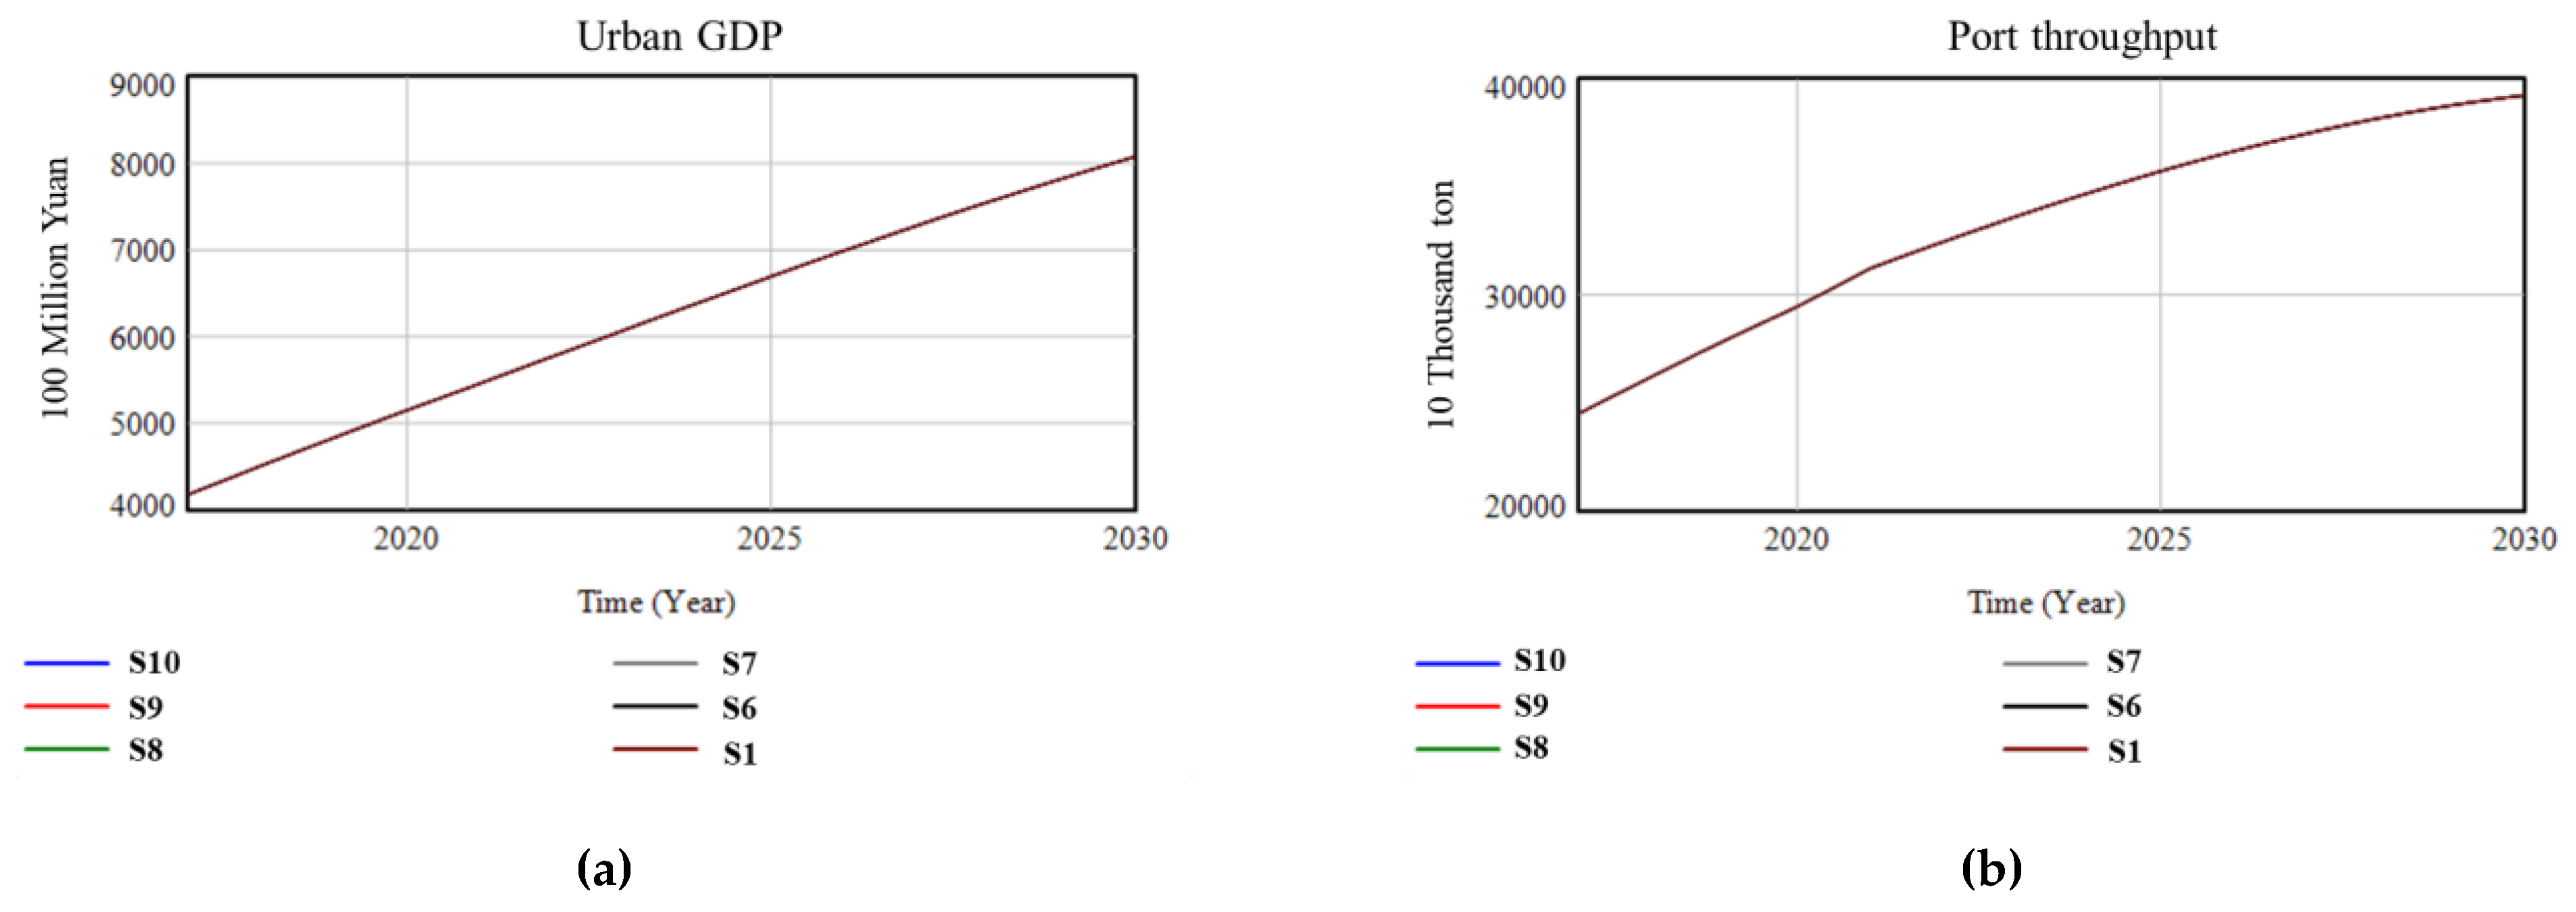
Scenarios 6–10 observe the changes of the above indicators to evaluate the entire system by changing the port-city spatial distance. Figure 12 shows the simulation results of scenarios 6–10. A comparison with the basic Scenario 1 shows that Scenario 6 significantly reduces the socio-economic cost on the premise of meeting GDP, throughput, and other indicators. This marks a huge change compared to Scenarios 2–5 and has broad space for development as well; Scenarios 7–10 are similar to Scenarios 2–5; that is, increasing port investment, improving port management, and environmental protection on the basis of Scenario 6. These scenarios also mark improvement over Scenario 6, but the change is not as significant as that between Scenario 1 and Scenario 6.
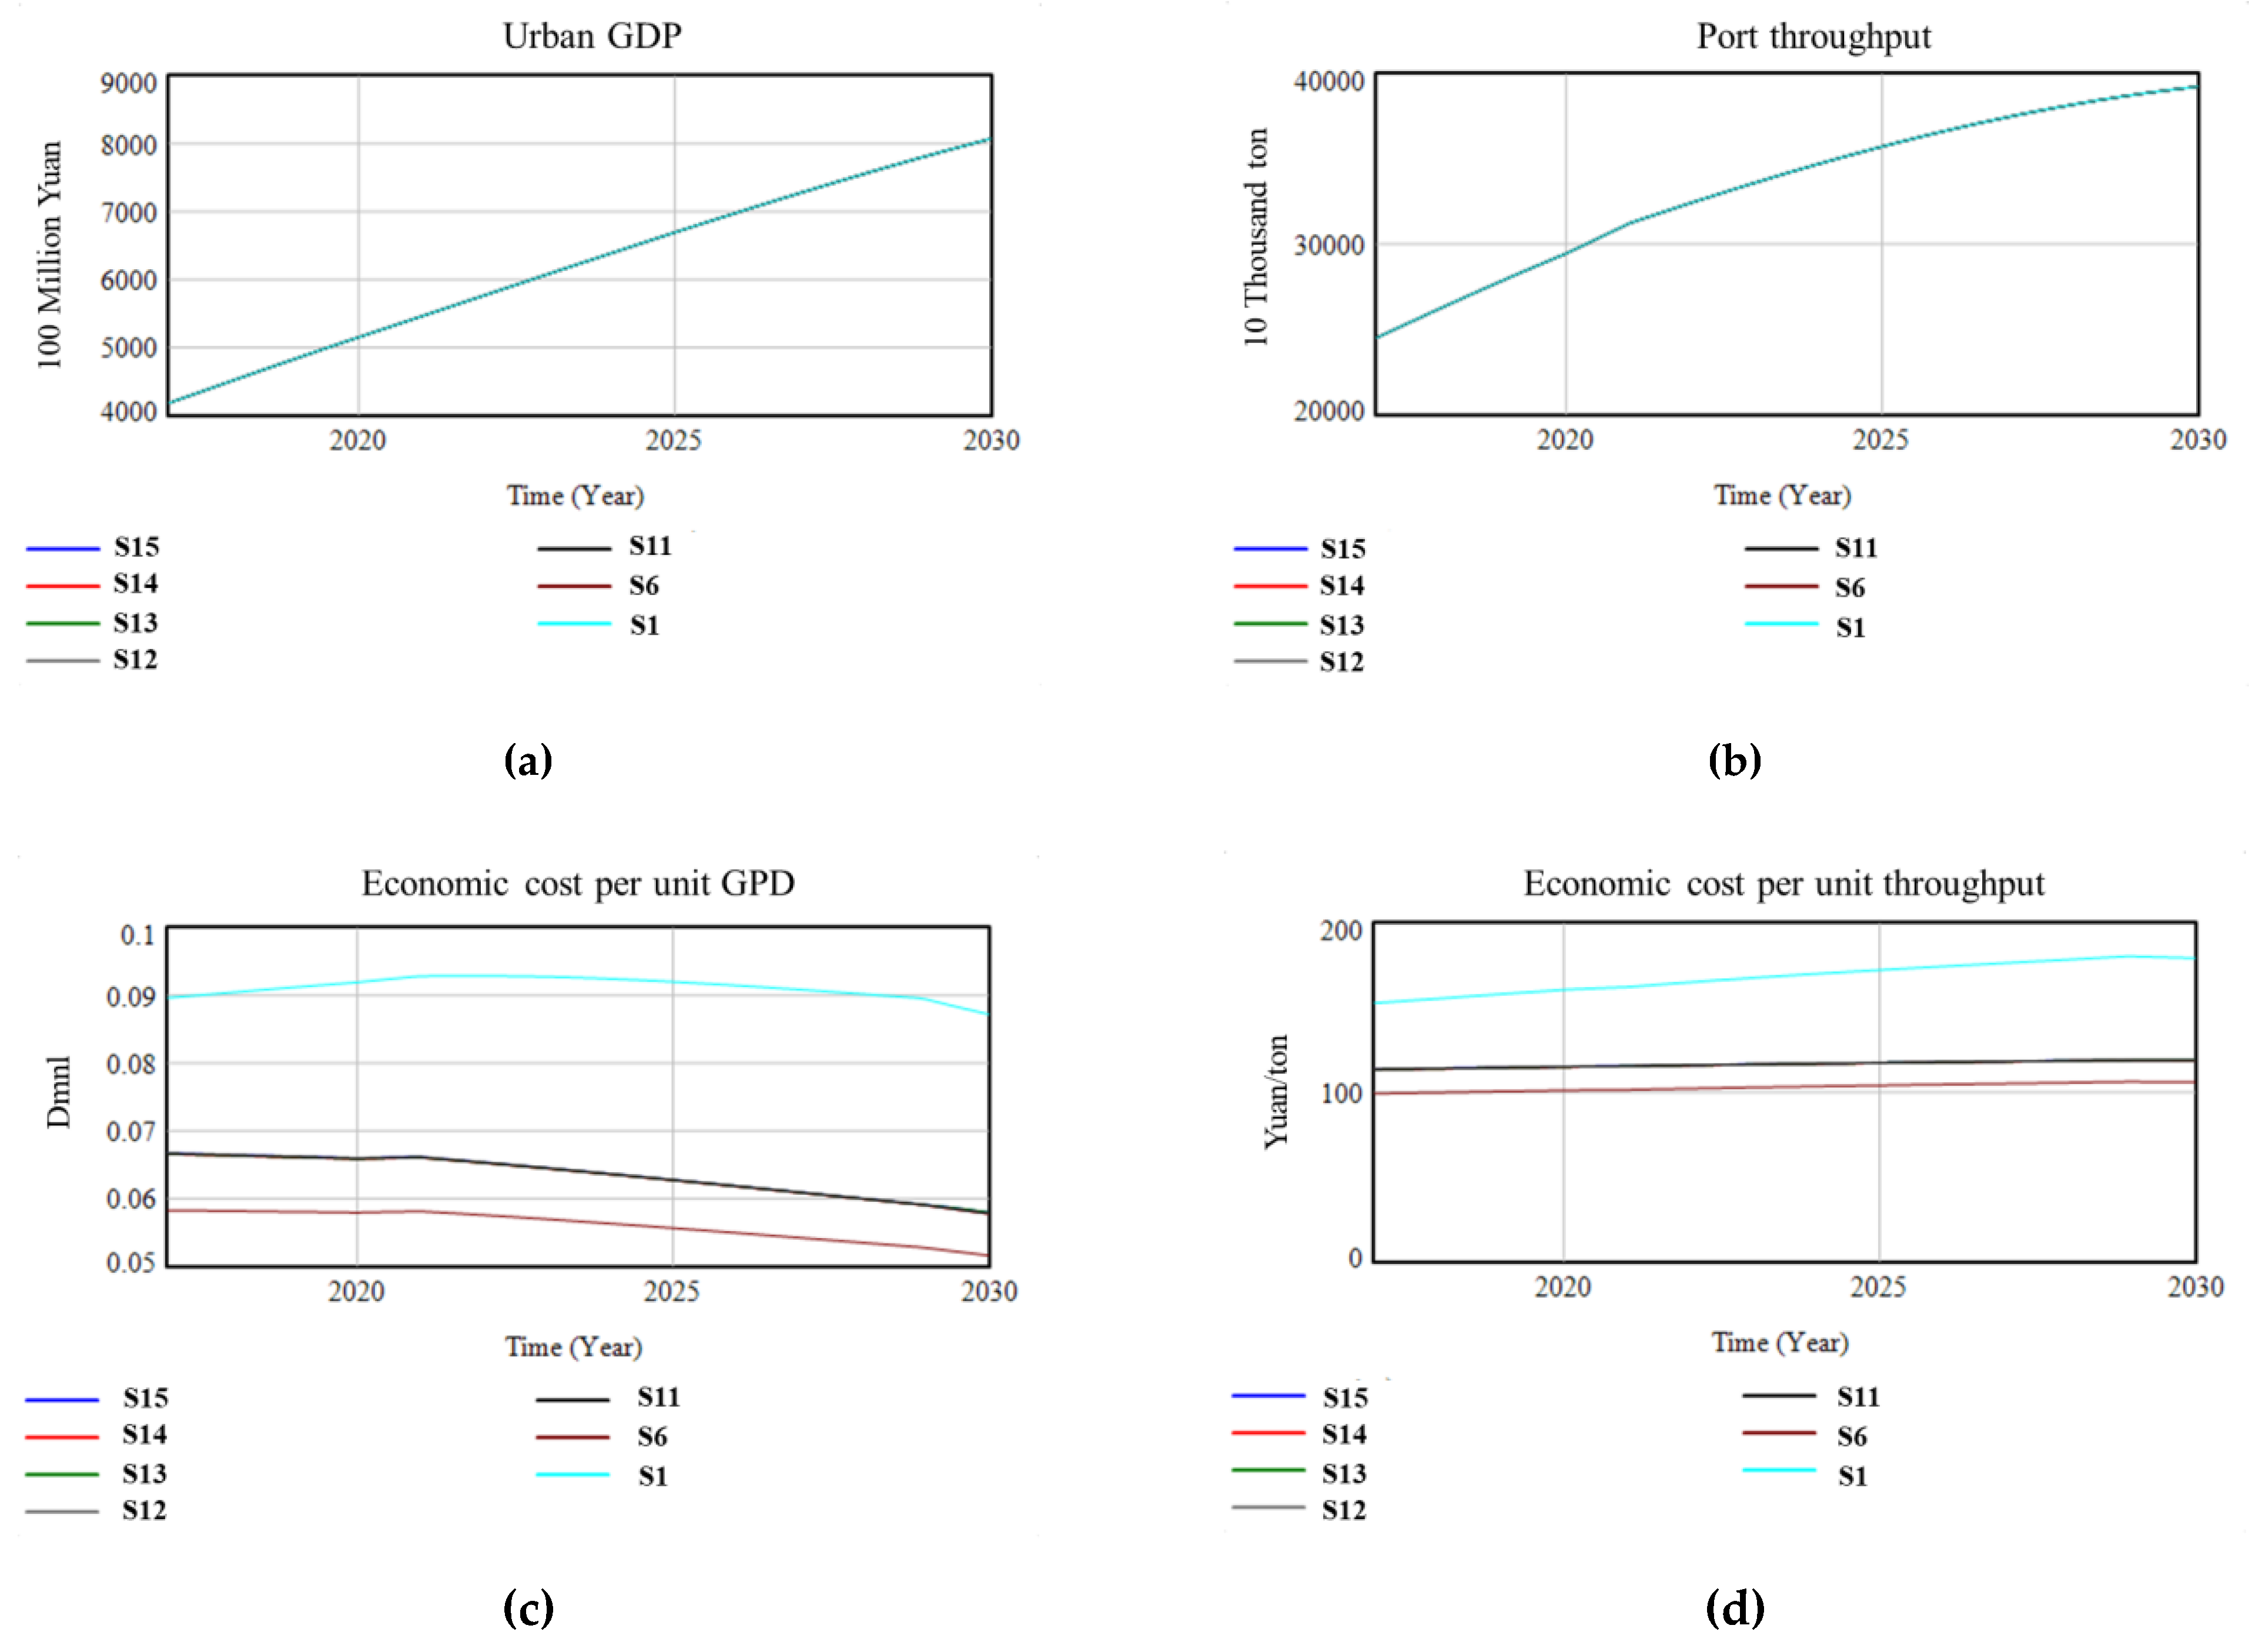
Scenarios 11–15 observe the changes of the above indicators to evaluate the entire system by further increasing the port-cityspatial distance. Figure 13 shows the simulation results of scenarios 11–15. A comparison with the basic Scenario 1 and Scenario 6 shows that Scenario 11 posts significant improvement over Scenario 1, but underperforms Scenario 6; that is, the unit socio-economic cost is reduced. This is because in the scenario, the port is too far away from the city and industries, leading to increased cost of the port for cargo collection, distribution, and transportation, which has reduced the efficiency. Scenarios 12–15 are similar to Scenarios 7–10 and 2–5; that is, increasing port investment, improving port management, and environmental protection on the basis of Scenario 11. These scenarios also post improvement over Scenario 11, but they are not as good as Scenarios 7–10.
To sum up, to boost the ecological benefits of the entire system, Xiamen Port (including the ports in the Xiamen Port region and the Zhangzhou Port region) needs to step out of the island for development and transform from an island-type port to a bay-type one. From the simulation results of the model, only after the port-city spatial distance becomes larger can the efficiency of GDP and port throughput growth be improved; and can the port-city development be coordinated, greener, and more efficient. Therefore, the government should actively plan and construct new port areas and accelerate the relocation and transformation of Dongdu Port Area. However, it is worth noting that the port-city spatial distance cannot be increased indefinitely and should be put within a reasonable range. A layout that scatters over a wide area can increase the cost of cargo collection, distribution and transportation and thereby reduce the system efficiency [35]. Therefore, Xiang’an Port Area and Houshi Port Area among others are suitable for development. Comparatively speaking, Xiang’an Port Area, which is closer to Quanzhou, the hinterland of cargo sources, is an optimal option on the premise of good political relations with Taiwan.

5. Conclusions and Prospects

This paper utilizes system dynamics methods to introduce ecological indicators such as land resources and environmental protection to the traditional port-city coordination system model and constructs a new SD model to explore port-city coordinated development based on ecological benefits. The paper makes up for the lack of attention to ecological benefits in port-city coupling systems in existing studies. Through different planning of the port-city system and analysis of the simulation results under different circumstances, the paper tries to find the driving mechanism of port-city spatial changes. Alternatively, without changing the port-city distance, the paper changes other factors to see whether there exist differences in the influences of the two cases. Finally, the planning performance is evaluated based on the port throughput and GDP at unit socio-economic cost and we get the following conclusions. Spatial distance is vital for coordinated port-city development. When the port-city spatial distance moderately increases, the value of the land resources occupied by the port moves down, the impact on the city’s environment becomes smaller, and the growth rates of GDP and port throughput increase accordingly. The system also becomes more "ecotypic". However, the port-city spatial distance cannot be too large, as too large a distance will drive up the cost of cargo collection, distribution, and transportation, thereby reducing the efficiency of the port and industry. To address this issue, the paper proposes suggestions to promote coordinated development of Xiamen Port and Xiamen city. First, Xiamen Port (including the ports of the Xiamen Port region and the Zhangzhou Port region) needs to step out of the island and transform from an island-type port to a bay-type one, with the port-city spatial distance put under rational control. Second, under the premise of good political relations with Taiwan, Xiang’an Port Area and Houshi Port Area are more suitable for development, and Xiang’an Port Area, in comparison, is a better option because of being closer to Quanzhou, the hinterland of cargo sources. On the other hand, the port areas that are farther away, such as Gulei, generate lower ecological benefits than Xiang’an or Houshi does because of increased cost of cargo collection, distribution, and transportation. They are more suitable for developing ports that are less correlated with the hinterland, such as the ports supporting rear petrochemical bases.
This paper combines the port-city coupling system and the system dynamics theory to study the port-city spatial relation evolution mechanism under ecological constraints, which makes up for the gap in the existing port-city coupling system research and provides a theoretical direction for further study on the port-city coupling system theories. However, the model in this paper operates under normal development of the society, without considering the impacts of factors such as the international trade environment and situation and natural environment changes on the development of the port-city coupling system. It is a future trend to introduce uncertain factors into the port-city coupling system research.

Author Contributions

L.Y. and P.X. conceived the research idea, established the mathematical models, and co-wrote the paper. J.S. carried out the result analysis and revised the paper. J.C. and H.Z. designed and supervised this study. All authors have read and agreed to the published version of the manuscript.

Funding

The authors gratefully acknowledge support from the National Natural Science Foundation of China (Grant No. 51879156 and 51409157), Shanghai Pujiang Program(17PJC053), and High-level talent project funding plan of transportation industry supported by the Ministry of Transport of the People’s Republic of China (Grant No. 2019-012). However, the authors are solely responsible for all the views and analyses in this paper.

Conflicts of Interest

The authors declare no conflict of interest.

Abbreviations

GDP: gross domestic productTP: freight pressure
GGC: GDP growth coefficientPLO: port land occupation
SB: social benefitsSO: shoreline occupation
SEC: social economy costSOC: shoreline occupancy cost
FAI: fixed-asset investmentUSOC: unit shoreline occupancy cost
FAIR: fixed-asset investment ratioOLC: land occupancy cost
PI: port investmentULOC: unit land occupancy cost
PIR: port investment rateROC: resource occupancy cost
PR: port revenueITC: integrated transport cost
CPC: cargo pressure coefficientATD: average transport distance
IPT: increments of port throughputFR: freight rate
ASL: available shoreline lengthIAV: industrial added value
CF: construction fundsCIAV: coefficient of industrial added value
TCCC: throughput capacity conversion coefficientPCC: port contribution coefficient
IC: investment contributionED: effluent discharge
PCC: port construction cycleCED: coefficient of effluent discharge
PTS: port throughput supplyEE: exhaust emission
PPL: port production loadCEE: coefficient of exhaust emission
SAC: shoreline annual consumptionSWD: solid waste discharge
CS: coastal resourcesEPCE: environmental pollution control expenses
TLAS: total length of available shoreline UECE: unit exhaust control expenses
VT: value of tradeUSWCE: unit solid waste control expenses
TD: trade dependenceUECE: unit effluent control expenses
PTD: port throughput demandELEP: economic losses from environmental pollution
CGC: coefficient of cargo generationELC: environmental loss coefficient

References

  1. Chen, J.; Huang, T.; Xie, X.; Lee, P.T.W.; Hua, C. Constructing Governance Framework of a Green and Smart Port. J. Mar. Sci. Eng. 2019, 7, 83. [Google Scholar] [CrossRef] [Green Version]
  2. Chen, J.; Xue, K.; Ye, J.; Huang, T.; Tian, Y.; Hua, C.; Zhu, Y. Simplified neutrosophic exponential similarity measures for evaluation of smart port development. Symmetry 2019, 11, 485. [Google Scholar] [CrossRef] [Green Version]
  3. Chen, J.; Zheng, T.; Garg, A.; Xu, L.; Li, S.; Fei, Y. Alternative maritime power application as a green port strategy: Barriers in China. J. Clean. Prod. 2019, 213, 825–837. [Google Scholar] [CrossRef]
  4. Debrie, J.; Raimbault, N. The port-cityrelationships in two European inland ports: A geographical perspective on urban governance. Cities 2016, 50, 180–187. [Google Scholar] [CrossRef] [Green Version]
  5. Hou, L.J.; Geerlings, H. Dynamics in sustainable port and hinterland operations: A conceptual framework and simulation of sustainability measures and their effectiveness, based on an application to the Port of Shanghai. J. Clean. Prod. 2016, 135, 449–456. [Google Scholar] [CrossRef]
  6. Hua, C.; Chen, J.; Wan, Z.; Xu, L.; Bai, Y.; Zheng, T.; Fei, Y. Evaluation and governance of green development practice of port: A sea port case of China. J. Clean. Prod. 2019, 249. [Google Scholar] [CrossRef]
  7. Wang, L.H.; Hong, Y. Spatial structure of container port systems across the Taiwan straits under the direct shipping policy: A complex network system approach. Acta Geogr. Sin. 2016, 71, 605–620. [Google Scholar]
  8. Boulos, J. Sustainable Development of Coastal Cities-Proposal of a Modelling Framework to Achieve Sustainable City-Port Connectivity. Procedia Soc. Behav. Sci. 2016, 216, 974–985. [Google Scholar] [CrossRef] [Green Version]
  9. Yang, W.Y.; Zhang, G.W. Transportation Geography; Commercial Press: Beijing, China, 1986; pp. 1–305. [Google Scholar]
  10. Wu, C.J.; Gao, X.Z. A model of port-citydevelopment. Geogr. Res. 1989, 4, 9–15. [Google Scholar]
  11. Notteboom, T.; Rodrigue, J. Port regionalization: Towards a new phase in port development. Marit. Policy Manag. 2005, 32, 297–313. [Google Scholar] [CrossRef]
  12. Liang, S.B.; Cao, Y.H.; Wu, W. Evaluation of the comprehensive effect of the interactive development between port backup area and city—The example of Shanghai WaiGaoQiao. Res. Environ. Yangtze Basin 2011, 20, 1411–1417. [Google Scholar]
  13. Guo, J.K.; Du, X.F.; Han, Z.L. Dynamic analysis of influencing factors on the growth of coastal ports in Liaoning province. Geogr. Geo Inf. Sci. 2015, 31, 87–100. [Google Scholar]
  14. Rizzo, A. Rapid urban development and national master planning in Arab Gulf countries. Qatar as a case study. Cities 2014, 39, 50–57. [Google Scholar] [CrossRef]
  15. Ducruet, C.; Wang, J.; Olivier, D.; Notteboom, T.; Slack, B. A metageography of port-cityrelationships Ports, Cities, and Global Supply Chains. Eng. Ashgate Publ. Ltd. 2007, 11, 157–172. [Google Scholar]
  16. Dutt, F.J.; Surinder, C.A. (Eds.) The Asian City: Processes of Development, Characteristics and Planning; Kluwer Academic Publishers: Dordecht, The Netherlands, 1994; pp. 52–61. [Google Scholar]
  17. Akhavan, M. Development dynamics of port–cities interface in the Arab Middle Eastern world: The case of Dubai global hub port–city. Cities 2017, 60, 343–352. [Google Scholar] [CrossRef]
  18. Ye, S.L.; Cao, Y.H.; Wang, J.W. Spatio-temporal evolution characteristics and mechanism of the port logistics system along the Yangtze River. Geogr. Res. 2018, 37, 925–936. [Google Scholar]
  19. Shen, Y.F.; Liu, S.H.; Zhang, J. The correspondence among industrial cluster, city group and port group on the Yangtze River area. Econ. Geogr. 2010, 30, 778–783. [Google Scholar]
  20. Tang, Y.T.; Chan, F.K.S.; Griffiths, J. City profile: Ningbo. Cities 2015, 42, 97–108. [Google Scholar] [CrossRef]
  21. Guo, J.; Wang, S.; Wang, D.; Liu, T. Spatial structural pattern and vulnerability of China–Japan–Korea shipping network. Chin. Geogr. Sci. 2017, 27, 697–708. [Google Scholar] [CrossRef]
  22. Monios, J.; Bergqvist, R.; Woxenius, J. Port-centric cities: The role of freight distribution in defining the port-city relationship. J. Transp. Geogr. 2018, 66, 53–64. [Google Scholar] [CrossRef]
  23. Schipper, C.A.; Vreugdenhil, H.; Jong, D. A sustainability assessment of ports and port-city plans: Comparing ambitions with achievements. Transp. Res. Part D 2017, 57, 84–111. [Google Scholar] [CrossRef]
  24. Gao, Z.Q.; Chang, D.H.; Ye, W.H. On evolvement orientations of port cities: Sustainable development strategies. China Popul. Res. Environ. 2010, 20, 102–109. [Google Scholar]
  25. Vallega, A. Fonctions portuaires et polarizations littorals dans lanouvelle régionalisation de la Méditerranée, quelques réflexions. French-Japanese Geogr. Colloq. 1979, 2, 44–48. [Google Scholar]
  26. Wang, C.; Ducruet, C. New port development and global city making: Emergence of the Shanghai–Yangshan multilayered gateway hub. J. Transp. Geogr. 2012, 25, 58–69. [Google Scholar] [CrossRef] [Green Version]
  27. European Port-Cityinterface and Its Asian Application. Available online: www.researchgate.net/publication/41540248 (accessed on 2 April 2020).
  28. Chen, H.; Luan, W.X.; Wang, Y.W. Quantitative study on relationship between port function and urban function in China. Geogr. Res. 2009, 28, 475–483. [Google Scholar]
  29. Jiang, L.L.; Wang, S.J.; Liu, Z.H. Evaluation and comparison of size relationship between port and port-city: Taking the port-cities of Liaoning Province as example. Sci. Geogr. Sin. 2011, 31, 1468–1473. [Google Scholar]
  30. Wu, Q. The revolution of port-cityrelationship in modern China (1961–1936): The analysis to the relation concentration index as the example. J. Chin. Hist. Geogr. 2012, 27, 70–81. [Google Scholar]
  31. Liang, S.B.; Cao, Y.H.; Wu, W. The effect analysis of Nanjing city–port interactive development under the background of globalization. Geogr. Res. 2007, 3, 599–608. [Google Scholar]
  32. Yang, S.; Pan, J. Dynamic simulation and regulation of port-citycoupling development: Taking Lianyungang as a case. Geogr. Res. 2011, 30, 1021–1031. [Google Scholar]
  33. Guo, J.K.; Han, Z.L. The port-cityspatial system evolution theory and empirical study of Chinese seaport city. Sci. Geogr. Sin. 2013, 33, 1285–1292. [Google Scholar]
  34. Berjghe, K.V.D.; Jacobs, W.; Boelens, L. The relational geometry of the port-city interface: Case studies of Amsterdam, the Netherlands, and Ghent, Belgium. J. Transp. Geogr. 2018, 70, 55–63. [Google Scholar] [CrossRef]
  35. Zhao, Q.Y.; Xu, H.; Wall, R.S.; Stavropoulos, S. Building a bridge between port and city: Improving the urban competitiveness of port cities. J. Transp. Geogr. 2017, 59, 120–133. [Google Scholar] [CrossRef]
Figure 1. System Framework.
Sustainability 12 02857 g001
Figure 2. Port-cityspatial system causality diagram from ecological perspective.
Sustainability 12 02857 g002
Figure 3. Feedback loop 1 in the urban subsystem
Sustainability 12 02857 g003
Figure 4. Feedback loop 2 in the urban subsystem.
Sustainability 12 02857 g004
Figure 5. Feedback loop 3 in the port subsystem.
Sustainability 12 02857 g005
Figure 6. Feedback loop 4 in the port subsystem.
Sustainability 12 02857 g006
Figure 7. Feedback loop 5 in the port subsystem.
Sustainability 12 02857 g007
Figure 8. Feedback loop 6 in the environmental resources subsystem.
Sustainability 12 02857 g008
Figure 9. System dynamics flow chart of port-city spatial relations from ecological perspective.
Sustainability 12 02857 g009
Figure 10. The overall layout of Xiamen port.
Sustainability 12 02857 g010
Figure 11. Simulation results of Scenarios 1–5: (a) Urban GDP, (b) Port throughput, (c) Economic cost per unit GDP and (d) Economic cost per unit throughput. Note: Since the objective of the scenarios is to meet the requirements of urban development for GDP and port throughput to observe the operating efficiency of the port and the city, the GDP and throughput are consistent across scenarios.
Sustainability 12 02857 g011
Figure 12. Simulation results of Scenarios 6–10: (a) Urban GDP, (b) Port throughput, (c) Economic cost per unit GDP and (d) Economic cost per unit throughput.
Sustainability 12 02857 g012aSustainability 12 02857 g012b
Figure 13. Simulation results of Scenarios 11–15: (a) Urban GDP, (b) Port throughput, (c) Economic cost per unit GDP and (d) Economic cost per unit throughput.
Sustainability 12 02857 g013
Table 1. Socio-economic equations for urban and port subsystems.
IGDP = GDP × GGC
SB = GDP − SEC
FAI = GDP × FAIR
PI = FAI × PIR + PR × coefficient
PIR = CPC × coefficient
IPT = IF THEN ELSE (ASL > 2000, DELAY3 (CF and TCCC × PI × IC, PCC), DELAY3 (CF and TCCC × PI × IC, PCC) × 0.01)
PT = INTEG (IPT)
PTS = PT × PPL
SAC = IPT × CS and TCC
ASL = TLAS + INTEG (−SAC)
VT = GDP × TD
PTD = VT × CCG
ROC = LOC + SOC
ITC = PT × ATD × FR × (1 + coefficient × FP^4)
FP = PTD / PTS
SEC = ELEP + ITC + ROC + EPCE
Table 2. Relation equations for environmental resources subsystem.
IAV = GDP × CIAV + PT × PCC
ED = CED × IAV
EE = CEE × IAV
SWD = CSWD × IAV
EPCE = SWD × USWCE + UECE × EE + UECE × ED
Table 3. Related important equations for port-cityspatial resources.
PT = IF THEN ELSE (FP > 1, PTS, PTD)
PLO = PT × coefficient
SO = PT × coefficient
SOC = SO × USOC
LOC = PLO × ULOC
Table 4. List of basic data of main indicators.
YearGDP (Billion Yuan)Total Import and Export Values (Million USD)Throughput (10,000 Tons)Trafficability (10,000 Tons)Length of Occupied Shoreline (m)Industrial Added Value above a Designated Scale (100 Million Yuan)Port Investment (100 Million Yuan)
2007138839,7788117826617,76362531
2008156045,3899702926116,77368026
2009173743,31411,096955917,59867030
2010206057,03612,72810,04118,52286927
2011253970,16715,65413,43922,597111735
2012281774,49117,22714,10423,923116426
2013301884,09419,08814,17424,431121218
2014327483,55320,50416,18827,934124019
2015346683,29121,02316,55028,827125421
2016378477,17720,90417,30029,749126523
Table 5. Comparison of simulated values and actual values of main indicators.
YearActual GDP
(100 Million Yuan)
Simulated GDP
(100 million Yuan)
Deviation
(%)
Actual Throughput
(10,000 Tons)
Simulated Throughput
(10,000 Tons)
Deviation
(%)
2007138813880.00%811783382.72%
2008156015630.17%97029388−3.24%
2009173717852.74%11,09610,722−3.38%
2010206021011.97%12,72812,9751.94%
2011253925701.20%15,65415,6900.23%
201228172816−0.05%17,22716,523−4.09%
2013301830420.79%19,08818,587−2.63%
201432743270−0.10%20,50419,658−4.13%
2015346635221.61%21,02320,164−4.08%
2016378438481.69%20,90420,217−3.29%
Table 6. Simulation scenarios in the paper.
ScenarioContribution of InvestmentConversion Factor of Shoreline Resources and Throughput (m/10,000 Tons)Unit Cost for Pollutant Treatment (10,000 Yuan/10,000 Tons)Port-cityDistance (km)
10.621.950.55
20.641.950.55
30.621.900.55
40.621.950.485
50.641.900.485
60.621.950.520
70.641.950.520
80.621.900.520
90.621.950.4820
100.641.900.4820
110.621.950.5100
120.641.950.5100
130.621.900.5100
140.621.950.48100
150.641.900.48100