Abstract
With rapid economic and industrial development, the potentially toxic element (PTE) pollution of farmlands in China has become increasingly serious. Based on the Hakanson potential ecological risk index (RI) and national food pollutant limit standards (GB 2762-2017), the effects of exogenous potentially toxic elements (PTEs), i.e., arsenic (As) and mercury (Hg), on rice growth were studied. Common varieties of hybrid (YY 538, CY 84) and conventional (XS 134, JH 218) rice were grown in pots having representative paddy soil from Zhejiang Province, China. The results showed that As and Hg in soil significantly inhibited growth; however, the plant height of hybrid rice was less affected. Further, there were significant correlations between concentrations of PTEs in soil and rice grains; however, hybrid rice had a stronger ability to absorb and accumulate PTEs. The comprehensive potential ecological RI of soil PTEs was 39.4–89.9, which is below the level of ‘minor ecological hazard’, and the contribution rate of Hg was 79.9%–84.2%; as such, Hg posed the greatest potential ecological risk in the study area. The ecological risk limits of As and Hg in the safe production of different rice varieties decreased in the order XS 134 > JH 218 > YY 538 > CY 84. The ecological risk limits of As and Hg for conventional rice were higher, and the risk limits of As and Hg for hybrid rice were lower, than the limit of the soil environmental quality assessment index in the national “Soil quality control criteria for soil pollution in agricultural land (for trial implementation) (Trial)” (GB15618-2018). The health risk limit of soil As in the typical paddy soil of China decreased in the order XS 134 > JH 218 > CY 84 > YY 538. The health risk limit of Hg decreased in the order XS 134 > JH 218 > YY 538 > CY 84. The health risk limit of As was lower, whereas the risk limit of Hg was higher, than the limit of the soil environmental quality evaluation index in the national “Soil quality control criteria for soil pollution in agricultural land (for trial implementation) (Trial)”(GB15618-2018).
1. Introduction
Since the beginning of the 21st century, with rapid economic and industrial development, the potentially toxic element (PTE) pollution of farmlands in China has become increasingly serious owing to industrial and mining enterprises, transportation, solid waste discharge, and the widespread use of fertilizers and pesticides. The 2017 National Soil Pollution Survey Bulletin, published in April 2017 by the Ministry of Environmental Protection and the Ministry of Land and Resources of China, showed that the number of soil samples exceeding the recommended PTE limits accounted for 21.7% of the total samples [1,2]. Approximately 64.8% of farmland in sewage irrigation areas in China is polluted by PTEs, and the annual grain yield loss is more than 12 million tons, with total losses of at least 20 billion yuan [3]. Rice is the main food crop in China and has high PTE absorption characteristics [1]. In recent years, rice quality and safety problems have appeared more frequently [4,5,6]. Therefore, the problem of PTE pollution in soil-rice systems has attracted worldwide attention and is a current research hotspot [7].
It has been reported that the total amount of arsenic (As) added into the soil every year reaches 0.94 × 10⁸ kg in the world with soil As pollution becoming increasingly alarming [8,9]. Serious As contamination of rice fields has been identified in many countries and regions, especially in South Asia [10,11]. Mercury (Hg) is the most toxic potentially toxic element (PTE) in the environment [12], and values as high as 1.6% of Hg are reported in polluted farmlands [13], exceeding the standard limits. As a result of sewage irrigation, high fertilizer use, and pesticide spraying, about 50% of the farmland in some cities of China suffers from As, Hg, and other toxic PTE pollution [14]. When As and Hg accumulate in the soil, these destroy its physical, chemical, and biological characteristics. Both As and Hg not only seriously affect the yield and quality of crops, but also endanger human health through the food chain [15].
Rice is an important food crop, especially in China, and is a major ingredient in a number of products, especially baby formulas [16]. Therefore, extensive research on the impacts of As and Hg pollution on the growth of rice and on their absorption and accumulation characteristics has been conducted [17,18]. Wang et al. [19] showed that As treatment significantly inhibited the growth of two rice varieties (402 and II You 416). Fan et al. [20] showed that the accumulation of PTEs in rice grains generally increases with the increasing mass fraction of added PTEs. However, most studies have been carried out under independent experimental conditions, and relatively few have been conducted as comparative studies using different rice varieties under complex PTE conditions. Owing to China’s large size and the wide variety of soils, the varieties of crops vary greatly and the use of the soil quality control criteria for soil pollution in agricultural land in agricultural soils can cause large errors. Therefore, research on As and Hg safety limits for specific crop production areas is particularly important. At present, most regional studies have focused on cadmium (Cd) safety limits for single rice varieties [21,22].
In this study, we considered the absorption and accumulation characteristics of PTEs (inorganic As and total Hg) for four common rice varieties in pot experiments using soil from Zhejiang Province, China. Based on potential ecological risk assessments and health risk assessments (GB15618-2018), the safety limits of inorganic As and total Hg in soils were calculated. The results of the study provide a scientific basis for rice variety selection and the prevention and control of PTE pollution in agricultural soils of Zhejiang Province.
2. Materials and Methods
2.1. Experimental Materials
The soil used in the experiments was a typical paddy soil from Longyou County, Zhejiang Province, China. It comprised of a typical gley moist ultisol with the following basic physicochemical properties: pH of 5.56, organic matter content of 1.79%, and cation exchange capacity of 19.2 cmoL/kg. The soil particle compositions for different size fractions were as follows: 12.3% for 0.02–2 mm, 45.3% for 0.002–0.02 mm, and 42.4% for <0.002 mm. The PTE contents were as follows: Pb of 24.1 mg/kg, Cr of 94 mg/kg, Cu of 21.3 mg/kg, Zn of 64.88 mg/kg, Cd of 0.02 mg/kg, and the potentially toxic element contents of As and Hg were 6.69 mg/kg and 0.16 mg/kg, respectively. All of these values were lower than the USEPA’s ‘Technology Alternatives for the Remediation of Soils Contaminated with As, Cd, Cr, Hg, and Pb’.
The rice varieties tested included hybrid rice cultivar Yongyou 538 (YY 538) and Chunyou 84 (CY 84), and conventional rice varieties Jiahe 218 (JH 218) and Xiushui 134 (XS 134). Rice seeds were provided by the Zhejiang Academy of Agricultural Sciences. Seeds were separated from the empty husk using the water suspension method, soaked with 30% H2O2 for 30 minutes, washed with water, and then soaked in water for 10 hours for germination. After germination, seeds were first grown on a seedling board floating on top of basal nutrient solution. After 25 days, seedlings were transplanted into treated pots [23].
2.2. Soil Treatment
Five treatment groups were set: (1) a control group (CK) without As and Hg; (2) arsenic 15 mg/kg and Hg 0.5 mg/kg (T1); (3) arsenic 30 mg/kg and Hg 1 mg/kg (T2); (4) arsenic 45 mg/kg and Hg 1.5 mg/kg (T3); and (5) arsenic 60 mg/kg and Hg 2 mg/kg (T4). The NaAsO2 and HgCl2 solutions were simultaneously added to the soil to reach the target concentration gradient for each soil group. PTE-added soil was mixed well for 2 weeks. After that, soil was placed in 10 L hard plastic pots (15 kg of air-dried soil per pot) and water was added to 5 cm above the soil surface, after which the pot was left to stand. After 15 days, rice seedlings were transported into each pot. The four rice varieties were planted in different PTE-contaminated soils, five holes per pot with one seedling per hole, and four pots per treatment.
2.3. Rice Planting Management and Sample Collection
All the experiments were performed at the Zhejiang Academy of Agricultural Sciences, Hangzhou, 310016, China. Deionized water was regularly added in order to maintain a soil water content of 70% of the field water holding capacity. Compound fertilizer was applied to rice (3 g/pot) at the tilling and filling stages (nitrogen/phosphorus/potassium with a ratio of 17:17:17) [24]. The crop was grown by following the recommended practices for prevention and control of diseases, insects, and weeds as in actual field production.
At the time of rice harvest, the mature whole rice samples were harvested, and roots were separated from the aboveground parts. Aboveground parts were washed with tap water, washed with deionized water, and then dried to determine plant height and panicle weight (with an accuracy level of 0.01 cm). The rice kernels were placed in an oven and dried at 80 °C to constant weight [25]. After the rice was de-husked, it was ground through a 60 mesh sieve for determination of PTE content.
2.4. Determination of As and Hg Content in Rice Samples
These ground rice samples were digested using the microwave digestion method. A known amount of each rice sample was placed in a special digestion vessel and 5 mL of HNO3 was added, after which it was left overnight. After that, about 2 mL of H2O2 was added in each vessel and the stainless steel jacket was tightly closed. These vessels were heated at 120 °C for 2 hours, until digestion was complete. The sample was then allowed to naturally cool to room temperature before being diluted by mixing with a 25 mL 10% HNO3 digestion solution (GB5009.11-2004 and GB5009.11-2004). The contents of As and Hg were measured using an atomic fluorescence spectrophotometer (TAS-990AFG, Beijing Puxi, China).
2.5. Ecological Risk Assessment to Calculate As and Hg Safety Limit Values
A regression analysis method for linear fitting was applied in which a regression equation was constructed to fit the correlation between As and Hg concentration (y) and rice panicle weight (x). Laender et al. [13] argue that a species or population in an ecosystem has a normal biomass of ±20% compared with the presence of toxic and non-toxic substances; anything above this range is considered to deviate from normal. The rice panicle weight was reduced by 20% as the critical point, and the fitting formula obtained in this study was substituted to obtain the ecological risk limit values of As and Hg in the soil environment of normal rice.
The potential ecological hazard index (RI) of PTEs was calculated according to the method of Hakanson et al. [26]:
where “n” is the number of elements analyzed; “i” is the i-th element; “Ci” is the derived ecological risk limit value (mg/kg) of the i-th PTE; “Ei” is the potential ecological hazard coefficient of single PTE pollution; “”is the reference value (mg/kg). The limits of soil environmental quality assessment indicators (As 30 mg/kg, Hg 0.5 mg/kg) from the national “Soil quality control criteria for soil pollution in agricultural land (for trial implementation) (Trial)” (GB15618-2018) were used. The biotoxicity response coefficients “” of As and Hg are 10 and 40, respectively [27]. According to calculated RI values, the potential risk of each PTE pollutant was determined, and the ecological risk was classified. The relationship between the risk assessment index and the classification of PTE pollutants is shown in Table 1.

Table 1.
Potential risk assessment indicators of potentially toxic element (PTE) pollutants and their grading relations.
2.6. Estimation of As and Hg Safety Limits Based on Health Risk Assessment
A regression equation was used to fit the correlation between As and Hg concentrations in soil (y) and As and Hg content in rice grains (x). The significance of the regression model was also confirmed using analysis of variance (ANOVA). Food safety national standard, Contaminant limits in food (GB 2762-2017), of As (0.2 mg/kg) and Hg (0.02 mg/kg) for rice grains were substituted into the regression equation in order to calculate the health risk limit values of As and Hg in the study area.
2.7. Data Analysis and Methods
The plant height, panicle weight, and grain PTE contents of different rice varieties were expressed by mean ± standard deviation (SD). SPSS Statistics v 21.0 software one-way ANOVA, Tukey tests, Pearson correlations, and two-way ANOVA were used to analyze the correlations between the concentration of PTEs in soils, the accumulation of PTEs in rice grains, and the growth of rice grains, and led to the analysis of the significance of the differences between the various treatments (p < 0.05 and p < 0.01).
3. Results
3.1. Effects of PTEs on Rice Growth
The results of plant height, as shown in Figure 1 and Table 2, showed that the plant height of hybrid rice varieties (CY 84, YY 538) was greater than that of conventional rice varieties (XS 134, JH 218) at each treatment concentration. The plant height of hybrid rice varieties (CY 84, YY 538) is 3.3%–19.9% higher than that of conventional rice varieties (XS 134, JH 218). With the increase in the As-Hg pollution level, the overall plant heights showed a significant downward trend; however, for the same concentrations of PTEs, conventional rice varieties exhibited greater reduction in plant height than did the hybrid rice. When high concentrations of As and Hg (60 mg/kg and 2 mg/kg, respectively) were added to the soil, the plant heights of conventional rice XS 134 and JH 218 decreased by 27.1% and 19.8%, respectively, compared with those in the control (CK). On the other hand, the plant heights of hybrid rice CY 84 and YY 538 decreased by only 17.9% and 14.7%, respectively. These results showed that the response of different rice varieties to As and Hg stress was significantly different (p < 0.05). The tolerance of hybrid rice (CY 84 and YY 538) to As and Hg stress was found to be higher than that of conventional rice (XS 134 and JH 218).
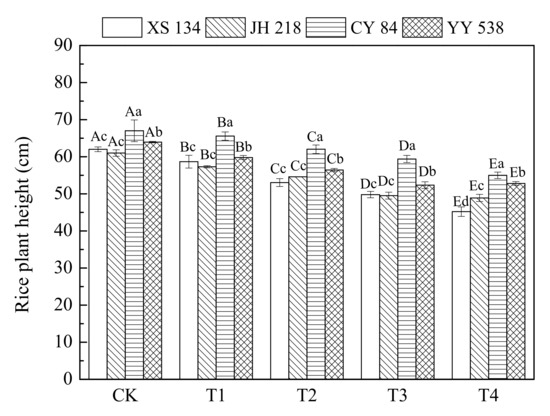
Figure 1.
Rice plant height as a function of PTE contamination. Error bars show ± SD of means of three replicates (n = 3). In the intra-group treatment group, the lowercase letter indicates significant difference between different rice varieties under the same treatment (p < 0.05), and in the intergroup treatment groups, the uppercase letter indicates significant difference between different treatments of the same rice varieties (p < 0.05).
Table 2.
The two-way ANOVA of treatment group and rice varieties.
The data for panicle weight are shown in Figure 2 and Table 3. It can be seen that for CK, the panicle weight of hybrid rice (CY 84 and YY 538) was greater than that of conventional rice (XS 134 and JH 218). With an increasing soil As-Hg concentration, the rice grain yield decreased significantly (p < 0.05), indicating that complex As-Hg pollution has a strong inhibitory effect on rice grain yield; however, this effect varied for the different rice varieties and PTEs. The grain weights of hybrid rice CY 84 and YY 538 decreased by 52.9% and 43.8% per pot, respectively, as compared with the control plants. The conventional rice varieties decreased by a lesser amount (34.5% for JH 218 and 36.0% for XS 134), depicting that hybrid rice is more prone to soil contamination by As-Hg.
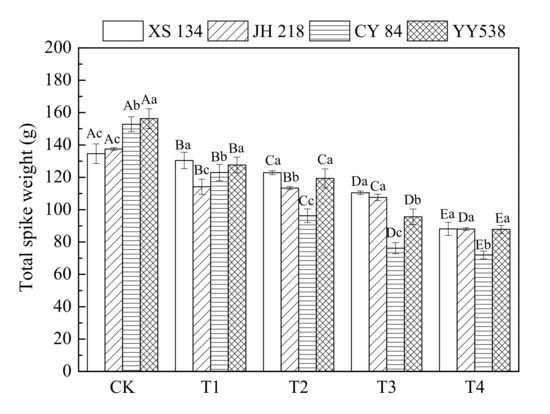
Figure 2.
Rice panicle weight as a function of PTE contamination. Error bars show ±SD of means of three replicates (n = 3). In the intra-group treatment group, the lowercase letter indicates significant difference between different rice varieties under the same treatment (p < 0.05), and in the intergroup treatment groups, the uppercase letter indicates significant difference between different treatments of the same rice varieties (p < 0.05).
Table 3.
The two-way ANOVA of treatment group and rice varieties.
3.2. Accumulation of As and Hg in Rice Grains
From Figure 3 and Table 4, it can be seen that the content of As and Hg in the four rice varieties increased significantly with increasing soil contamination (p < 0.05); however, there were significant differences in As and Hg accumulation among different rice varieties (p < 0.05). Under Treatment 4 (As 60 mg/kg, Hg 2 mg/kg), the contents of As and Hg in hybrid rice varieties CY 84 and YY 538 exceeded the food safety national standard (GB2762-2017) by 31%–67% and 38%–125%, respectively, compared with that in conventional rice (XS 134, JH 218) grains, which exceeded the limits of the food safety national standard (GB2762-2017) by 31%–67% and 38%–125%, respectively.
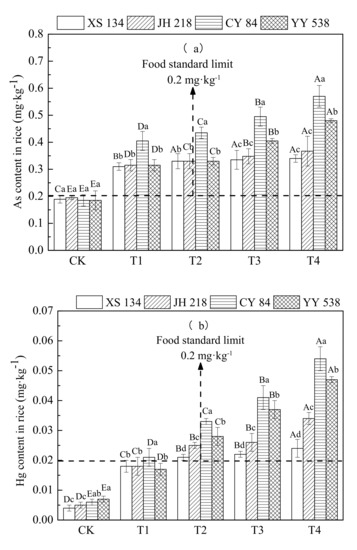
Figure 3.
Content of (a) As and (b) Hg in different rice varieties. Error bars show ±SD of means of three replicates (n = 3). In the intra-group treatment group, the lowercase letter indicates significant difference between different rice varieties under the same treatment (p < 0.05), and in the intergroup treatment groups, the uppercase letter indicates significant difference between different treatments of the same rice varieties (p < 0.05).
Table 4.
The two-way ANOVA of treatment group and rice varieties.
3.3. Ecological Risk of PTEs in Soil
Data for ecological risk parameters are given in Table 5. The panicle weight of the four rice varieties was negatively correlated with the content of As and Hg in the soil. With increasing As and Hg concentrations in the soil, the growth (biomass) of rice was significantly inhibited. Conventional rice (XS 134, JH 218) showed significant or highly significant correlations between panicle weight and PTE concentrations.
Table 5.
Potential ecological risk index (RI) and ecological risk limit values of soil PTEs.
Under the inhibitory concentrations, the yields of the four rice varieties decreased by 20%; however, the soil PTE ecological risk limit was higher for conventional rice than for hybrid rice, as shown in Table 5. The ecological risk limits (in mg/kg) of As for the rice varieties were as follows: XS 134 (44.08), JH 218 (34.67), CY 84 (20.99), and YY 538 (26.49). The ecological risk limits (mg/kg) of Hg were as follows: XS 134 (0.93), JH 218 (0.77), CY 84 (0.40), and YY 538 (0.44). The comprehensive potential ecological RI of soil PTEs was found to be 39.4–89.9, which is consistent with a minor level of ecological hazard. From the single factor potential ecological RI, the average RI of Hg was greater than that of As. The ecological risk coefficient (Ei) of As was 7–14.69, which is at a minor ecological hazard level. The Ei of Hg was 32.4–74.4, which is below the medium ecological risk level.
3.4. Soil PTE Health Risk Limits
The values for soil PTEs health risks are given in Table 6. PTEs concentration in the soil and the accumulation of PTEs in rice was correlated; however, the absorption and accumulation differed for each rice variety. The content of PTEs in hybrid rice (CY 84 and YY 538) had a good correlation with the concentrations of As and Hg. The soil As health risk limits (mg/kg) for safe production of different rice varieties were as follows: XS 134 (26.94), JH 218 (26.36), CY 84 (22.93), and YY 538 (22.16). The Hg health risk limits (mg/kg) were as follows: XS 134 (0.92), JH 218 (0.80), YY 538 (0.62), and CY 84 (0.83). From the simulation of As and Hg limits, the limits of PTEs in conventional rice cultivation were found to be higher than that of hybrid rice, as shown in Table 6.
Table 6.
Estimated soil PTE health risk limit values for the study region.
4. Discussion
4.1. Effect of As-Hg Complex Pollution on Rice Growth
Rice plant height and yield are important indicators for estimating rice growth. In this study, the plant height and panicle weight of rice were both significantly inhibited by As-Hg in soil. This is consistent with the results of Pérez Chaca et al. [28], who found that increasing PTE concentrations were correlated with inhibited plant growth and biomass. Wan et al. [29] showed that tiller number and plant height gradually decreased with increasing PTE content. Gautam et al. [30] found that during the development of rice, plant height and yield were significantly inhibited by Hg2+ stress, which might be because of PTEs effect on photosynthesis, destruction of enzyme structures, hindrance of plant metabolism, inactivation of important enzymes, or some other structural variations, thereby affecting plant growth and development as well as causing plant death [31,32,33,34,35]. Chen et al. [36] showed that PTEs inhibit the growth of rice seedlings, destroy the stability of root cell membranes, reduce antioxidant enzyme activities, and thus inhibit the photosynthesis of leaves. Chang et al. [37] showed that under multi-metal stress, rice can reduce damage through the antioxidant enzyme system, but when the pollution load index is too large and affects the growth of rice, rice plants will die. It has been reported that with an increasing soil pollution load index, the content of PTEs absorbed by rice increases, and the chlorophyll content of rice leaves decrease; this may be due to the fact that PTEs can promote the excessive production of reactive oxygen species (ROS) in plants, destroy biological macromolecules (e.g., plant membrane structures, enzyme systems, and proteins), and inhibit chlorophyll synthesis and ultimately plant growth [38].
Varietal differences are the main factors affecting rice growth [39,40]. In the As-Hg contaminated soil of the present study, the plant height of hybrid rice (CY 84, YY 538) was greater than that of conventional rice (XS 134, JH 218); however, the hybrid rice (CY 84 and YY 538) varieties decreased by a larger amount than the conventional rice (XS 134, JH 218). Kumarathilaka et al. [41] showed that the growth of different varieties of rice in As-contaminated soil was significantly different as the root length and plant height of hybrid rice was better than that of conventional rice. Shan et al. [42] showed that there was a significant (p < 0.05) difference in the yield of rice varieties under the combined pollution of Cd and As. This is consistent with the results of our study and this varied response might be due to the significant differences in superoxide dismutase (SOD) activity and chlorophyll ‘a’ content of different rice varieties under the same environment, resulting in differential resistances to PTE pollution [43]. However, the mechanisms of influence on the physiological and biochemical levels of plant molecules remain unclear; further research is needed on this topic.
4.2. Effects of As-Hg Complex Pollution on Absorption and Accumulation of PTEs by Rice
In this study, there were significant and highly significant positive correlations between soil As-Hg and rice As and Hg content (p < 0.05), as shown in Figure 3 and Table 6. This is consistent with the results of Zhang et al. [44] and Liu et al. [45,46]. Figure 3 shows that conventional rice kernels exhibit lower absorption capacity for As and Hg. Duan et al. [47] have shown that there are significant differences in the accumulation of PTEs in different rice varieties, and that low As accumulation varieties include Xiushui 128 and Xiushui 09. Zhang et al. [48] and Wang et al. [35] showed that hybrid rice has stronger absorption and transport ability than does conventional rice. This is consistent with the results of this study where significant differences were observed in among rice varieties regarding As-Hg accumulation by rice grains, which might be due to the different mechanisms involved in absorption, transport, and accumulation of pollutants by crops that is mediated by specific genes or proteins expressed by these genes, and which thus affects the accumulation of PTEs in organisms [49]. It may also be due to the fact that soil microbes alter the availability as well as biological activities of PTEs, leading to significant differences in the accumulation and transport of PTEs in different types of rice [50,51]. Therefore, breeding and screening for promising varieties with excellent tolerance to PTEs is one of the basic strategies to reduce the risk of PTE intake of crops growing in metal-contaminated areas.
4.3. Soil As and Hg Safety Limits
The study of metal safety limits in soil is of great significance for ensuring food safety and environmental safety. Results of the present study show that at As and Hg concentrations of 20.99–44.08 and 0.4–0.93 mg/kg, respectively, the comprehensive potential ecological RI of PTEs in the soil was 39.4–89.9 mg/kg. The potential ecological risk coefficient of the two PTEs was greater for Hg than that of As, as shown in Table 5. The contribution rate of Hg to the comprehensive ecological risk of PTEs was 79.9%–84.2%; as such, the potential ecological risk of Hg in soil should be a matter of concern. This is consistent with the findings of Yuan et al. [52], and Chen et al. [53] also reached the same conclusion. This may be due to the fact that single factor ecological risk is associated with PTE toxicity. The ecological risk limits of soil As and Hg for the four rice varieties could be ranked in decreasing order as XS 134 > JH 218 > YY 538 > CY 84. The ecological risk limits (mg/kg) of As were as follows: XS 134 (44.08), JH 218 (34.67), YY 538 (26.49), and CY 84 (20.99). The ecological risk limits (mg/kg) for Hg were as follows: XS 134 (0.93), JH 218 (0.77), YY 538 (0.44), and CY 84 (0.40). The ecological risk limits of As and Hg for conventional rice were higher than that of hybrid rice, and the risk limits of As and Hg for hybrid rice were lower than the limit of the soil environmental quality evaluation index in the national “Soil quality control criteria for soil pollution in agricultural land (for trial implementation) (Trial)” (GB15618-2018).
This study shows that there are significant differences in the safety limits of soil PTEs for different rice varieties, as shown in Table 6. The As health risk limits (mg/kg) for safe production of different rice varieties were as follows: XS 134 (26.94), JH 218 (26.36), CY 84 (22.93), and YY 538 (22.16). The Hg health risk limits (mg/kg) were as follows: XS 134 (0.92), JH 218 (0.80), YY 538 (0.62), and CY 84 (0.83). To ensure that the PTE content of rice is within safety limits, rice varieties with higher PTE safety limits should be selected for growth in metal-contaminated areas. On the basis of these results, we suggest that this As and Hg-contaminated soil is more suitable for growing conventional rice. The health risk limit of As for rice XS 134 is lower, and the risk limit of Hg is higher than the limit of the soil environmental quality evaluation index in the national “Soil quality control criteria for soil pollution in agricultural land (for trial implementation) (Trial)” (GB15618-2018). According to Hong [54], the safety limits (mg/kg) of effective Hg in soils of various vegetable varieties were as follows: celery (0.36), radish (0.37), spinach (0.38), lettuce (0.41), sweet potato (0.74), mustard (0.74), Shanghai green (1.09), cowpea (2.10), cabbage (3.97), tomato (18.15), and pepper (64.97). In this experiment, the Hg limit of rice soil was 0.807 mg/kg, which further indicates that even for the same PTEs, the absorption efficiency of a plant will vary significantly with crop genotype. In addition, the pH value, organic matter composition, and redox potential of the soil all affect a plant’s response towards PTE absorption and accumulation. It is suggested that to effectively apply crop safety production in different regions, soil PTE limits should be calculated according to specific crop species, as well as the physical and chemical properties of the soil.
5. Conclusions
The inhibition potential of As and Hg on conventional rice plant height was significantly higher than that of hybrid rice (p < 0.05), and the grain weight of hybrid rice was significantly inhibited by both As and Hg. The uptake capacity of As and Hg in conventional rice varieties was lower than that in hybrid rice. Under high concentrations of As + Hg (80 + 1.8 mg/kg), both hybrid rice and conventional rice exceeded the food safety national standard.
Potential ecological risk assessment studies indicated that the comprehensive potential ecological RI of soil PTEs is 39.4–89.9, which is consistent with a medium level of ecological hazard. The ecological risk coefficient of PTEs was greater for Hg than for As. The ecological risk limits of soil As and Hg were XS 134 > JH 218 > YY 538 > CY 84. The ecological risk limits of As were 44.08, 34.67, 20.99, and 26.49 mg/kg, and those of Hg were 0.93, 0.77, 0.40, and 0.44 mg/kg, respectively.
The health risk limit of soil As in our typical paddy soil of Longyou County, Zhejiang Province, China was XS 134 (26.94 mg/kg) > JH 218 (26.36 mg/kg) > CY 84 (22.93 mg/kg) > YY 538 (22.16 mg/kg), and Hg health risk limit performance was XS 134 (0.92 mg/kg) > JH 218 (0.80 mg/kg) > YY 538 (0.62 mg/kg) > CY 84 (0.83 mg/kg).
Author Contributions
Methodology, C.H.; Project administration, W.W. and F.Z.; Resources, Y.Y. and X.C.; Writing—original draft, M.C. and S.H.; Writing—review & editing, E.I. All authors have read and agreed to the published version of the manuscript.
Funding
This research was funded by Zhejiang Province Key R&D project (No. 2015C03020).
Acknowledgments
This study was also supported by Geological Exploration Fund of Zhejiang Province (2014002); The authors are highly thankful to members of our group for their valuable contributions to this paper.
Conflicts of Interest
The authors declare no conflflict of interest. The funders had no role in the design of the study; in the collection, analyses, or interpretation of data; in the writing of the manuscript, or in the decision to publish the results.
References
- Huang, J.; Hsu, S.; Wang, S. Effects of rice straw ash amendment on Cu solubility and distribution in flooded rice paddy soils. J. Hazard. Mater. 2011, 186, 1801–1807. [Google Scholar] [CrossRef] [PubMed]
- Li, Z.; Ma, Z.; Kuijp, T.J.; Yuan, Z.; Huang, L. A review of soil heavy metal pollution from mines in China: Pollution and health risk assessment. Sci. Total Environ. 2014, 468–469, 843–853. [Google Scholar] [CrossRef] [PubMed]
- Huang, Y.; Chen, G.; Xiong, L.; Huang, Y. Current situation of heavy metal pollution in farmland soil and phytoremediation application. Asian Agric. Res. 2016, 8, 22–24. [Google Scholar]
- Lu, Y.; Song, S.; Wang, R.; Liu, Z.; Meng, J.; Sweetman, A.J.; Jenkins, A.; Ferrier, R.C.; Li, H.; Luo, W.; et al. Impacts of soil and water pollution on food safety and health risks in China. Environ. Int. 2015, 77, 5–15. [Google Scholar] [CrossRef]
- Röhr, A.; Lüddecke, K.; Drusch, S.; Müller, M.J.; Alvensleben, R.V. Food quality and safety-consumer perception and public health concern. Food Control 2005, 16, 649–655. [Google Scholar] [CrossRef]
- Zhao, K.L.; Liu, X.M.; Xu, J.M.; Selim, H.M. Heavy metal contaminations in a soil-rice system: Identification of spatial dependence in relation to soil properties of paddy fields. J. Hazard. Mater. 2010, 181, 778–787. [Google Scholar] [CrossRef]
- Neza, F.; Domen, L. The two-phase leaching of Pb, Zn and Cd contaminated soil using EDTA and electrochemical treatment of the washing solution. Chemosphere 2008, 73, 1484–1491. [Google Scholar]
- Chen, Z.; Zhu, Y.G.; Liu, W.J.; Meharg, A.A. Direct evidence showing the effect of root surface iron plaque on arsenite and arsenate uptake into rice (Oryza sativa) roots. New Phytol. 2005, 165, 91–97. [Google Scholar] [CrossRef]
- Han, F.X.; Su, Y.; Monts, D.L.; Plodinec, M.J.; Banin, A.; Triplett, G.E. Assessment of global industrial-age anthropogenic arsenic contaminationt. Springer J. 2003, 90, 395–401. [Google Scholar]
- Bhattacharya, P.; Welch, A.H.; Stollenwerk, K.G.; McLaughlin, M.J.; Bundschuh, J.; Panaullah, G. Arsenic in the environment: Biology and chemistry. Sci. Total Environ. 2007, 379, 109–120. [Google Scholar] [CrossRef]
- Brammer, H. Mitigation of arsenic contamination in irrigated paddy soils in South and South-east Asia. Environ. Int. 2009, 35, 856–863. [Google Scholar] [CrossRef] [PubMed]
- Peng, X.Y.; Wang, M.Y.; Liu, F.J.; Ye, Z.H. Arsenic pollution in rice and its mechanism of arsenic uptake and metabolism. J. Ecol. 2010, 30, 4782–4791. [Google Scholar]
- Hakanson, L. An ecological risk index for aquatic pollution control: A sedimentological approach. Water Res. 1980, 14, 975–1001. [Google Scholar] [CrossRef]
- Luo, Y.M.; Teng, Y. Status of soil pollution degradation and countermeasures in China. Soils 2006, 18, 505–508. [Google Scholar]
- Román, R.; Fortún, C.; García López De Sá, M.E.; Almendros, G. Successful soil remediation and reforestation of a calcic regosol amended with composted urban waste. Arid Land Res. Manag. 2003, 17, 297–311. [Google Scholar] [CrossRef]
- Irem, S.; Islam, E.; Maathuis, F.J.M.; Niazi, N.K.; Li, T. Assessment of potential dietary toxicity and arsenic accumulation in two contrasting rice genotypes: Effect of soil amendments. Chemosphere 2019, 225, 104–114. [Google Scholar] [CrossRef]
- Du, X.P.; Kang, J.Q.; Lu, J.Y. Selection for low-Cd-accumulating cultivars of pakchoi (Brassica chinensis L.), effects of sulfur on Cd content, and quality characters under Cd stress. J. Agro Environ. Sci. 2018, 37, 1592–1601. [Google Scholar]
- Grant, C.A.; Clarke, J.M.; Duguid, S.; Chaney, R.L. Selection and breeding of plant cultivars to minimize cadmium accumulation. Sci. Total Environ. 2008, 390, 301–310. [Google Scholar] [CrossRef]
- Wang, L.M.; Wei, C.Y.; Yang, L.S. Arsenic accumulation and speciation in two rice varieties and related health risks. Acta Sci. Circumstantiae 2010, 30, 832–840. [Google Scholar]
- Fan, Z.L.; Ji, H.; Yang, F.; Wu, Q.; Zhang, W.J. Accumulation characteristics of Cd and Pb in rice grain and their security threshold values in paddy field under different soil types. Ecol. Environ. Sci. 2010, 19, 792–797. [Google Scholar]
- Ding, C.F.; Zhang, T.L.; Wang, X.X.; Zhou, F.; Yang, Y.R.; Huang, G.F. Prediction model for cadmium transfer from soil to carrot (Daucus carota L.) and its application to derive soil thresholds for food safety. J. Agric. Food Chem. 2013, 61, 10273–10282. [Google Scholar] [CrossRef] [PubMed]
- Li, J.R.; Xu, Y.M. Immobilization of Cd in paddy soil using moisture management and amendment. Environ. Sci. Pollut. Res. 2015, 22, 5580–5586. [Google Scholar] [CrossRef] [PubMed]
- Yin, J.; Li, H.; Lu, W. Difference of Cu accumulation and distribution in different rice varieties. Ecol. Environ. Sci. 2010, 19, 334–339. [Google Scholar]
- Thapa, S.; Ranjan, K.; Ramakrishnan, B.; Velmourougane, K.; Prasanna, R. Influence of fertilizers and rice cultivation methods on the abundance and diversity of phyllosphere microbiome. J. Basic Microbiol. 2017, 58, 172–186. [Google Scholar] [CrossRef]
- Fu, Y.; Li, F.; Guo, S. Cadmium pollution in soil and rice plants in Zhangyizhan Town of Zhangshi irrigation area of Shenyang. Chin. J. Ecol. 2017, 36, 1965–1972. [Google Scholar]
- Laender, F.D.; Schamphelaere, K.A.C.D.; Vanrolleghem, P.A.; Janssen, C.R. Is ecosystem structure the target of concern in ecological effect assessments? Water Res. 2008, 42, 2395–2402. [Google Scholar] [CrossRef]
- Zhang, P.Y.; Qin, M.Z.; Chen, L. Study on distribution characteristics and potential ecological risk of soil heavy metal in the Yellow River Beach Region in Kaifeng City. Environ. Sci. 2013, 34, 3654–3662. [Google Scholar]
- Pérez Chaca, M.V.; Vigliocco, A.; Reinoso, H.; Molina, A.; Abdala, G.; Zirulnik, F.; Pedranzani, H. Effects of cadmium stress on growth, anatomy and hormone contents in Glycine max (L.) Merr. Acta Physiol. Plant. 2014, 36, 2815–2826. [Google Scholar]
- Wan, Y.; Luo, S.L.; Chen, J.L.; Xiao, X.; Chen, L.; Zeng, G.M.; Liu, C.B.; He, Y.J. Effect of endophyte-infection on growth parameters and Cd-induced phytotoxicity of Cd-hyperaccumulator Solanum nigrum L. Chemosphere 2012, 89, 743–750. [Google Scholar] [CrossRef]
- Gautam, M.; Sengar, R.S.; Chaudhary, R.; Sengar, K.; Garg, S. Possible cause of inhibition of seed germination in two rice cultivars by heavy metal Pb2+ and Hg2+. Toxicol. Environ. Chem. 2010, 92, 1111–1119. [Google Scholar] [CrossRef]
- Fariduddin, Q.; Yusuf, M.; Hayat, S.; Ahmad, A. Effect of 28-homobrassinolide on antioxidant capacity and photosynthesis in Brassica juncea plants exposed to different levels of copper. Environ. Exp. Bot. 2009, 66, 418–424. [Google Scholar] [CrossRef]
- Ekmekçi, Y.; Tanyolac, D.; Ayhan, B. Effects of cadmium on antioxidant enzyme and photosynthetic activities in leaves of two maize cultivars. J. Plant Physiol. 2008, 165, 600–611. [Google Scholar] [CrossRef] [PubMed]
- Ahsan, N.; Lee, S.H.; Lee, D.G.; Lee, H.; Lee, S.W.; Bahk, J.D.; Lee, B.H. Physiological and protein profiles alternation of germinating rice seedlings exposed to acute cadmium toxicity. Comp. Study 2007, 330, 735–746. [Google Scholar] [CrossRef] [PubMed]
- Ahsan, N.; Lee, D.G.; Lee, S.H.; Kang, K.Y.; Lee, J.J.; Kim, P.J.; Lee, B.H. Excess copper induced physiological and proteomic changes in germinating rice seeds. Chemosphere 2007, 67, 1182–1193. [Google Scholar] [CrossRef]
- Sahu, G.K.; Upadhyay, S.; Sahoo, B.B. Mercury induced phytotoxicity and oxidative stress in wheat (Tritucum aestivum L.) plants. Physiol. Mol. Biol. Plants 2012, 18, 21–31. [Google Scholar] [CrossRef]
- Chen, Z.; Chen, M.; Jiang, M. Hydrogen sulphide alleviates mercury toxicity by sequestering it in roots or regulating reactive oxygen species production in rice seedlings. Plant Physiol. Biochem. 2017, 111, 179–192. [Google Scholar] [CrossRef]
- Chang, T.; Ye, L.L.; Chen, Y.S. Impact of high concentrations of heavy metal in agricultural soil on heavy metal accumulation and physiological characteristics of rice (Oryza sativa L.) in karst areas in Guangxi, China. J. Agro Environ. Sci. 2018, 37, 27–35. [Google Scholar]
- Nagajyoti, P.C.; Lee, K.D.; Sreekanth, T.V.M. Heavy metal, occurrence and toxicity for plants: A review. Environ. Chem. Lett. 2010, 8, 119–216. [Google Scholar] [CrossRef]
- Sun, Y.; Zhou, Q.; Wang, L.; Liu, W. Cadmium tolerance and accumulation characteristics of Bidens pilosa L. as a potential Cd-hyperaccumulator. J. Hazard. Mater. 2009, 161, 808–814. [Google Scholar] [CrossRef]
- Wei, S.; Zhou, Q. Screen of Chinese weed species for cadmium tolerance and accumulation characteristics. Int. J. Phytoremediat. 2008, 10, 584–597. [Google Scholar] [CrossRef]
- Kumarathilaka, P.; Seneweera, S.; Meharg, A.; Bundschuh, J. Arsenic accumulation in rice (Oryza sativa L.) is influenced by environment and genetic factors. Sci. Total Environ. 2018, 642, 485–496. [Google Scholar] [CrossRef] [PubMed]
- Shan, T.Y.; Liu, Q.X.; Yan, X.L. Cd and As absorption and transport characteristics of rice in a paddy field co-contaminated by Cd and As. J. Agro Environ. Sci. 2017, 36, 1938–1945. [Google Scholar]
- Guo, W.Y.; Tian, X.; Li, S.R. Effects of cadmium stress on the physiological and biochemical characters of rice at heading stage. J. Anhui Agric. Sci. 2018, 46, 37–43. [Google Scholar]
- Zhang, H.Z.; Luo, Y.M.; Zhang, H.B. Study on soil environmental quality guidelines and standards V. modeling of cadmium uptake in soil-crop systems for human food safety in China. Acta Pedol. Sin. 2010, 47, 628–638. [Google Scholar]
- Liu, J.G.; Liang, J.S.; Li, K.Q.; Zhang, Z.J.; Yu, B.Y.; Lu, X.L.; Yang, J.C.; Zhu, Q.S. Correlations between cadmium and mineral nutrients in absorption and accumulation in various genotypes of rice under cadmium stress. Chemosphere 2003, 52, 1467–1473. [Google Scholar] [CrossRef]
- Liu, J.G.; Li, K.Q.; Xu, J.K.; Liang, J.S.; Lu, X.L.; Yang, J.C.; Zhu, Q.S. Interaction of Cd and five mineral nutrients for uptake and accumulation in different rice cultivars and genotypes. Field Crop. Res. 2003, 83, 271–281. [Google Scholar] [CrossRef]
- Duan, G.L.; Zhang, H.M.; Liu, Y.X.; Hu, Y.; Cheng, W.D. Impact of rice genotype and growing environment on arsenic accumulation in rice polished grains. Asian J. Ecotoxicol. 2013, 8, 156–162. [Google Scholar]
- Zhang, L.; Yang, W.W.; Zhang, C.L. Cadmium tolerance, accumulation and translocation between ‘super’ rice, hybrid rice and conventional rice. Southwest China J. Agric. Sci. 2013, 26, 2185–2188. [Google Scholar]
- Han, J.Y.; Zhang, N.; Shu, X.L. Absorption of heavy metal in rice and the influence factors. China Rice 2018, 24, 44–48. [Google Scholar]
- Li, H.; Luo, N.; Zhang, L.J.; Zhao, H.M.; Li, Y.W.; Wong, M.H.; Mo, C.H. Do arbuscular mycorrhizal fungi affect cadmium uptake kinetics, subcellular distribution and chemical forms in rice. Sci. Total Environ. 2016, 571, 1183–1190. [Google Scholar] [CrossRef]
- Lin, X.; Mou, R.; Cao, Z.; Xu, P.; Wu, X.; Zhu, Z.; Chen, M. Characterization of cadmium-resistant bacteria and their potential for reducing accumulation of cadmium in rice grains. Sci. Total Environ. 2016, 569–570, 97–104. [Google Scholar] [CrossRef] [PubMed]
- Yuan, G.L.; Sun, T.H.; Han, P.; Li, J.; Lang, X.X. Source identification and ecological risk assessment of heavy metal in topsoil using environmental geochemical mapping: Typical urban renewal area in Beijing, China. J. Geochem. Explor. 2014, 136, 40–47. [Google Scholar] [CrossRef]
- Chen, Y.; Jiang, X.; Wang, Y. Spatial characteristics of heavy metal pollution and the potential ecological risk of a typical mining area: A case study in China. Process Saf. Environ. Prot. 2018. [Google Scholar] [CrossRef]
- Hong, Z.C. Study on the Safety Critical Value of Mercury in 16 Vegetable Soils in Fujian. Master’s Thesis, Fujian Agricultural and Forestry University, Fujian, China, 2012. (in Chinese). [Google Scholar]


© 2020 by the authors. Licensee MDPI, Basel, Switzerland. This article is an open access article distributed under the terms and conditions of the Creative Commons Attribution (CC BY) license (http://creativecommons.org/licenses/by/4.0/).