Article

Productivity Evaluation of Tourism and Culture for Sustainable Economic Development: Analyzing South Korea’s Metropolitan Regions

1
Korea Culture & Tourism Institute, Seoul 07511, Korea
2
Department of Tourism and Convention, Pusan National University, Busan 46241, Korea
*
Author to whom correspondence should be addressed.
Sustainability 2020, 12(7), 2912; https://doi.org/10.3390/su12072912
Submission received: 17 March 2020 / Revised: 1 April 2020 / Accepted: 3 April 2020 / Published: 6 April 2020
(This article belongs to the Special Issue Sustainability in Tourism and Economic Growth)

Abstract

:
We analyzed the productivity of tourism- and culture-related economic activity in South Korea, adopting the Malmquist productivity index based on data envelopment analysis. We examined whether the productivity of tourism efficiently attracts financial investment. We used various objective indicators as the input and output variables of 16 metropolitan regions in South Korea between 2013 and 2018. To effectively understand the productivity of regions, the 16 metropolitan regions were categorized into four groups based on the ratio of financial independence and rate of city region, and regions were characterized as urbanized, traditional metropolitan, industrialized, or less developed. The findings reveal that the tourism industry in relatively less urbanized regions is more productive. Compared with other industries, public pre-investment and private investment strategies specific to tourism may yield more efficient results in terms of total production and employment. In other words, tourism may constitute a gateway to economic sustainability in less developed regions through the revitalization and/or balanced development of local structures.

1. Introduction

Tourism has steadily grown as a global economic force since the 1960s [1]. According to the United Nations World Tourism Organization (further UNWTO), tourism is the world’s largest growing industry and one of the strongest drivers of world trade and prosperity [2,3]. The economic benefits for the host destinations include foreign exchange earnings, numerous opportunities for direct and indirect employment [4,5,6,7], driving public and private investments in tourism at various destinations levels (e.g., countries, cities, regions, and sites), building necessary infrastructure and superstructure, and overhauling existing infrastructure and superstructure to maximize tourism receipts [8]. The economic potential of tourism is arguably more prominent for the developing world, as the UNWTO reported that tourism is a key player in the economies of the 48 least developed countries (LDCs) [9]. However, the economic potential of tourism is significant for all nations around the globe, affecting destinations at all levels within or across countries. For instance, within developed countries, the economic development potential of tourism may vary drastically among local destinations based on socioeconomic status. Less developed areas with fewer income sources may rely on tourism infrastructure and operations, which are mostly made possible with public funding.
Public financing is a policy instrument commonly used for regional sustainable development and growth. However, not every region has access to the same level of financial resources, especially with respect to tourism. Regions differ in their social and environmental conditions and, hence, in their financial prospects. Therefore, financial investment decisions require the evaluation of public and private investment outcomes in terms of added value, employment, and so on. One evaluation method used in the tourism context is the analysis of the total factor of productivity of regional industries including tourism- and culture-related industries.
To determine whether tourism can contribute to regional economic sustainability, as the UNEP (United Nations Environment Programme) and UNWTO [10] argued, we conducted a productivity analysis and provide economic evidence for the sustainable development potential of tourism-related industries. We primarily attempted to identify the most productive method to allocate investment based on the productivity of regional tourism- and culture-related industries. In which region should tourism-related industries be invested in considering its productivity?
We used the metropolitan regions of South Korea for analysis due to the lack of research into economic productivity related to tourism on a subnational scale [11]. Most studies examined the productivity of hospitality and tourism at the micro level. To economically benefit from and boost tourism for regional development, South Korea has been increasing investment in tourism. Therefore, we aimed to evaluate the productivity of regions’ tourism- and culture-related industries over time.

2. Literature Review

2.1. The Economic Impact of Tourism

UNWTO stated that tourism is a vehicle that contributes to economic growth and development. Tourism is reported to be one of the world’s top job creators and a leading source of export, especially for developing countries. According to UNWTO 2018’s annual report, tourism supported 319 million jobs (10% of total global jobs) and contributed USD $8.8 trillion to the global economy, outpacing the growth of the world economy [12]. Over time, tourism has proven to be a strong economic driver in the world, recording sustainable economic growth for nine consecutive years [12] and the second-highest growth of any economic player in the world [2]. Similarly, the UNWTO 2019 annual report stated that the revenue earned from visitors in tourism has grown faster than the world economy [3]. The business volume of tourism is equal to or greater than other global business industries like oil, food, and automobile exports and imports [13]. The role of tourism in economic sustainability is expected to grow; the World Travel and Tourism Council forecasted tourism to create 100 million new jobs in 10 years and 421 million jobs by 2029 [2].
Although opportunities to improve the economic condition of regions through tourism are of key significance and many countries invest in tourism because of this, economic development impacts the environment and social and cultural conditions [10]. The revenue earned can be used to increase investment in infrastructure and renewing communities’ social spaces, which in turn increase the quality of locals’ lives [8,14,15]. When unique local culture and tradition become sources to attract tourists and the tourism spurs economic growth in the region, the local community can strengthen the value of their culture as well as their pride [16,17,18]. In addition, tourism income can have positive environmental impacts in that revenue can be invested to enhance and protect environmental conditions, such as preservation of natural and cultural heritage sites as well as maintaining biodiversity [8,19]. In contrast, unplanned tourism development and inadequate investment in tourism can negatively impact all dimensions, such as increases in prices and living costs, revenue leakage, irreversible environmental degradation, an increase in temporary employment, destruction of heritage, pollution, conflicts with locals, loss of traditional values, and others [19,20,21,22,23,24]. Therefore, sustainable methods are needed to instrumentalize tourism for regional development and to optimize the use of resources to create a significant and positive economic, environmental, and social transformation.
In line with the positive impacts of tourism, UNEP and UNWTO explained what the sustainability principle means in tourism: “Sustainability principles refer to the environmental, economic, and socio-cultural aspects of tourism development, and a suitable balance must be established between these three dimensions to guarantee its long-term sustainability” [10]. Tourism plays a critical role in achieving sustainable tourism development as well as world development. UNTWO identified that tourism can help achieve the Sustainable Development Goals (SDGs) initiated primarily to eradicate poverty, provide opportunities for economic prosperity, and protect our planet for everyone by 2030. According to the UNWTO, tourism can provide decent jobs (Goal 8), ensure sustainable economic activities (Goal 12), and protect the environment (Goal 14). The economic dimension of sustainability is emphasized for the role of tourism concerning the SDGs.
From the economic sustainability perspective, tourism development should ensure long-term economic impact, not temporary outcomes. Positive economic impact can be characterized as creating economic conditions to attract investment such as the potential to create and maintain stable job opportunities and ensure financial prosperity from tourism. This perspective is in line with Garrigós-Simón et al.’s [20] definition of economic sustainability of tourism “…as the net economic improvements for the local economy that tourism development can produce in the long term, taking into account all the diverse impacts that affect the different sectors and industries of the local economy.” As indicated by this definition, long-term economic sustainability is possible only when a positive long-term economic outcome is ensured. Therefore, the economic performance of tourism in any region must be evaluated to determine whether tourism contributes not only to economic growth but also to sustainable economic growth.

2.2. Contextual Setting: Overview of Tourism in South Korea

Indicating the importance of tourism and its relationship to economic activities, tourism is estimated to account for 5.1% of total gross domestic product (GDP) and 1.5 million employees, that is, 5.8% of the total national employment [25]. South Korea has made numerous efforts to boost tourism in both international and domestic markets. At the national level, South Korea ranked ninth in the world as a tourism export country in 2018, and a total of 28 million people traveled abroad [26]. South Koreans spent USD $28.4 billion overseas. However, South Korea received only 15 million foreign tourists in the same year, and they spent USD $15.2 billion in Korea. Korean tourism recorded a deficit of $13.2 billion, which it has been running for eight consecutive years since 2000 [26]. Although deficits have been occurring for many years, the gap was reduced in 2017 to $14.75 billion. Korea is looking to improve its economic performance in the future. As President Moon Jae-in said at the National Tourism Strategy Conference on 2 April 2019, “Korea also has a great chance of developing into a surplus of tourism” and “the government promises to support the inbound travel industry to attract more foreign tourists” [27].
Perspectives on Korea’ efforts in investing in tourism have been improving. In terms of increasing awareness, South Korea has hosted three international-scale mega events: the 1988 Seoul Summer Olympics, the 2002 FIFA World Cup, and the 2018 PyeongChang Winter Olympics. The successful hosting of the 2018 PyeongChang Winter Olympics showed that investing to bid and host Olympic events can be financially beneficial with a low budget and a high efficiency, even though other recent Olympics have been financial disasters [28]. These mega events helped place South Korea on the world tourism market.
South Korea continued to establish a better tourism environment through promotions and improving competitiveness, including national tourism promotion strategy meetings and national tourism development plans. In particular, the Ministry of Culture, Sports, and Tourism decided to increase financing of the tourism industry from 490 billion Korean won (KRW) in 2019 to 550 billion KRW in 2020. In 2020, KRW 1.38 trillion was added to the total tourism sector budget [29]. With investment and improvement, Korea’s ranking of tourism competitiveness by country, announced annually by the World Economic Forum, has also increased steadily. It rose from 42nd place in 2007 to 16th place in 2019 [30,31]. As a result of these efforts, the number of foreign tourists in Korea is increasing year by year.
Although international tourism may contribute significantly to South Korea’s economy, reliance on international tourism may prove risky due to the vulnerability of tourism to externalities [32,33]. Therefore, invigoration of domestic tourism might be necessary to form a more diversified and sustainable demand [34]. The domestic market has grown since South Korea introduced a five-day work week in 2002, which allows people to take short trips over the weekend. This policy provided opportunities for regional governments to focus on attracting domestic tourists. Although mainstream business industries are located in the capital and metropolitan cities, other regional towns lack the industry and business to grow the local economy. For those regional cities, tourism is considered an opportunity to grow the economy and create jobs. Therefore, they seek for methods to attract tourists by developing tourism activities, programs, and infrastructure. To develop tourism resources, regional governments need financial resources for building amenities and infrastructure and creating tourism programs. However, they often lack sufficient capital [34] and instead turn to public and private investment sources. When most regions in Korea are competing to attract the highest number of tourists in hopes of economic prospects, the fundamental question remains the same for potential public and private investors before any funding decision: is tourism necessarily the most promising investment area to begin with especially compared to alternatives, such as information technologies? Therefore, measuring tourism’s performance over resource input is crucial for any argument of the economic justifiability of tourism investment in underdeveloped regions.

2.3. Data Envelopment Analysis (DEA) and Malmquist Productivity Index (MPI)

Tourism performance can be assessed by data envelopment analysis (Further DEA) and the Malmquist productivity index (Further MPI) as productivity measurement approaches [35,36]. DEA is a nonparametric technique that is independent of statistical assumptions and known to be the most representative efficiency measurement methodology. It is useful when using parametric approaches is difficult due to the small number of decision-making units (DMUs). DEA identifies the best DMUs by applying linear programming to each DMU inputs and outputs, based on Farrell’s [37] concept of frontier efficiency. By constructing the frontier, the relative efficiency is measured by calculating the distance from the frontier for inefficient DMUs. Although the DEA was shown to be useful for measuring efficiency, it cannot measure changes in efficiency over time [38]. DEA is basically a statistical analysis methodology that does not consider change over time. Therefore, another methodology must be considered to analyze the dynamic productivity of each DMU [39].
The MPI is a useful approach for estimating the degree of productivity growth and trends of change over time [40,41,42]. The MPI and methodology are also referred to as DEA Malmquist [43]. Using MPI, the productivity change can be decomposed into a technological change index and an efficient change index [11,39,44,45]. More specifically, DEA-based MPI does not only compare productivity between two different time periods but also measures productivity by relative performance of DMUs in different time periods considering the operating conditions of each DMU [38,44]. Thus, the MPI can be decomposed into an index that reflects efficiency differences within each DMU and the productivity differences between DMUs’ best practice frontiers. According to Camanho and Dyson [44], MPI is the standard nonparametric approach to measure productivity over time.

2.4. DEA and MPI in Tourism and Hospitality

Economic performance evaluation has long been a topic of interest in tourism and hospitality research. The evaluation of the tourism industry’s performance has been discussed since the 1990s [46]. Many different methodological approaches have been constructed, such as the stochastic translog frontier [47], Luenberger productivity indicator [46,48], return on asset and return on investment [49], Malmquist frontier index [50], the DEA [51,52,53,54,55,56,57,58,59], and MPI [11,35,36,60,61,62]. However, traditionally, DEA has been the most popular approach to evaluate operation and management efficiency and has focused primarily on small-scale hospitality and tourism businesses like hotels [54,55,63], restaurants [57,58,59], and travel agencies and departments [53,64]. Whereas literature on DEA is noticeably larger than other methods [60], even in tourism studies, scholars stated that the DEA method must be extended by combination with another methodology due to its inability to measure the economic performance evaluation over time change [11,39,60]. Tourism is a highly seasonal industry; thus, methodologies that can evaluate productivity changes over time needed to be considered [65].
More recently, another evaluative method based on DEA-MPI, known as total factor productivity, has been employed to assess the performance of the tourism and the hospitality industry, which is posited to overcome DEA’s limitation of measuring changes in efficiency over time [38,39,66]. Barros and Alves [61] were some of the first to evaluate the performance of hotels using DEA-based MPI. They analyzed 42 publicly owned Portuguese hotels in a chain called Enatur using input and output data from 1999 to 2001, including sales, number of guests, and nights spent as output and full-time workers, labor costs, book value of the property, operating costs, and external costs as input. The authors identified some hotels with productivity growth and hotels with low performance on internal benchmarks. Barros [36] used the same sample and methodological approach, but a Tobit econometric model was additionally employed to identify the drivers for efficiency. Similar to a previous study, Barros and Dieke [64] again used the Malmquist model with the Tobit econometric model to estimate the performance of 25 travel agents in Portugal using profit and sales as output and wages, capital total cost excluding wages, and book value of premises as input [64]. In the context of a different country, Assaf and Barros [60] examined the performance of hotel chains in Gulf countries (i.e., the United Arab Emirates, Saudi Arabia, and Oman) and compared the performance using the MPI built around DEA. Yu and Chen [35] used a DEA-based Malmquist productivity index to estimate the cross-period performance of 54 international hotels and compared the average growth in performance of international chain hotels and independent hotels in Taiwan from 2008 to 2011. The authors used revenue of room, F&B (Food and Beverage), and other operations as output, and the number of rooms and employees, the total floor area of F&B, and other expenses as input. Malmquist based on DEA was mainly used to evaluate the performance of hospitality business but relatively less for tourism destination settings. The hospitality business used almost similar variables for input and output. Mainly sales and profit were used as outputs and employment cost, operating cost, and book value of the property as inputs.
Few studies in the literature provide insight into the performance evaluation of tourist destinations. Bosetti et al. [67] evaluated and compared 20 Italian regions for tourism management performance in relation to environment management and tourism services. They mainly used DEA to evaluate efficiency based on 2003 but also calculated the total factor productivity with MPI from 2001 to 2003 to understand the dynamic change in performance over time. For the study, the number of tourists, homogeneity of tourism flow during the base year, and percentage of protected area were used as outputs; market size, public expenditure in environmental production and in tourism management and advertising, and tourism development index were used as inputs. Cracolici et al. [68] also evaluated the performance of 103 Italian regions. The efficiency was analyzed for the year 2001 using DEA, and the change in productivity was investigated over four years from the base year of 2001 with Malmquist. They used international and national bed nights as the output and the number of beds in hotels and in complementary accommodations, cultural heritage sites, population of tourism school graduate in their working age, and the number of employees in tourism industry as inputs. As a result of this analysis, the study addressed the performance index with destination competitiveness and effective resource management of tourist destination. Another study measured the total factor productivity (known as MPI) of the tourism industry in China between 2001 and 2009 using domestic and inbound tourism income as output and the number of employees and the capital of fixed asset as input. They additionally compared the MPI of three clusters of 20 different regions classified by the total factor productivity change index in the tourism industry [11]. Destination performance evaluation studies differ somewhat depending on the destinations’ characteristics, the inputs and outputs used varied. Whereas tourist visits were considered as the output, one study only used visitors who stayed overnight in the region [68]. Bosetti et al. [67] used percentage of protected area as an out variable because the aim of the study was to under implications for managing protected areas. Additionally, the use of employment as an output variable in the studies should be mentioned. Although human resource in business is output, in tourism development, specifically sustainable tourism development, the aim is to create jobs through tourism [12]. Thus, when examining the tourism performance in the regions, the employment number should be considered as an output variable.
A review of the literature indicated that most of the performance evaluation research is mainly concentrated in a few geographical locations such as the United States [57,58,59], the U.K. [54], Portugal [36,51,61,63], Taiwan [65,66], a few Middle Eastern countries (UAE, Saudi Arabia, and Oman) [60], and Italy [68,69]. This shows that many international destinations need to be evaluated for performance because destination characteristics widely differ by nation and region. An additional gap identified is that little attention has been paid to the performance of a destination in the tourism industry compared to the hospitality sector. Use of employment as output should be considered in the context of the tourism industry’s performance in regional development. Last, previous studies mainly focused on micro-level businesses and lacked analysis of national- and subnational-level destinations. Assaf and Dwyer [50] stated that productivity measurement of the tourism industry can be useful for public policy and regulation. Therefore, to optimally manage and use any resources for tourism to achieve economic growth of a country or region, the productivity should be evaluated. With this study, we aimed to address the gap identified above.

3. Methodology

3.1. Data Selection: Decision Making Unit (DMU), Input, and Output

We classified 16 metropolitan regions in the Republic of Korea into similar regional groups based on the ratio of financial independence and the rate of city region (Table 1). The ratio of city region is defined as the ratio of the urban to rural population by Statistics Korea, whereas the ratio of local financial dependence is calculated by comparing the amount of transfer revenue received by the region to the total local revenue [70]. Figure 1 shows that we identified four DMUs for further analysis: Group 1 (Grp1): SEL; Group 2 (Grp2): BSN, GWJ, DGU, and GJN; Group 3 (Grp3): ICN, USN, and GGI; and Group 4 (Grp4): GWN, CCB, CCN, JLB, JLN, GSB, GSN, and JJU (see Table 1 for Region’s Label). In terms of regional characteristics, Grp1 is the region with the highest fiscal independence and urbanization. Grp2 includes the traditional metropolitan areas with less than 60% fiscal independence. Grp3 is characterized by fiscal independence rates higher than 60%, but urbanization rates less than 60%. Cities in Grp3 have experienced rapid development since industrialization began to grow in the 1970s. Grp4 includes less developed countries with low financial independence and a low urbanization rate.
Table 2 provides descriptive statistics on the input and output variables used in this study. To identify the efficiency of financial investment into tourism and culture, three separate industry statistics were used in this study: the entire industry in the Republic of Korea, only the culture and tourism industry, and other industry. The culture and tourism industry specifically includes art, sports, the leisure-related service sector (ASLS), and the accommodation and food sector (AFS) based on industrial classification. We then considered total budget for each industry as the public sector input and the number of establishments and number of hotel rooms as private sector input. The financial investment/budget for the culture and tourism industry has a relatively smaller average value than other industry (approximately 4.8% of the total budget), although the number of establishments in the tourism and culture industry comprises a slightly higher average proportion compared to the other industry (approximately 21.3% of the total establishments). Two different output variables were considered in this study: gross value added induced by each industry and employment by each industry. Similarly, value added for the tourism and culture industry was approximately 5.5% of the gross value added, whereas the number of employees was approximately 12.1% of total employment in Korea. Last, the number of employees was also used as an input when considering the value added as the output.

3.2. Analysis Metrics

The MPI is based on the calculated distance function of the efficiency measure. The MPI measures the change between different time points (t, t + 1,…, t + n) of the DMUs. There are input-oriented and output-oriented models; however, we used the input-oriented model to measure the efficiency of the tourism industry. The productivity index of Dt and Dt+1 are expressed in Equations (1) and (2), respectively: x t , y t and x t + 1 , y t + 1 are the input factors (x) and output factors (y) for each time period of t and t + 1, respectively; and Dt and Dt+1 are the models for calculating distance value at the technology level of each period. The values of M(t) and M(t + 1) represent the productivity value, and Färe et al. [42] defined the input-based Malmquist productivity change index as:
M t = D c t x t + 1 ,   y t + 1 D c t x t ,   y t
M t + 1 = D c t + 1 x t + 1 ,   y t + 1 D c t + 1 x t ,   y t
M x t + 1 , y t + 1 , x t , y t = D c t x t ,   y t D c t x t + 1 ,   y t + 1 × D c t + 1 x t ,   y t D c t + 1 x t + 1 ,   y t + 1 1 2 = D c t x t ,   y t D c t + 1 x t + 1 ,   y t + 1 × D c t x t ,   y t D c t x t + 1 ,   y t + 1 × D c t + 1 x t ,   y t D c t + 1 x t + 1 ,   y t + 1 1 2
The productivity contribution by industry by MPI ( E t ) is calculated as the tourism industry ( M t 1 ) for period t divided by the total tourism industry ( M t n ) period t. The equation can be expressed as follows:
E t = M t l M t n
where E is the contribution rate, t is the period (or time), l is the type of business, and n is total business.
We followed the analysis approach of the input-based Malmquist productivity change index specified by Färe et al. [42].

4. Results

4.1. Gross Value Added

We calculated the MPI values for four DMUs based on two different output variables, that is, gross value added and employment in three industries: the total industry, culture- and tourism-related industry, and other industry. Figure 2 describes the estimated MPI for the total industry in the Republic of Korea using the gross value added as outcome and total budget (TB), total business establishments (TBE), and total employment (TE) as inputs. In general, the value added created by all industries from 2013 to 2018 appeared to be slightly lower: from 1.010 in 2013–2014 to 0.998 in 2017–2018. By group, the Grp1 MPI ranged from 0.974 in 2013–2014 to 0.970 in 2017–2018, 1.028 to 0.996 in Grp2, 1.015 to 1.004 in Grp3, and from 1.023 to 1.000 in Grp4. Grp3 and Grp4 showed a relatively higher productivity based on MPI values.
Next, Figure 3 shows the MPI of tourism- and culture-related industry based on culture and services Value Added (CSVA) and accommodation and food services VA (AFSVA) as outputs, and culture and tourism budget (CTB); the number of establishments for art-, sports-, and leisure-related services sector (ASLS); accommodation and food sector (AFS); the number of employees for art-, sports-, and leisure-related services (ASLSE); and accommodation and food services (AFSE) as inputs. In general, the overall trend showed a slightly higher volatility between 2013 and 2014 and 2017 and 2018. Two noticeable downturns (i.e., 2014–2015 and 2016–2017) can be explained by the external uncertainty, for example, MERS (Middle East Respiratory Syndrome) and THADD (Terminal High Altitude Area Defense), which significantly influenced the travel and tourism industry in Korea. Grp1 showed a larger variation in MPI across the year than other groups, Grp3 and Grp4 showed improvement in MPI in 2017–2018.
Last, as shown in Figure 4, the MPI was calculated for other industry not related to the tourism- and culture-related industry based on other VA (OVA) as the output, and other budget (OB = TB − CTB), other business establishments (OBE), and other employments (OE) as the inputs. This value was used as a benchmark to understand the efficiency and productivity of tourism and culture-related industry. Unlike tourism- and culture-related industry, the MPI values across years seem stable with a slight downward trend after 2013–2014. Note, three groups (Grp2, Grp3, and Grp4) showed a value higher than 1 in 2013–2014, whereas only Grp3 maintained a value higher than 1 in 2017–2018. This result indicates that the MPI decreased for all regions except for the industrialized/urbanized regions.

4.2. Employment

Then, we calculated the MPI regarding the employment for three industries and four DMUs based on the budget and establishments of each industry. Figure 5 describes the MPI of total employment based on total budget (TB) and total business establishments (TBE). Figure 5 shows that all four DMUs showed a technological improvement in 2014–2015 and thereafter compared to 2013–2014. Particularly, Grp3, with industrialized characteristics, had MPI values generally higher than one through 2013–2014 and 2017–2018.
Then, the MPI of tourism- and culture-related employment was calculated using the number of establishments for the art-, sports-, and leisure-related sector (ASLS); accommodation and food sector (AFS); and number of hotel rooms (NHR) as the inputs, and the number of employees for air-, sports-, and leisure-related services (ASLSE) and accommodation and food services (AFSE) as outputs. As can be seen in Figure 6, tourism- and culture-related employment MPI was lower than one for all groups in 2013–2014, indicating lower efficiency for job creation. However, tourism- and culture-related employment MPI was found to be higher than one for Grp2 and Grp4 in 2017–2018. The results indicated that Grp2 with traditional metropolitan city characteristics and Grp4 with less developed area characteristics, having low finance and urbanization rates, had a high MPI for job creation in the tourism- and culture-related industry.
Next, we calculated the employment MPI of other industries (excluding tourism- and culture-related industries) using other budget (OB) and other business establishments (OBE) as the inputs and other employment (OE) as the output. Although all groups showed a value higher than one in 2014–2015, the variation in the MPI among the four groups increased in 2015–2018 and in 2013–2015, indicating a different effect on employment depending on the core industry of the region, for example, traditional manufacturing or the tourism- and culture-related industry (see Figure 7).

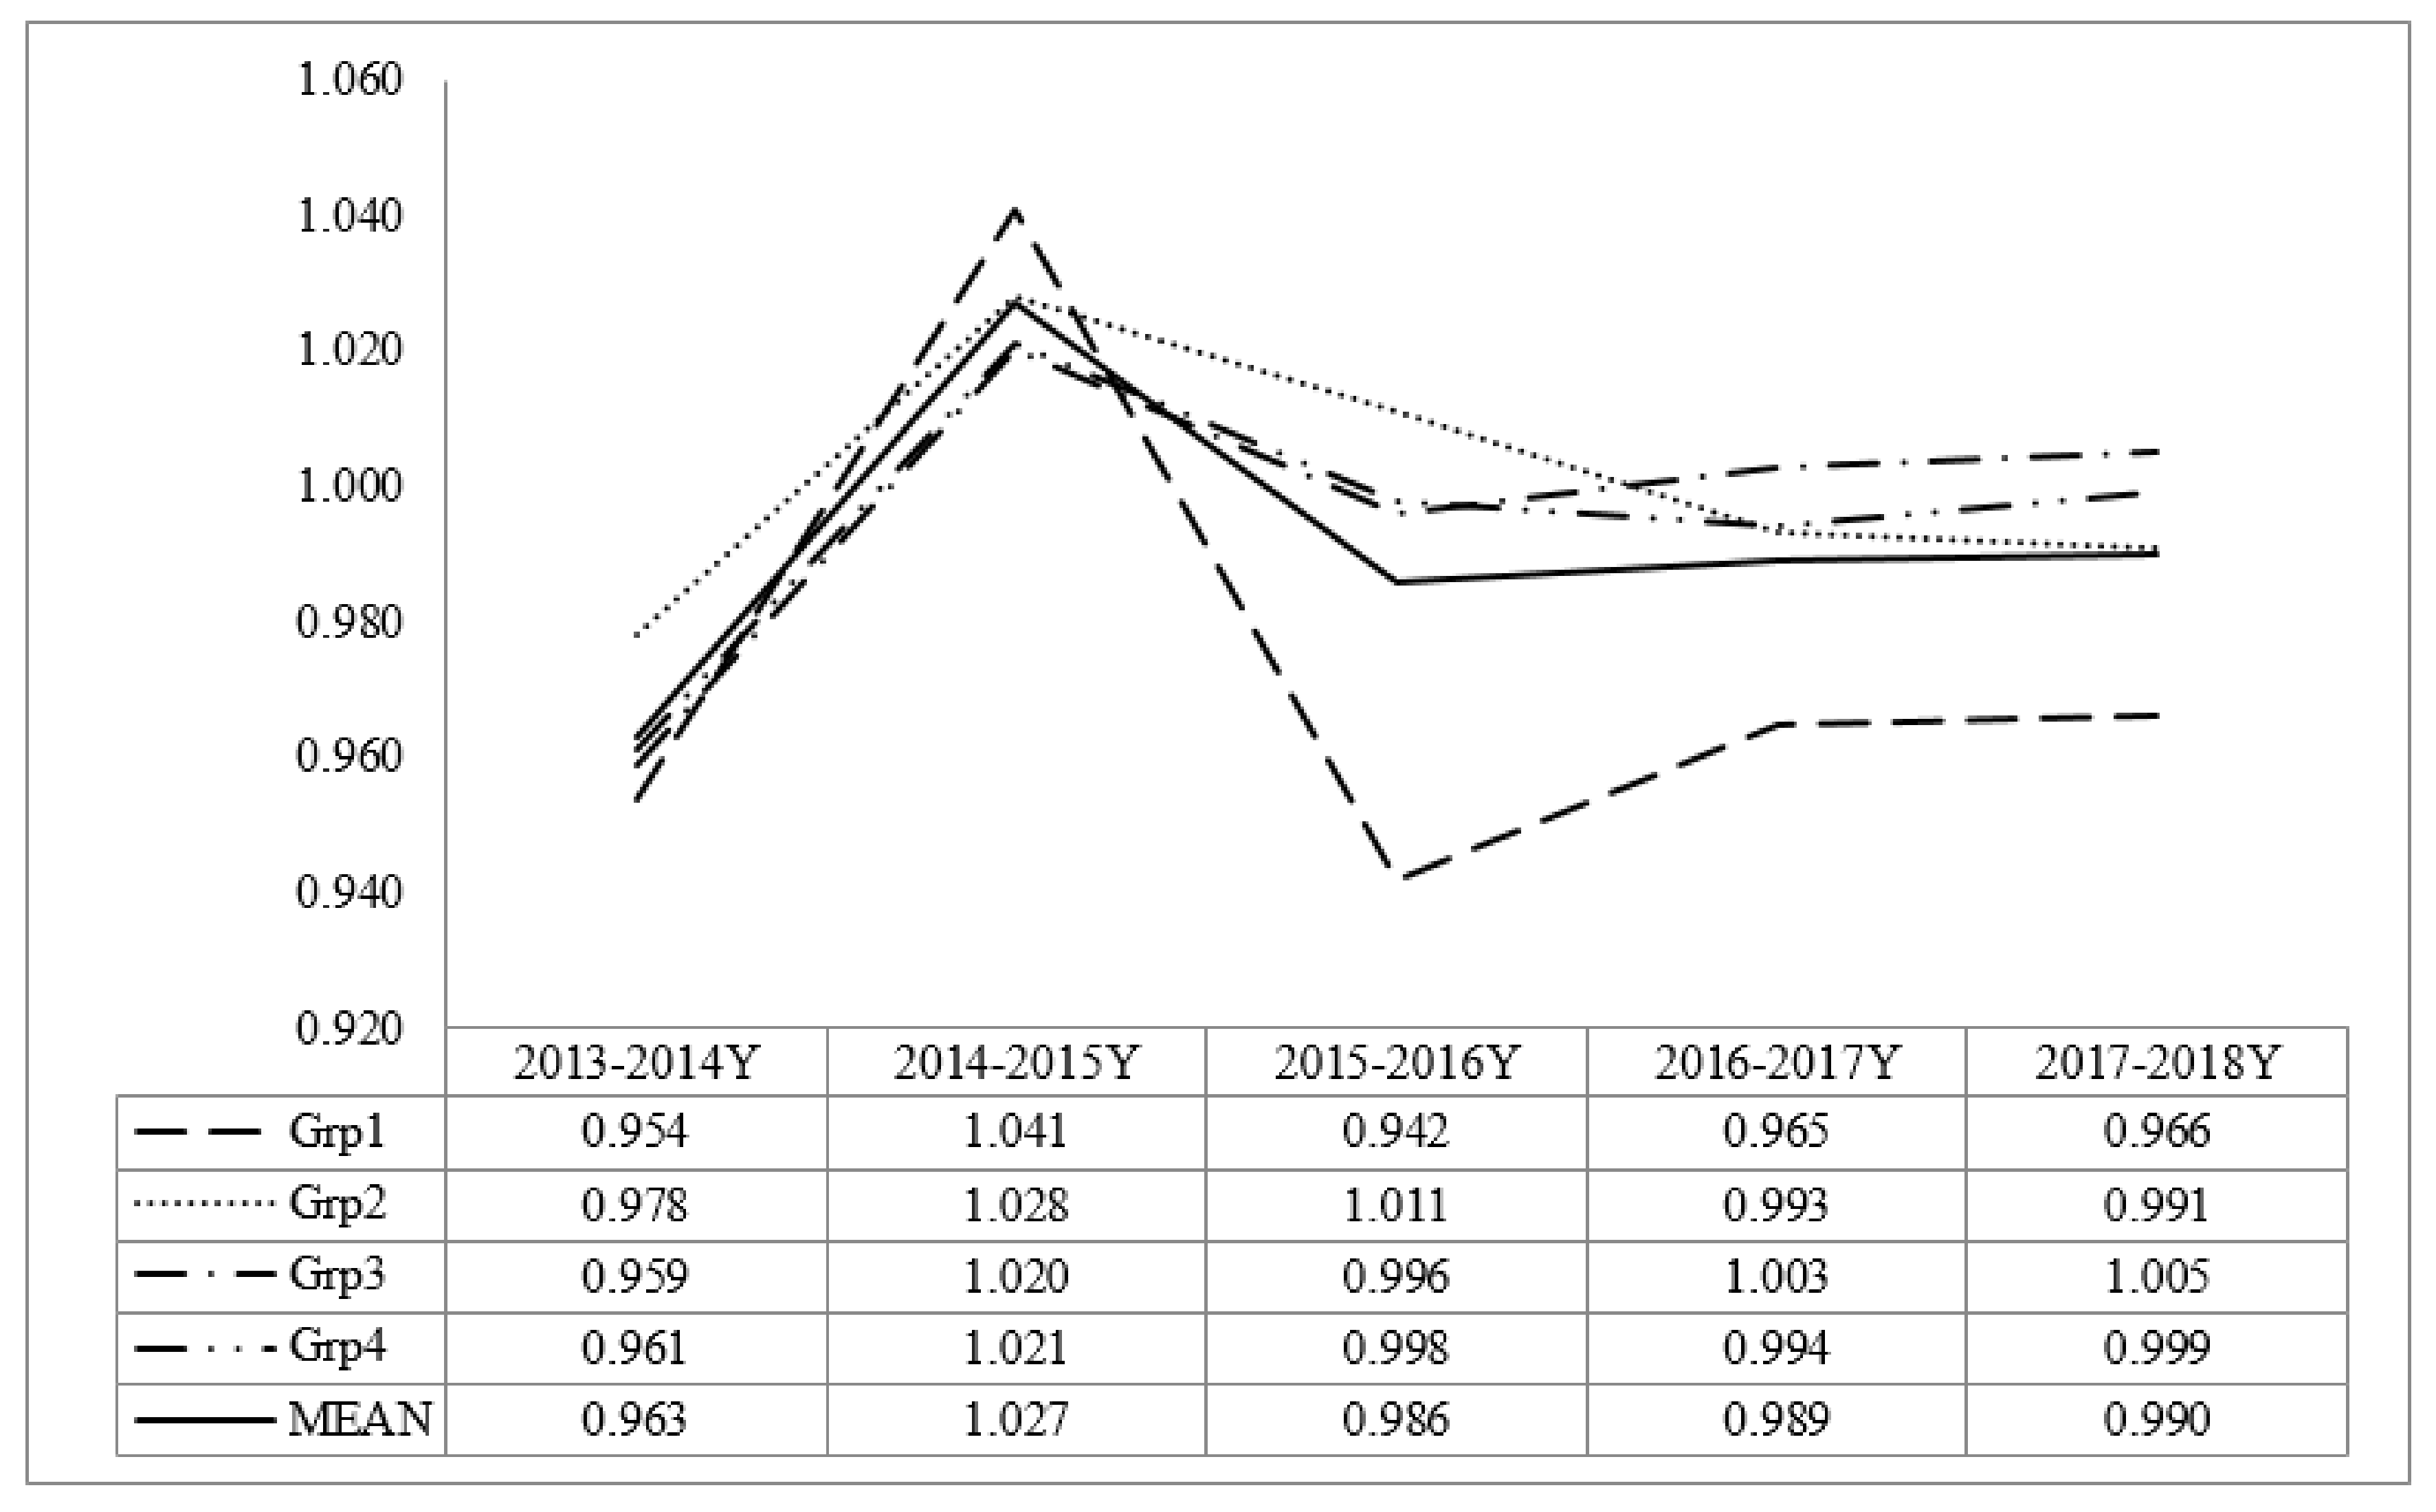
4.3. Comparison of Averaged MPI Values between Industries

Last, we compared the average MPI values for both added value and employment among industries (Figure 8). As can be seen in Figure 8, Grp1, characterized by high financial independence and urbanization rates, had low value-added creation and job creation for all industries (all values < 1). Grp2, characterized by a traditional metropolitan city with a high urbanization rate but low financial independence, had a value higher than one for the job creation MPI of all industries and other industries, but the productivity of added value was still less than one. Grp3, characterized by high financial independence but a low urbanization rate, had a value exceeding one for value-added creation in all industries, value-added creation in other industries, and employment creation in other industries. Grp4, characterized by less developed areas with low financial independence and a low urbanization rate, had high productivity in creating added value for all industry.
We additionally analyzed the effect of financial investment on tourism- and culture-related industry in different regions by comparing added value and employment creation among the four DMUs. Specifically, the value-added MPI of industrialized cities (Grp3) and less developed areas (Grp4) was higher than that of Grp1 and Grp2. The employment MPI was higher in traditional cities (Grp2) and less developed areas (Grp4) than for Grp1 and Grp3. In general, Grp4 had a value of lower than one; however, this value proved to be relatively higher than the other three groups, thereby indicating potentially high return on investment for financial investment in the region.
Last, we calculated the ratio of improvement on MPI between 2017 and 2018Y and 2013 and 2014 for each of the four groups. This value generally indicated an overall trend in technical efficiencies and improvements over time. As can be seen in Figure 9, the improvement ratio of the tourism- and culture-related industry was higher than that of other industry, meaning that the productivity of the tourism- and culture-related industry continuously improved between 2013 and 2018. Our findings support sustainable economic growth for the tourism- and culture-related industry through continuous improvement in productivity.

5. Discussion and Conclusions

Performance evaluation is critical for managing resources. According to Peypoch and Solonandrasana [46], the measurement of productivity and efficiency is useful in the optimal management of resources. Similarly, Assaf and Dwyer [50] emphasized the need for performance evaluation to assist with decisions relevant to public policy and regulation, especially for the tourism industry. In the performance evaluation, the productivity and efficiency are measured by inputs and outputs. Previous studies showed that the selection of input and output variables differs depending on the scale or size of analysis targets (e.g., hotels, restaurants, and destinations). Here, we aimed to determine the productivity of efficiency of the tourism- and culture-related industry in South Korea to examine whether investment in the tourism sector would be economically sustainable for providing high return on the investment. Therefore, we used public and private investment in the tourism- and culture-related industry and in other industries as the inputs and gross value added and employment as the outputs. Selection of input and output variables is one of the contributions of this study to the performance evaluation of the study area. Whereas many studies so far used employment as input variable [11,68] for destination performance evaluation, we used employment as the output. This is supported by the notion of sustainable tourism; the role of tourism in terms of the economic dimension is to create jobs. To the best of our knowledge, no other studies used the value added as the outcome variable. This is also in line with the sustainable development goal of investing in tourism development creating value for the regions. We did not focus on tourist visits to a place as an output like in many previous studies. Other studies reported that the number of visitors does not guarantee economic prosperity. Because visitors to rural areas from urban locations and cruise tourists to islands only take half day or one day excursions [34,73,74], they do not contribute to the regional economics. Therefore, we focused on creating real economic value in the regions by considering employment and value added.
This empirical study offers other theoretical contributions to performance evaluation studies. Although many studies examined the economic performance of small-level business units like hotels and tour agencies [53,54,55,57,58,63,64], few studies used DEA-based Malmquist to evaluate the performance of the tourism industry at regional levels in a nation [11,67,68]. The economic performance evaluations of the hospitality and tourism industry has only included a few selected regions in the world, and South Korea was not included in this research area. In this study, we covered all 16 metropolitan regions in South Korea by clustering the regions into four groups based on the ratio of financial independence and rate of city region. The ratio of financial independence and rate of city region helped to characterize the regions as urbanized, traditional metropolitan, industrialized, or less developed regions. These four groups are known as DMUs in DEA. With a typical DEA, researchers are only able to understand productivity at specific time points for DMUs, which is known to be a limitation of the DEA. DEA does not consider changes over time. Therefore, if we only used DEA, the understanding of South Korea’s regional performance of tourism industry would have been limited to each time point. To evaluate whether the productivity of the tourism industry is improving, it is necessary to examine the changes. Therefore, as suggested by Lee at al. [36], another methodology was considered here. We considered using a modified version of the DEA, called DEA-based Malmquist, to illustrate the dynamic changes in the productivity and broaden the use of the approach to the destination context [11,63,64]. The limitation of the DEA methodology was overcome using the Malmquist index [44].
As a result, we captured the changes in productivity performance over time, which will help policy makers and entrepreneurs to understand the economic performance of their past investments by region. The results provide insight for future investments decisions regarding region and whether tourism- and culture related industry will produce a long-term economic return. The results showed that the performance of the tourism- and culture-related industry varies depending on the region conditions, including ratio of financial independence and level of urbanization. Specific to the gross value added, we found contradictory results from the UNWTO, which stated that large metropolitan areas are the center of consumption, pleasure, and leisure and, in general, are more productive [75]. The UNWTO’s report on city tourism started that urban tourism destinations receive substantial economic benefits in terms of employment and economic impact from the visitors because their demand triggers a continued investment in infrastructure [75]. However, our finding in the value-added measurement indicated that the productivity of Grp 1, Seoul, which is the capital city of South Korea and one of the major metropolitan cities in the world, fluctuated over time and showed the lowest productivity in two time periods. Additionally, Seoul’s employment value was always lower than one. The results indicated that resource management between input and output was imbalanced. One interpretation could be that more tourists concentrated in an area can be vulnerable to international incidences, such as the THAAD (Terminal High Altitude Area Defense) missile conflict between China and Korea that resulted in declining visitation from China, which is the largest tourist inbound market for South Korea [76]. The incident may have led to less output in the tourism industry compared to the input. Thus, policy makers and entrepreneurs should be aware that investing in mega-cities may result in higher productivity, but the risk is simultaneously greater. From the sustainability perspective, metropolitan cities may not provide long-term economic prosperity.
Policy makers should understand that productivity in the tourism-related industry better for other regions. If they are emphasizing the creation of added value in the regions, they should focus on investment in the tourism- and culture- related industry in Grp3 and Grp4 where the regions are less urbanized and relatively less financially independent than Grp1 and Grp2. The results indicated that Grp3 and Grp4′s MPI index fluctuated less than that of other regions, which means their economic performance was consistent and less influenced by external incidences. However, when employment was considered Grp 2 and Grp 4 performed better than other regions in the tourism- and culture- related industry. Combining both the added value and employment, Grp4 has a better chance to provide sustainable economic development. The regions in this DMU are indicated to be currently the least financially independent and the least urbanized. This finding in in lines with studies that found that tourism can be a tool for regional development [9,10,18,34].
The results of the MPI mean for the total added value and total employment over six years indicated that the tourism- and culture- related industry is less productive than the other industries. However, in terms of the MPI improvement ratio comparing 2017–2018 with 2013–2014, the tourism- and culture-relate industry had a higher added value and total factor productivity (TFP) based on job creation driven by technological innovation. Compared to the mean value, using the MPI improvement ratio is more helpful because it indicates the trend and helps to predict future trends. The government should make investment decisions based on where future opportunities than moments in time. Therefore, we focused more on the results of MPI improvement. The MPI improvement ratio showed that for all regional groups, the productivity of the tourism- and culture- related industry outperformed other industries in terms of the total added value and total employment. Grp2, Grp3, and Grp4 for the value added to the tourism- and culture- related industry showed a higher productivity than that of total industry. The employment in tourism- and culture- related industry also showed that Grp1, Grp2, and Grp3 outperformed the total industry. The overall results of MPI improvement provide empirical guidelines about how tourism can be a tool for sustainable regional economic development for policy makers and entrepreneurs.
In summary, we covered all metropolitan regions in South Korea and broadened the perspective of the economic position and performance of the tourism industry. We expanded the applicability of the methodology to destination management and tourism economics, providing insight into where the investment should be placed to produce optimized economic performance by indicating the regions that could economically perform sustainably in the long term. This perspective is supported by Garrigós-Simón et al. [20] who stated that net economic improvement can only result in regional tourism development in the long term. Thus, we concluded that this performance evaluation can be used as information for government policy makers and private investors to make efficient decisions for tourism development to determine whether to invest in tourism- and culture- related industry rather than other industry and where to invest for a better net economic improvement.
Tourism- and culture- related industry may not absolutely result in economical sustainability and development for all regions. As we have seen throughout the results, the productivity differs by the conditions in each region. Therefore, policy makers should consider the findings with caution when focusing on the productivity investment. Overall, South Korea’s tourism- and culture-related industry is seemingly a highly productive industry that has contributed to the region’s economics, adding value and generating employment by using the country’s diverse cultural resources. As the findings indicated, the productivity of public investment in tourism- and culture-related industry is higher in less developed areas. Tourism- and culture-related industry can become an alternative income source, which, per Carbone [77], provides economic sustainability as “economic sustainability refers to additional income provided to locals”. The underdeveloped areas where there are limited jobs and business opportunities may economically benefit from the multiplier effect of tourism. Limited financial resources can be maximized for the benefit of developing areas to increase the productivity of creating jobs when invested in tourism- and culture-related industry for the long term.

Author Contributions

Conceptualization, H.-J.J. and H.K.; Methodology, H.-J.J.; Formal analysis, H.-J.J.; Investigation, H.-J.J. and H.K.; Data curation, H.K.; Writing—original draft preparation, H.-J.J. and H.K.; Writing—review and editing, H.K.; supervision, H.-J.J.; project administration, H.-J.J.; funding acquisition, H.-J.J. All authors have read and agreed to the published version of the manuscript.

Funding

This work was supported by the BB21+ Project in 2020.

Conflicts of Interest

The authors declare no conflict of interest.

References

  1. Apostolopoulos, Y.; Sönmez, S. Working producers, leisured consumers: Women as producers and consumers of tourism in developing regions. In Women as Producers and Consumers of Tourism in Developing Regions; Apostolopoulos, Y., Sönmez, S., Timothy, D.J., Eds.; Praeger: Westport, CT, USA, 2001; pp. 3–17. [Google Scholar]
  2. WTTC Travel & Tourism Continues Strong Growth above Global GDP. Available online: https://www.wttc.org/about/media-centre/press-releases/press-releases/2019/travel-tourism-continues-strong-growth-above-global-gdp/ (accessed on 2 March 2020).
  3. World Tourism Organization UNWTO Tourism Highlights. Available online: www.e-unwto.org/doi/book/10.18111/9789284419876 (accessed on 11 July 2019).
  4. Sánchez del Río-Vázquez, M.-E.; Rodríguez-Rad, C.J.; Revilla-Camacho, M.-Á. Relevance of social, economic, and environmental impacts on residents’ satisfaction with the public administration of tourism. Sustainability 2019, 11, 6380. [Google Scholar] [CrossRef] [Green Version]
  5. Akadiri, S.; Akadiri, A.; Alola, U.V. Is there growth impact of tourism? Evidence from selected small island states. Curr. Issues Tour. 2019, 22, 1480–1498. [Google Scholar] [CrossRef]
  6. Archer, B.; Fletcher, J. The economic impact of tourism in the Seychelles. Ann. Tour. Res. 1996, 23, 32–47. [Google Scholar] [CrossRef]
  7. Choi, H.C.; Sirakaya, E. Sustainability indicators for managing community tourism. Tour. Manag. 2006, 27, 1274–1289. [Google Scholar] [CrossRef]
  8. Cooper, C.; Hall, C.M. Contemporary Tourism: An International Approach, 3rd ed.; Goodfellow Publishers: Oxford, UK, 2018; ISBN 1911396773. [Google Scholar]
  9. UNWTO. Tourism for Sustainable Development in Least Developed Countries: Leveraging Resources for Sustainable Tourism with the Enhanced Integrated Framework; World Tourism Organization (UNWTO): Madrid, Spain, 2017. [Google Scholar]
  10. UNEP and UNWTO Making Tourism More Sustainable-A Guide for Policy Makers. Available online: https://sdt.unwto.org/content/about-us-5 (accessed on 14 July 2019).
  11. Sun, J.; Zhang, J.; Zhang, J.; Ma, J.; Zhang, Y. Total factor productivity assessment of tourism industry: Evidence from China. Asia Pac. J. Tour. Res. 2015, 20, 280–294. [Google Scholar] [CrossRef]
  12. UNWTO. International Tourism Highlight; World Tourism Organization (UNWTO): Madrid, Spain, 2019; pp. 1–24. [Google Scholar]
  13. UNWTO. Why Tourism? Available online: https://www.unwto.org/why-tourism (accessed on 2 March 2020).
  14. Kim, K.; Uysal, M.; Sirgy, M.J. How does tourism in a community impact the quality of life of community residents? Tour. Manag. 2013, 36, 527–540. [Google Scholar] [CrossRef]
  15. Jurowski, C.; Daniels, M.J.; Pennington-Gray, L. The distribution of tourism benefits. In Quality Tourism Experiences; Jennings, G., Nickerson, N.P., Eds.; Elsevier: London, UK, 2006; pp. 192–207. [Google Scholar]
  16. Murzyn-Kupisz, M.; Działek, J. Cultural heritage in building and enhancing social capital. J. Cult. Herit. Manag. Sustain. Dev. 2013, 3, 35–54. [Google Scholar] [CrossRef]
  17. MacDonald, R.; Jolliffe, L. Cultural rural tourism: Evidence from Canada. Ann. Tour. Res. 2003, 30, 307–322. [Google Scholar] [CrossRef]
  18. Lynch, M.F.; Duinker, P.; Sheehan, L.; Chute, J. Sustainable Mi’kmaw cultural tourism development in Nova Scotia, Canada: Examining cultural tourist and Mi’kmaw perspectives. J. Sustain. Tour. 2010, 18, 539–556. [Google Scholar] [CrossRef]
  19. Holder, J.S. Pattern and impact of tourism on the environment of the Caribbean. Tour. Manag. 1988, 9, 119–127. [Google Scholar] [CrossRef]
  20. Garrigós-Simón, F.J.; Galdón-Salvador, J.L.; Gil-Pechuán, I. The economic sustainability of tourism growth through leakage calculation. Tour. Econ. 2015, 21, 721–739. [Google Scholar] [CrossRef]
  21. Ross, G.F. Resident perceptions of the impact of tourism on an Australian city. J. Travel Res. 1992, 30, 13–17. [Google Scholar] [CrossRef]
  22. Belisle, F.J.; Hoy, D.R. The perceived impact of tourism by residents a case study in Santa Marta, Colombia. Ann. Tour. Res. 1980, 7, 83–101. [Google Scholar] [CrossRef]
  23. Yang, L.; Wall, G. Authenticity in ethnic tourism: Domestic tourists’ perspectives. Curr. Issues Tour. 2009, 12, 235–254. [Google Scholar] [CrossRef]
  24. Cole, S. Beyond authenticity and commodification. Ann. Tour. Res. 2007, 34, 943–960. [Google Scholar] [CrossRef]
  25. OECD Korea. OECD Tourism Trends and Policies 2018; OECD Publishing: Paris, France, 2018; pp. 215–220. [Google Scholar]
  26. Tourism Information System Tourism Statistics. Available online: https://www.tour.go.kr (accessed on 17 March 2020).
  27. Park, K.-J. President Moon attended the National Tourism Strategy. “Tourism surplus is possible if we make it attractive”. Yunhap 2019. [Translated]. Available online: https://www.yna.co.kr/view/AKR20190402098851001 (accessed on 17 March 2020).
  28. Kim, H.; Choe, Y.; Kim, D.; Kim, J.J. For sustainable benefits and legacies of mega-events: A case study of the 2018 PyeongChang Winter Olympics from the perspective of the volunteer co-creators. Sustainability 2019, 11, 2473. [Google Scholar] [CrossRef] [Green Version]
  29. Ministry of Culture, Sport and Tourism. 2020 Budget Plan for Tourism Policy and Industry. Available online: https://www.mcst.go.kr/ (accessed on 17 March 2020).
  30. World Economic Forum. The Travel & Tourism Competitiveness Report 2017; World Economic Forum: Geneva, Switzerland, 2017. [Google Scholar]
  31. World Economic Forum. The Travel & Tourism Competitiveness Report 2019; World Economic Forum: Geneva, Switzerland, 2019. [Google Scholar]
  32. Bojanic, D.C.; Lo, M. A comparison of the moderating effect of tourism reliance on the economic development for islands and other countries. Tour. Manag. 2016, 53, 207–214. [Google Scholar] [CrossRef]
  33. Hoti, S.; McAleer, M.; Shareef, R. Modelling international tourism and country risk spillovers for Cyprus and Malta. Tour. Manag. 2007, 28, 1472–1484. [Google Scholar] [CrossRef]
  34. Seckelmann, A. Domestic tourism—A chance for regional development in Turkey. Tour. Manag. 2002, 23, 85–92. [Google Scholar] [CrossRef]
  35. Yu, M.M.; Chen, L.H. Productivity growth of taiwanese international tourist hotels in a metafrontier framework. Cornell Hosp. Q. 2016, 57, 38–50. [Google Scholar] [CrossRef]
  36. Barros, C.P. Evaluating the efficiency of a small hotel chain with a Malmquist productivity index. Int. J. Tour. Res. 2005, 7, 173–184. [Google Scholar] [CrossRef]
  37. Farrell, M.J. The measurement of productive efficiency. J. R. Stat. Soc. Ser. A 1957, 120, 253–281. [Google Scholar] [CrossRef]
  38. Jafari, Y. Malmquist productivity index for multi time periods. Int. J. Data Envel. Anal. 2014, 2, 315–322. [Google Scholar]
  39. Lee, Y.; Lu, L.T.; Sung, A.D. A measure to the operational performance of international hotels in Taiwan: DEA and Malmquist approach. Rev. Econ. Financ. 2012, 2, 73–83. [Google Scholar]
  40. Caves, D.W.; Christense, L.R.; Diewert, W.E. Multilateral comparisons of output, input, and productivity using superlative index numbers. Econ. J. 1982, 92, 73–86. [Google Scholar] [CrossRef]
  41. Caves, D.W.; Christense, L.R.; Diewert, W.E. The economic theory of index numbers and the measurement of input, output, and productivity. Econometrica 1982, 50, 1393–1414. [Google Scholar] [CrossRef]
  42. Färe, R.; Grosskopf, S.; Lindgren, B.; Roos, P. Productivity developments in Swedish hospitals: A Malmquist output index approach. In Data Envelopment Analysis: Theory, Methodology, and Applications; Charnes, A., Cooper, W.W., Lewin, A.Y., Seiford, L.M., Eds.; Springer: Dordrecht, The Netherlands, 1994; pp. 253–272. [Google Scholar]
  43. Chen, Y. A non-radial Malmquist productivity index with an illustrative application to Chinese major industries. Int. J. Prod. Econ. 2003, 83, 27–35. [Google Scholar] [CrossRef]
  44. Camanho, A.S.; Dyson, R.G. Data envelopment analysis and Malmquist indices for measuring group performance. J. Prod. Anal. 2006, 26, 35–49. [Google Scholar] [CrossRef]
  45. Färe, R.; Grifell-Tatjé, E.; Grosskopf, S.; Lovell, C.A.K. Biased technical change and the Malmquist productivity index. Scand. J. Econ. 1997, 99, 119–127. [Google Scholar] [CrossRef]
  46. Peypoch, N.; Solonandrasana, B. Aggregate efficiency and productivity. Tour. Econ. 2008, 14, 45–56. [Google Scholar] [CrossRef]
  47. Anderson, R.I.; Fish, M.; Xia, Y.; Michello, F. Measuring efficiency in the hotel industry: A stochastic frontier approach. Int. J. Hosp. Manag. 1999, 18, 45–57. [Google Scholar] [CrossRef]
  48. Peypoch, N. On measuring tourism productivity. Asia Pac. J. Tour. Res. 2007, 12, 237–244. [Google Scholar] [CrossRef]
  49. Assaf, A.G.; Cvelbar, L.K.; Pahor, M. Performance drivers in the casino industry: Evidence from Slovenia. Int. J. Hosp. Manag. 2013, 32, 149–154. [Google Scholar] [CrossRef]
  50. Assaf, A.G.; Dwyer, L. Benchmarking international tourism destinations. Tour. Econ. 2013, 19, 1233–1247. [Google Scholar] [CrossRef] [Green Version]
  51. Barros, C.P. Measuring efficiency in the hotel sector. Ann. Tour. Res. 2005, 32, 456–477. [Google Scholar] [CrossRef]
  52. Morey, R.; Dittman, D.A. Evaluating a hotel GM’s performance. Cornell Hotel Restaur. Adm. Q. 1995, 36, 30–35. [Google Scholar] [CrossRef]
  53. Bell, R.A.; Morey, R.C. Increasing the efficiency of corporate travel management through macro benchmarking. J. Travel Res. 1995, 33, 11–20. [Google Scholar] [CrossRef]
  54. Johns, N.; Howcroft, B.; Drake, L. The use of data envelopment analysis to monitor hotel productivity. Prog. Tour. Hosp. Res. 1997, 3, 119–127. [Google Scholar] [CrossRef]
  55. Anderson, R.I.; Fok, R.; Scott, J. Hotel industry efficiency: An adavanced linear programming examination. Am. Bus. Rev. 2000, 18, 40–48. [Google Scholar]
  56. Brown, J.R.; Ragsdale, C.T. The competitive market efficiency of hotel brands: An application of data envelopment analysis. J. Hosp. Tour. Res. 2002, 26, 332–360. [Google Scholar] [CrossRef]
  57. Reynolds, D.; Thompson, G.M. Multiunit restaurant productivity assessment using three-phase data envelopment analysis. Int. J. Hosp. Manag. 2007, 26, 20–32. [Google Scholar] [CrossRef] [Green Version]
  58. Reynolds, D.; Biel, D. Incorporating satisfaction measures into a restaurant productivity index. Int. J. Hosp. Manag. 2007, 26, 352–361. [Google Scholar] [CrossRef]
  59. Reynolds, D. Hospitality-productivity assessment. Cornell Hotel Restaur. Adm. Q. 2003, 2, 130–137. [Google Scholar] [CrossRef]
  60. Assaf, A.G.; Barros, C. Performance analysis of the gulf hotel industry: A Malmquist index with bias correction. Int. J. Hosp. Manag. 2011, 30, 819–826. [Google Scholar] [CrossRef]
  61. Barros, C.P.; Alves, F.P. Productivity in the tourism industry. Int. Adv. Econ. Res. 2004, 10, 215–225. [Google Scholar] [CrossRef]
  62. Yi, T.; Liang, M. Evolutional model of tourism efficiency based on the DEA method: A case study of cities in Guangdong Province, China. Asia Pac. J. Tour. Res. 2015, 20, 789–806. [Google Scholar] [CrossRef]
  63. Barros, C.A.P.; Santos, C.A. The measurement of efficiency in Portuguese Hotels using data envelopment analysis. J. Hosp. Tour. Res. 2006, 30, 378–400. [Google Scholar] [CrossRef]
  64. Barros, C.P.; Dieke, P.U.C. Analyzing the total productivity change in travel agencies. Tour. Anal. 2007, 12, 27–37. [Google Scholar] [CrossRef]
  65. Tsai, H.; Wu, J.; Zhou, Z. Managing efficiency in international tourist hotels in Taipei using a DEA model with non-discretionary inputs. Asia Pac. J. Tour. Res. 2011, 16, 417–432. [Google Scholar] [CrossRef]
  66. Wu, J.; Tsai, H.; Zhou, Z. Improving efficiency in international tourist hotels in Taipei using a non-radial DEA model. Int. J. Contemp. Hosp. Manag. 2011, 23, 66–83. [Google Scholar] [CrossRef]
  67. Bosetti, V.; Cassinelli, M.; Lanza, A. Becnchmarking in Tourism Destination, Keeping in Mind the Sustainable Paradigm; Nota di Lavoro; Springer: Milano, Italy, 2006. [Google Scholar]
  68. Cracolici, M.F.; Nijkamp, P.; Cuffaro, M. Efficiency and productivity of Italian tourist destinations: A quantitative estimation based on data envelopment analysis and the malmquist method. In Advances in Modern Tourism Research; Matias, A., Nijkamp, P., Neto, P., Eds.; Physica-Verlag: Berlin/Heidelberg, Germany; New York, NY, USA, 2007; pp. 325–343. [Google Scholar]
  69. Cuccia, T.; Guccio, C.; Rizzo, I. UNESCO sites and performance trend of Italian regional tourism destinations: A two-stage DEA window analysis with spatial interaction. Tour. Econ. 2017, 23, 316–342. [Google Scholar] [CrossRef]
  70. Fafurida, F.; Pratiwi, E.N. Financial independence of regencies and cities in central java. Econ. J. Emerg. Mark. 2017, 9, 199–209. [Google Scholar] [CrossRef] [Green Version]
  71. Statistics Korea Korean Statistical Information Service. Available online: http://kosis.kr/index/index.do (accessed on 31 March 2020).
  72. Ministry of the Interior and Safety Local Finance Integrated Open System. Available online: http://lofin.mois.go.kr/portal/main.do (accessed on 31 March 2020).
  73. Wood, R.E. Caribbean cruise tourism: Globalization at sea. Ann. Tour. Res. 2000, 27, 345–370. [Google Scholar] [CrossRef]
  74. Lester, J.-A.; Weeden, C. Stakeholders, the natural environment and the future of Caribbean cruise tourism. Int. J. Tour. Res. 2004, 6, 39–50. [Google Scholar] [CrossRef]
  75. UNWTO. Global Report on City Tourism; World Tourism Organization (UNWTO): Madrid, Spain, 2012. [Google Scholar]
  76. Premack, R. A Row With China Over U.S. Missiles Is Devastating South Korea’s Tourism Industry. Time. Available online: https://time.com/4734066/south-korea-tourism-china-thaad/ (accessed on 2 March 2020).
  77. Carbone, M. Sustainable tourism in developing countries: Poverty alleviation, participatory planning, and ethical issues. Eur. J. Dev. Res. 2005, 17, 559–565. [Google Scholar] [CrossRef]
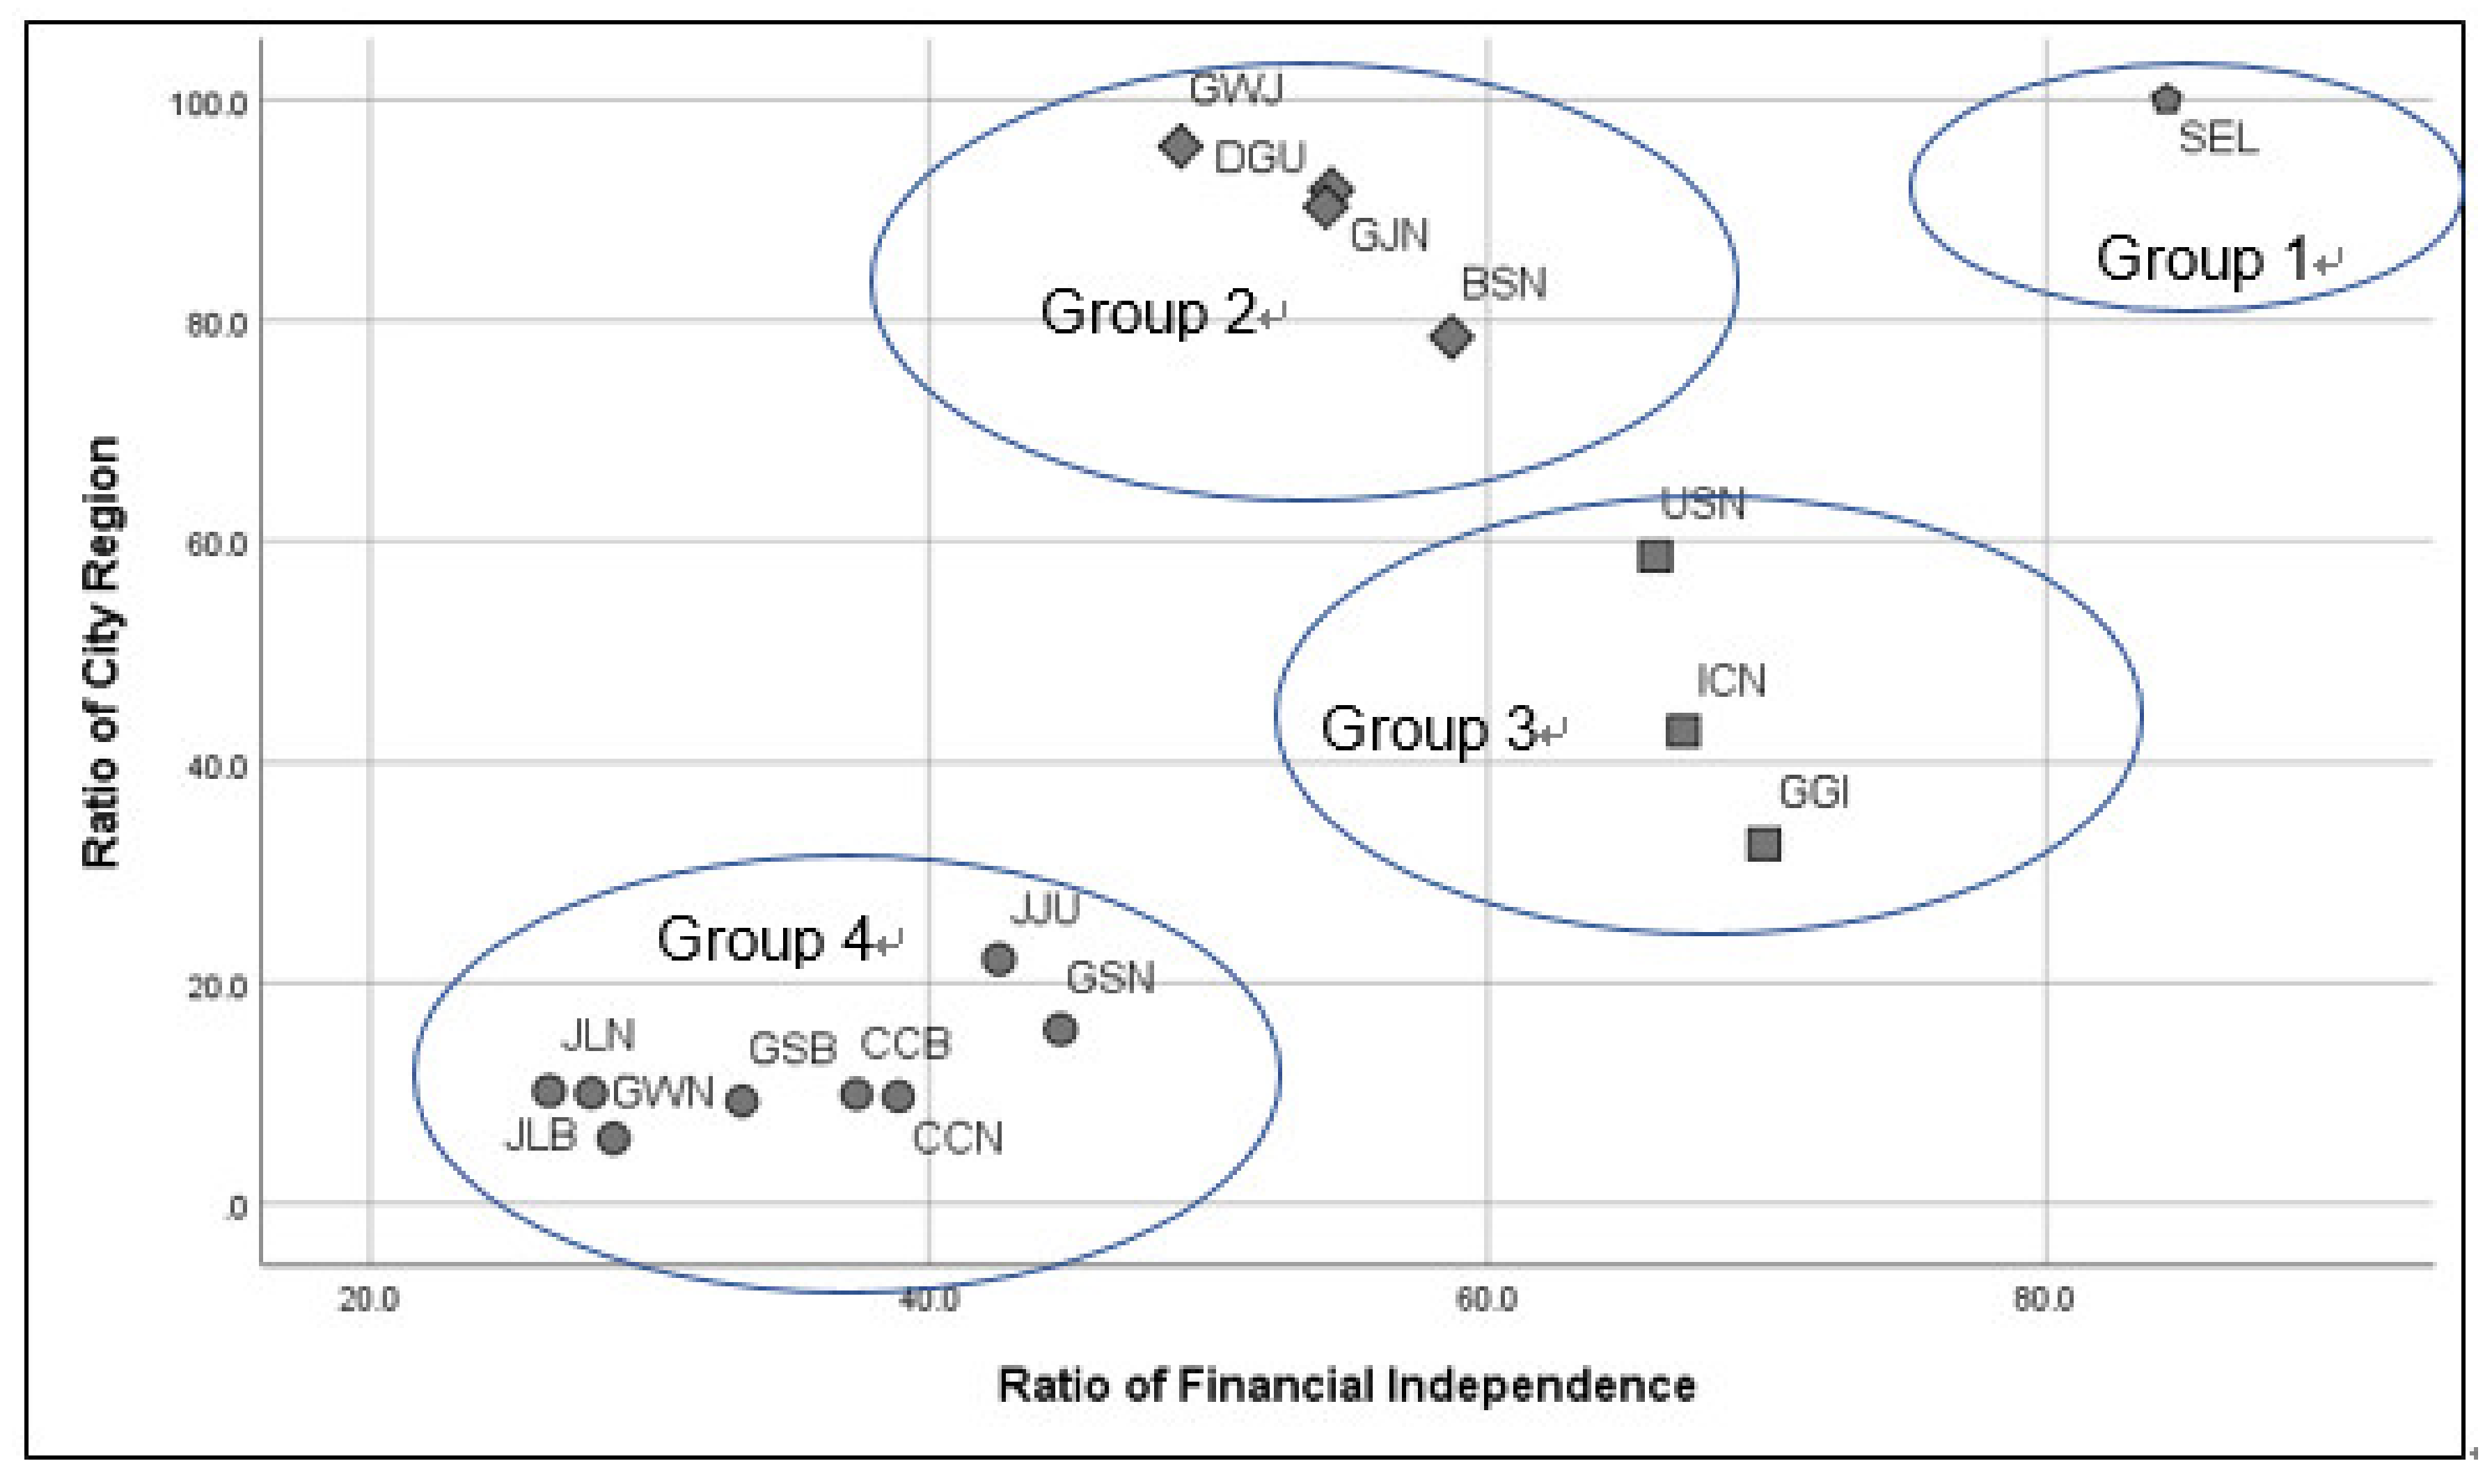
Figure 1. Ratio of city region and financial independence in 16 metro regions in the Republic of Korea.
Sustainability 12 02912 g001
Figure 2. Malmquist Productivity Index (MPI) for the total industry—gross value added by four groups.
Sustainability 12 02912 g002
Figure 3. MPI for the culture- and tourism-related industry value added by four groups.
Sustainability 12 02912 g003
Figure 4. MPI for the other industry value added by four groups.
Sustainability 12 02912 g004
Figure 5. MPI of total employment by four groups.
Sustainability 12 02912 g005
Figure 6. MPI of culture- and tourism-related employment by four groups.
Sustainability 12 02912 g006
Figure 7. MPI of other industry-related employment by four groups.
Sustainability 12 02912 g007
Figure 8. MPI mean of value added and employment by four groups for 2013–2018.
Sustainability 12 02912 g008
Figure 9. MPI improving ratio by four groups (2017–2018 compared with 2013–2014).
Sustainability 12 02912 g009
Table 1. Ratio of financial independence and city region in the Republic of Korea (2018).
RegionLabelFinancial IndependenceRate of City Region
Seoul Metropolitan CitySEL84.3100.0
Busan Metropolitan CityBSN58.778.5
Daegu Metropolitan CityDGU54.290.3
Incheon Metropolitan CityICN67.042.8
Gwangju Metropolitan CityGWJ49.095.8
Daejeon metropolitan CityGJN54.491.8
Ulsan Metropolitan CityUSN66.058.7
Gyeonggi-doGGI69.932.5
Gangwon-doGWN28.75.9
Chungcheongbuk-doCCB37.49.9
Chungcheongnam-doCCN38.99.7
Jeollabuk-doJLB27.910.0
Jeollanam-doJLN26.410.2
Gyeongsangbuk-doGSB33.39.3
Gyeongsangnam-doGSN44.715.8
Jeju-doJJU42.522.1
Note: 16 metro regions excluding Jeju special self-governing city in Republic of Korea. Source: Statistics Korea [71].
Table 2. Descriptive statistics on input and output variables.
VariablesUnitMinimumMaximumMeanSD
Total Budget (TB)1 billion won
(public input)
32,259.08 125,675.00 63,243.81 31,617.83
Culture and Tourism Budget (CTB)789.76 8122.94 3073.99 2478.66
Other Budget (OB = TB − CTB)31,078.89 117,819.89 60,169.81 29,173.71
Total Business Establishments (TBE)Number of establishments
(Private input)
682,183 1,330,044973,332 228,483
Art, Sports and Leisure related Services Sector (ASLS)18,295 37,245 27,279 7027
Accommodation and Food Sector (AFS)119,108 289,615 180,013 62,919
Other Business Establishments (OBE)543,624 1,003,216 766,041 162,038
Number of Hotel Rooms (NHR)12,945 95,966 41,632 27,943
Gross Value Added (GVA)Value added 1 billion won
(output)
181,349.91 551,926.28 384,967.47 132,476.20
Culture and Services Value Added (CSVA) 6913.02 14,702.90 11,795.44 2967.42
Accommodation and Food Services VA (AFSVA)5744.05 11,566.53 9347.29 2141.20
Other VA (OVA)168,302.17 526,441.94 363,824.75 127,691.38
Total Employment (TE)Person
(private input/public output)
3,286,493 6,755,369 5,218,287 1,179,632
Art, Sports and Leisure related Services Employment (ASLSE)55,665 136,347 96,512 28,055
Accommodation and Food Services Employment (AFSE)351,423 733,520 534,293 130,761
Other Employment (OE)2,879,405 5,983,264 4,587,482 1,031,316
Source: Ministry of the Interior and Safety [72], Statistics Korea [71].

