Abstract
To promote sustainable development of civil infrastructures, minimizing environmental impact and mobility disruptions have been elevated to a higher priority during decision-making for bridge construction scheme. This study presents a novel temporary pylon-anchor (TPA) technology for construction of self-anchored suspension bridges by considering not only safety performance, but also environmental impacts. A practical assessment method and index of sustainability associated with bridge construction technology are established to facilitate the selection of construction schemes. The sustainability index takes the environmental impact, traffic disruption, onsite construction materials and equipment, onsite construction cost, and onsite construction risk into consideration. The sustainability index associated with both conventional and novel construction methods is assessed and compared in this paper. Specifically, a novel girder-pylon antithrust system (GPAS) is proposed, which is the crucial component of the TPA technology in engineering application. In addition, an analytical approach is developed, considering both global load-carrying capacity and local stress distribution within the design and construction of the GPAS. The applicability and rationality of the proposed construction technology are illustrated by the successful application in real-world engineering. The field tests and sustainability assessment during the construction stage reveal that the proposed sustainability assessment method and analytical approach can facilitate the implementation of sustainable construction for self-anchored suspension bridges by considering both construction safety and sustainability.
1. Introduction
The onsite bridge construction activities can have significant impacts on environment, mobility, and safety [1,2]. The direct and indirect loss of environment and traffic disruptions resulting from the bridge construction can exceed the actual cost of the structure itself [3]. For instance, full-lane closures in large urban centers, or on highways or waterways with heavy traffic volumes, can have a significant economic impact on commercial and industrial activities in the region [4,5]; partial lane closures that occur alongside adjacent traffic can also lead to safety and environmental issues (e.g., extra CO2 emissions due to traffic detour) [6]. Sustainable construction emphasizes an efficient use of natural resources to minimize the impacts of the built environment on the Earth and enhancing the quality of surrounding environment [7,8]. Because of the potential economic and safety impacts, minimizing environment and traffic disruptions is a goal that has been elevated to a higher priority when determining bridge sustainable construction scheme [9,10].
Self-anchored suspension bridges have found increasingly wide applications in urban bridge engineering as a landmark, due to its attractive architectural appearance and lightweight configuration [11,12,13]. Due to being anchored to the girder, the main cables could not be erected until the girder has been built on lots of temporary supports, which inevitably causes serious impacts on environment and traffic. This issue has emerged during the erection of several typical self-anchored suspension bridges, such as the Yongjong Bridge in Korea [13], San Francisco–Oakland Bay Bridge in the States [14], and Qingdao Bay Bridge in China [15]. Several new technologies were developed on the basis of the concept of sustainable construction to solve these issues [16,17], such as temporary earth-anchor method [18], temporary stayed cables method [19,20], and temporary compressive strut method [21]. Although these technologies could reduce mobility impacts, the use of expensive temporary structures (e.g., stayed cables, earth anchor, and compressive strut) increases environmental impact and onsite construction cost. Hence, to promote the construction sustainability for self-anchored suspension bridge, further research needs to focus on the development of the sustainable construction through new technology and new design-oriented analytical approaches.
A practice-oriented assessment method and index of sustainability on bridge construction technology are essential for selection of sustainable bridge construction schemes [22]. Penadés-Plà et al. [23] analyzed the life-cycle environmental impact of a prestressed concrete precast bridge from the economic point of view, and proposed an optimization-life-cycle assessment method. Chang et al. [24] established an index system and evaluated the sustainability of high-speed railway construction projects. Seo et al. [25] analyzed the economic impacts of three sustainable vertical extension methods for existing underground spaces. Although these methods could assess the construction sustainability, the real-world application of decision making for bridge construction schemes by considering sustainability is relatively scarce, and more studies are needed on this aspect. Therefore, it is urgent to establish a practical assessment method and index of sustainability on construction technology for urban bridge construction, which is addressed in this paper.
On the basis of the aforementioned studies, this study presents a novel temporary pylon-anchor (TPA) technology to promote sustainable construction, which is suited for self-anchored suspension bridges with the mid-span less than 300 m, three spans and two pylons. A practical assessment method and index of sustainability on construction technologies are established to facilitate making decisions for sustainable construction scheme. A novel girder-pylon antithrust system (GPAS) is proposed, which is the crucial component of the TPA technology in engineering application. For the reliable and cost-effective design of GPAS, a design-oriented two-phase framework is developed considering global load-carrying capacity and local stress distribution. In phase I, the global shear capacity and stiffness are designed through a set of specially derived practical formulas, which capture the main characteristics of the slip and uplift behavior at steel-concrete joint surface within an antithrust system. In phase II, the local stress distribution is improved based on the effects of different parameters induced by grouped parametric analyses using 3D elaborate finite element analysis. The applicability and rationality of the sustainable construction new technology are illustrated by the first successful application in real-world engineering. The field tests and construction sustainability assessment show that the proposed sustainability assessment method and design-oriented analytical approach facilitate the implementation of sustainable construction for self-anchored suspension bridge.
2. Sustainability Assessment on Construction Technologies for Self-Anchored Suspension Bridge
2.1. Environmental Impact and Traffic Disruption Caused by Traditional Construction Technologies
As shown in Figure 1a, the traditional construction technology needs lots of temporary supports to build girders, which inevitably causes serious environmental impact and traffic disruption.
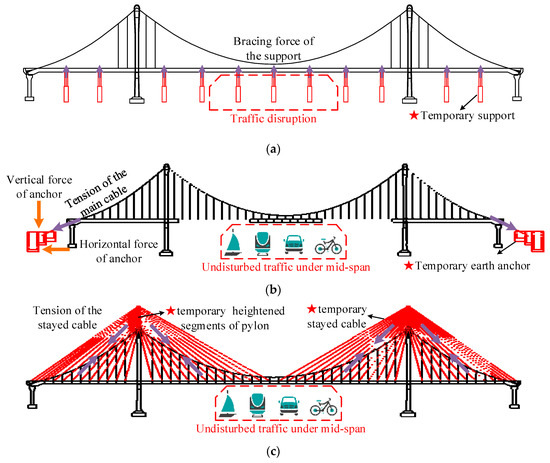
Figure 1.
Traditional construction technologies for self-anchored suspension bridge: (a) Temporary supports technology [13,26]; (b) temporary earth-anchor technology [18]; and (c) temporary stayed-cables technology [19,20].
As shown in Figure 1b, for reducing traffic disruptions, the temporary earth-anchor method builds temporary earth anchor blocks to enable a construction sequence that is similar to a conventional suspension bridge. The technology has been applied in the Zhuyuan Bridge (33 m + 90 m + 33 m) in China [18]. However, the building of earth-anchor also damages the surrounding environment and produces pollution.
As shown in Figure 1c, to avoid traffic disruptions, the temporary stayed cables technology uses temporary stayed-cables to erect girder segments, just as a cable-stayed bridge, and these stayed-cables aren’t removed until the main cables and hangers are erected. The technology has been applied in the E’gongyan Rail Bridge (210 m + 600 m + 210 m) in China [19], and the Duisburg Bridge [20]. Although the technology reduces both environmental impact and traffic disruption, the use of expensive temporary structures (lots of stayed cables and heightened segments of the pylon) increases onsite construction cost and time.
2.2. Novel TPA Technology to Improve Construction Sustainability
In this study, a novel temporary pylon-anchor (TPA) technology is proposed to solve the issue in a safe and cost-effective manner for minimizing environment and traffic disruptions. As shown in Figure 2, the horizontal cable force is transferred to the pylon through the side span girder and is resisted by means of the bending bearing capacity of the pylon. Thus, the mid-span girder is lifted in sections and connected to the hangers. After the entire girder is erected, the horizontal cable force is transferred from the pylon to the girder, and the structure is transformed into a permanent self-balanced system. In this way, the permanent environmental impact and traffic disruption are eliminated during construction, and the onsite construction cost, time, and risk are minimized.
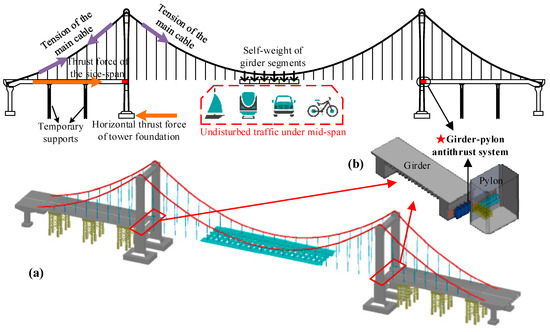
Figure 2.
Temporary pylon-anchor technology: (a) Construction process; (b) Gider-pylon antithrust system.
2.3. Primary Sustainability Performance of Construction Technologies
As shown in Table 1, the traditional temporary supports technology results in not only serious environmental impact and traffic disruption, but also high onsite construction cost, time, and risk. Even if the temporary earth-anchor technology and stayed-cables technology reduce traffic disruption, the other important sustainable performance still needs further improvement.

Table 1.
Construction sustainability evaluation of construction technologies for self-anchored suspension bridge.
2.4. Assessment Method and Index Considering Construction Sustainability
In order to facilitate decision-making for sustainable bridge construction scheme, a practical assessment procedure is proposed as shown in Figure 3. The detailed procedure is explained as follows:
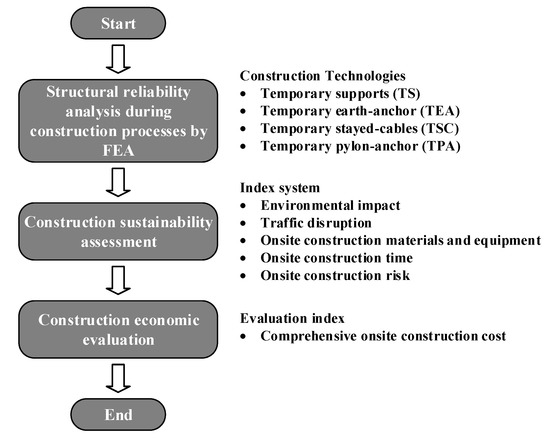
Figure 3.
Practice-oriented assessment procedure of sustainability assessment of bridge construction technology.
(1) Structural safety analysis
To ensure the structural safety during the entire construction processes, the global step-by-step forward model and local 3D solid elaborate model should be analyzed for each construction technology, respectively. The analytical approach proposed in Section 3 presents the detailed analysis procedure and mechanical performance. The structural analysis performance includes the strength, rigidity, stability, etc.
Through this step, those construction technologies that cannot meet the safety requirement are excluded.
(2) Construction sustainability assessment
Considering the various influencing factors on construction sustainability, this paper uses an index system by considering the following aspects: Environmental impact, traffic disruption, onsite construction materials and equipment, onsite construction cost, and onsite construction risk. Then, the hierarchical evaluation method based on a rose chart is employed to compare sustainability associated with different construction schemes. As shown in Figure 4, the area Si enclosed by connecting lines is taken as analysis index of the sustainability associated with the construction technology. As indicated, the indices of four technologies are indicated in Figure 4 for illustrative purpose, and the TPA technology has comprehensive performance on construction sustainability.
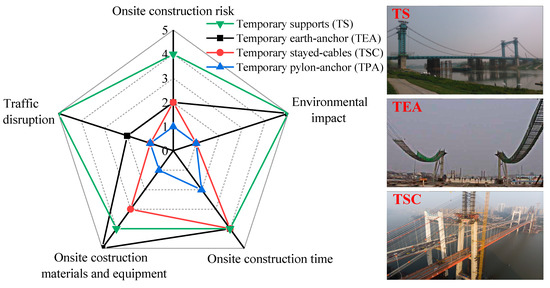
Figure 4.
Construction sustainability assessment.
Through step 2, the construction technology with the best sustainability is efficiently screened out.
(3) Construction economic evaluation
In this step, the direct and indirect construction cost of the most sustainable construction technology is assessed. The comprehensive onsite construction cost is the sum of C1, C2, C3, C4, and C5. C1 is direct and indirect losses due to environmental impact; C2 is the direct and indirect losses caused by traffic disruption; C3 is the cost of materials and equipment in onsite construction; C4 is the cost of onsite construction time, which is obtained by multiplying labor cost (per day) and days; and C5 represents the cost of onsite construction risks, which is quantified by multiplying insurance amount and failure probability.
3. Design-Oriented Analytical Approach for Novel Antithrust System
As shown in Figure 2, the GPAS is the crucial component of the proposed TPA technology. In the GPAS, the horizontal cable force is smoothly transferred from the side span girder to the pylon through the thrust shoulder. The shear capacity and stiffness of the thrust shoulder need to be designed to meet the construction performance requirements, and the girder and pylon should be nondestructive.
3.1. Novel Girder–Pylon Antithrust System
The GPAS can be classified on the basis of the gap width between the side span girder and the pylon as follows: Type I (Figure 5a) for the wide gap, and Type II (Figure 5b) for the narrow gap. A concrete side span girder is usually installed in a self-anchored suspension bridge to balance the uplift component of cable force. Hence, grouped perfobond rib connectors [Perfobond Leiste in German (PBL)] and U-shaped anchor rebars are used to fasten the antithrust system to the lateral side of the side span girder.
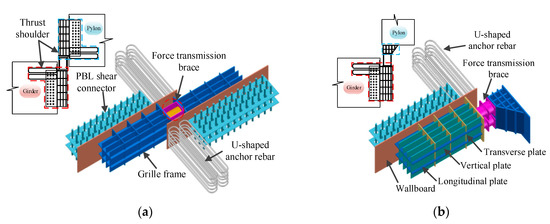
Figure 5.
Schematic diagram of GPAS (Girder-Pylon Antithrust System): (a) Type I antithrust system and (b) Type II antithrust system.
(1) Type I
Figure 5a shows the Type I antithrust system, consisting of a girder-side thrust shoulder, a pylon-side thrust shoulder, and a force transmission brace located between the set of thrust shoulders. Each thrust shoulder is composed of a grille frame, grouped PBLs, and U-shaped anchor rebars that are welded to the two sides of the wallboard. The grille frame comprises longitudinal, vertical, and transverse plates. The thrust shoulder is fastened to the lateral side of the side span girder and pylon with the aid of grouped PBLs and U-shaped anchor rebars that prevent the thrust shoulders from slip and uplift.
(2) Type II
The only difference between Types II (Figure 5b) and I is that the pylon-side thrust shoulder is replaced by the foot brace to effectively transfer the thrust force and disperse the narrow gap stress.
3.2. Failure Modes and Mechanism of Force Transmission
The three failure modes of the thrust are considered to meet the construction performance requirements. (I) Shear slip of PBL shear connector [27,28,29]: The shear slip deformation of PBL connector is limited to ensure that the girder and pylon are nondestructive. The increase in shear capacity after sliding is excluded in the design; (II) uplift of wallboard: Under the strong thrust force, the out-of-plane deformation of the wallboard at the head position must be avoided; and (III) buckling failure of grille frame: The grille frame must have sufficient rigidity in the 3D space. The overall or local buckling of the grille frame must be avoided. No cyclic loading occurs although the structural stress varies seriously during construction. Hence, the fatigue failure of the thrust shoulder can be ignored.
As shown in Figure 6, the horizontal cable force is transmitted to the wallboard, U-shaped anchor rebars, and PBL shear connectors through the grille frame to achieve the force transmission between the girder and pylon. The shear capacity of PBL shear connectors is the chief resistance for the thrust force. The eccentric effect of the grille frame would cause the wallboard uplift at the head position, enabling the U-shaped anchor rebars and PBL shear connectors to withstand the transverse pull-out force for resisting the out-of-plane deformation.
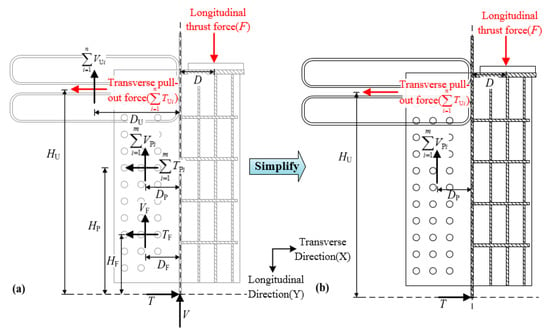
Figure 6.
Mechanism diagram of force transmission of thrust shoulder: (a) Calculation scheme; (b) Simplified calculation scheme.
The equilibrium formula is established on the basis of the calculation scheme (Figure 6a) as follows:
where F is the longitudinal thrust force, D is the distance of the longitudinal thrust force from the center of rotation in the X direction, is the total force of U-shaped rebars in the Y direction, is the transverse (X-direction) pull-out force of U-shaped rebars, n is the number of U-shaped rebars, and are the total forces of penetrating rebar in the Y and X directions, m is the number of penetrating rebars, VF and TF are the friction between the steel and concrete in the Y and X directions, V and T are the reactions at the end of the wallboard in the Y and X directions, HU and DU are the distances of the total force of U-shaped rebars from the center of rotation in the Y and X directions, HP and DP are the distances of the total force of penetrating rebar from the center of rotation in the Y and X directions, and HF and DF are the distances of friction from the center of rotation in the Y and X directions, respectively.
The following simplifications are adopted to ensure design reliability and improve practicability: The thrust force is only borne by PBL shear connectors. The internal force redistribution caused by slip deformation is ignored, indicating that the relative increase in shear capacity after sliding can be ignored [30]; the friction and embedment effects of the wallboard on shear resistance are ignored; and the out-of-plane uplift of the wallboard is significant at the head zone, making it reasonable to assume that the transverse pull-out force is only borne by the U-shaped anchor rebars. Based on the above simplifications (Figure 6b), Formula (1) can be simplified to Formula (2).
3.3. Global Design Formulas
The calculation formula of PBL bearing capacity () provided by the design code [31] is adopted to improve the applicability of design formula. The shear heterogeneity coefficient of PBL shear connector α = 0.4 is considered for security redundancy [32]. The formula to estimate the number of PBL shear connectors is derived as follows:
where is the number of PBL shear connectors, F is the longitudinal thrust force in Formula (1), α is the shear heterogeneity coefficient, is the shear capacity of PBL shear connector under the ultimate limit state, d is the diameter of circular hole in the steel plate, ds is the diameter of penetrating rebar, is the design value of concrete axial compressive strength, and is the design value of penetrating rebar tensile strength.
The anchorage length of U-shaped anchor rebar must reach the yield strength before anchorage failure to meet the construction performance requirements. The design code [33] indicates that the minimum anchorage length of HRB400 rebar adopted in this paper should be greater than 25 times the rebar diameter. The formula to estimate the number of U-shaped anchor rebars is derived as follows:
where is the number of U-shaped anchor rebars, DPi is the distance of the ith penetrating rebar from the center of rotation in the X direction, and As is the cross-sectional area of U-shaped anchor rebar.
The longitudinal plate of the grille frame is designed considering the rigidity criterion. The thickness and number of longitudinal plates must ensure that the structural deformation meets the construction requirements. The transverse and vertical plates of the grille frame are designed on the basis of stability control criterion, and their thickness and spacing are set in accordance with the code [34] to avoid buckling.
3.4. Design-Oriented Two-Phase Analytical Framework
As indicated in Figure 7, the design-oriented analytical framework of the girder-pylon thrust shoulder is constructed. The detailed steps are provided as follows:
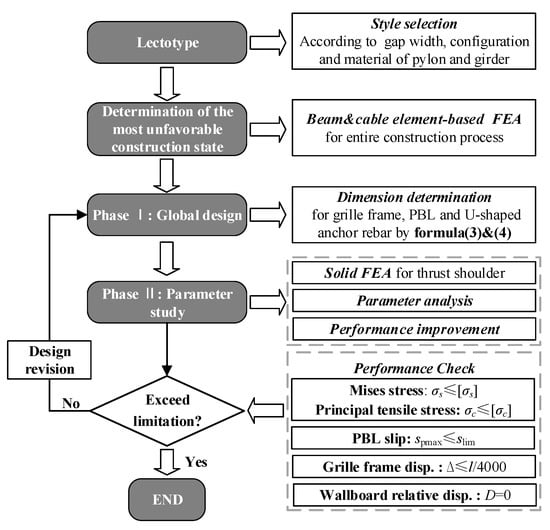
Figure 7.
Design-oriented analytical framework for girder-pylon thrust shoulder.
1. Lectotype
The type of antithrust system is selected on the basis of specific structural parameters, such as the configuration and material of the side span girder and bridge pylon and the gap width between the girder and pylon.
2. Determination of unfavorable construction state
Global geometric nonlinear analysis of the entire construction process is conducted through the spatial cable and beam element finite element (FE) simulation, and the maximum design load of the GPAS is determined.
3. Phase I: Global design
The numbers of PBL shear connectors and U-shaped anchor rebars are determined using Formulas (3) and (4) on the basis of the design criterion in Section 3.3. The grille frame is designed considering rigidity and stability control criteria.
4. Phase II: Parametric study
Grouped parametric analyses are performed to reveal the effects of parameter variation on structural performance and to improve the local performance. A high-fidelity 3D solid FE model is established to analyze the local effect and avoid stress distortion and size disturbance effect. The nonlinear surface contact behavior is simulated to consider the friction effect between the steel and concrete.
5. Performance check
The performance of the parametric study in step 4 is verified using the performance indicators. The design procedure is completed when the performance is verified, otherwise, the design is updated using steps 3-5. The performance indicators and relative thresholds are provided as follows:
(1) The principal tensile stress of concrete and Mises stress of steel must not exceed the limit value.
where is the allowable tensile stress of concrete, and is the allowable yield stress of steel (Detailed reference values are shown in Table 2).
Table 2.
Material properties.
(2) The slip of PBL shear connectors must not exceed the limit value [31].
where is the maximum slip of the joint surface, is the slip limit, is the standard value of concrete axial compressive strength, and Ec is the Young’s modulus of concrete.
(3) The deformation of grille frame must not exceed the limit value [34].
where and are the longitudinal displacement and design length of the grille frame, respectively.
(4) No relative deformation is found between the wallboard and the girder, that is, relative deformation D= 0.
4. Design and Engineering Implementation
The Dongtiao River Bridge in Huzhou, China, which is a self-anchored cable-stayed-suspension bridge with a span of 75 m + 228 m + 75 m and a semi-floating structural system (Figure 8), is used as the illustrative example. The bridge tower is a steel structure. The steel-concrete composite girder is used in the mid-span to reduce the self-weight, and the stay cable and prestressed concrete girder are used in the side span to balance the thrust force transmitted from the main cable to the bridge tower. Four sets of GPAS are used in the bridge to balance the thrust force of the side span generated during the construction process using the proposed TPA technology. The type I GPAS is selected because the gap between the girder and the pylon is approximately 1 m.
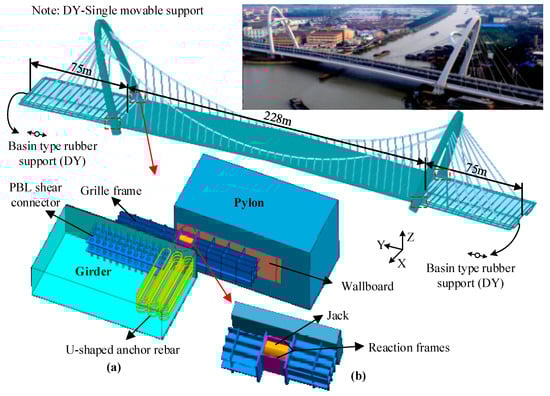
Figure 8.
The global FE model of Dongtiao river bridge and the layout of GPAS: (a) Girder-pylon antithrust system and (b) force transmission brace.
4.1. Determination of Unfavorable Construction State
A temporary GPAS for the Dongtiao River Bridge is designed on the basis of the design procedure in Section 3.4. A 3D beam-link-cable FE model (Figure 8) is presented for the entire construction analysis of the structural system. Then, the construction stage analysis is conducted to obtain the maximum thrust force of the side span girder during construction, as shown in Figure 9. With the progress of construction, the maximum thrust force on the GPAS is 17,400 kN. The antithrust system is installed at the two sides of pylons, and a load safety factor of 1.4 [35] is considered on the basis of construction experience. The maximum thrust force on the unilateral antithrust system is 17,400/2 × 1.4 = 12,180 kN, which is defined as the most unfavorable thrust force.
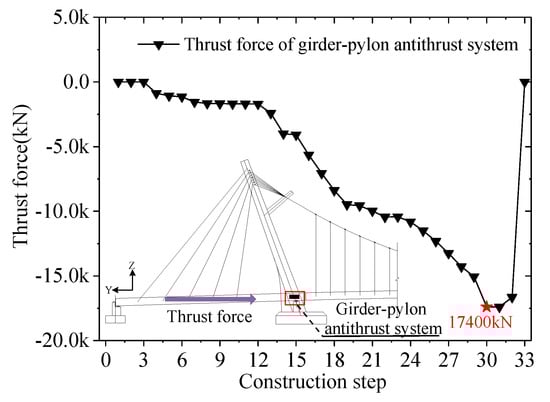
Figure 9.
Thrust force variation of GPAS during the construction process.
4.2. Phase I: Global Design
The test results [36] indicated that the rebar diameter in PBL shear connectors ranges from 10 mm to 25 mm. The PBL shear connectors, with a 60 mm diameter hole and 25 mm diameter penetrating rebar in the hole, are arranged in 200 mm spacing along with longitudinal and transverse directions on the basis of the construction code requirements [31]. The number of PBL shear connectors is preliminarily calculated using Formula (8). The Twin-PBL shear connector [37] is adopted to increase the torsional resistance and overall stiffness of PBL shear connectors. Considering that the Twin-PBL shear connector is arranged in two-holes, 45-holes are arranged in 15-rows for each perforated rib, as shown in Figure 10a.
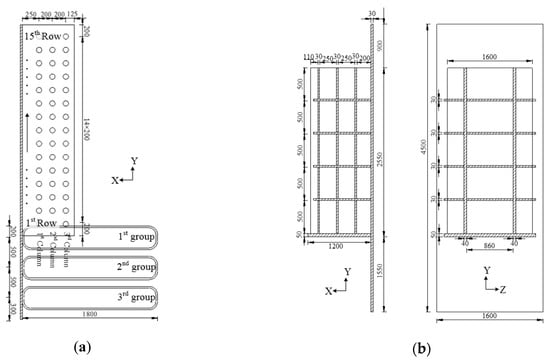
Figure 10.
The layout of the thrust shoulder: (a) Grouped PBL shear connectors and U-shaped anchor rebars, and (b) grille frame.
On the basis of the aforementioned design principle, the anchorage length of U-shaped anchor rebar should be longer than 25 du, where du is the U-shaped anchor rebar diameter, and the number of U-shaped anchor rebars should be calculated using Formula (9). As shown in Figure 10a, three groups of six U-shaped anchor rebars with 25 mm diameter and 1.8 m length are initially designed to meet safety redundancy. As shown in Figure 10b, the preliminary size of grille frame is proposed.
4.3. Phase II: Parametric Study
4.3.1. FEA
The general software package ANSYS is used to simulate the behavior of the thrust shoulder (Figure 11). After considering the size effect and the stress distortion on the coupling nodes of different elements [38,39], the concrete in the anchorage zone is simulated by solid element SOLID65 [40]. The solid element SOLID92 is used to simulate the grille frame and PBL shear connectors, (including the perforated rib and penetrating rebar), and the beam element BEAM4 is used to simulate the U-shaped anchor rebars.
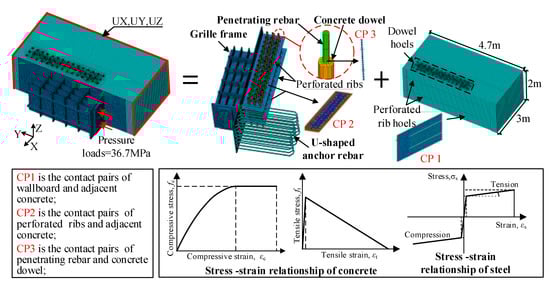
Figure 11.
The high-fidelity 3D solid finite element model.
In order to simulate the friction between the steel and concrete (Figure 11), the nonlinear surface-to-surface contact elements CONTA174 and TARGE170 are used to simulate three contract pairs (CPs), namely, CP1 between the wallboard and concrete, CP2 between the perforated ribs and concrete, and CP3 between the penetrating rebar and concrete dowel. CONTA174 element is adopted to the concrete surface, whereas TARGE170 element is used to the steel plate surface. The tangential behavior is assumed via a penalty friction formulation with a friction coefficient of 0.35 [38].
The displacements in X, Y, and Z directions of the concrete anchorage zone are constrained in the model calculation. The unfavorable thrust force is 12,180 kN, and the direction is Y-axis. The thrust force is applied in the form of surface load to ensure the model load accuracy.
The material properties are shown in Table 2. The material of the grille frame, wallboard, and perforated rib is Q345C. The material of the penetrating and U-shaped anchor rebars is HRB400, and that of the concrete is C50. The nonlinear behavior of materials is considered to increase the accuracy of FE simulation. The uniaxial stress–strain relationship of concrete in compression is obtained using the Hongnestad model, and incorporated into the FE model with Multi-linear Isotropic Hardening (MISO) option. The linear model of concrete in tension is adopted for the relationship between stress and strain. After crack resistance strength, the tensile stress linearly reduces to zero toward the ultimate strain because of the softening of concrete in tension (Figure 11) [41]. The stress–strain relationship of steel components is regarded as elastic-perfectly-plastic, and incorporated into the FE model with Bilinear Kinematic Hardening (BKIN) option. The assumed stress–strain curve of steel is shown in Figure 11, which is assumed to be a bilinear curve, including the strain hardening effect on the tension and compression sides [41].
4.3.2. Parametric Analysis
Various FE models are used in the parametric analysis to examine the effects of penetrating rebar diameter (PD), hole space on the perforated rib (PS), diameter (UD) and length (UL) of the U-shaped anchor rebar, number of longitudinal plates (NL), and number of transverse plates (NT) of the grille frame. The test model T1 is established on the basis of the preliminary design, and all model parameters are listed in Table 3.
Table 3.
Grouped models for parametric analyses.
Effects of Penetrating Rebar Diameter and Perforated Rib Hole Spacing
To investigate the effect of penetrating rebar diameter and perforated rib hole spacing on the yield stress of the penetrating rebar, five types of penetrating rebar diameter PD and hole spacing PS, as shown in Table 3, are considered, respectively.
Figure 12a,b illustrate the effects of diameter and hole spacing on Mises stress of the penetrating rebar at the first column, respectively. As shown in Figure 12a, the peak Mises stress appears in the 12th row position, thereby indicating that the middle PBL shear connectors bear a large thrust force. As shown in Figure 12b, the maximum stress value of the penetrating rebar is less than that of other spacing when the hole spacing is 100 mm, indicating that the spacing between holes is extremely short, and the PBL shear connectors do not exert the maximum effect. The peak stress appears and moves to the loading side when the hole spacing is greater than 200 mm, indicating that the PBL shear connectors exert the maximum effect under the structural size constraint. The results of FE analysis are consistent with the design formulas deduced in phase I, and the reliability of Formula (3) is verified.
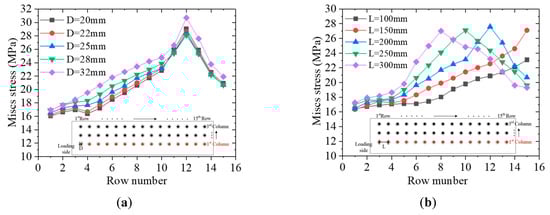
Figure 12.
Comparison of PBL performance with different parameters: (a) Effect of diameter on Mises stress of penetrating rebar at 1st column; (b) effect of hole spacing on Mises stress of penetrating rebar at 1st column.
Effects of the Diameter and Length of U-Shaped Anchor Rebar
Five types of diameter UD and length UL are considered to investigate the effects of the diameter and length of U-shaped anchor rebar on tensile stress, as shown in Table 3. Figure 13a shows the effect of diameter on the tensile stress of U-shaped anchor rebar. The maximum stress of the U-shaped anchor rebar gradually decreases with the increase in diameter. Figure 13b shows the effect of length on the tensile stress of U-shaped anchor rebar. The maximum tensile stress of the U-shaped anchor rebar slowly decreases with the increase in length. The maximum stress decreases 84 and 42 MPa when the diameter and length of U-shaped anchor rebar vary from 22 mm to 32 mm and from 1.6 m to 2.4 m, respectively, indicating that diameter plays a great role in the tension capacity of the U-shaped anchor rebar. This condition is mainly due to the fact that the maximum tensile stress appears in the weld between the U-shaped anchor rebar and the wallboard, and the increase in the diameter of U-shaped anchor rebar leads to the increase in the butt weld area.
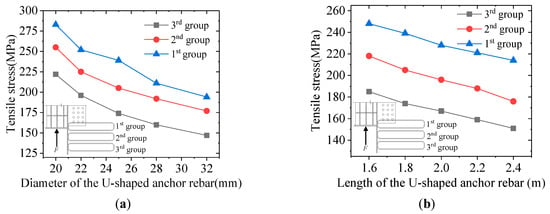
Figure 13.
Comparison of tensile stress of U-shaped anchor bars in different (a) diameters and (b) lengths.
Effects of the Number of Grille Plates
The grille frame transmits the thrust force to the wallboard through several soldering seams connected between the longitudinal plates, transverse plates, and the wallboard. The effect of the number of different kinds of plates on the thrust-sharing proportion of the grille frame, as shown in Table 3, are considered to investigate the optimal number of each kind of plates.
The thrust-sharing proportion of the longitudinal plate exceeds 80%, and the transverse plates do not exceed 20%, as shown in Figure 14, indicating that the longitudinal plate is the important force transfer component. The thrust-sharing proportion transmitted by the two components does not significantly vary with the increase in the number of longitudinal and transverse plates.
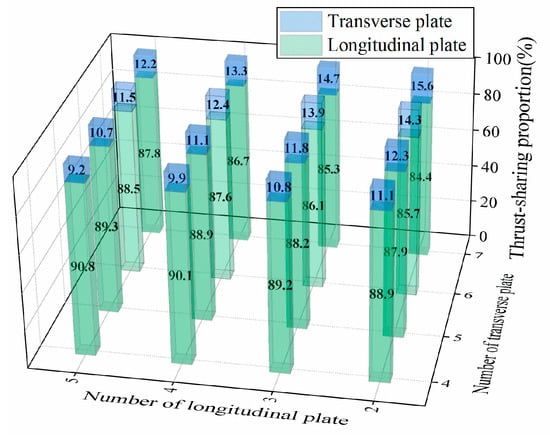
Figure 14.
Effect of number of plates on thrust-sharing proportion.
4.3.3. Performance Improvement
In this section, the global design of phase I is improved on the basis of the aforementioned parametric analyses. The design of PBL and U-shaped anchor rebar is the key factor affecting the thrust shoulder performance. The stress is more sensitive to the change of hole spacing and diameter of U-shaped anchor rebar, so special attention should be paid to the selection of their sizes. However, the number of grille plates is not a key factor, and the change of the number has little effect on the thrust-sharing proportion of each component. Therefore, according to the results of parameter analysis and considering the safety redundancy of the structure, the improved parameters are as follows: (1) The penetrating rebar diameter is 25 mm, and the hole spacing is 200 mm; (2) the diameter of U-shaped anchor rebar is 28 mm, and the length is 2 m; and (3) the number of plates in each component of grilles frame is consistent with the global design of phase I. The improved structural performance analysis is provided as follows:
PBL Shear Connectors
Figure 15 shows the Mises stress distribution of the PBL shear connectors. The Mises stress of the PBL shear connectors is less than that of the yield strength, and the maximum stress is 28 MPa, which occurs at the 12th row of the first column. For the PBL shear connectors in the same row, the stress on the side close to the wallboard is greater than that on the side far from the wallboard, and shear of the first row is the most disadvantageous.
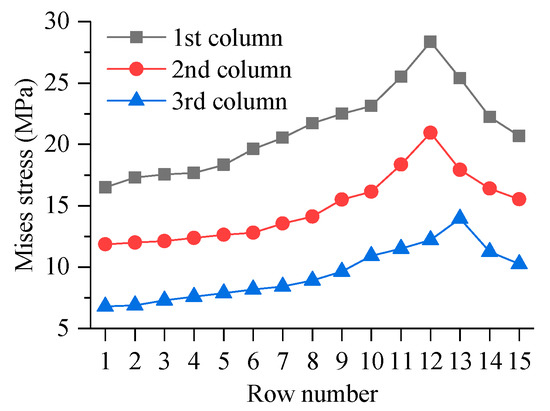
Figure 15.
Mises stress distribution of the PBL shear connectors (unit: Pa).
Figure 16 shows the shear force and slip of PBL shear connectors at the first column. The shear force of PBL connectors is first increased, and then decreased with the increase in the row number. The maximum slipping value is 0.05 mm, thereby showing a gradually decreasing trend. The slip value is less than 0.2 mm, thereby meeting the design requirements of Formula (6).
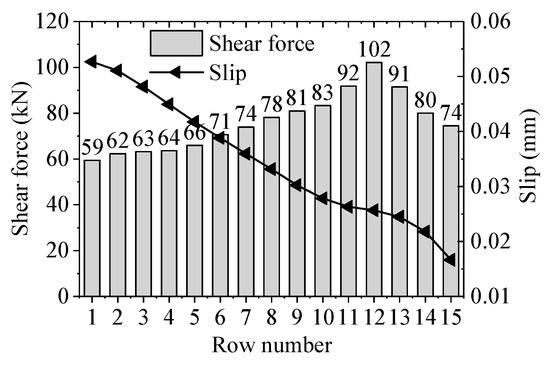
Figure 16.
Shear force and slip of PBL shear connectors at 1st column.
U-Shaped Anchor Rebar
Three sets of anchor rebars are found on the inner side of the wallboard, where each set has six rebars for a total of 18 U-shaped anchor rebars. The stress value and group-sharing proportion of U-shaped anchor rebar are shown in Figure 17a,b.
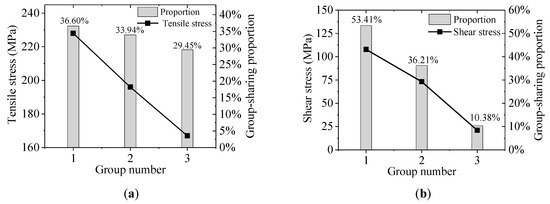
Figure 17.
Stress and group-sharing proportion of U-shaped anchor rebar: (a) Tensile stress and (b) shear stress.
As shown in Figure 17a, the maximum tensile stress of U-shaped anchor rebar is 228 MPa, which is less than the threshold value of 330 MPa. The maximum tensile stress appears at the first group of U-shaped anchor rebar near the loading side. The tensile stress gradually decreases because the U-shaped anchor rebar position is far from the loading side. The group-sharing proportion of U-shaped anchor rebar is uniform, indicating that all U-shaped anchor rebars undertake the out-of-plane deformation of the wallboard.
As indicated in Figure 17b, the maximum shear stress at the weld of U-shaped anchor rebar is 107 MPa, which is less than the limit value of 175 MPa and meets the safety requirements. The maximum shear stress at the weld appears at the first group of U-shaped anchor rebar near the loading side. The maximum shear stress significantly decreases with the U-shaped anchor rebar position away from the loading side. At the same time, the group-sharing proportion among the groups is uneven. The group-sharing proportion among the first group is more than 50%, and the proportion of the third group is only 10%, thereby indicating that the U-shaped anchor rebars provide shear bearing reserve.
Grille Frame
Figure 18 shows the maximum Mises stress change in the grid frame during construction. The Mises stress of the grille frame under thrust force is less than the yield strength of 345 MPa. The maximum Mises stress is 201 MPa, which appears at the weld between the transverse and longitudinal plates near the loading side. This condition is mainly because the longitudinal plate is bent and deformed, resulting in the stress concentration caused by the limited internal displacement. Meanwhile, the Mises stress in the rest of the grille frame is significantly reduced. The plates of the entire grille frame have low stress, thereby meeting the criterion in Table 2. Meanwhile, the maximum displacement of the grille frame in the Y direction is 0.365 mm, which is less than the limit value calculated using Formula (7).
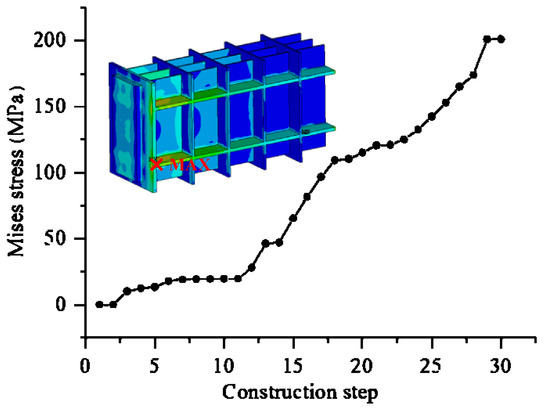
Figure 18.
Mises stress of the grille frame.
Concrete Anchorage Zone
As shown in Figure 19, the maximum principal tensile and compressive stresses in the concrete anchorage zone are 1.46 and 17.4 MPa, which are less than the limit values of 1.86 and 22.4 MPa, respectively. The maximum tensile and compressive stresses occur at the joint of the wallboard and concrete, where an obvious stress concentration phenomenon occurs, and the tensile and compressive stresses of concrete far from this area significantly decrease.
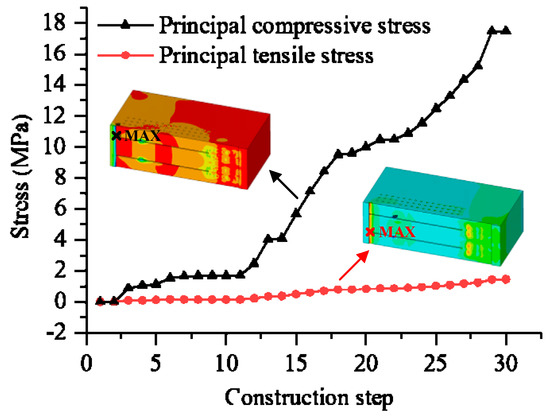
Figure 19.
Stress in anchorage zone of concrete side span beam.
4.4. Field Test and Verification
As shown in Figure 20a,b, the designed girder–pylon thrust shoulders have been successfully applied to help facilitate the implementation of sustainable construction of the Dongtiao River Bridge. For field tests, three stress measuring points are arranged on the grille frame to monitor the stress changes during the construction. Figure 20c,d shows the comparison of the measured and calculated stress values at points 1, 2, and 3. The grille frame stress is constantly in the safe range, and the variation tendencies of the measured and calculated values are the same. The measured values are slightly larger than the calculated values because of the measurement errors and construction load uncertainty. The errors of the calculated and measured values are within 10 MPa and are in good agreement, verifying the accuracy of the proposed analytical framework.
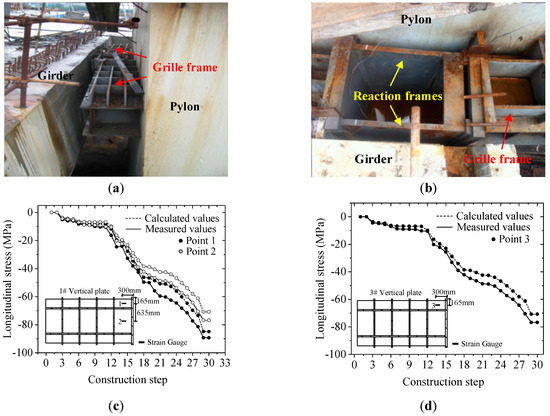
Figure 20.
Field tests: (a) Girder-pylon antithrust system; (b) force transmission brace; and (c,d) calculated and measured results of the longitudinal stresses of the grille frame.
5. Result Discussion on Construction Sustainability
The proposed TPA technology enables a construction sequence that is similar to the construction of conventional suspension bridge, where the main cable is first erected, and the mid-span girder is lifted in sections and connected to the hangers (Figure 21a). In this way, the ship navigation during the construction period avoids interruptions (Figure 21b). Without the need for temporary supports, the TPA technology enables to minimize environmental impact and traffic disruption during the construction stage.
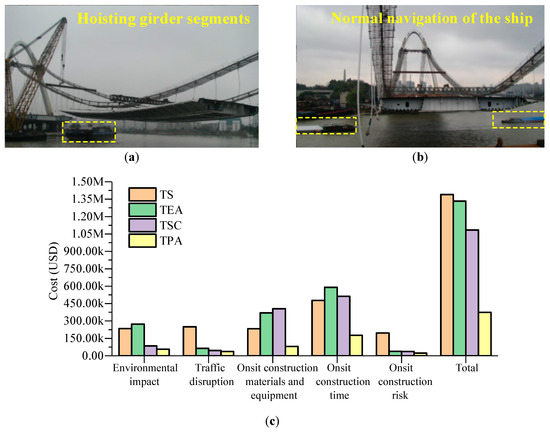
Figure 21.
Construction sustainability evaluation: (a) Hoisting girder segments; (b) channel operation during construction; and (c) economic evaluation for construction.
A comprehensive onsite construction cost is evaluated for the engineering practice. As shown in Table 4, the traffic disruption has been minimized to 76 hours during the entire 4 months period of girder erection. The environmental impact on the navigation channel can be eliminated. The total onsite construction time is significantly reduced to 21 days. In Table 4, materials for the GPAS include steel (ton) and reinforced bar (ton), and the equipment for erection and removal of GPAS includes arc welder (set) and plasma cutting machine (set).
Table 4.
Comprehensive onsite construction cost of TPA technology.
To compare sustainability among four construction technologies, the comprehensive onsite construction costs are calculated. As shown in Figure 21c, the total cost of TPA technology is the least, which accounts for 27%, 28%, and 34% of the total cost of TS, TEA, and TSC technology, respectively. In particular, the TPA technology significantly reduces the cost of environmental and traffic impact compared with other technologies, indicating that the impact on the environment and traffic is relatively small. Meanwhile, in terms of onsite materials and equipment, construction time and risk, TPA technology also offers obvious economic advantages.
6. Conclusions
To promote sustainable construction within real-world application, a comprehensive research is studied in the paper on sustainable construction by using novel technology for self-anchored suspension bridge. The main conclusions and innovation points are summarized as follows:
1. A novel temporary pylon-anchor (TPA) technology is proposed to minimize environmental impact and traffic disruption. A novel girder-pylon antithrust system (GPAS) is developed to achieve the engineering application for the TPA technology. The new TPA and GPAS technology could efficiently improve the construction sustainability.
2. A practical assessment method and index of sustainability on bridge construction technology are established to facilitate decision making for sustainable construction scheme. This paper creates an evaluation index system by considering different aspects: Environmental impact, traffic disruption, onsite construction materials and equipment, time, and risk.
3. A two-phase analytical approach for the GPAS is proposed by considering the global design and parametric study. In phase I, the global design of thrust shoulder is performed using a set of specially derived practical formulas. Various performance indicators are established to ensure the applicability and global reliability of the thrust shoulder. In phase II, the local stress distribution is improved based on effects of different parameters induced by grouped parametric analyses using 3D elaborate finite element analysis, which simulates the nonlinear surface contact behavior to consider the friction effect between the steel and the concrete.
4. The applicability and rationality of the proposed novel construction technology are illustrated by the successful application in real-world engineering. The field tests and sustainability assessment show that the proposed sustainability assessment method and analytical approach can facilitate the implementation of sustainable construction for self-anchored suspension bridge.
All in all, this research lays a solid and comprehensive basis to promote construction sustainability for self-anchored suspension bridge.
Author Contributions
X.W. (Xiaoming Wang) conceived and wrote the paper; X.W. (Xudong Wang) wrote the paper; Y.D. edited and improve the paper; C.W. provided the project data. All authors have read and agreed to the published version of the manuscript.
Funding
This research was funded by the Natural Science Foundation of Shannxi Province, grant number 2020JM-219, the China Postdoctoral Science Foundation, grant number 2019M653519, and the National Key Research and Development Project of China, grant number 2018YFB1600300.
Conflicts of Interest
The authors declare no conflict of interest.
References
- Penadés-Plà, V.; Martí, J.V.; García-Segura, T.; Yepes, V. Life-Cycle Assessment: A Comparison between Two Optimal Post-Tensioned Concrete Box-Girder Road Bridges. Sustainability 2017, 9, 1864. [Google Scholar] [CrossRef]
- Frangopol, D.M.; Dong, Y.; Sabatino, S. Bridge life-cycle performance and cost: Analysis, prediction, optimisation and decision-making. Struct. Infrastruct. Eng. 2017, 13, 1239–1257. [Google Scholar] [CrossRef]
- Kripka, M.; Yepes, V.; Milani, C. Selection of Sustainable Short-Span Bridge Design in Brazil. Sustainability 2019, 11, 1307. [Google Scholar] [CrossRef]
- Khan, M.A. Accelerated Bridge Construction: Best Practices and Techniques; Butterworth-Heinemann: Oxford, UK, 2014. [Google Scholar]
- Dong, Y. Performance assessment and design of ultra-high performance concrete (UHPC) structures incorporating life-cycle cost and environmental impacts. Constr. Build. Mater. 2018, 167, 414–425. [Google Scholar] [CrossRef]
- Gilchrist, A.; Allouche, E.N. Quantification of social costs associated with construction projects: State-of-the-art review. Tunn. Undergr. Space Technol. 2005, 20, 89–104. [Google Scholar] [CrossRef]
- Grierson, D. Towards a sustainable built environment. CIC Start Online Innov. Rev. 2009, 1, 70–77. [Google Scholar]
- Wang, Z.; Jin, W.-L.; Dong, Y.; Frangopol, D.M. Hierarchical life-cycle design of reinforced concrete structures incorporating durability, economic efficiency and green objectives. Eng. Struct. 2018, 157, 119–131. [Google Scholar] [CrossRef]
- Goh, C.S.; Chong, H.-Y.; Jack, L.; Faris, A.F.M. Revisiting triple bottom line within the context of sustainable construction: A systematic review. J. Clean. Prod. 2020, 252, 119884. [Google Scholar] [CrossRef]
- Anwar, G.A.; Dong, Y.; Zhai, C. Performance-based probabilistic framework for seismic risk, resilience, and sustainability assessment of reinforced concrete structures. Adv. Struct. Eng. 2019. [Google Scholar] [CrossRef]
- Gou, H.; Wang, W.; Shi, X.; Pu, Q.; Kang, R. Behavior of steel-concrete composite cable anchorage system. Steel Compos. Struct. 2018, 26, 115–123. [Google Scholar]
- Wang, X.; Frangopol, D.M.; Dong, Y.; Lei, X.; Zhang, Y. Novel Technique for Configuration Transformation of 3D Curved Cables of Suspension Bridges: Application to the Dongtiao River Bridge. J. Perform. Constr. Facil. 2018, 32, 04018045. [Google Scholar] [CrossRef]
- Gil, H.; Choi, Y. Cable Erection Test at Splay Band for Spatial Suspension Bridge. J. Bridg. Eng. 2002, 7, 300–307. [Google Scholar] [CrossRef]
- Sun, J.; Manzanarez, R.; Nader, M. Suspension Cable Design of the New San Francisco–Oakland Bay Bridge. J. Bridg. Eng. 2004, 9, 101–106. [Google Scholar] [CrossRef]
- Nie, J.; Zhou, M.; Wang, Y.-H.; Fan, J.-S.; Tao, M.-X. Cable Anchorage System Modeling Methods for Self-Anchored Suspension Bridges with Steel Box Girders. J. Bridg. Eng. 2014, 19, 172–185. [Google Scholar] [CrossRef]
- Nader, M. Accelerated Bridge Construction of the New Samuel De Champlain Bridge. J. Bridg. Eng. 2020, 25, 05019015. [Google Scholar] [CrossRef]
- Siwowski, T.; Wysocki, A. Horizontal Rotation via Floatation as an Accelerated Bridge Construction for Long-Span Footbridge Erection: Case Study. J. Bridg. Eng. 2015, 20, 05014014. [Google Scholar] [CrossRef]
- Sun, J.F.; Fang, J.H.; Tan, Q.Q.; F.Li, L. Introduction of novel construction method for superstructure of self-anchored suspension bridge. Prestress Technol. 2004, 25–29. [Google Scholar]
- Ultimate capacity of narrow type steel box section for railway self-anchored suspension bridge under bias compression. In Ultimate Capacity of Narrow Type Steel Box Section for Railway Self-Anchored Suspension Bridge under Bias Compression; Hong Kong Institute of Steel Construction: Hong Kong, China, 2019; Volume 15, pp. 173–184.
- Verkehr, B.F.; Wirtschaft, M.F.; Rheinland, L. Denkschrift zur Verkehrsübergabe der Wiederhergestellten Autobahnbrücke über den Rhein in Rodenkirchen bei Köln am 9.Dezember 1954; Springer Science and Business Media LLC: Berlin, Germany, 1954. [Google Scholar]
- Van Goolen, D. Self-Anchored Suspension Bridges; Delft University of Technology: Delft, The Netherlands, 2006. [Google Scholar]
- Navarro, I.J.; Yepes, V.; Martí, J.V. Life Cycle Cost Assessment of Preventive Strategies Applied to Prestressed Concrete Bridges Exposed to Chlorides. Sustainability 2018, 10, 845. [Google Scholar] [CrossRef]
- Penadés-Plà, V.; García-Segura, T.; Martí, J.V.; Yepes, V. An Optimization-LCA of a Prestressed Concrete Precast Bridge. Sustainability 2018, 10, 685. [Google Scholar] [CrossRef]
- Chang, Y.; Yang, Y.; Dong, S. Comprehensive Sustainability Evaluation of High-Speed Railway (HSR) Construction Projects Based on Unascertained Measure and Analytic Hierarchy Process. Sustainability 2018, 10, 408. [Google Scholar] [CrossRef]
- Seo, S.-Y.; Lee, B.; Won, J. Comparative Analysis of Economic Impacts of Sustainable Vertical Extension Methods for Existing Underground Spaces. Sustainability 2020, 12, 975. [Google Scholar] [CrossRef]
- Nie, J.; Tao, M.; Fan, J. Research on Cable Anchorage Systems for Self-Anchored Suspension Bridges with Steel Box Girders. J. Bridg. Eng. 2011, 16, 633–643. [Google Scholar] [CrossRef]
- Deng, W.; Xiong, Y.; Liu, D.; Zhang, J. Static and fatigue behavior of shear connectors for a steel-concrete composite girder. J. Constr. Steel Res. 2019, 159, 134–146. [Google Scholar] [CrossRef]
- Leroy, A.L.; Peter, G. Mechanics of bond and slip of deformed bars in concrete. J. Proc. 1967, 64, 711–721. [Google Scholar]
- Zhao, C.; Li, Z.; Deng, K.; Wang, W. Experimental investigation on the bearing mechanism of Perfobond rib shear connectors. Eng. Struct. 2018, 159, 172–184. [Google Scholar] [CrossRef]
- Huang, Q. Design Principle of Bridge Steel-Concrete Composite Structure; China Communications Press Co., Ltd.: Beijing, China, 2017. [Google Scholar]
- MOT. GB 50917-2013. Code for Design of Steel and Concrete Composite Bridges; CABP: Beijing, China, 2013. [Google Scholar]
- Lou, X.; Wu, H.; Cui, B. Designing and Construction of Suspension Bridge Main Cable Anchor Transferring Load Distributively; China Communications Press Co., Ltd.: Beijing, China, 2012. [Google Scholar]
- MOT. JTG D62-2004 Specifications for Design of Highway Reinforced Concreteand Prestressed Concrete Bridges and Culverts; CCP: Beijing, China, 2004. [Google Scholar]
- MOT. GB 50017-2017 Standard for Design of Steel Structures; CABP: Beijing, China, 2017. [Google Scholar]
- MOT. JTG/T F50-2011 Technical Specification for Construction of Highway Bridge and Culverts; CCP: Beijing, China, 2011. [Google Scholar]
- Ahn, J.-H.; Lee, C.-G.; Won, J.-H.; Kim, S.-H. Shear resistance of the perfobond-rib shear connector depending on concrete strength and rib arrangement. J. Constr. Steel Res. 2010, 66, 1295–1307. [Google Scholar] [CrossRef]
- Wang, S.; He, J.; Liu, Y.; Li, C.; Xin, H. Shear capacity of a novel joint between corrugated steel web and concrete lower slab. Constr. Build. Mater. 2018, 163, 360–375. [Google Scholar] [CrossRef]
- Gu, J.-C.; Liu, D.; Deng, W.-Q.; Zhang, J. Experimental study on the shear resistance of a comb-type perfobond rib shear connector. J. Constr. Steel Res. 2019, 158, 279–289. [Google Scholar] [CrossRef]
- Li, Z.; Zhao, C.; Shu, Y.; Deng, K.; Cui, B.; Su, Y. Full-scale test and simulation of a PBL anchorage system for suspension bridges. Struct. Infrastruct. Eng. 2019, 16, 452–464. [Google Scholar] [CrossRef]
- Willam, K.J. Constitutive model for the triaxial behaviour of concrete. Proc. Intl. Assoc. Bridge Structl. Eng. 1975, 19, 1–30. [Google Scholar]
- He, J.; Liu, Y.; Lin, Z.; Chen, A.; Yoda, T. Shear behavior of partially encased composite I-girder with corrugated steel web: Numerical study. J. Constr. Steel Res. 2012, 79, 166–182. [Google Scholar] [CrossRef]


© 2020 by the authors. Licensee MDPI, Basel, Switzerland. This article is an open access article distributed under the terms and conditions of the Creative Commons Attribution (CC BY) license (http://creativecommons.org/licenses/by/4.0/).