Article

Is the Relationship between Transportation and Communications Industries Complementary or Substitutional? An Asian Countries-Based Empirical Analysis Using Input-Output Accounts

1
School of Civil and Environmental Engineering, Georgia Institute of Technology, Atlanta, GA 30332, USA
2
Department of Urban Design & Planning, Hongik University, Seoul 04066, Korea
3
Department of Urban Planning, Hongik University, Seoul 04066, Korea
*
Author to whom correspondence should be addressed.
Sustainability 2020, 12(8), 3085; https://doi.org/10.3390/su12083085
Submission received: 12 March 2020 / Revised: 8 April 2020 / Accepted: 8 April 2020 / Published: 12 April 2020
(This article belongs to the Section Sustainable Transportation)

Abstract

:
The relationship between transportation and communications has been discussed throughout the past decades. This study also investigates that relationship to determine whether they are complementary or substitutive in terms of the industrial perspective, focusing mainly on six Asian countries (China, Japan, India, Korea, Indonesia, and Taiwan). National input-output (I-O) tables from the World Input-Output Database (WIOD) were used to construct research dataset. Each activity in the table was examined and fell into either transportation or communications category when they are related to those categories, thereby establishing six categories: Transportation manufacturing (TM), transportation utilities (TU), communications manufacturing (CM), communications utilities (CU), all transportation (AT), and all communications (AC). To examine the interrelationship between two sectors, direct and total coefficients were calculated for four benchmark years (2000, 2005, 2010, and 2014), then Spearman correlation analysis was conducted using those two coefficient matrices after weighting each coefficient using the economic contribution-based weight (ECBW). As a result, we confirm the predominant complementary relationship between two industries. Most Asian countries present consistent, dominant complementarity in both direct and total analysis. Although there are mixed total effects in Japan and Taiwan, the overall pattern demonstrates remarkable positive relationships. In analyzing the same effects in western countries, we also find the same straightforward positive association between two sectors, mostly in France, the US, and the UK. We believe that our findings can contribute to the literature by providing compelling evidence of the overall trend of a complementary relationship between two industries.

1. Introduction

As information and communication technology (ICT) including the technologies, products, and applications that facilitate mobile internet access [1] has rapidly developed, the relationship between transportation and communications has been extensively discussed in the transportation area e.g., [1,2,3]. In the long-term perspective, their relationship can affect sustainable urban development in various ways [4]. ICT could not only reduce roadway trips and traffic congestion, thereby improving air quality, but also allow people to engage in other activities while traveling to use their travel time more productively [5]. To date, numerous studies have focused on this relationship, and they found that ICT significantly influences personal trip patterns and movement of goods [6,7,8]. For example, Mokhtarian [9] theoretically identified the relationship as four possible associations: Complementarity, substitution, modification, and neutrality based on a former classification suggested by Salomon [10]. Since then, the role of ICT and its relationship with transportation has become an emerging issue, mainly focusing on whether it increases (or decreases) the amount of travel, i.e., the complementary (or substitutive) relationship.
In the early stages of study, most people believed that ICT would reduce the amount of travel itself, and indeed, a number of studies have supported this perspective. For instance, Hamer, Kroes and Van Ooststroom [11] explored the impact of telecommuting on travel behavior. The results showed that teleworking could lead to a significant reduction in the total number of trips (−17% by teleworkers) and in the peak-hour volume by car (−26%). Van Wee [12] looked into a recent trend that young generations tend to have less car-oriented attitudes, which can be viewed as a sign of substitution (also called as “peak car”), resulting from improved communication technology. Shabanpour, Golshani, Tayarani, et al. [13] conducted empirical analysis to provide evidence of the impacts of ICT on travel behavior. As a result, they revealed that telecommuting significantly reduce daily vehicle miles traveled (VMT) and vehicle total hours traveled (VHT), implying that ICT could make people travel less, i.e., substitution.
On the other hand, a number of scholars have claimed that ICT can generate additional travel as well. Mokhtarian [9] mentioned that complementarity would be observed in the long-term perspective after going through counteracting effects among complementarity, substitution, modification, and neutrality. Choo and Mokhtarian [14] explored the relationship between travel and communications using a structural equation model, incorporating demand, supply, and cost of the two areas, land use, and socio-demographic variables. The result demonstrated clear evidence of the complementary relationship between travel communications. Dal Fiore, Mokhtarian, Salomon, et al. [15] theoretically examined the possible impacts of communications on travel behavior. After reviewing an overall trend in transportation and mobile technology, the authors concluded that the development of ICT might contribute to the increase of the actual amount of travel (i.e., complementarity).
In the meantime, a few studies were conducted on an aggregate basis, not on a disaggregate basis since most of the prior studies investigating the relationship between the two have been carried out at the individual level. Selvanathan and Selvanathan [16] made a first attempt to analyze that the relationship between transportation and communications is either substitutional or complementary at the supra-national scale focusing on consumer uses in the United Kingdom and Australia. Choo, Lee and Mokhtarian [17] also used aggregate consumer expenditure data from the US (1984–2002) to analyze the relationship between two industries. The authors observed both complementarity and substitution between the two by estimating consumer demand functions, where implying the relationship is complicated, and there might not be a clear single effect.
Given that the majority of aggregate-based studies have looked into consumer demand for transportation and communications, even though considerable expenditures on transportation and communications have been made by industry areas [18], some researchers analyzed the association using input-output (I-O) analysis of industrial uses. Plaut [19] proposed this methodology at the level of national economy, focusing on European Communities for the first time. The author pointed out that previous work mainly focused on individual behavior even though the majority of transportation services are consumed by industry, not by households or travelers. The result showed that complementarity was apparently stronger and clearer than substitution across all countries. Lee and Mokhtarian [20] also used I-O accounts from the U.S. to investigate aggregate-based associations between transportation and communications inputs across all industries. In direct and total effects analyses, they found a significant sign of complementarity in the given period (almost 50 years), together with a pattern, shifting from substitution to complementarity in some cases.
Choo, Chang, Mokhtarian and Hwang [18] applied the same methodology to determine the relationship focusing on six major Asian countries and compared results with developed counties in the West (to the best of our knowledge, this is the latest research using I-O analysis to investigate the relationship between the two). Spearman correlation analyses demonstrated both complementarity and substitution. Nevertheless, complementarity seemed to be relatively dominant in most of the countries.
Importantly, few case studies have contributed to the literature in the Asia context in spite of a growing interest in Asian countries where distinctive travel characteristics (e.g., more transit-oriented attitudes, relatively low usage of automobile) and infrastructure such as well-organized public transit system [21] can be found. Furthermore, it is expected that a global trend of ICT technology will accelerate the growth of the communication market in emerging Asian countries such as China, India, as well as highly developed Asian countries in which ICT has matured considerably. Moreover, remarkable consumption of transportation and communications made by industry areas also promotes interest in I-O analysis in Asia. For instance, the proportion of transportation and communications goods and services consumed by industry in China, 2014 was more than five times higher than the share consumed by households, which accounts for approximately half of the total expenditures. Other major Asian countries such as Japan, Korea, and India are also showing similar patterns. Therefore, additional research on Asia can contribute to a comprehensive understanding of how those two industries are related to and mutually interact with each other, and moreover, how such association will affect nation-wide industries and economics in a broad sense.
Given the background above, this study is to examine the relationship between transportation and communications industries in Asia to answer the following research questions.
  • Is there clear evidence of a particular relationship between two sectors in Asia?
  • Can we make a consensus that that relationship is globally shifting from substitution to complementarity, getting into the early stage of complementarity, or else?
  • Are those findings useful to expect travel behavior patterns with the advent of autonomous vehicles (AVs) future or sustainable transportation in the future?
Basically, we uphold the Plaut’s approach, which suggests a methodology of using national input-output (I-O) accounts and calculating direct and total coefficients to examine the interrelationship between the two sectors. Six Asian countries (China, Japan, India, Korea, Indonesia, and Taiwan) were chosen based on GDP released in 2017, and they were compared with leading Western countries. The data were collected from the World Input-Output Database (WIOD), containing national input-output tables in current prices of 28 European Union (EU) and other 15 major countries in the world from 2000 to 2014. To investigate the relationship, transportation, and communications industries were classified into six categories: Transportation manufacturing (TM), transportation utilities (TU), communications manufacturing (CM), communications utilities (CU), all transportation (AT), and all communications (AC). Direct and total input coefficients were calculated across four benchmark years (2000, 2005, 2010, and 2014), after weighting each coefficient using the economic contribution-based weight (ECBW), which was introduced in Lee and Mokhtarian [20]. To determine the relationships for each combination (e.g., TM-CU) and period, Spearman correlation analysis was first carried out using pairs of correlation coefficients between two given categories, then temporal patterns of those relationships were analyzed.
The remainder of this study is organized as follows. The following section is the data description, including the structure of I-O accounts, data collection, and data manipulation. In Section 3, we specify the methodology. It includes direct and total coefficients, ECBW, and Spearman correlation analysis. Then, Section 4 analyzes the comparison results and provides findings and implications, followed by the results obtained from Western counties. Lastly, we provide in-depth discussion by summarizing our findings and implications with four keywords and briefly mention the limitations and directions of future research in Section 5.

2. Data Descriptions

2.1. Data Structure

The I-O table is a set of accounts presenting the flows of goods and services between major industry areas, which is commonly illustrated in a matrix form, as seen in Table 1. It presents the commodity inputs that are consumed by each area to produce outputs and the commodity produced by each area [22]. It provides an inclusive summary of how industries interact with each other, the structural changes of the economy, and the relative importance of an industry compared to other industries [18].
The industry classification typically follows the International Standard Industrial Classification of All Economic Activities (ISIC), which is released and maintained by the United Nations (UN). It comprises 21 top-level sections, including agriculture, mining, manufacturing, construction, trade, transportation, communications, finance, service activities, etc. This study adheres to the latest version of ISIC, the fourth revision (Rev.4). It is more detailed than the previous version (Rev.3) and identifies many new industry areas to respond to growing demands for reflecting changed economic structures resulted mainly from emerging technologies [23].

2.2. Data Collection

There are two available data sources: the World Input-Output Database (WIOD) and Organization for Economic Co-operation and Development (OECD) database, to analyze the relationship between transportation and communications. The present study chooses the World Input-Output Database (WIOD) released in 2016. Basically, this dataset follows a conceptual framework based on the system of national accounts and was constructed using officially published national I-O tables in current prices of 28 European Union (EU) and 15 other major countries in the world from 2000 to 2014 [24]. The OECD tables released in 2018 contain inter-industrial transaction flows of goods and services of each member country by following the conventional industrial classification. However, we did not choose this dataset because its industry classification does not fit our research classification for transportation and communications areas.
Although the WIOD provides continuous time-series I-O tables from 2000 to 2014 (the previous version covers 1995–2011), four benchmark years (2000, 2005, 2010, and 2014) are chosen in this study. With respect to target countries, this study selects the most representative six Asian countries: China, Japan, India, Korea, Indonesia, and Taiwan, based on GDP, data availability, and other economic circumstances. In addition, six major Western countries (France, Germany, Italy, the Netherlands, the UK, and the US) are also chosen as a reference group, which are the same choices as in Choo, Chang, Mokhtarian and Hwang [18].

2.3. Data Manipulation

To identify how transportation and communications sectors are related to each other, a preliminary process of defining what activities in the table belong to those two sectors is required. In this study, each activity is examined and falls into the transportation or communications category if it relates to either one of those areas. As Lee and Mokhtarian [20] proposed (refer to Table A1 in Appendix A), we determined four categories: Transportation manufacturing (TM), transportation utilities (TU), communications manufacturing (CM), and communications utilities (CU), as shown in Table 2.
There are two issues regarding the classification of the categories. First, there is no activity clearly representing the CM category in the latest version of the ISIC, a description including radio, television, and communication equipment coded as C32 in the previous revision belonged to the CM, but that item is not included in the latest revision. Alternatively, we chose the description coded as C26, manufacture of computer, electronic and optical products, to describe CM. For another, the computer programming, consultancy, and related activities, and information service activities coded as J62–J63 are a little problematic to be included in the CU category because computer programming seems not to be related to the communications utility. However, we decided to incorporate that activity because of strong associations between the other two items in J62–J63 and CU.

3. Methodology

3.1. Calculating Direct and Total Coefficients

In examining the relationship between transportation and communications, two types of indices: Direct (i.e., input) and total coefficients, are determined using the I-O table. The direct coefficients are monetary values of inputs of intermediate i (transportation or communications industries, in this study) that are required to produce one unit (one US Dollar in this study) of gross output in industry j. It can be formulated as:
a i j = X i j X j ,
where a i j is the direct coefficient of (i−j)th industry; X i j is the monetary value of inputs from industry i to generate gross outputs in industry j; and X j is the monetary value of the gross output in industry j. For example, the direct coefficient is 0.16 when one dollar of output of industry j requires 0.16 dollar of inputs in the transportation industry (Lee and Mokhtarian [20] defines it as “ A T j t is the dollar value of transportation required to produce one dollar of output of industry j in year t”).
However, the direct coefficient cannot explain the entire amount of inputs to produce one unit in each industry as every product used as inputs also needs other intermediate goods or services to be produced. For example, the production of a new aircraft requires various inputs, such as a jet engine, many types of metal for an aircraft frame, landing gear, etc. These components are not only defined as inputs of an airplane but also generate secondary production for themselves, indicating iteratively interdependent relationships among industries. Consequently, this series of production is repeatedly generated until all relevant industries are taken into account and calculated as the total sum of production.
In this case, it is almost unfeasible to trace all possible processes related to production. To overcome that limitation, the total coefficient (also known as the inverse matrix coefficient) considering the amount required indirectly as well as directly in infinite progression [18] is developed as a solution to simplifying such processes. It shows the monetary value change of induced production in industry i by a final demand increase of one unit in industry j. The total coefficient can be given as follows:
X i = j = 1 n X i j + F i ,
where X i is the total output of industry I, X i j denotes the (i−j)th intermediate input, n is the total number of industries in the I-O table, and F i is the final consumption of industry i. After replacing X i j with a i j X j using Equation (1), Equation (2) can be represented as follows:
X i = j = 1 n a i j X j + F i .
Equation (3) can be rewritten (see Lee and Mokhtarian [20] for details):
X = ( I A ) 1 F ,
where X is a column vector of total output by industry, I is the identity matrix, A is the direct coefficient matrix, and F indexes a column vector of final consumption by industry. In Equation (4), the inverse matrix (I − A)−1 is called the Leontief Inverse Matrix or total coefficient matrix, and can be represented as follows:
( I A ) 1 = ( λ 11 λ 12 λ 1 n λ 21 λ 22 λ 2 n λ n 1 λ n 2 λ n n ) .
The total coefficient matrix, (I − A)1, can be given as:
( I A ) 1 = I + A + A 2 + ,
because each direct coefficient a i j in the matrix A should be less than 1 (recall that a i j has a proportional value, as shown in Equation (1)), so that the total coefficient matrix, ( I A ) 1 = 1 1 A , represents the sum of the infinite geometric series as shown in Equation (7):
( I A ) 1 = 1 1 A = I + A + A 2 + .
Consequently, ( I A ) 1 in Equation (6) indicates the ultimate total effect, including direct (I) and indirect effects (A, A2, ) produced by the one unit change of final demand in a certain industry. Put simply, the total coefficient means the monetary value of total outputs of transportation (or communications) required by one unit change of each commodity j. Lee and Mokhtarian [20] described it as “The dollar-valued change in output in industry sector i [transportation or communications, in this study] resulting from a unit (one dollar) change in the final demand for commodity j”.

3.2. Economic Contribution-Based Weight (ECBW)

In analyzing the relationship between two sectors using the I-O table, the association can be distorted by the contribution of each industry to the overall economy [25]. For instance, although forestry and construction industries account for 5% and 40% of all industries, respectively, their outputs are treated equally (as $1 of output) in the analysis. To weigh the contributions of each industry area properly, the economic contribution-based weight (ECBW), which is proposed by Lee and Mokhtarian [26], is adopted in this study. This methodology allows us to weigh input coefficients by the dollar value based on the contribution of industry j to the overall industry.
The following equation presents how the ECBW can be calculated in the I-O analysis:
E C B W j = X j j = 1 N X j × N ,
where X j denotes the sum of gross production of industry j, and N is the number of industries with non-zero production in the entire economy. The final values of direct and total coefficients are determined by multiplying the ECBW by initial values of each coefficient.

3.3. Spearman Correlation Analysis

To investigate how the two sectors are correlated with each other, the Spearman’s rank correlation coefficient, which is a non-parametric measurement of rank correlation, is chosen since our coefficients obtained from the I-O table are not normally distributed. All continuous coefficients ( X i and Y i ) were converted to ranks r X i and r Y i ; then, their relationship was calculated in the same way as the Pearson correlation analysis. It can be given as presented below when all ranks can be defined as integers:
r s = 1 6 ( r X i r Y i ) 2 n ( n 2 1 ) ,
where r s is the Spearman correlation coefficient ranging from −1 to 1, and n is the number of cases. Using this indicator, we can take a snapshot showing how two categories are related. A positive coefficient means that two sectors are positively correlated (i.e., a complimentary association), meaning that they are likely to be used together in industries as complements, whereas a negative score below zero denotes a substitutive relationship between two categories [19].
Based on this indicator, following relationships between transportation and communications are measured, together with an association between all transportation industries (AT) and the communications industries (AC):
  • Relationship between TM and CM;
  • Relationship between TM and CU;
  • Relationship between TU and CM;
  • Relationship between TU and CU;
  • Relationship between AT and AC.

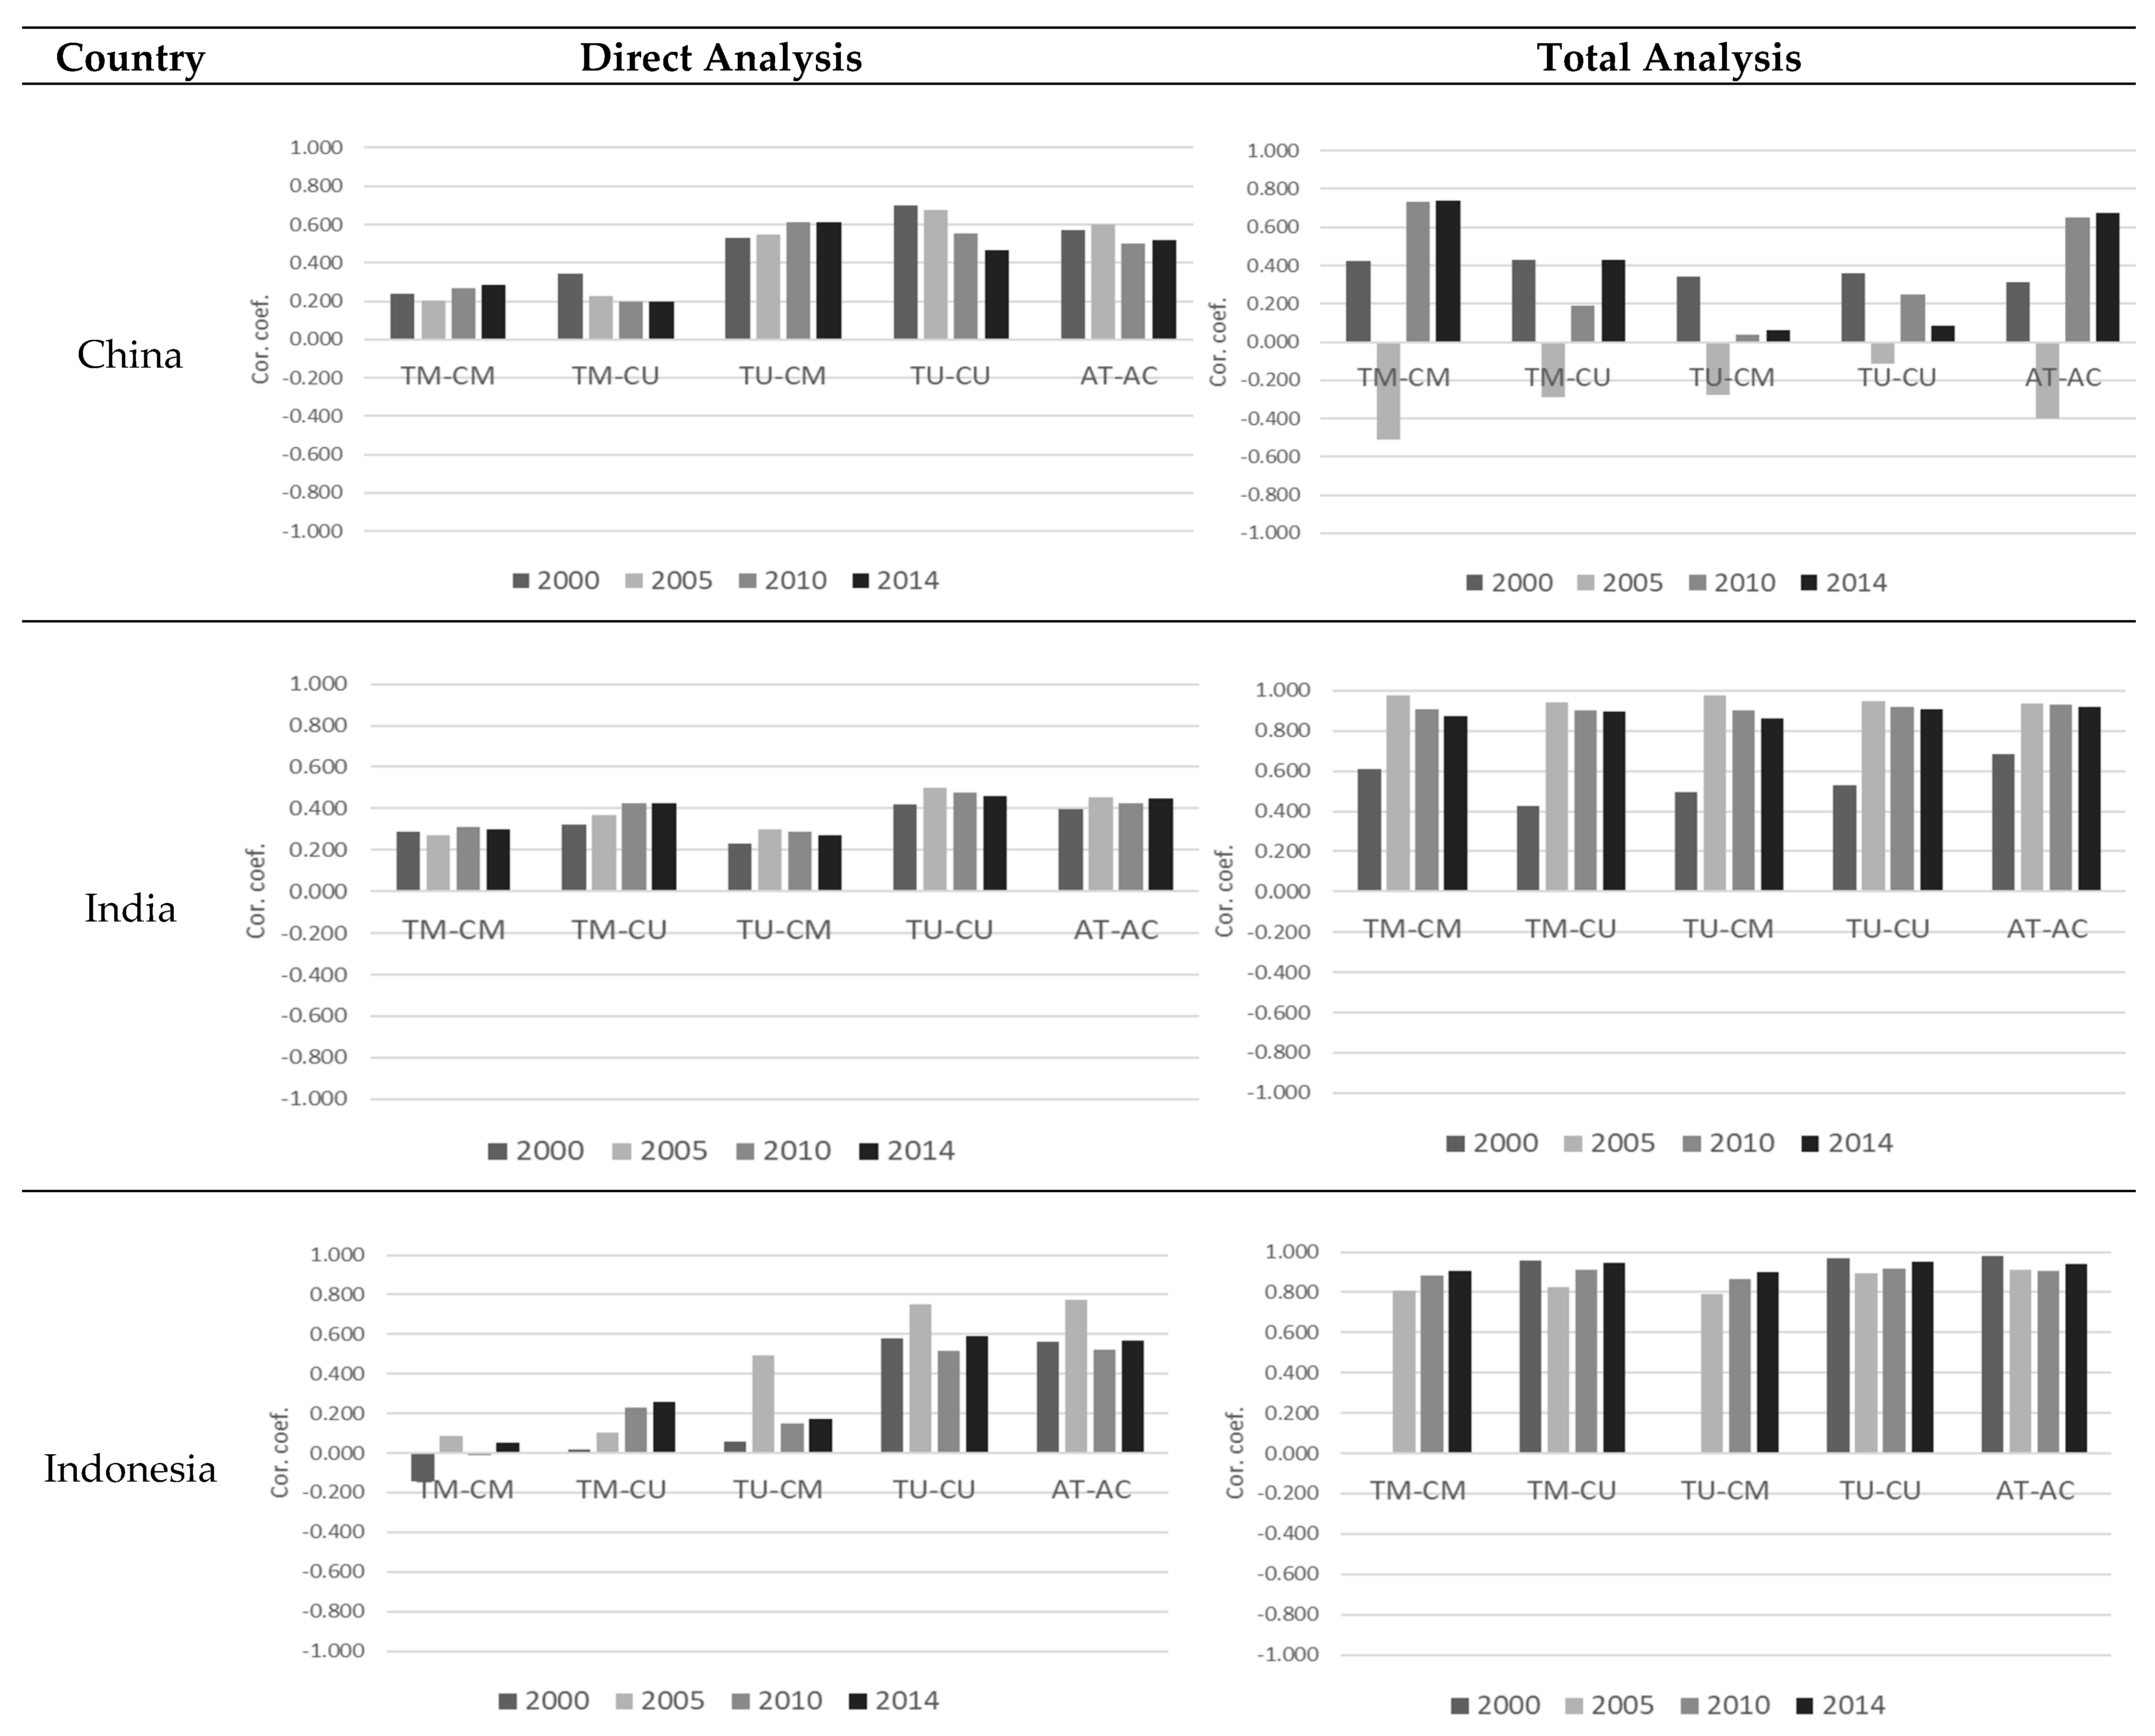
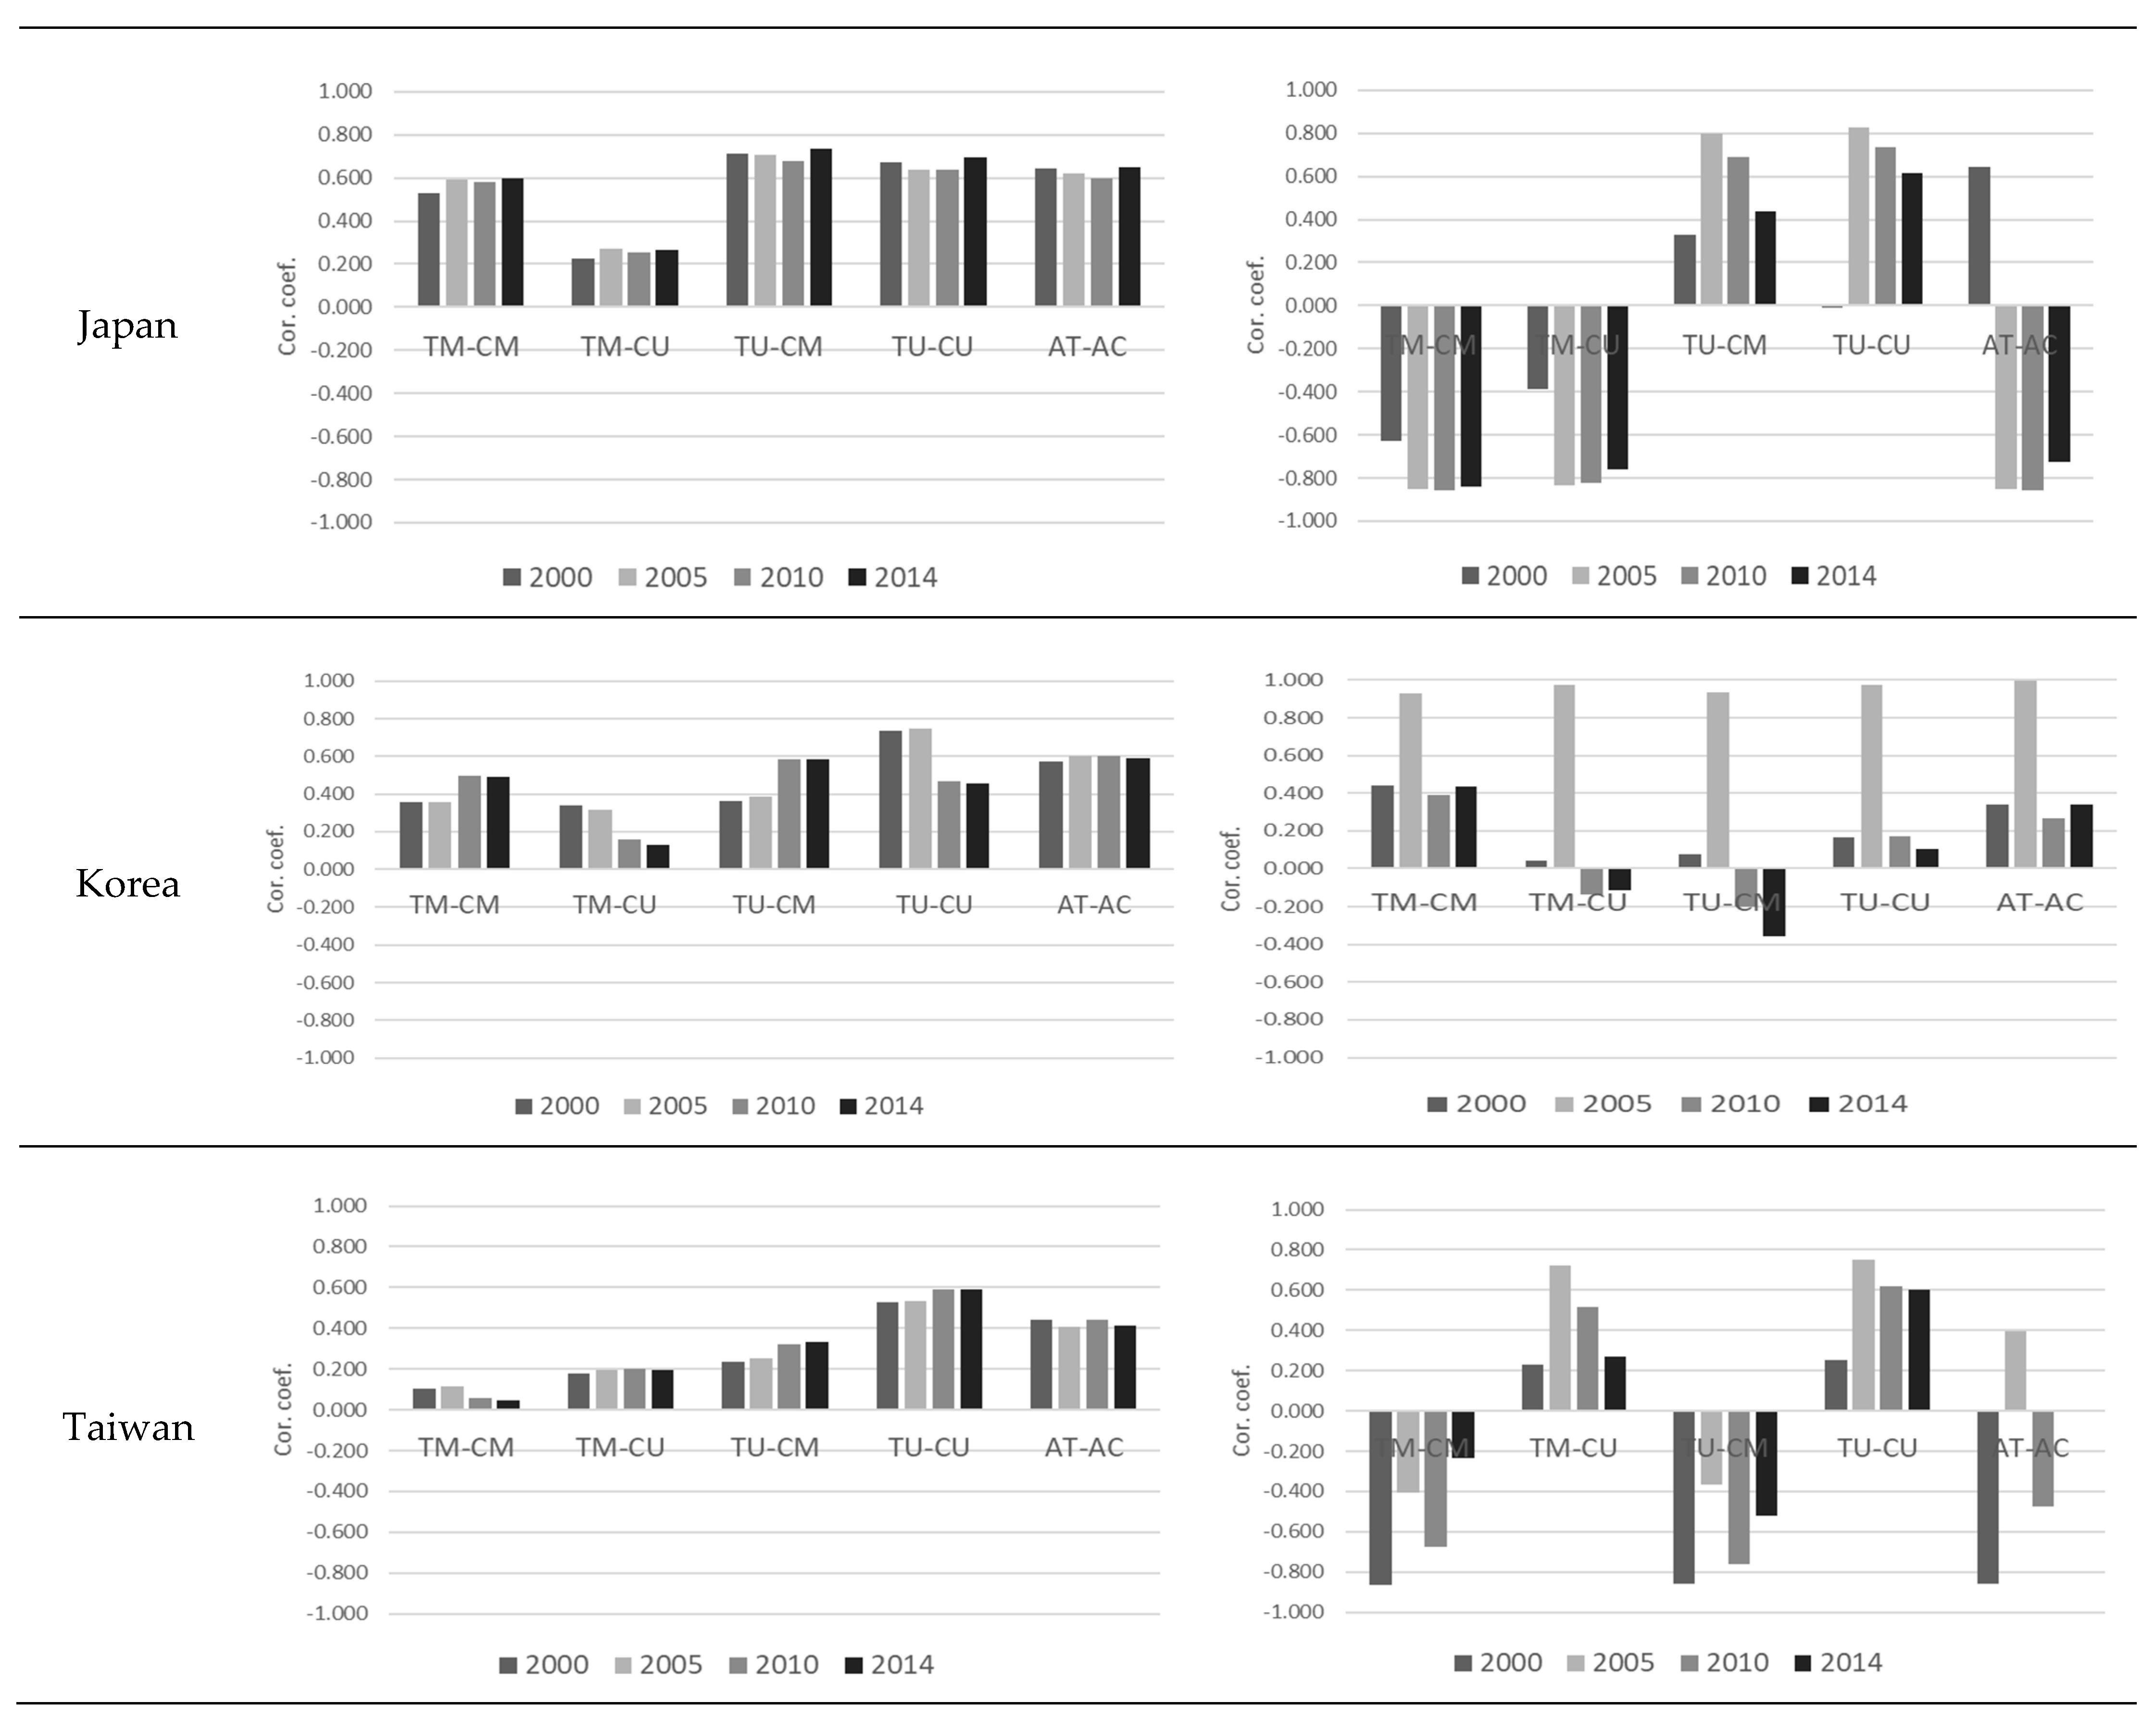
4. Relationships Analysis and Interpretation

4.1. Direct Analysis

Based on the economically weighted direct coefficients, the correlation coefficients between two categories were calculated for given periods. The result of direct analysis provides empirical evidence of strong complementary relationships between transportation and communications in major Asian countries (see Figure 1 and Table A2 in Appendix B).
All five pairs in China mostly show that the dominant association is complementarity across four benchmark years. In particular, the transportation utility pairs (TU-CM and TU-CU) present straightforward positive correlations (0.6 on average), together with the pair of all transportation and communications (AT-AC). TM-related pairs, however, tend to be insignificant. The TM-CM and the TM-CU relationships were not significant in 2000 and 2005 at α = 0.1 . It means that the effect of transportation manufacturing on communications or vice versa is relatively weak compared to that of the transportation utility.
With respect to that relationship in Taiwan, it is found that the overall trend of correlations is considerably similar to that in China: (1) There is a consistent, complementary association between the two sectors, and it outstands in TU-related pairs (the average Spearman correlation coefficient was 0.424), and (2) the transportation manufacturing pairs do not have a significant relationship with the communications industry across four benchmark years (albeit the coefficients were all positive, they were not significant).
We observe a similar tendency between Japan and Korea. There are mostly strong, positive relationships between transportation and communications in four out of five pairs, which means that the two sectors are complementally correlated with each other. The correlation of the TM-CU pair is relatively weak (almost insignificant) compared to other pairs, which is a similar outcome in China.
We find the same complementarity in India. There is a uniform positive relationship between the two areas across all pairs in the given period. On the other hand, unlike the aforementioned countries, the transportation utility and the communications manufacturing (TU-CM) are not strongly correlated. Most of them (four out of five coefficients) were statistically significant, but the average correlation coefficient was only 0.271.
In investigating the relationship in Indonesia, we ruled out CM-related coefficients in 2000 as the numbers related to the CM category (industry code is C26 in the I-O table) were not provided. It seems that numbers in the CM category were not compiled, or there was no activity in that industry area at that time. Based on the direct analysis, we conclude that the outcome is less informative to explain the relationship between the two industries. Specifically, there are a few significant positive relationships only in the utility pair (TU-CU) while the entire transportation and communications pair (AT-AC) and the other three pairs failed to describe how those two areas are correlated (they were not significantly correlated as presented).
In sum, as mentioned above, we observe a strong complementary association between two industrial sectors. That is, as the commodity inputs of transportation utility for each industry increases, the commodity inputs of communications for the same industry are also likely to increase. All correlation coefficients (except for one case of Indonesia which had a non-significant negative correlation but was already excluded from our analysis) are positive across four time periods, and more than half of them were statistically significant at the 5% level. In particular, there is a predominant complementary relationship with TU-related pairs and the all industry category (AT-AC). In contrast, the magnitude of TM-related associations is relatively slim. We presume that the capacity for manufacturing vehicles for local demand or having a major vehicle manufacturer which potentially affects the national transportation manufacturing economy might partly lead to this discrepancy. This speculation can be supported by comparing the overall trend of TM-related pairs by country. Four countries (China, India, Korea, and Japan) demonstrated a steady, clear, positive relationship over time, whereas the other two countries (Indonesia, and Taiwan), which tend to have relatively low productivity and rely on international manufacturing companies, show somewhat weak correlations.

4.2. Total Analysis

To investigate the relationship between two industry sectors in more depth, the same approach which is used for the direct analysis is applied to the total analysis. The result shows a somewhat irregular trend compared to the direct analysis, as shown in Figure 1 and Table A2 in Appendix B. Let us take a look at details by country.
Most relationships in China are complementarity except for the fluctuation in 2005. It seems to be outliers having opposite relationships (i.e., substitution). Patterns of adjacent years (2004 and 2006) were also examined to determine whether the irregular pattern in 2005 is acceptable. As a result, it turned out not to be the outlier, thus we decided to include it. We speculate that temporary socio-economic variations may lead to this outcome (the same pattern was observed in Korea). Despite those non-uniform observations in 2005, it seems that complementarity is predominant in China.
The patterns for all five pairs were consistently positive in India and Indonesia, that is, the relationship between transportation and communications is completely complementary. All coefficients were statistically significant at the 1% level and the average correlation coefficient was over 0.8. Interestingly, there has been a significant rise with high correlations ( γ s = 0.918, on average) across five categories in India since 2005. We view it as a sign of entering a stable stage of complementarity.
Regarding Japan, we can see both complementarity and substitution in the total analysis. Firstly, the correlation coefficients of the TU-related pairs were positive, which means that as the amount of intermediate consumed by the transportation utility area increases, the magnitude of induced production of intermediate by a final demand increase in communications tends to increase. Given that result, it is concluded that complementarity certainly exists between transportation utility areas and the overall communications industry. Secondly, the substitutive relationship is observed in the TM-related pairs and all transportation and the all communications (AT-AC) pair. This is why we adopted two different analyses. At first glance, it seems that the relationship is complementary, but the total analysis demonstrates a somewhat different association, implying a more complicated association. We guess that economic stagnation in Japan from 1991 to 2000 (also called Lost Decade) could temporarily affect the general economy, including both industry sectors in the early 2000s, resulting in that opposite pattern.
There are two intriguing observations in Korea. For one thing, it seems that there were potential outliers in 2005 across five pairs, having highly positive correlations between the two areas (average γ s = 0.963). As described above, we view it as acceptable outliers resulting from temporary variation in the socio-economic context. Therefore, those coefficients were included in this study. Secondly, the overall magnitude of the positive association seems relatively weak compared to that in the direct analysis. There is no significant relationship in the TM-CU and TU-CM pairs (their Spearman correlation coefficients were mostly insignificant across four benchmark years). In addition, the other three pairs also do not present a strong positive relationship (average γ s = 0.295).
The total analysis in Taiwan shows a fairly different result from the direct analysis. Two opposite relationships, complementarity and substitution, were simultaneously found in the total analysis, which appears to be similar to the pattern in Japan. CU-related pairs (TM-CU and TU-CU) indicate positive relationships, whereas there is a clear substitutive relationship in CM-related pairs. In the case of AT-AC, there is an irregular variation. A strong substitution effect is observed in 2000, followed by a changed sign of complementarity in 2005, then it turns to substitution again.
In summary, we basically find a relatively weak complementary relationship compared to the direct analysis. Only two countries (India and Indonesia) have uniform positive correlations, while the other four countries (China, Korea, Japan, and Taiwan) do not illustrate a clear relationship between transportation and communications in the total analysis. China and Korea present both a negligible positive relationship and a couple of cases having negative correlation coefficients. Probably due to the characteristic of the total coefficient it takes secondary or more interdependent relationships (i.e., direct and indirect effects in the extended interaction in the process of production).
The result also shows that when interdependent associations among industries are taken into account, the relationship between transportation and communications seems to become more complicated. In particular, these observations can be found in countries with an advanced communication infrastructure and/or transportation system such as Korea and Japan. Based on that result, we can assume that the developed economy might affect that relationship in a complex way, meaning that there is a possibility that a specific relationship could not be observed.
Interestingly, the majority of CU-related pairs have positive coefficients across six countries, which supports our key finding, complementarity, in the direct analysis. Synthesizing our findings and interpretation presenting a homogeneous positive association in both analyses, we can conclude that a definite complementarity exists between the transportation and communications industries despite a less straightforward correlation in some countries.
As a side note, we need to point out that this study provides a somewhat different outcome from previous research [18], particularly in the total analysis. This might be because the prior one (1) was conducted using I-O tables with ISIC ver. 3 (United Nations, New York, NY, USA, 2002), whereas our dataset follows a recent classification of ISIC ver. 4, or (2) did not consider how much each industry contributes to the entire economy, namely, all coefficients were not weighted properly, which potentially includes many cases having negative relationships between transportation and communications in the total analysis even though those two sectors were positively correlated in the direct analysis.

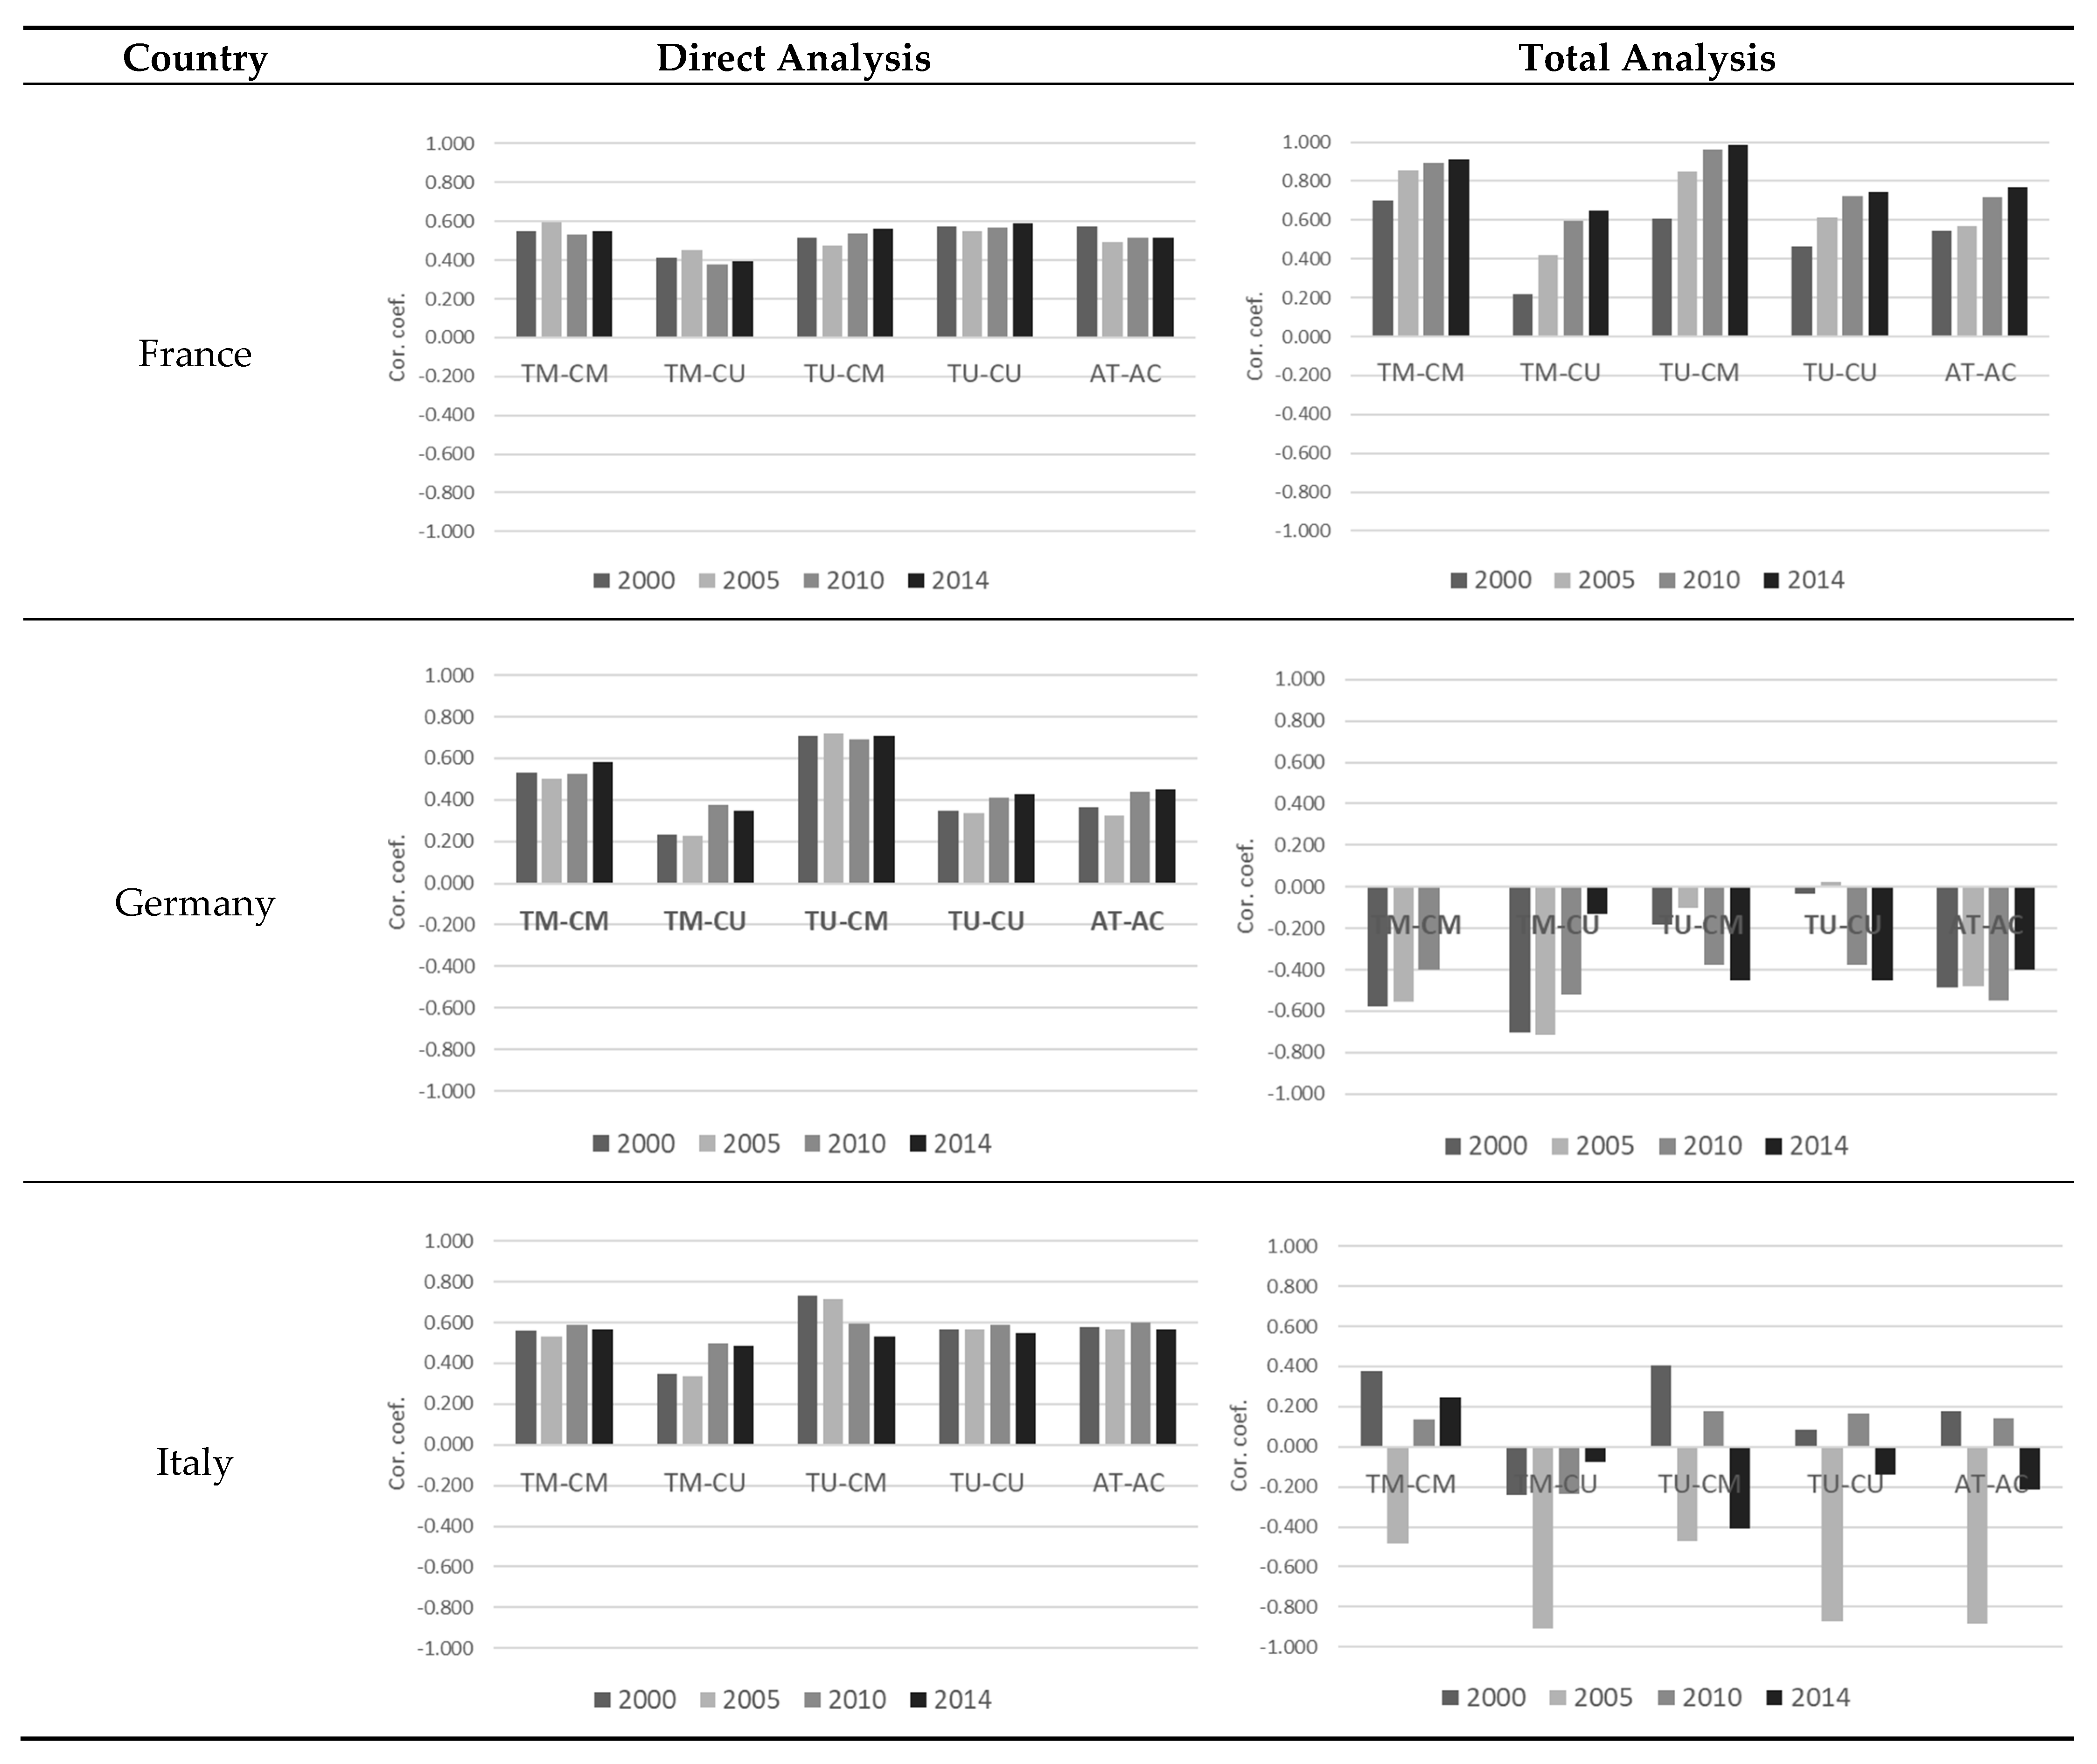
4.3. Overall Trends in Leading Western Countries and Its Comparison with Asia

The same analysis for Western countries was also conducted to examine the relationship between transportation and communications industries, then we compared their overall trends with Asian cases that we obtained (Figure 2). In this subsection, we do not provide detailed interpretations for each country, but broadly look through a time-series trend to summarize key implications (for detailed information, see Table A3 in Appendix B).
First of all, we can confirm the predominantly positive association between transportation and communications in Western countries using direct analysis. The same dominant trend of complementarity is found across six countries. Specifically, a vast majority of correlation coefficients (99% of entire pairs) were statistically significant at the 1% level with positive signs.
On the other hand, the total analysis hints that substitution partially exists between two industries. The analysis shows that France, the UK, and the US have strong complementarity, but the other three countries (Germany, Italy, and the Netherlands) do not present a particular relationship (their coefficients were mostly insignificant). Unlike our expectation that more developed countries (e.g., ranked higher on the top GDP list) tend to exhibit a complicated relationship between transportation and communications, as shown in Asian countries, the result indicates that it does not have to be the case. We can easily find a uniform complementary relationship in France, the US, and the UK in any given benchmark year while the other three countries present a distinct relationship. In Germany, we observe a uniformly negative correlation of the total effect. The TM-related pairs likely had higher negative coefficients (average correlation coefficient was −0.450) and most of them were statistically significant at α = 0.05, except for two cases in 2014. The other three sets of the total effect do not exhibit an intriguing result (most of them were statistically insignificant). Italy and the Netherlands do not demonstrate a particular relationship. Dramatic sign changes occurred due to some suspicious relationships (opposite signs from the main direction) in 2005 among five pairs, and other total effects were not statistically significant.

5. Discussion and Conclusions

This study explores the relationship between transportation and communications industries in Asia to reveal what the association is (i.e., complementarity, substitution, or something else). Using the input-output (I-O) table obtained from World Input-Output Database (WIOD), we measured direct and total effects, which describes monetary values of an intermediate consumed by production of gross output in a certain industry (transportation and communications, in this study) and monetary valued change of an intermediate by a final demand increase of one unit in a certain industry, respectively. All industries related to transportation or communications were classified into six categories: transportation manufacturing (TM), transportation utilities (TU), communications manufacturing (CM), communications utilities (CU), all transportation (AT), and all communications (AC); then, five pairs of the relationship (TM-CM, TM-CU, TU-CM, TU-CU, and AT-AC) are determined for four benchmark year (2000, 2005, 2010, and 2014). Spearman correlation analysis was employed to investigate correlation for each pair. Six major Asian countries (China, India, Indonesia, Japan, Korea and Taiwan) were chosen to see the relationship between two sectors at the national scale, together with six developed western countries (France, Germany, Italy, the Netherlands, the UK and the US) as a comparison group. The direct and total analyses demonstrate that predominant positive correlation (i.e., complementarity) exists between the two industries in both Asian and western countries. The results empirically provide compelling evidence of how those two sectors are related to each other at the aggregate level, which is our most significant contribution to literature.
In response to the three research questions which are presented in Section 1, key findings and implications are summarized into four keywords as follows.
● The dominant complementary relationship in Asia
We confirm the uniform, predominant positive relationship between transportation and communications industries—i.e., complementarity—in the direct analysis of Asian countries. It supports the perspective that overall trend of the relationship is shifting from substitution to complementarity which has been widely discussed in previous studies. In the total analysis, the overall complementary relationship seems weaker, but we could find some meaningful results indicating complementarity. Specifically, the total effect between two areas is fairly complicated compared to that of direct impacts; for example, (1) Japan and Taiwan presented variation in temporal patterns, and (2) China and Korea mostly had positive correlation coefficients, but the overall pattern was blurred due to suspicious observations in 2005.
● Not all countries is demonstrating uniform complementarity
All six countries in the western region also showed a clear complementarity in the direct analysis. However, there are somewhat different patterns in the total analysis as some countries in Asia presented. Based on Asian cases, we assumed that more advanced countries tend to show fluctuation and inconsistent relationships between two industries, meaning that the relationship is likely to have the positive relationship in the development stage, then it turns into complicated patterns. However, our assumption seems incorrect; France, the UK, and the US presented a clear positive relationship, whereas other three countries mostly did not have a statistically significant correlation and provided a relatively weak sign of complementarity in the total analysis. Those result tell us that further research is required to explore what characteristics lead to this discrepancy in more depth.
● Negative impact on transportation sustainability?
Some researchers are claiming that the development of information and communication technology (ICT) will lead to a substantial decrease in trips (i.e., substitutive effect of communications). However, our findings say that it does not seem to be the case. The positive relationship between two industries indirectly implies that ICT constitutes not a replacement of trips, but a potential increase in travel demand (a sizable review explaining how ICT allows people to travel more than before can be found in Mokhtarian [27]). It means that there is a possibility of a decrease in sustainability because more (and probably longer) trips will potentially result in increases in traffic congestion and air pollution.
● Expected strong complementary relationship in an autonomous vehicle (AV) future
Given that the relationship is shifting to complementarity, we can expect that tendency will be accelerated in the next generation of ICT and transportation where those two elements are combined into a new type of transportation service. Autonomous vehicles (AVs) or mobility as a service (MaaS) meaning “the accessibility and usage of individual intermodal and multimodal solutions” [28] such as Uber and Lyft could be a case. As those markets are explosively emerging, two main industries which are directly connected with AV technology, i.e., vehicle manufacturing and communications, will be likely to be growing simultaneously. In this process, the complementary relationship between two sectors will probably be enhanced.
Of course, there are more future research directions to improve our findings. Firstly, some industrial categories seem vague; in particular, activities in the communications manufacturing (CM) category might not represent what we want to deal with. Specifying that category would be useful to provide empirical evidence supporting our key argument. Secondly, it is necessary to clarify (1) what factors caused outliers in 2005; and (2) why the completely opposite pattern between Asia and the West occurred in total coefficient matrices. In addition, it would be also highly desirable to conduct in-depth case studies focusing on what country-specific characteristics lead to the relationship and investigate future impacts of complementarity on transportation and potential threats to sustainability.

Author Contributions

S.C. (Sangho Choo) was heavily involved the previous research [18] which inspired this study as a first author. In this study, he provided the research concept, academic background, the specific analysis method related to modeling, and insightful findings obtained from estimation results. S.C. (Sungtaek Choi) collected and built dataset of I-O accounts from WIOD and analyzed interrelationships using a statistical tool to draw implications. S.K. also contributed to collecting and manipulating data and was involved in analyzing dataset. This article was mainly written by S.C. (Sungtaek Choi), and S.C. (Sangho Choo) and S.K. improved this paper as proofreaders. All authors have read and agreed to the published version of the manuscript.

Funding

This research was supported by the Basic Science Research Program through the National Research Foundation of Korea (NRF) funded by the Ministry of Education (NRF-2017R1D1A1B03031006).

Acknowledgments

This research is inspired by Lee and Mokhtarian [20], and overall structure of this paper is organized based on the previous study conducted by Choo, Chang, Mokhtarian and Hwang [18].

Conflicts of Interest

The authors declare no conflict of interest.

Appendix A

Table A1. Industry classification of I-O accounts.
Aggregate
Category
Activity
Lee and Mokhtarian [20] (1)Choo, Chang, Mokhtarian and Hwang [18] (2)This Study
Communications manufacturing (CM)3341: Computer and peripheral equipment manufacturing
334A: Audio, video, and communications equipment manufacturing
32: Radio, television and communication equipmentC26: Manufacture of computer, electronic and optical products
Transportation manufacturing (TM)3361: Motor vehicle manufacturing
336A: Motor vehicle body, trailer, and parts manufacturing
364: Aerospace product and parts manufacturing
336B: Other transportation equipment manufacturing
3240: Petroleum and coal products manufacturing
34: Motor vehicles, trailers, and semi-trailers
351: Building & repairing of ships and boats
353: Aircraft and spacecraft
352&359: Railroad equipment and transportation equipment n.e.c
C29: Manufacture of motor vehicles, trailers and semi-trailers
C30: Manufacture of other transport equipment
Transportation utilities (TU)4820: Rail transportation
4850: Transit and ground passenger transportation
4840: Trucking transportation
4930: Warehousing and storage
4830: Water transportation
4810: Air transportation
48A0: Scenic and sightseeing transportation and support activities for transportation
4920: Couriers and messengers
5615: Travel arrangement and reservation services
60: Land transport; transport via pipelines
61: Water transport
62: Air transport
63: Supporting & auxiliary transport activities; activities of travel agencies
H49: Land transport and transport via pipelines
H50: Water transport
H51: Air transport
H52: Warehousing and support activities for transportation
Communications utilities (CU)5133: Telecommunications
5131: Radio and television broadcasting
5132: Cable networks and program distribution
64: Post and telecommunicationsJ61: Telecommunications
J62–J63: Computer programming, consultancy and related activities; information service activities
(1) Research data were provided by the Bureau of Economic Analysis (BEA) of the U.S. Department of Commerce. BEA labels are presented based on the classification in 1977. (2) Dataset was constructed using the Organization for Economic Cooperation and Development (OECD) database which is classified under the United Nations (UN) International Standard Industrial Classification (ISIC) revision 3.

Appendix B

Table A2. Spearman correlation analysis results for Asian countries.
CountryYearDirect AnalysisTotal Analysis
TM-CMTM-CUTU-CMTU-CUAT-ACTM-CMTM-CUTU-CMTU-CUAT-AC
China2000 0.345 **0.529 ***0.698 ***0.569 ***0.426 ***0.428 ***0.342 ***0.357 ***0.310 ***
2005 0.546 ***0.674 ***0.598 ***−0.509 ***−0.290 ***
2010 0.200 ***0.612 ***0.553 ***0.501 ***0.735 *** 0.652 ***
2014 0.614 ***0.467 ***0.517 ***0.738 ***0.429 *** 0.674 ***
India2000 0.320 ** 0.417 ***0.397 ***0.610 ***0.428 ***0.494 ***0.531 ***0.683 ***
2005 0.366 ** 0.502 ***0.454 ***0.976 ***0.941 ***0.903 ***0.917 ***0.930 ***
20100.308 **0.424 *** 0.479 ***0.428 ***0.910 ***0.901 ***0.903 ***0.917 ***0.930 ***
2014 0.428 *** 0.462 ***0.450 ***0.874 ***0.896 ***0.861 ***0.908 ***0.917 ***
Indonesia2000 0.577 ***0.559 ***0.888 ***0.958 ***0.894 ***0.968 ***0.981 ***
2005 0.492 ***0.751 ***0.773 ***0.806 ***0.826 ***0.793 ***0.893 ***0.912 ***
2010 0.517 ***0.523 ***0.884 ***0.909 ***0.864 ***0.920 ***0.904 ***
2014 0.589 ***0.567 ***0.907 ***0.944 ***0.898 ***0.950 ***0.941 ***
Japan20000.530 *** 0.713 ***0.671 ***0.645 ***−0.626 ***−0.385 ***0.327 ** 0.646 ***
20050.590 *** 0.709 ***0.638 ***0.619 ***−0.854 ***−0.837 ***0.798 ***0.828 ***−0.854 ***
20100.582 *** 0.679 ***0.637 ***0.600 ***−0.857 ***−0.823 ***0.692 ***0.738 ***−0.859 ***
20140.600 *** 0.733 ***0.693 ***0.648 ***−0.840 ***−0.762 ***0.435 ***0.613 ***−0.725 ***
Korea2000 0.363 ***0.738 ***0.574 ***0.438 *** 0.337 ***
2005 0.384 ***0.749 ***0.603 ***0.930 ***0.974 ***0.935 ***0.976 ***0.998 ***
20100.496 *** 0.586 ***0.470 ***0.604 ***0.391 ***
20140.494 *** 0.582 ***0.454 ***0.592 ***0.436 *** −0.357 *** 0.342 ***
Taiwan2000 0.529 ***0.439 ***−0.867 *** −0.858 *** −0.858 ***
2005 0.536 ***0.410 ***−0.406 ***0.722 ***−0.366 ***0.750 ***0.396 ***
2010 0.321 ***0.588 ***0.440 ***−0.676 ***0.519 ***−0.761 ***0.621 ***−0.474 ***
2014 0.331 ***0.592 ***0.412 *** −0.521 ***0.603 ***
Note 1: Empty cells mean not statistically significant at 5% level. Note 2: ***, ** indicate statistical significance at the 1% and 5% levels, respectively.
Table A3. Spearman correlation analysis results for western countries.
CountryYearDirect AnalysisTotal Analysis
TM-CMTM-CUTU-CMTU-CUAT-ACTM-CMTM-CUTU-CMTU-CUAT-AC
France20000.551 ***0.410 ***0.515 ***0.575 ***0.575 ***0.700 *** 0.607 ***0.465 ***0.547 ***
20050.594 ***0.450 ***0.477 ***0.552 ***0.493 ***0.852 ***0.418 ***0.848 ***0.611 ***0.568 ***
20100.535 ***0.379 ***0.536 ***0.566 ***0.517 ***0.896 ***0.595 ***0.965 ***0.720 ***0.719 ***
20140.548 ***0.397 ***0.560 ***0.589 ***0.513 ***0.910 ***0.646 ***0.984 ***0.743 ***0.766 ***
Germany20000.531 *** 0.706 ***0.349 ***0.367 ***−0.576 ***−0.701 *** −0.484 ***
20050.503 *** 0.717 ***0.333 ***0.324 ***−0.555 ***−0.717 *** −0.482 ***
20100.527 ***0.376 ***0.693 ***0.410 ***0.436 ***−0.397 ***−0.518 ***−0.378 ***−0.377 ***−0.551 ***
20140.582 ***0.349 ***0.709 ***0.430 ***0.453 *** −0.449 ***−0.451 ***−0.402 ***
Italy20000.562 ***0.347 ***0.731 ***0.565 ***0.579 ***0.379 *** 0.403 ***
20050.531 ***0.335 ***0.717 ***0.565 ***0.566 ***−0.481 ***−0.909 ***−0.472 ***−0.873 ***−0.887 ***
20100.589 ***0.497 ***0.592 ***0.588 ***0.598 ***
20140.565 ***0.487 ***0.531 ***0.549 ***0.565 *** −0.411 ***
The Nethe-20000.562 ***0.347 ***0.731 ***0.565 ***0.579 ***0.379 *** 0.403 ***
lands20050.531 ***0.335 ***0.717 ***0.565 ***0.566 ***−0.481 ***−0.909 ***−0.472 ***−0.873 ***−0.887 ***
20100.589 ***0.497 ***0.592 ***0.558 ***0.565 ***
20140.565 ***0.487 ***0.531 ***0.549 ***0.565 *** −0.411 ***
The UK20000.499 ***0.415 ***0.716 ***0.663 ***0.648 ***0.937 ***0.826 ***0.993 ***0.899 ***0.899 ***
20050.544 ***0.417 ***0.732 ***0.686 ***0.655 ***0.944 ***0.831 ***0.989 ***0.893 ***0.892 ***
20100.497 ***0.564 ***0.431 ***0.723 ***0.725 ***0.882 ***0.966 ***0.908 ***0.997 ***0.998 ***
20140.472 ***0.530 ***0.389 ***0.732 ***0.743 ***0.854 ***0.783 ***0.916 ***0.878 ***0.868 ***
The US20000.481 ***0.361 ***0.505 ***0.508 ***0.582 ***0.884 ***0.876 ***0.888 ***0.888 ***0.968 ***
20050.500 ***0.440 ***0.453 ***0.485 ***0.505 ***0.964 ***0.933 ***0.941 ***0.934 ***0.950 ***
20100.553 ***0.494 ***0.464 ***0.513 ***0.505 ***0.956 ***0.902 ***0.928 ***0.921 ***0.915 ***
20140.471 ***0.416 ***0.492 ***0.541 ***0.513 ***0.959 ***0.933 ***0.936 ***0.942 ***0.948 ***
Note 1: Empty cells mean not statistically significant at 5% level. Note 2: ***, ** indicate statistical significance at the 1% and 5% levels, respectively.

References

  1. Choi, S.; Mokhtarian, P.L. How attractive is it to use the internet while commuting? A work-attitude-based segmentation of Northern California commuters. Transp. Res. A 2020, unpublished work. [Google Scholar]
  2. Jing, P.; Huang, H.; Ran, B.; Zhan, F.; Shi, Y. Exploring the Factors Affecting Mode Choice Intention of Autonomous Vehicle Based on an Extended Theory of Planned Behavior—A Case Study in China. Sustainability 2019, 11, 1155. [Google Scholar] [CrossRef] [Green Version]
  3. Machado, C.; de Salles Hue, N.; Berssaneti, F.; Quintanilha, J. An Overview of Shared Mobility. Sustainability 2018, 10, 4342. [Google Scholar] [CrossRef] [Green Version]
  4. Salomon, I. Telecommunications and travel: Substitution or modified mobility? J. Transp. Econ. Pol. 1985, 19, 219–235. [Google Scholar]
  5. Malokin, A.; Circella, G.; Mokhtarian, P.L. How do activities conducted while commuting influence mode choice? Using revealed preference models to inform public transportation advantage and autonomous vehicle scenarios. Transp. Res. A 2019, 124, 82–114. [Google Scholar] [CrossRef]
  6. Mokhtarian, P.L. A typology of relationships between telecommunications and transportation. Transp. Res. A 1990, 24, 231–242. [Google Scholar] [CrossRef] [Green Version]
  7. Zijlstra, W. The Impact of Personal ICTs on Mobility Behavior: A Study on the Impact of Personal ICTs on the Amount of Travel and Mode Choice Using the First Wave of the Dutch Mobility Panel. Master’s Thesis, University of Twente, Enschede, The Netherlands, 2015. Available online: https://essay.utwente.nl/66751/1/Master%20Thesis%20Final%20Version%20-%20W.G.Zijlstra.pdf (accessed on 9 April 2020).
  8. Quaid, M.; Lagerberg, B. Puget Sound Telecommuting Demonstration. Executive Summary. WSEO--92-138-Rev.ON: DE93007486; Washington State Energy Office: Olympia, WA, USA, 1992. [Google Scholar]
  9. Mokhtarian, P.L. Telecommunications and travel: The case for complementarity. J. Ind. Ecol. 2002, 6, 43–57. [Google Scholar] [CrossRef]
  10. Salomon, I. Telecommunications and travel relationships: A review. Transp. Res. A 1986, 20, 223–238. [Google Scholar] [CrossRef]
  11. Hamer, R.; Kroes, E.; Van Ooststroom, H. Teleworking in the Netherlands: An evaluation of changes in travel behaviour. Transportation 1991, 18, 365–382. [Google Scholar] [CrossRef]
  12. Van Wee, B. Peak car: The first signs of a shift towards ICT-based activities replacing travel? A discussion paper. Transp. Policy 2015, 42, 1–3. [Google Scholar]
  13. Shabanpour, R.; Golshani, N.; Tayarani, M.; Auld, J.; Mohammadian, A.K. Analysis of telecommuting behavior and impacts on travel demand and the environment. Transp. Res. D 2018, 62, 563–576. [Google Scholar] [CrossRef] [Green Version]
  14. Choo, S.; Mokhtarian, P.L. Do telecommunications affect passenger travel or vice versa?: Structural equation models of aggregate US time series data using composite indexes. Transp. Res. Rec. 2005, 1926, 224–232. [Google Scholar] [CrossRef]
  15. Dal Fiore, F.; Mokhtarian, P.L.; Salomon, I.; Singer, M.E. “Nomads at last”? A set of perspectives on how mobile technology may affect travel. J. Transp. Geogr. 2014, 41, 97–106. [Google Scholar] [CrossRef]
  16. Selvanathan, E.A.; Selvanathan, S. The demand for transport and communication in the United Kingdom and Australia. Transp. Res. B 1994, 28, 1–9. [Google Scholar] [CrossRef]
  17. Choo, S.; Lee, T.; Mokhtarian, P.L. Relationships between US consumer expenditures on communications and transportation using Almost Ideal Demand System modeling: 1984–2002. Transport. Plan. Technol. 2007, 30, 431–453. [Google Scholar] [CrossRef] [Green Version]
  18. Choo, S.; Chang, Y.; Mokhtarian, P.L.; Hwang, K. Are the complementary relationships between transportation and communications for industrial uses dominant? A case study for Asian countries. In Proceedings of the Transportation Research Board 91th Annual Meeting, Washington, DC, USA, 22–26 January 2012. [Google Scholar]
  19. Plaut, P.O. Transportation-communications relationships in industry. Transp. Res. A 1997, 31, 419–429. [Google Scholar] [CrossRef]
  20. Lee, T.; Mokhtarian, P.L. Correlations between industrial demands (direct and total) for communications and transportation in the US economy 1947–1997. Transportation 2008, 35, 1–22. [Google Scholar] [CrossRef] [Green Version]
  21. Choi, S.; Choo, S.; Kim, S. Exploring the influences of compact development on zone-based travel patterns: A case study of the Seoul metropolitan area. Transp. Lett. 2019, 1–13. [Google Scholar] [CrossRef]
  22. Horowitz, K.J.; Planting, M.A. Concepts and Methods of the Us Input-Output Accounts; US Bureau of Economic Analysis, U.S. Department of Commerce: Suitland, MD, USA, 2006. [Google Scholar]
  23. United Nations. International Standard Industrial Classification of All Economic Activities (ISIC), Rev. 4, ST/ESA/STAT/SER.M/4/Rev.4; Deparment of Economic and Social Affairs: New York, NY, USA, 2008. [Google Scholar]
  24. Timmer, M.P.; Dietzenbacher, E.; Los, B.; Stehrer, R.; De Vries, G.J. An illustrated user guide to the world input–output database: The case of global automotive production. Rev. Int. Econ. 2015, 23, 575–605. [Google Scholar] [CrossRef]
  25. Saunders, R.J.; Warford, J.J.; Wellenius, B. Telecommunications and Economic Development; Johns Hopkins University Press: Baltimore, MD, USA, 1983. [Google Scholar]
  26. Lee, T.; Mokhtarian, P.L. An Input-Output Analysis of the Relationships between Communications and Travel for Industry; Institute of Transportation Studies of UC Davis: Davis, CA, USA, 2004. [Google Scholar]
  27. Mokhtarian, P. If telecommunication is such a good substitute for travel, why does congestion continue to get worse? Transp. Lett. 2009, 1, 1–17. [Google Scholar] [CrossRef] [Green Version]
  28. Schikofsky, J.; Dannewald, T.; Kowald, M. Exploring motivational mechanisms behind the intention to adopt mobility as a service (MaaS): Insights from Germany. Transp. Res. A 2020, 131, 296–312. [Google Scholar] [CrossRef]
Figure 1. Correlations of direct and total coefficients between transportation and communications industries for Asia from 2000 to 2014. Note: TM = transportation manufacturing industry, TU = transportation utility industry, CM = communications manufacturing, CU = communications utility industry, AT and AC means all transportation and communications industries, respectively.
Sustainability 12 03085 g001aSustainability 12 03085 g001b
Figure 2. Correlations of direct and total coefficients between transportation and communications industries for Western countries from 2000 to 2014. Note: TM = transportation manufacturing industry, TU = transportation utility industry, CM = communications manufacturing, CU = communications utility industry, AT and AC means all transportation and communications industries, respectively.
Sustainability 12 03085 g002aSustainability 12 03085 g002b
Table 1. Structure of the I-O table.
Commodity by IndustryFinal DemandTotal Use
12 j
Intermediate by industry1 X 11 X 12 X 1 j
2 X 21 X 22 X 2 j
i X i 1 X i 2 X i j
Value added
Gross output
Table 2. Industry classification of the I-O table by ISIC Rev.4. Source: International Standard Industrial Classification of All Economics Activities (ISIC), Rev.4. [23].
ISIC Rev.4
Code
DescriptionCategory (This Study)
A01–A03Agriculture, forestry, and fishing
B05–B09Mining and quarrying
C10–C33Manufacturing
C26Manufacture of computer, electronic, and optical productsCommunications
Manufacturing (CM)
C29Manufacture of motor vehicles, trailers, and semi-trailersTransportation
Manufacturing (TM)
C30Manufacture of other transport equipment
D35Electricity, gas, steam, and air conditioning supply
E36–E39Water supply; sewerage, waste management, and remediation activities
F41–F43Construction
G45–G47Wholesale and retail trade, repair of motor vehicles and motorcycles
H49–H53Transportation and storage
H49Land transport and transport via pipelinesTransportation
Utilities (TU)
H50Water transport
H51Air transport
H52Warehousing and support activities for transportation
I55–I56Accommodation and food service activities
J58–J63Information and communication
J61TelecommunicationsCommunications
Utilities (CU)
J62–J63Computer programming, consultancy, and related activities, information service activities
K64–K66Financial and insurance activities
L68Real estate activities
M69–M75Professional, scientific, and technical activities
N77–N82Administrative and support service activities
O84Public administration and defense, compulsory social security
P85Education
Q86–Q88Human health and social work activities
R90–R93Arts, entertainment and recreation
S94–S96Other service activities
T97–T98Activities of households as employers, undifferentiated goods-and services-producing activities of households for own use
U99Activities of extraterritorial organizations and bodies

