A Global Assessment of Sustainable Development Based on Modification of the Human Development Index via the Entropy Method


Abstract
:1. Introduction
2. Sustainable Development
3. The Construction of NSDI
3.1. Criteria for Choosing Indicators
- The indicators of sustainable development index should include economic, resource, environmental, and social dimensions [38].
- The quantity of indicators should not be too many, making the NSDI concise and acceptable [18].
- The selected indicators must be quantifiable and have strong operability [42].
- Availability and reliability of the source of data [10].
3.2. The Framework of NSDI
3.2.1. Economic Dimension of the NSDI
3.2.2. Social Dimension of the NSDI
3.2.3. Resource and Environmental Dimension of the NSDI
3.3. The Selection of the 12 Indicators in NSDI
3.3.1. Searching Relative Indicators for Each Factor
3.3.2. Comparing All Indicators
3.3.3. Choosing the Most Suitable and Representative Indicator
3.4. Entropy Method for Calculating the Weights of Indicators
4. The Measurement of NSDI
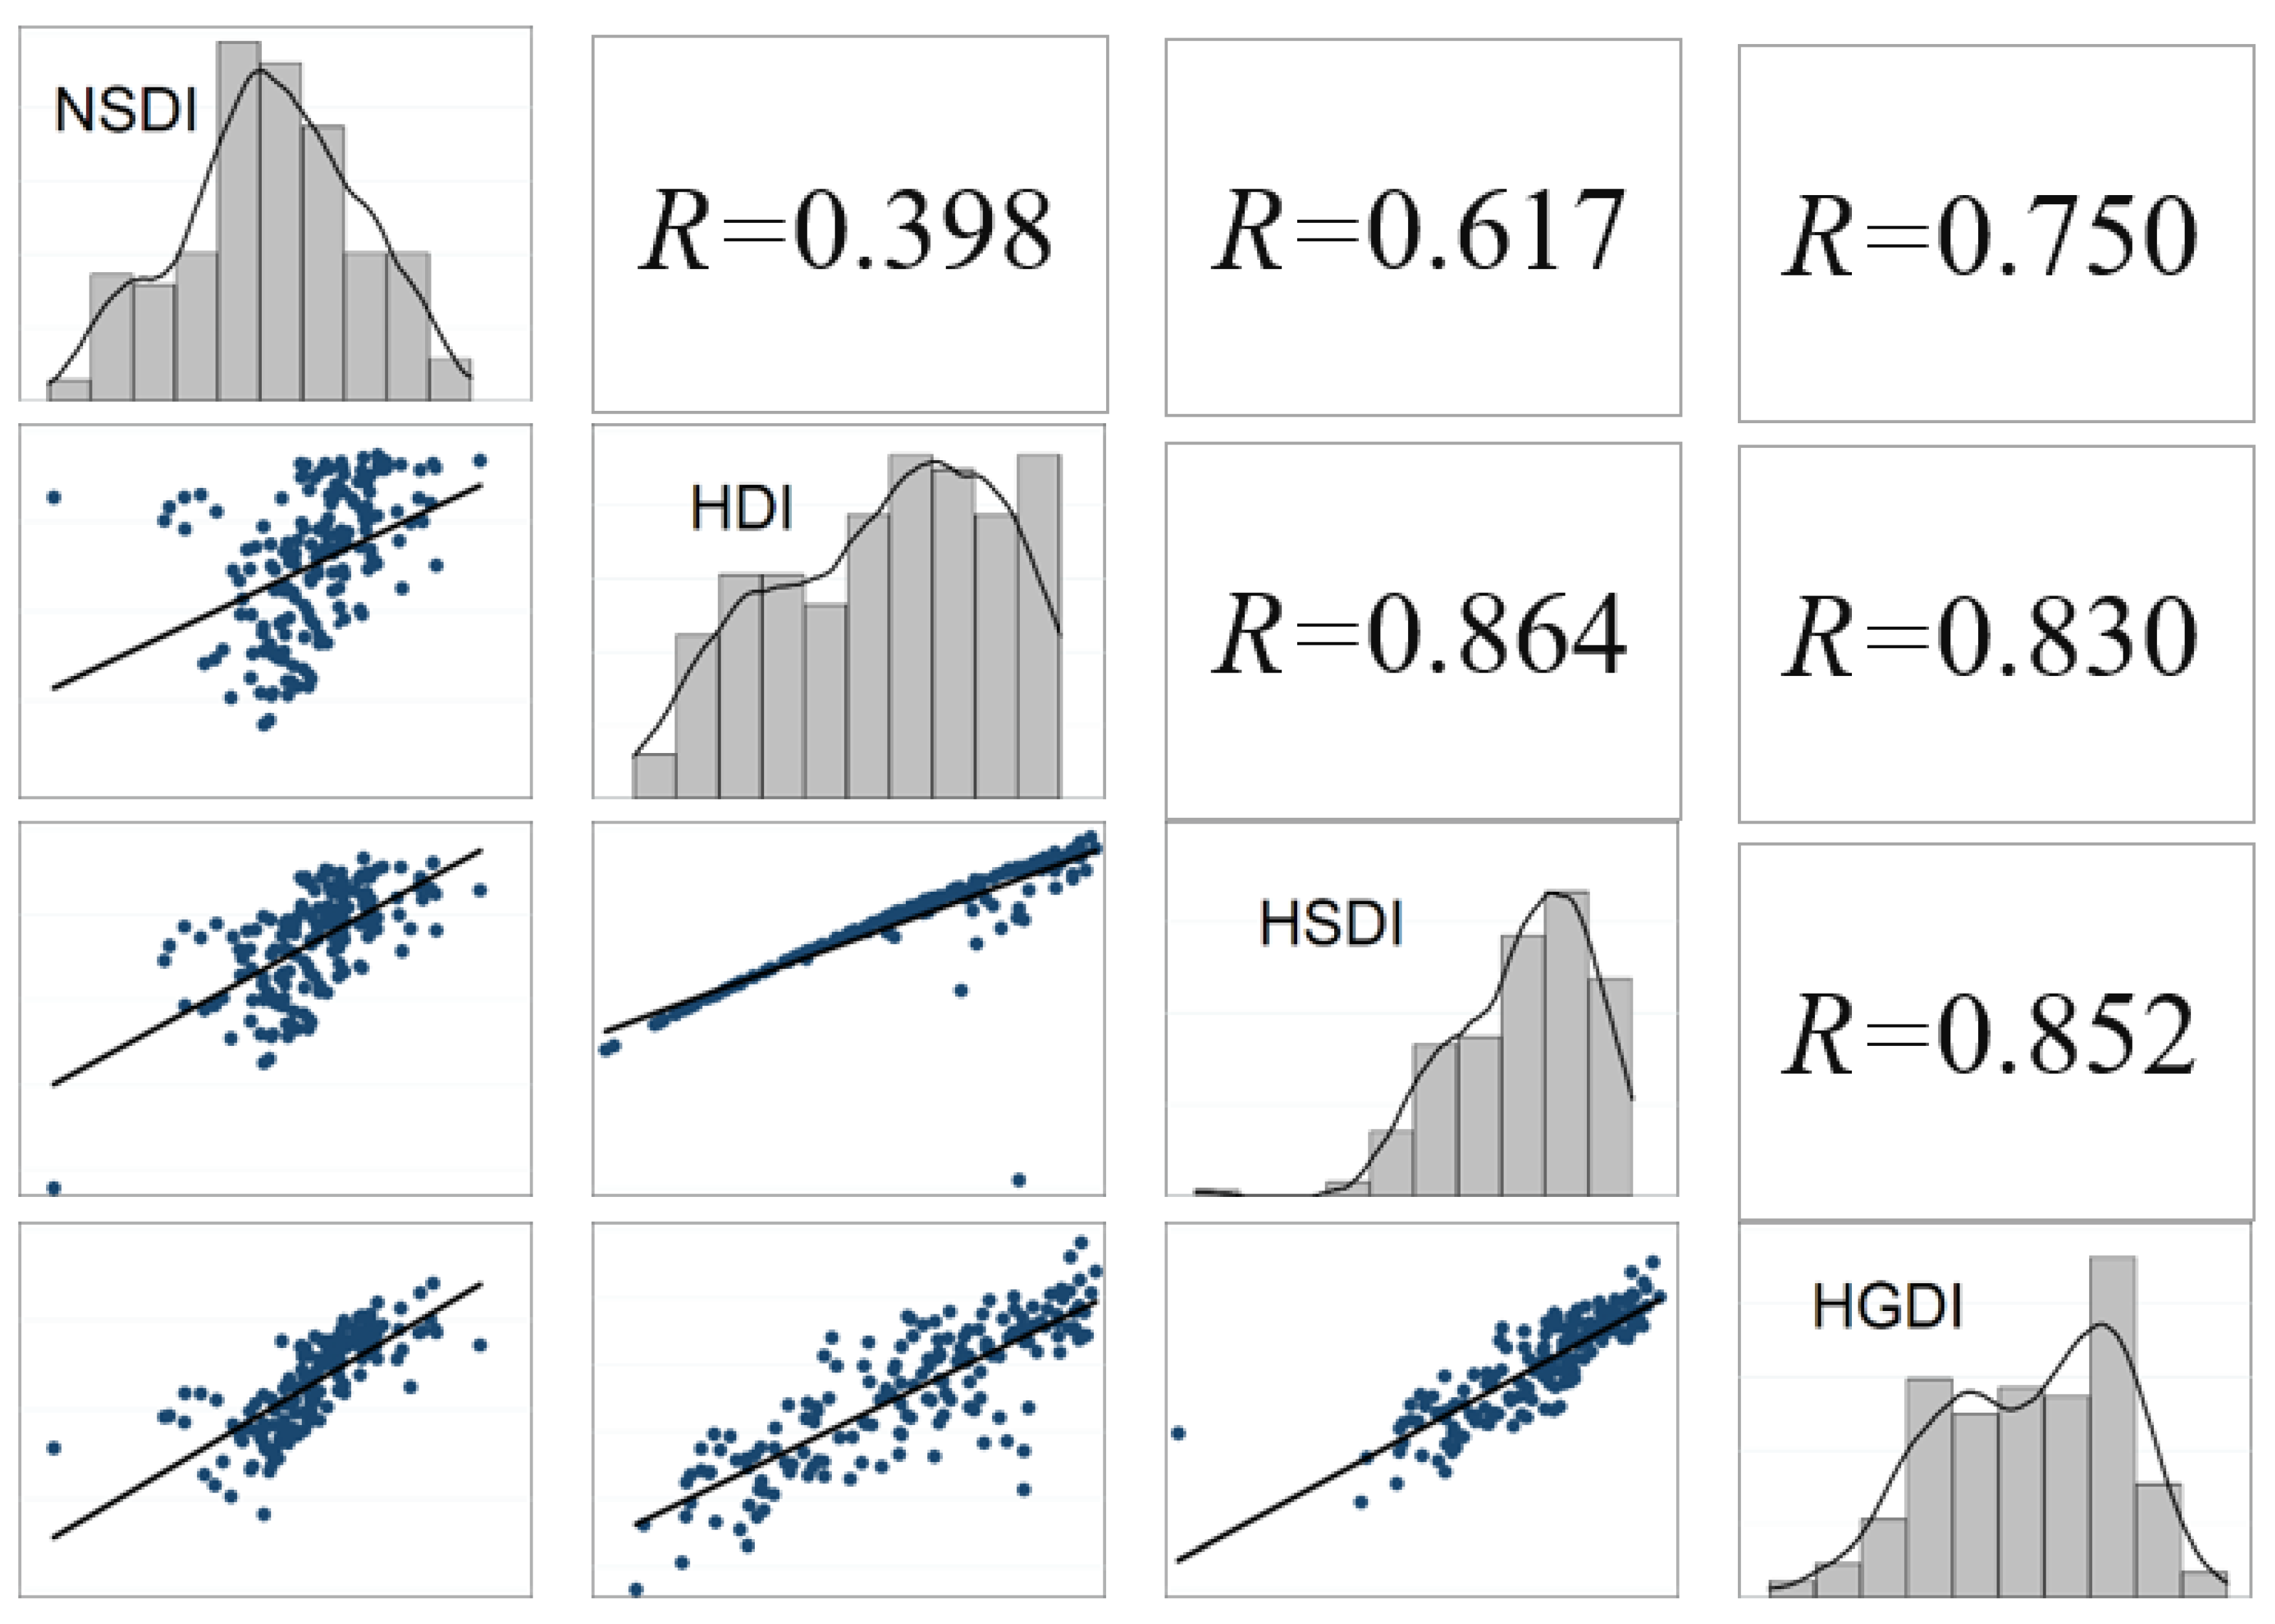
5. Discussion
6. Conclusions
Author Contributions
Funding
Acknowledgments
Conflicts of Interest
References
- Bergman, M.M.; Bergman, Z.; Berger, L. An empirical exploration, typology, and definition of corporate sustainability. Sustainability 2017, 9, 753. [Google Scholar] [CrossRef] [Green Version]
- Cobb, C.W. The Index for Sustainable Economic Welfare; Beacon Press: Boston, MA, USA, 1989. [Google Scholar]
- Cobb, C.W.; Cobb, J.B. The Green National Product: A Proposed Index of Sustainable Economic Welfare; University Press of America: Lanham, MD, USA, 1994. [Google Scholar]
- Wackernagel, M.; Rees, W. Our Ecological Footprint; Birkhouse Publishing: Basel, Switzerland, 1997. [Google Scholar]
- Hamilton, K.; Atkinson, G.; Pearce, D.W. Genuine Savings as an Indicator of Sustainability; CSERGE Working Paper GEC97-03; GSERGE: Norwich, UK, 1997. [Google Scholar]
- Esty, D.C.; Levy, M.A.; Srebotnjak, T.; de Sherbinin, A. 2005 Environmental Sustainability Index: Benchmarking National Environmental Stewardship; Yale Center for Environmental Law & Policy: New Haven, CT, USA, 2005. [Google Scholar]
- Esty, D.C.; Levy, M.A.; Srebotnjak, T.; de Sherbinin, A.; Kim, C.H.; Anderson, B. Pilot2006 Environmental Performance Index; Yale Center for Environmental Law & Policy: New Haven, CT, USA, 2006. [Google Scholar]
- United Nations (UN). Sustainable Development Report 2019; UN: New York, NY, USA, 2015. [Google Scholar]
- United Nations Development Programme (UNDP). Note on Statistics in the Human Development Report; UNDP: New York, NY, USA, 2004. [Google Scholar]
- Adrián, B.; Américo, S. Proposal and Application of a Sustainable Development Index. Ecol. Indic. 2002, 3, 251–256. [Google Scholar]
- Kondyli, J. Measurement and evaluation of sustainable development: A composite indicator for the islands of the North Aegean region, Greece. Environ. Impact Assess. Rev. 2010, 6, 347–356. [Google Scholar] [CrossRef]
- Tso, G.K.F.; Yau, K.K.W.; Yang, C.Y. Sustainable Development Index in Hong Kong: Approach, Method and Findings. Soc. Indic. Res. 2011, 1, 93–108. [Google Scholar] [CrossRef]
- Estoque, R.C.; Murayama, Y. Social–ecological status index: A preliminary study of its structural composition and application. Ecol. Indic. 2014, 43, 183–194. [Google Scholar] [CrossRef]
- Bolcárová, P.; KološTa, S. Assessment of sustainable development in the EU 27 using aggregated SD index. Ecol. Indic. 2015, 48, 699–705. [Google Scholar] [CrossRef]
- Moran, D.D.; Wackernagel, M.; Kitzes, J.; Goldfinger, S.H.; Boutaud, A. Measuring sustainable development—Nation by nation. Ecol. Econ. 2008, 64, 470–474. [Google Scholar] [CrossRef]
- Ture, C. A methodology to analyse the relations of ecological footprint corresponding with human development index: Eco-sustainable human development index. Int. J. Sustain. Dev. World Ecol. 2013, 1, 9–19. [Google Scholar] [CrossRef]
- Bravo, G. The Human Sustainable Development Index: New calculations and a first critical analysis. Ecol. Indic. 2014, 37, 145–150. [Google Scholar] [CrossRef]
- Li, X.X.; Liu, Y.M.; Song, T. Calculation of the Green Development Index. Soc. Sci. China 2014, 6, 69–95. [Google Scholar]
- Ramos, T.B.; Caeiro, S. Meta-performance evaluation of sustainability indicators. Ecol. Indic. 2010, 2, 157–166. [Google Scholar] [CrossRef] [Green Version]
- Tuazon, D.; Corder, G.D.; McLellan, B.C. Sustainable development: A review of theoretical contributions. Int. J. Sustain. Future. Hum. Secur. 2013, 1, 40–48. [Google Scholar] [CrossRef]
- Hodge, T. Towards a conceptual framework for assessing progress towards sustainability. Soc. Indic. Res. 1997, 1–2, 5–98. [Google Scholar] [CrossRef]
- Atkisson, A.; Hatcher, R. The compass index of sustainability: Prototype for a comprehensive sustainability information system. J. Environ. Assess. Policy Manage. 2001, 4, 509–532. [Google Scholar] [CrossRef]
- Ebert, U.; Welsch, H. Meaningful Environmental Indices: A Social Choice Approach. J. Environ. Econ. Manage. 2004, 47, 270–283. [Google Scholar] [CrossRef]
- Liu, H.Y.; Li, Z.F.; Li, Y.F. Evaluation of sustainable capacity of national wetland park ecological analysis based on constraint and support function. Resour. Sci. 2015, 4, 805–814. [Google Scholar]
- Liu, G.; Brown, M.T.; Casazza, M. Enhancing the sustainability narrative through a deeper understanding of sustainable development indicators. Sustainability 2017, 9, 1078. [Google Scholar] [CrossRef] [Green Version]
- Ranis, G.; Stewart, F.; Ramírez, A. Economic Growth and Human Development. World Dev. 2000, 2, 197–219. [Google Scholar] [CrossRef] [Green Version]
- Bilbao-Ubillos, J. The Limits of Human Development Index: The Complementary Role of Economic and Social Cohesion, Development Strategies and Sustainability. Sustain. Dev. 2013, 6, 400–412. [Google Scholar] [CrossRef]
- Zhang, Y.L.; Qin, F.; Wu, Y. Sustainable Growth or Growth with Pollution: An Analysis on the Sales Growth Patterns of Chinese Industrial Companies. China Ind. Econ. 2015, 2, 89–101. [Google Scholar]
- Ma, Y.M.; Wu, Y.M.; Wu, B.J. Comprehensive Evaluation of Sustainable Urban Development of Yangtze River Delta Based on Entropy Method and Quadrant Method. Econ. Geogr. 2015, 6, 47–53. [Google Scholar]
- Ye, W.H.; Luan, S.J. On the measurement and index system of sustainable development. World Environ. 1996, 1, 7–10. [Google Scholar]
- Fang, X.M.; Wei, J.; Guo, L.L. Reflection and Reconstruction of Sustainable Development Theory. Economist 2017, 3, 24–31. [Google Scholar]
- Zhang, X.L. Theory of Sustainable Development: Concept Evolution, Dimension and Prospect. B. Chin. Acad. Sci. 2018, 1, 9–19. [Google Scholar]
- Chen, Y. Sustainable development index system and international comparison. J. World. Econ. 1997, 6, 62–68. [Google Scholar]
- Zeng, Z.X.; Gu, P.L.; Zhang, M. Research on the concept and connotation of sustainable development. Manage. World. 1998, 3, 209–210. [Google Scholar]
- Dasgupta, P. The Population Problem: Theory and Evidence. J. Econ. Lit. 1995, 4, 1879–1902. [Google Scholar]
- Peng, S.J.; Bao, Q. Economic growth and environmental pollution: A Chinese test of the hypothesis of Environmental Kuznets Curve. Res. Finan. Econ. Iss. 2006, 8, 3–17. [Google Scholar]
- Lin, B.Q.; Yang, F. The influence of electric power industry on the sustainable development of China’s economy. J. World. Econ. 2009, 7, 3–13. [Google Scholar]
- Böhringer, C.; Jochem, P.E.P. Measuring the immeasurable-a survey of sustainability indices. Ecol. Econ. 2007, 63, 1–8. [Google Scholar] [CrossRef] [Green Version]
- Pezzey, J. Sustainable Development Concepts-An Economic Analysis; World Bank: Washington, DC, USA, 1992. [Google Scholar]
- Stehling, F. Environmental Quality Indices: Problems, Concepts, Examples; Physica-Verlag: Heidelberg, German, 1988. [Google Scholar]
- Ramachandran, N. Monitoring Sustainability: Indices and Techniques of Analysis; Concept Publishing Company: New Delhi, India, 2000. [Google Scholar]
- Nardo, M.; Saisana, M.; Saltelli, A.; Tarantola, S. Tools for Composite Indicators Building; European Comission: Ispra, Italy, 2005. [Google Scholar]
- Chin, T.; Li, G.; Jiao, H.; Addo, F.; Jawahar, I.M. Career sustainability during manufacturing innovation: A review, a conceptual framework and future research agenda. Career. Dev. Int. 2019, 6, 509–528. [Google Scholar] [CrossRef]
- Atkinson, A.B. On the measurement of inequality. J. Econ. Theory. 1970, 3, 250–263. [Google Scholar] [CrossRef]
- Zhang, W.M.; An, J.W.; Han, C. The application of entropy method in the evaluation of urban sustainable development. J. Quant. Tech. Econ. 2003, 6, 115–118. [Google Scholar]
- Wang, M.; Zhao, X.; Gong, Q.; Ji, Z. Measurement of regional green economy sustainable development ability based on entropy weight-topsis-coupling coordination degree: A case study in Shandong Province, China. Sustainability 2019, 11, 280. [Google Scholar] [CrossRef] [Green Version]
- Chin, T.; Rowley, C.; Redding, G.; Wang, S. Chinese strategic thinking on competitive conflict: Insights from Yin-Yang harmony cognition. Int. J. Conflict. Manage. 2018, 5, 683–704. [Google Scholar] [CrossRef]
- Sen, A. Equality of What? The Tanner Lecture on Human Values; Cambridge University Press; University of Utah Press: Cambridge, UK, 1979. [Google Scholar]
- Sen, A. Development as Freedom; Oxford University Press: Oxford, UK, 1999. [Google Scholar]
- Togtokh, C. Time to stop celebrating the polluters. Nature 2011, 479, 269. [Google Scholar] [CrossRef]


| Authors | Factors or Indicators in Composite Indices | ||
|---|---|---|---|
| Economic Dimension | Resource and Environmental Dimension | Social Dimension | |
| Adrián and Américo (2002) | Gross Domestic Product (GDP), employment | Air quality, land use, protected areas | Education, health, poverty, potable water, sewage infrastructure |
| UNDP (2004) | Income | Education, health | |
| Kondyli (2010) | Economic structure, size of economy | Potable water, sea quality, land quality, biodiversity | Population size, population structure, poverty, unemployment |
| Li et al. (2014) | Income | Primary energy consumption, CO2 emissions, PM10 (particles less than 10 microns in diameter), forest, threatened animals, land conservation | Education, health, potable water, sanitation facilities, poverty |
| Bravo (2014) | Income | CO2 emissions | Education, health |
| Bolcárová and Kološta (2015) | Economic growth | Resource productivity, greenhouse gas emissions, renewable energy consumption, natural resources | Social inclusion, health |
| UN (2015) | Economic growth and employment, infrastructure, city and communities | Energy consumption, PM2.5 (particles less than 2.5 microns in diameter), CO2 emissions, marine protection, land protection | Poverty, trophic level, health, education, gender equality, water and sanitation, inequality, peace and justice |
| Guo et al. (2016) | Income, economic growth, economic structure, Foreign Direct Investment (FDI), public revenue | Arable land, water quality, primary energy consumption, land conservation, air quality | Living standard, education, social security, safety |
| Index | Dimension | Factor | Indicator | Premise |
|---|---|---|---|---|
| National Sustainable Development Index (NSDI) | Economic dimension | Economic growth | Real GDP growth | + |
| Income level | Income index | + | ||
| Economic structure | Employment in services (% of total employment) | + | ||
| Resource and environmental dimension | Climate | CO2 emissions per capita | - | |
| Air quality | PM2.5 | - | ||
| Forest | Forest area (% of total land area) | + | ||
| Arable land | Arable land per person | + | ||
| Energy | Renewable energy consumption (% of total final energy consumption) | + | ||
| Social dimension | Education | Mean years of schooling | + | |
| Health | Life expectancy index | + | ||
| Drinking-water | Population using improved drinking-water sources (%) | + | ||
| Sanitation | Population using improved sanitation facilities (%) | + |
| Indicators | Meaning and Data Source |
|---|---|
| GDP Growth | Real GDP growth. Data source: World Bank database (https://data.worldbank.org/indicator) |
| Income index | According to Atkinson [44], calculating the income index can reflect fairness and equality in the case of unequal distribution factors, based on the disposable income or consumption of per capita family. The higher the income index is, the better the economic situation of the country is, and the more equal and fairer the income distribution of the country is. Data source: The UNDP database (http://hdr.undp.org/en/data#) |
| Employment in services (% of total employment) | The proportion of employment of the tertiary industry in total employments, which is used to measure the economic structure. Data source: The UNDP database (http://hdr.undp.org/en/data#) |
| Per capita CO2 emissions | CO2 emissions generated by the combustion of energy such as coal, oil, natural gas, and so on (unit: ton per person). Data source: International Energy Agency (http://www.iea.org/) |
| PM2.5 | The concentration in the atmosphere of fine suspended particles with a diameter less than 2.5 microns, which can penetrate into the respiratory tract and cause serious health damage (unit: microgram/m3). Data source: World Bank database (https://data.worldbank.org/indicator) |
| Forest coverage rate | The forest coverage rate is the proportion of forest area in the total land area, while the forest area refers to the land covered by upright trees (at least 5 m) which grow naturally or are planted artificially. Data source: The UNDP database (http://hdr.undp.org/en/data#) |
| Arable land per person | Arable land includes temporary crop land (double-cropping rice field is calculated once), temporary grassland for mowing or pasture, market or kitchen garden land, and temporary fallow land, but excludes land abandoned due to rotation. Data source: World Bank database (https://data.worldbank.org/indicator) |
| Renewable energy consumption | The proportion of renewable energy consumption in total energy consumption. The higher the proportion is, the more conducive to the sustainable development in resources and environmental dimension. Data source: The UNDP database (http://hdr.undp.org/en/data#) |
| Mean years of schooling | Mean years of education for adults over 25 years old (unit: years). Data source: The UNDP database (http://hdr.undp.org/en/data#) |
| Life expectancy index | According to Atkinson [44], calculating the life expectancy index can reflect fairness and equality in the case of unequal distribution factors, based on the data of UN life table. The higher the index value, the better the health status of residents, and the more equal and fairer the access to healthcare for residents. Data source: The UNDP database (http://hdr.undp.org/en/data#) |
| Population using improved drinking water sources (%) | An improved drinking water source is a drinking water source that is free from external pollution, especially from excreta pollution, due to its own structure or through active intervention. Data source: The World Health Organization (http://www.wssinfo.org/data-estimates/table/) |
| Population using improved sanitation facilities (%) | The proportion of the population with basic excreta treatment facilities, which can effectively prevent human, livestock, mosquitoes, and flies from contacting with excreta. Improved sanitation facilities include simple but protected latrines, and direct flush latrines connected to sewer lines, of which normal function can be guaranteed. Data source: The World Health Organization (http://www.wssinfo.org/data-estimates/table/) |
| Index | Dimension | Factor | Indicator | Weights |
|---|---|---|---|---|
| National Sustainable Development Index (NSDI) | Economic dimension | Economic growth | Real GDP growth | 6.09% |
| Income level | Income index | 9.20% | ||
| Economic structure | Employment in services (% of total employment) | 9.31% | ||
| Resource and environmental dimension | Climate | CO2 emissions per capita | 12.30% | |
| Air quality | PM2.5 | 7.55% | ||
| Forest | Forest area (% of total land area) | 8.74% | ||
| Arable land | Arable land per person | 14.49% | ||
| Energy | Renewable energy consumption (% of total final energy consumption) | 8.38% | ||
| Social dimension | Education | Mean years of schooling | 7.14% | |
| Health | Life expectancy index | 7.39% | ||
| Drinking water | Population using improved drinking water sources (%) | 4.95% | ||
| Sanitation facilities | Population using improved sanitation facilities (%) | 4.45% |
| Country | NSDI | Rank | C | DC | EC | Country | NSDI | Rank | C | DC | EC |
|---|---|---|---|---|---|---|---|---|---|---|---|
| Australia | 0.747 | 1 | OC | Y | N | Armenia | 0.543 | 83 | AS | N | N |
| Norway | 0.746 | 2 | EU | Y | N | Kyrgyzstan | 0.543 | 84 | AS | N | N |
| Switzerland | 0.736 | 3 | EU | N | N | Sao Tome and Principe | 0.542 | 85 | AF | N | N |
| Denmark | 0.729 | 4 | EU | Y | N | El Salvador | 0.542 | 86 | NA | N | N |
| Canada | 0.693 | 5 | NA | Y | N | Gambia | 0.541 | 87 | AF | N | N |
| Sweden | 0.690 | 6 | EU | Y | N | Vanuatu | 0.539 | 88 | OC | N | N |
| Latvia | 0.687 | 7 | EU | N | N | Papua New Guinea | 0.535 | 89 | AF | N | N |
| Japan | 0.683 | 8 | AS | Y | N | Congo | 0.535 | 90 | AF | N | N |
| United States | 0.681 | 9 | NA | Y | N | Malawi | 0.534 | 91 | AF | N | N |
| Germany | 0.679 | 10 | EU | Y | N | Barbados | 0.532 | 92 | NA | N | N |
| Serbia | 0.679 | 11 | EU | N | N | Azerbaijan | 0.527 | 93 | AS | N | N |
| Italy | 0.677 | 12 | EU | N | N | Tunisia | 0.524 | 94 | AF | N | N |
| Finland | 0.675 | 13 | EU | Y | N | Timor-Leste | 0.524 | 95 | AS | N | N |
| New Zealand | 0.674 | 14 | OC | Y | N | Botswana | 0.523 | 96 | AF | N | N |
| Lithuania | 0.673 | 15 | EU | N | N | Samoa | 0.522 | 97 | OC | N | N |
| France | 0.671 | 16 | EU | Y | N | Namibia | 0.522 | 98 | AF | N | N |
| United Kingdom | 0.665 | 17 | EU | Y | N | Dominican Republic | 0.520 | 99 | NA | N | N |
| Kazakhstan | 0.663 | 18 | AS | N | N | Iran | 0.519 | 100 | AS | N | N |
| Luxembourg | 0.661 | 19 | EU | Y | N | Maldives | 0.517 | 101 | AS | N | N |
| Ireland | 0.660 | 20 | EU | Y | N | Ghana | 0.516 | 102 | AF | N | N |
| Belgium | 0.655 | 21 | EU | Y | N | Suriname | 0.515 | 103 | SA | N | N |
| Portugal | 0.655 | 22 | EU | Y | N | Lebanon | 0.514 | 104 | AS | N | N |
| Iceland | 0.651 | 23 | EU | N | N | Morocco | 0.513 | 105 | AF | N | Y |
| Netherlands | 0.649 | 24 | EU | Y | N | Cameroon | 0.512 | 106 | AF | N | N |
| Korea (Rep.) | 0.647 | 25 | AS | Y | Y | Tajikistan | 0.511 | 107 | AS | N | N |
| Argentina | 0.647 | 26 | SA | N | N | Jordan | 0.510 | 108 | AS | N | N |
| Malta | 0.641 | 27 | EU | N | N | Rwanda | 0.510 | 109 | AF | N | N |
| Spain | 0.641 | 28 | EU | Y | N | Haiti | 0.509 | 110 | NA | N | N |
| Israel | 0.633 | 29 | AS | N | N | Senegal | 0.509 | 111 | AF | N | N |
| Singapore | 0.631 | 30 | AS | Y | N | Kenya | 0.509 | 112 | AF | N | N |
| Brazil | 0.629 | 31 | SA | N | Y | Peru | 0.507 | 113 | SA | N | Y |
| Belize | 0.621 | 32 | NA | N | N | Angola | 0.505 | 114 | AF | N | N |
| Montenegro | 0.615 | 33 | EU | N | N | Togo | 0.503 | 115 | AF | N | N |
| Fiji | 0.615 | 34 | OC | N | N | Eswatini | 0.501 | 116 | AF | N | N |
| Austria | 0.614 | 35 | EU | Y | N | Benin | 0.500 | 117 | AF | N | N |
| Estonia | 0.614 | 36 | EU | N | N | Cabo Verde | 0.499 | 118 | AF | N | N |
| Greece | 0.613 | 37 | EU | N | N | South Africa | 0.499 | 119 | AF | N | Y |
| Belarus | 0.612 | 38 | EU | N | N | Comoros | 0.498 | 120 | AF | N | N |
| Gabon | 0.612 | 39 | AF | N | N | Mali | 0.497 | 121 | AF | N | N |
| Hungary | 0.610 | 40 | EU | N | Y | Burkina Faso | 0.495 | 122 | AF | N | N |
| Brunei Darussalam | 0.608 | 41 | AS | N | N | Turkmenistan | 0.495 | 123 | AS | N | N |
| Romania | 0.608 | 42 | EU | N | N | Nigeria | 0.493 | 124 | AF | N | N |
| Bulgaria | 0.607 | 43 | EU | N | N | Oman | 0.489 | 125 | AS | N | N |
| Lao PDR | 0.604 | 44 | AS | N | N | Madagascar | 0.488 | 126 | AF | N | N |
| Croatia | 0.604 | 45 | EU | N | N | Lesotho | 0.485 | 127 | AF | N | N |
| Ukraine | 0.602 | 46 | EU | N | N | Nepal | 0.485 | 128 | AS | N | N |
| Bhutan | 0.602 | 47 | AS | N | N | Pakistan | 0.485 | 129 | AS | N | N |
| Slovenia | 0.600 | 48 | EU | N | N | Moldova | 0.481 | 130 | EU | N | N |
| Algeria | 0.594 | 49 | AF | N | N | China | 0.476 | 131 | AS | N | Y |
| Russian | 0.593 | 50 | EU | N | Y | Uganda | 0.473 | 132 | AF | N | N |
| Slovakia | 0.592 | 51 | EU | N | N | Bangladesh | 0.471 | 133 | AS | N | N |
| Albania | 0.587 | 52 | EU | N | N | Libya | 0.469 | 134 | AF | N | N |
| Bosnia and Herzegovina | 0.585 | 53 | EU | N | N | Equatorial Guinea | 0.458 | 135 | AF | N | N |
| Turkey | 0.585 | 54 | AS | N | Y | Iraq | 0.456 | 136 | AS | N | N |
| Bolivia | 0.583 | 55 | EU | N | N | Solomon Islands | 0.453 | 137 | OC | N | N |
| Colombia | 0.581 | 56 | SA | N | Y | Guyana | 0.453 | 138 | SA | N | N |
| Uruguay | 0.578 | 57 | SA | N | N | Egypt | 0.449 | 139 | AF | N | Y |
| Honduras | 0.577 | 58 | NA | N | N | Mauritania | 0.436 | 140 | AF | N | N |
| Cambodia | 0.576 | 59 | AS | N | N | Qatar | 0.432 | 141 | AS | N | N |
| Georgia | 0.573 | 60 | AS | N | N | Guinea-Bissau | 0.430 | 142 | AF | N | N |
| Czechia | 0.573 | 61 | EU | N | Y | Afghanistan | 0.427 | 143 | AS | N | N |
| Poland | 0.571 | 62 | EU | N | Y | Guinea | 0.419 | 144 | AF | N | N |
| Guatemala | 0.569 | 63 | NA | N | N | Sierra Leone | 0.415 | 145 | AF | N | N |
| Indonesia | 0.569 | 64 | AS | N | Y | Yemen | 0.414 | 146 | AS | N | N |
| Panama | 0.569 | 65 | NA | N | N | Congo (Dem. Rep.) | 0.413 | 147 | AF | N | N |
| Chile | 0.567 | 66 | SA | N | Y | Zimbabwe | 0.412 | 148 | AF | N | N |
| Mongolia | 0.566 | 67 | AS | N | N | United Arab Emirates | 0.410 | 149 | AS | N | N |
| Cyprus | 0.565 | 68 | EU | N | N | Chad | 0.406 | 150 | AF | N | N |
| Paraguay | 0.564 | 69 | SA | N | N | Ethiopia | 0.401 | 151 | AF | N | N |
| Bahamas | 0.564 | 70 | NA | N | N | Liberia | 0.397 | 152 | AF | N | N |
| Ecuador | 0.563 | 71 | SA | N | N | Central African Republic | 0.392 | 153 | AF | N | N |
| Mexico | 0.563 | 72 | SA | N | Y | Burundi | 0.392 | 154 | AF | N | N |
| Malaysia | 0.561 | 73 | AS | N | Y | Trinidad and Tobago | 0.391 | 155 | NA | N | N |
| India | 0.560 | 74 | AS | N | Y | Saudi Arabia | 0.390 | 156 | AS | N | N |
| Thailand | 0.560 | 75 | AS | N | Y | Zambia | 0.383 | 157 | AF | N | N |
| Jamaica | 0.556 | 76 | NA | N | N | Nicaragua | 0.376 | 158 | NA | N | N |
| Tanzania | 0.553 | 77 | AF | N | N | Bahrain | 0.342 | 159 | AS | N | N |
| Mauritius | 0.552 | 78 | AF | N | N | Kuwait | 0.326 | 160 | AS | N | N |
| Viet Nam | 0.551 | 79 | AS | N | N | Mozambique | 0.305 | 161 | AF | N | N |
| Philippines | 0.550 | 80 | AS | N | Y | Niger | 0.260 | 162 | AF | N | N |
| Tonga | 0.549 | 81 | OC | N | N | Cote d’Ivoire | 0.232 | 163 | AS | N | N |
| Myanmar | 0.548 | 82 | AS | N | N |
| Index | Indicators | Weight | |||
|---|---|---|---|---|---|
| Economic | Environmental | Social | Resource | ||
| HDI | Income | Education Life expectancy | equal | ||
| HSDI | Income | CO2 emissions | Education Life expectancy | equal | |
| HGDI | Income | CO2 emissions PM10 Forest area (%) Proportion of threatened animals (%) Land conservation area (%) | Education Life expectancy Population using improved drinking-water sources (%) Population using improved sanitation facilities (%) Population below the minimum food energy (%) | Utilization ratio of primary energy (%) | equal |
| NSDI | Income Economic growth Economic structure | CO2 emissions PM2.5 Forest area (%) | Education Life expectancy population using improved drinking-water sources (%) population using improved sanitation facilities (%) | Renewable energy consumption (%) Arable land | Entropy Method |
| Country | NSDI | HDI | HSDI | HGDI | Country | NSDI | HDI | HSDI | HGDI |
|---|---|---|---|---|---|---|---|---|---|
| Australia | 1 | 3 | 40 | 27 | Armenia | 83 | 71 | 56 | 79 |
| Norway | 2 | 1 | 3 | 5 | Kyrgyzstan | 84 | 103 | 95 | 90 |
| Switzerland | 3 | 2 | 7 | 1 | Sao Tome and Principe | 85 | 123 | 120 | 106 |
| Denmark | 4 | 9 | 12 | 3 | El Salvador | 86 | 101 | 94 | 84 |
| Canada | 5 | 11 | 17 | 34 | Gambia | 87 | 150 | 149 | 123 |
| Sweden | 6 | 5 | 1 | 2 | Vanuatu | 88 | 116 | 114 | 88 |
| Latvia | 7 | 39 | 9 | 25 | Papua New Guinea | 89 | 132 | 130 | 133 |
| Japan | 8 | 17 | 10 | 20 | Congo | 90 | 113 | 111 | 117 |
| United States | 9 | 12 | 31 | 37 | Malawi | 91 | 149 | 148 | 115 |
| Germany | 10 | 4 | 18 | 8 | Barbados | 92 | 55 | 42 | 76 |
| Serbia | 11 | 62 | 70 | 52 | Azerbaijan | 93 | 66 | 58 | 91 |
| Italy | 12 | 26 | 26 | 19 | Tunisia | 94 | 83 | 74 | 89 |
| Finland | 13 | 14 | 2 | 15 | Timor-Leste | 95 | 111 | 108 | 116 |
| New Zealand | 14 | 15 | 6 | 10 | Botswana | 96 | 88 | 84 | 104 |
| Lithuania | 15 | 35 | 22 | 24 | Samoa | 97 | 89 | 79 | 23 |
| France | 16 | 21 | 20 | 9 | Namibia | 98 | 110 | 106 | 134 |
| United Kingdom | 17 | 13 | 35 | 7 | Dominican Republic | 99 | 82 | 67 | 68 |
| Kazakhstan | 18 | 54 | 87 | 76 | Iran | 100 | 57 | 57 | 99 |
| Luxembourg | 19 | 20 | 42 | 45 | Maldives | 101 | 86 | 83 | 83 |
| Ireland | 20 | 6 | 39 | 6 | Ghana | 102 | 120 | 117 | 131 |
| Belgium | 21 | 16 | 32 | 12 | Suriname | 103 | 84 | 77 | 28 |
| Portugal | 22 | 38 | 15 | 28 | Lebanon | 104 | 69 | 65 | 85 |
| Iceland | 23 | 8 | 4 | 4 | Morocco | 105 | 104 | 98 | 110 |
| Netherlands | 24 | 10 | 48 | 13 | Cameroon | 106 | 130 | 128 | 140 |
| Korea (Rep.) | 25 | 22 | 27 | 29 | Tajikistan | 107 | 109 | 103 | 107 |
| Argentina | 26 | 44 | 66 | 36 | Jordan | 108 | 80 | 68 | 92 |
| Malta | 27 | 27 | 59 | 21 | Rwanda | 109 | 139 | 136 | 120 |
| Spain | 28 | 24 | 14 | 16 | Haiti | 110 | 144 | 143 | 138 |
| Israel | 29 | 19 | 61 | 18 | Senegal | 111 | 146 | 145 | 129 |
| Singapore | 30 | 7 | 46 | 14 | Kenya | 112 | 124 | 121 | 137 |
| Brazil | 31 | 67 | 16 | 55 | Peru | 113 | 72 | 60 | 62 |
| Belize | 32 | 87 | 41 | 78 | Angola | 114 | 125 | 125 | 144 |
| Montenegro | 33 | 47 | 11 | 39 | Togo | 115 | 143 | 141 | 154 |
| Fiji | 34 | 78 | 25 | 62 | Eswatini | 116 | 121 | 119 | 100 |
| Austria | 35 | 18 | 5 | 11 | Benin | 117 | 140 | 138 | 150 |
| Estonia | 36 | 28 | 13 | 49 | Cabo Verde | 118 | 107 | 101 | 109 |
| Greece | 37 | 29 | 29 | 23 | South Africa | 119 | 96 | 102 | 112 |
| Belarus | 38 | 50 | 56 | 47 | Comoros | 120 | 142 | 140 | 127 |
| Gabon | 39 | 92 | 55 | 88 | Mali | 121 | 157 | 157 | 153 |
| Hungary | 40 | 41 | 45 | 32 | Burkina Faso | 122 | 160 | 159 | 156 |
| Brunei Darussalam | 41 | 36 | 34 | 87 | Turkmenistan | 123 | 91 | 107 | 102 |
| Romania | 42 | 51 | 53 | 40 | Nigeria | 124 | 135 | 133 | 152 |
| Bulgaria | 43 | 48 | 58 | 41 | Oman | 125 | 45 | 69 | 103 |
| Lao PDR | 44 | 117 | 65 | 115 | Madagascar | 126 | 136 | 134 | 151 |
| Croatia | 45 | 43 | 24 | 35 | Lesotho | 127 | 138 | 137 | 147 |
| Ukraine | 46 | 73 | 78 | 72 | Nepal | 128 | 128 | 126 | 125 |
| Bhutan | 47 | 115 | 44 | 113 | Pakistan | 129 | 129 | 127 | 135 |
| Slovenia | 48 | 23 | 8 | 17 | Moldova | 130 | 95 | 86 | 94 |
| Algeria | 49 | 70 | 101 | 63 | China | 131 | 75 | 80 | 108 |
| Russian | 50 | 46 | 64 | 59 | Uganda | 132 | 141 | 139 | 157 |
| Slovakia | 51 | 37 | 33 | 30 | Bangladesh | 133 | 119 | 116 | 132 |
| Albania | 52 | 63 | 43 | 46 | Libya | 134 | 93 | 99 | 114 |
| Bosnia and Herzegovina | 53 | 68 | 47 | 66 | Equatorial Guinea | 135 | 118 | 122 | 145 |
| Turkey | 54 | 58 | 81 | 51 | Iraq | 136 | 102 | 100 | 136 |
| Bolivia | 55 | 100 | 86 | 93 | Solomon Islands | 137 | 131 | 129 | 95 |
| Colombia | 56 | 76 | 49 | 61 | Guyana | 138 | 106 | 105 | 52 |
| Uruguay | 57 | 53 | 19 | 38 | Egypt | 139 | 97 | 89 | 126 |
| Honduras | 58 | 114 | 73 | 112 | Mauritania | 140 | 137 | 135 | 155 |
| Cambodia | 59 | 126 | 93 | 123 | Qatar | 141 | 33 | 163 | 149 |
| Georgia | 60 | 64 | 57 | 50 | Guinea-Bissau | 142 | 152 | 151 | 113 |
| Czechia | 61 | 25 | 30 | 26 | Afghanistan | 143 | 145 | 142 | 161 |
| Poland | 62 | 32 | 51 | 33 | Guinea | 144 | 154 | 153 | 142 |
| Guatemala | 63 | 108 | 72 | 104 | Sierra Leone | 145 | 159 | 158 | 148 |
| Indonesia | 64 | 98 | 71 | 90 | Yemen | 146 | 147 | 146 | 160 |
| Panama | 65 | 61 | 37 | 44 | Congo (Dem. Rep.) | 147 | 153 | 152 | 141 |
| Chile | 66 | 40 | 38 | 31 | Zimbabwe | 148 | 133 | 132 | 111 |
| Mongolia | 67 | 79 | 128 | 82 | United Arab Emirates | 149 | 31 | 91 | 98 |
| Cyprus | 68 | 30 | 50 | 22 | Chad | 150 | 161 | 160 | 162 |
| Paraguay | 69 | 90 | 21 | 81 | Ethiopia | 151 | 151 | 150 | 158 |
| Bahamas | 70 | 49 | 54 | 43 | Liberia | 152 | 155 | 154 | 122 |
| Ecuador | 71 | 74 | 60 | 64 | Central African Republic | 153 | 162 | 161 | 159 |
| Mexico | 72 | 65 | 69 | 54 | Burundi | 154 | 158 | 156 | 143 |
| Malaysia | 73 | 56 | 36 | 53 | Trinidad and Tobago | 155 | 59 | 144 | 97 |
| India | 74 | 112 | 146 | 109 | Saudi Arabia | 156 | 34 | 75 | 124 |
| Thailand | 75 | 77 | 67 | 70 | Zambia | 157 | 122 | 118 | 96 |
| Jamaica | 76 | 81 | 74 | 71 | Nicaragua | 158 | 105 | 97 | 80 |
| Tanzania | 77 | 134 | 121 | 131 | Bahrain | 159 | 42 | 96 | 118 |
| Mauritius | 78 | 60 | 63 | 48 | Kuwait | 160 | 52 | 110 | 119 |
| Viet Nam | 79 | 99 | 75 | 92 | Mozambique | 161 | 156 | 155 | 139 |
| Philippines | 80 | 94 | 82 | 85 | Niger | 162 | 163 | 162 | 163 |
| Tonga | 81 | 85 | 77 | 73 | Cote d’Ivoire | 163 | 148 | 147 | 130 |
| Myanmar | 82 | 127 | 105 | 124 |
© 2020 by the authors. Licensee MDPI, Basel, Switzerland. This article is an open access article distributed under the terms and conditions of the Creative Commons Attribution (CC BY) license (http://creativecommons.org/licenses/by/4.0/).
Share and Cite
Jin, H.; Qian, X.; Chin, T.; Zhang, H. A Global Assessment of Sustainable Development Based on Modification of the Human Development Index via the Entropy Method. Sustainability 2020, 12, 3251. https://doi.org/10.3390/su12083251
Jin H, Qian X, Chin T, Zhang H. A Global Assessment of Sustainable Development Based on Modification of the Human Development Index via the Entropy Method. Sustainability. 2020; 12(8):3251. https://doi.org/10.3390/su12083251
Chicago/Turabian StyleJin, Hui, Xinyi Qian, Tachia Chin, and Hejie Zhang. 2020. "A Global Assessment of Sustainable Development Based on Modification of the Human Development Index via the Entropy Method" Sustainability 12, no. 8: 3251. https://doi.org/10.3390/su12083251
APA StyleJin, H., Qian, X., Chin, T., & Zhang, H. (2020). A Global Assessment of Sustainable Development Based on Modification of the Human Development Index via the Entropy Method. Sustainability, 12(8), 3251. https://doi.org/10.3390/su12083251