Article

Accounting for the Life Cycle Cost of Power Grid Projects by Employing a System Dynamics Technique: A Power Reform Perspective

1
State Key Laboratory for Alternate Electrical Power System with Renewable Energy Sources, Beijing 102206, China
2
School of Economics and Management, North China Electric Power University, Beijing 102206, China
*
Author to whom correspondence should be addressed.
Sustainability 2020, 12(8), 3297; https://doi.org/10.3390/su12083297
Submission received: 15 February 2020 / Revised: 13 March 2020 / Accepted: 24 March 2020 / Published: 17 April 2020

Abstract

:
In the context of China’s electric power reform, issued in May 2019, the “Transmission and Distribution Pricing Supervision Measures” have changed asset accounting in grid enterprises and therefore affected cost accounting in grid projects. This paper proposes a dynamic cost calculation model based on system dynamics and takes a power grid company as an example. On this basis, a sensitivity analysis of power grid engineering was conducted to determine the impacts of key factors of power reform on life cycle cost (LCC). Finally, suggestions for cost accounting and cost management were proposed.

1. Introduction

From the perspective of current practical construction in power grid engineering, the study of life cycle cost (LCC) [1] is the bond in connecting electricity reform and grid engineering cost management and is the key tool for the accomplishment of a low cost and high efficiency of a grid project’s life cycle [2]. The study of LCC laid the theoretical foundation for the stable and sustainable development of grid companies [3]. Life cycle cost (LCC) refers to the total cost consumed during the entire life cycle of an engineering project from the decision-making design stage to its final retirement, including initial investment costs, operation and maintenance costs, and decommissioning and disposal costs [4]. Since 2015, the power grid in China has been in the process of reform and the Chinese government has issued a series of policy documents, the core of which is to lay the foundation for the healthy growth of the power market by “establishing the pricing model for domestic transmission and distribution electricity prices and implementing the cost supervision of transmission and distribution electricity prices”. Among them, electricity price reform is a particularly important part in this round of reform [5], and external disclosure of transmission and distribution costs is indispensable in the permitted electricity price reform. However, there are still some problems in China’s power grid projects under the background of power reform, such as the mismatch between the actual cost of operation and maintenance and the permitted cost, as well as the mismatch between the project construction period and the reasonable construction period [6]. Subsequently, the National Development and Reform Commission (NDRC) and the Energy Bureau implemented “The Power Transmission and Distribution Pricing Cost Supervision and Examination Method” [7]. It once again emphasized the concept and essence of the permitted cost, and put forward new provisions for the division of the cost range, refining the depreciation of the fixed assets of power transmission and distribution, which have a great influence on depreciation expenses and operation maintenance expenses.
Traditionally, grid companies have adopted the full-cost method for cost accounting. That is, all costs and expenses (excluding financial expenses) related to power production operations incurred by enterprises during the accounting period are incorporated into the current production costs [8]. The current policy promulgated in May 2019 strictly divided the cost structure of transmission and distribution pricing [9], excluded the expenses unrelated to the transmission and distribution business of power grid enterprises, and detailed the verification standards for transmission and distribution pricing costs [10]. In this context, it is increasingly important to study the life cycle cost accounting of power grid projects and its influencing factors.
Many researchers in the world have conducted in-depth research on transmission and distribution price policies. In order to cope with a series of challenges [11] arising from the reform of the power system, the grid engineering abandoned the traditional costing method and proposed a case-based reasoning method derived from fuzzy mathematics, analytic hierarchy processes (AHP), and rough sets to calculate the cost of power grid engineering. [8]. For the US electricity market, scholars took the Texas Transit and Distribution Company as the research object in analyzing the mechanism of transmission and distribution prices and the verification cost of transmission and distribution prices since the US electricity reform, and dialectically evaluated the regulation effect of the “permitted income law” [12]. For the electricity market in the UK, the main way to share electricity price is the Wales, England model. In the process of actual electricity price allocation, four different allocation methods are formulated, namely wholesale, power transmission, distribution, and retail allocation [13]. In Spain, the formation of electricity price is mainly implemented by the government to subsidize the cost of power grid operation, which means that when new users access the power grid, new users bear the cost of power grid access, and the part exceeding the standard is mainly subsidized by the government, which will directly supplement the cost of the continuous power grid and return the capital after a certain period of time, which is controlled within 5–10 years [14]. Among the developed countries, Japan’s electricity price policy is quite different from those of the western developed countries. Japan does not share the cost of power grid access, but gradually forms a power grid based on the operation areas of nine major power companies, and presents the characteristics of "the special electricity price system with legal support for monopoly operation, a three-stage electricity price system, and power grid operation" [15]. At the same time, in order to effectively solve the problem of information asymmetry in transmission and distribution cost accounting, the power grid project should establish and improve the third-party enterprise as the supervisory enforcement mechanism for the sake of effective supervision of the life cycle cost accounting of power grid engineering under the background of electric power reform [16]. The study found that an important factor in determining the price of electricity sold by terminals is the transmission and distribution price charged by the grid companies. The important factors determining the prices of transmission and distribution are the transmission and distribution costs. In order to guide the reasonable investment of the power grid and meet normal operation and maintenance, it is necessary to combine the principle of “permitted cost plus reasonable income” and to further investigate the life cycle cost accounting of power grid engineering and its influence factors, thus promoting the healthy development of the power grid [17]. Therefore, there is a need for not only a systematic research method, but also a reflection of the impact of transmission and distribution price reform on the cost calculation of the various stages of grid engineering, especially for depreciation expense and operation and maintenance cost calculation in the operation and maintenance phases. At the same time, a system engineering theory is also required. Considering the overall cost of the system, the life cycle cost of the grid project is optimized to be the lowest possible, thus taking into account economic and social benefits.
System dynamics is a practical method for identifying correlations. Its fundamental purpose is to analyze the feedback of system behavior and develop mathematical models of dynamic interrelationships [18]. In the electricity market in eastern Australia, some scholars have applied system dynamics to study the impact of weather and forward contract conditions on energy supply and demand fluctuations in order to minimize costs for energy retailers [19]. In the context of the smart grid, China’s electricity market has effectively used system dynamics for modeling and optimization of grid engineering project management [20]. With the further study of system dynamics at home and abroad, it has found broadening application and can bear the management and control of cost as a reliable tool and technical supervision [21]. Nowadays, despite the growing development of system dynamics, this method is rarely used in the field of life cycle cost accounting of power grid engineering. Therefore, this paper focuses on the research of power grid engineering in the context of electrical reform and establishes a comprehensive life cycle cost accounting model.
In order to respond to the sustainable development strategy, the power market requires adequate application of the life cycle cost theory to control the cost of power grid engineering to achieve the best economic and social benefits during the project’s operation period [22]. With the in-depth study of the life cycle cost theory, comparisons have been made between the different characteristics of the whole process engineering cost management mode and the current life cycle cost management mode commonly used in the power industry; meanwhile, the necessity and feasibility of application of the life cycle cost theory in engineering cost management in the future power grid has been advanced [23]. At the same time, due to aging malfunctions, purchased or leased equipment has failed to function well with increasing power demand. The life cycle cost theory can be applied in the investigation of the replacement and selection of power grid engineering equipment, and can thus guide the cost calculation of equipment and analyze its influencing factors [24]. In addition, according to research findings [25], power grid engineering often focuses only on the analysis of the initial transformation investment, but ignores that the operation and maintenance costs of power grid engineering account for a large proportion of the entire life cycle of the power grid engineering.
The reform of transmission and distribution prices requires that the designation of transmission and distribution prices be scientific, rational, and transparent to improve the supervision of transmission and distribution costs of the power grid, standardize the supervision and examination of transmission and distribution pricing costs, and promote the strengthening of cost management in power grid projects. Thereby, it is necessary to study the life cycle cost accounting of power grid engineering and its influencing factors. Some scholars have optimized the life cycle cost of power grid engineering, but have not considered the introduction of system dynamics theory and analysis of the relationship between costs and costs at all stages of the life cycle, which have nothing to do with China’s transmission and distribution price reform policies. Therefore, this article is innovative, and its innovations are mainly reflected in the following aspects:
(1)
This article mainly studies the impact of changes in depreciation and the operation and maintenance cost accounting methods on the current electricity reform policy on the LCC of China’s power grid projects. Through setting up different scenarios, analysis is made of the impact of key factors on the LCC in the power reform environment and their impact mechanisms so as to provide a basis for LCC cost control.
(2)
This paper introduces system dynamics into the LCC accounting framework of China’s power grid engineering to clearly show the influence factors and the mechanisms between the different cost accounting in each stage of LCC.
(3)
Based on the influence relationships and action mechanisms of the various stages of costs established by system dynamics, this paper takes the LCC of the power grid project as an integrated system and establishes the LCC dynamic cost accounting model of the Chinese power grid project under the electricity reform policy.
In this paper, Section 2 describes the impact mechanism of electricity reform on grid engineering LCC. Section 3 constructs the system dynamics calculation model of LCC calculation. Section 4 conducts an empirical analysis based on data from the power grid company A. Section 5 applies sensitivity analysis via a system dynamics model. The final section comes to the conclusion and policy recommendations.

2. Impact Mechanism of Electricity Reform on LCC of Power Grid Engineering

2.1. The Core of Electricity Reform

At present, various measures for the new power reform are gradually being promoted in provinces of China. The implementation of the power reform has brought both opportunities for the construction of power grid projects and increasingly fierce market competitions [26,27]. Therefore, in-depth study of power system reform policies in such a large environment will be of help in guiding the construction of power grid projects and in better promoting the sustainable development of the power market, in which the reform of transmission and distribution prices is the core in power system reform, whose related policies have an important impact on the process of power reform. This paper lists the relevant policy documents for electricity reform and the transmission and distribution price reform in the context of electricity reform, as shown in Table 1 [28,29,30,31,32,33]:
In view of the large investment scales and long construction periods of power grid projects, the project life cycle costs consist of initial investment, operation period cost, and decommissioning, considering the preliminary design, equipment purchase, installation, operation, maintenance, and the scrapping and disposal costs. The construction period cost refers to the cost of the project before the production, the transportation and miscellaneous fees, the packaging fee, the installation cost, and the indirect loan interest, which are directly related to the original value of the fixed assets and can be expressed by the depreciation expense. The operating period cost is composed of running cost, maintenance cost, and network loss cost, which form the operation and maintenance fee. The cost of decommissioning and disposal is represented by the residual cost. The following is mainly to analyze the impact of the depreciation expense and operation and maintenance cost accounting in the “Supervision and Examination Method of Transmission and Distribution Tariff Costs”.

2.2. Impact of Electricity Reform on LCC Accounting of Power Grid Engineering

2.2.1. Impact on Depreciation Expense Accounting

It has been pointed out in the “Measures for the Supervision and Examination of Pricing Costs for Transmission and Distribution” that the depreciation expenses should be included in the pricing costs and shall be classified by the method of straight-line depreciation according to the original value of power transmission and distribution fixed assets, which can be calculated for depreciation in the last year of the supervision and examination period, and the depreciation life of power transmission and distribution fixed assets as stipulated in the policies, and shall be classified by the method of straight-line depreciation, as shown in Table 2 [17,34,35].

2.2.2. Impact on Operation and Maintenance Cost Accounting

Regarding the impact of the “Measures for the Supervision and Examination of Transmission and Distribution Pricing Costs” and “Pricing Method for Transmission Prices of Regional Power Grids (Trial)” on the calculation of operation and maintenance costs, it shall be proceeded from four perspectives: Material costs, repair costs, employee compensation, and other costs [36,37], aiming to make a comparison before and after the change, among which, for the impact of the operation and maintenance cost accounting after the electricity reform, the changes in stocks and increments have been specifically listed, as shown in Table 3.

3. Life Cycle Cost Calculation Model of Power Grid Engineering Considering Power System Reform

3.1. Model Construction Ideas and Variable Selection

The “Measures for Supervision and Examination of Transmission and Distribution Pricing Cost” not only improve the scientificity, rationality, and transparency of transmission and distribution price formulation and promote the strengthening of cost management for power grid companies, but also provide insight into building LCC accounting models for power grid projects [38]. In order to clearly illustrate the influencing factors and effect mechanisms of different cost accounting at various stages of LCC, this paper introduces system dynamics into the LCC accounting framework of China’s power grid infrastructure construction projects and establishes an LCC cost accounting model based on system dynamics under the electricity reform policy.
The model proposed in this paper can simulate the long-term behavior and change of cost at all stages of the life cycle of a power grid project. Aiming to achieve this goal more accurately, the dynamic causality of LCC was first analyzed. Then, the cost accounting model of each stage of the whole life cycle was studied, including modeling ideas and variable selection. The LCC cost accounting is classified into three modules, namely the initial investment module, the operation and maintenance module, and the decommissioning and disposal module [39], as shown in Figure 1.

3.2. LCC-CLD Module

This paper is also an attempt to simulate the long-term cost of grid engineering life cycle behavior, mainly from three major aspects: The cost of initial investment (CI) module (including the pre-preparation phase and construction phase), operation and maintenance (O&M) module, and decommissioning and disposal (D&D) module.
The cost variables in the model are derived from the “Baseline for the Preparation of Power Generation Engineering Costs” issued by the Chinese government in 2013 (NDRC of PRC, 2013). The LCC of the grid project can be expressed as:
L C C = C I + O C + C D
where CI (cost of initial investment) is the initial investment cost, that is, the input cost in the preliminary preparation stage and the construction stage; OC (operation and maintenance cost) is the cost in the operation and maintenance stage; CD (cost of disposal) is the cost in the decommissioning stage.
The operation and maintenance cost mainly constitutes three parts: Operation cost, maintenance cost, and failure cost [40], which can be expressed as:
O C = O C o + O C M + O C F
where OCo is the operating cost, O C M is the maintenance cost, and O C F is the failure cost.
On this basis, in order to establish the grid engineering L C C simulation calculation model by using system dynamics, it is necessary to use the causal loop diagram (CLD) to display the important stocks and flows in the model. The CLD is the causal loop diagram, which is a quantitative model to enable simulating and running the model easily [5]. Given that the power grid project’s whole life cycle cost is a complex, mutual-constraint, mutually influenced, and mutually connected cost system, simple superposition of the cost variables of the three phases is far from enough. There is great necessity for a systematic analysis of the life cycle cost of the project. The L C C should be accounted for based on the mechanism of action among the three phases, so that the accounting is more in line with engineering practice and more accurate. The expense names and cost components in Figure 2 and Figure 3 take the “Budget Compilation and Calculation Standards of Grid Construction” issued in 2013 by the National Energy Administration as reference. Because the research content of the life cycle cost is based on time series, the cost of the project’s life cycle is decomposed and estimated, and then the results of each stage are analyzed [41]. Therefore, this paper divides and models the life cycle cost according to its chronological order of costs and expenses to reflect the changes and connections among the various stages of the project’s life cycle. The specific relationships among the three stages (CI module, O&M module, and D&D module) are shown in Figure 2. There are five feedback loops in the preparation stage, which indicates that the cost of the preparation is restricted by the design scale of the power grid project, and the self-regulation mechanism is generated. It can also be seen that the feasibility study fee is at the intersection of the positive and negative feedback loops and is affected by both loops. In the construction stage, the main factors, such as construction and installation costs and equipment fees, are coupled with other systems, and there are nine feedback loops. The maintenance fees and financial costs are related to the CI module. The fixed assets are connected with the O&M module through the initial investment, so it can be seen that the operation and maintenance costs are closely related to each subsystem and interact with each other. In the decommissioning stage, the cost factors include residual value, demolition cost, and other costs such as waste disposal, and there are six feedback loops. However, in the actual project cost prediction, the net residual value is generally reflected in the form of net residual value, which is calculated from the net residual value rate and the fixed asset value of the power grid project.

3.3. LCC Model Formulation

With the life cycle system of power grid engineering factors and their internal connections determined through the causal loop diagram ( C L D ), a system flow diagram (Figure 3) is constructed to run the model represented by the casual loop diagram on a computer, which can more vividly show the formation process of the power grid LCC and its dynamic changes. In fact, the cause–effect diagram and the system flow diagram are different ways of expressing the same problem: The cause–effect diagram uses arrows and words to describe the model and is a qualitative description of the internal cause–effect relationships between various factors, thereby speeding up the understanding of the research problem; the system flow diagram is an illustration of the model from the perspectives of flow, stock, and auxiliary variables, and cleverly uses coding procedures and equations to describe the inherent quantitative relationships between factors [42]. The cost of each stage in the model in Figure 3 is considered from two perspectives: Static cost and dynamic cost. Dynamic cost is the cost that considers the time value of funds. Due to some possible factors, such as price increases and inflation, the value of funds will change over time, that is, the value of paying or getting the same amount of money at different times is not the same [43]. At the same time, the annual life cycle cost (LCCA) is introduced to better judge the project cost of two or more projects with different life spans. Observing the LCCA can predict the future project cost of a power grid project more intuitively. According to the analysis of the causal loop diagram (CLD) in Section 3.2, the model structure of the LCC accounting module is shown in Figure 3.

3.3.1. CI Module

According to the provisions of the Document No. 9 of the Electric Power Reform and the Document No. 8 of the Supervision and Audit Measures, the operating costs of businesses that are irrelevant to power transmission and distribution are not included in the permitted costs of power grid enterprises [44,45,46]. We refer to the “Budget Compilation and Calculation Standards of Grid Construction” issued by the National Energy Administration (2013 edition) to establish an initial investment model. Specifically, the cost of initial investment is composed of the preparation cost and construction cost, as shown in Formula (3), the meanings of variables in Equations (3)–(20) are as shown in Table 4.
C I = P C + C C
This paper assumes that the project preparation time is one year and the construction period is two years. The construction cost consists of construction land cost, basic preparation cost, bidding fee, management fee for quota preparation of power transmission and transformation project, feasibility study cost, survey and design cost, and management expenses. The change rate of construction cost can be expressed as:
R C = { 0 , t 1 , t 4 , t Ζ F O + D C + B R F + L T M + C A I C , 2 t 3
The initial preparation cost starts at 0, and the preparation cost is the value of the preparation cost change rate, which changes with time. The preparation cost can be expressed as:
P C S = I N T E G ( P C R , 0 )
The dynamic cost of preparation can be expressed as:
P C D = P C S ( 1 ( 1 + y ) t 1 )
The technical service fee for construction projects is divided into three parts: Survey and design cost, design document review fee, and pre-project work cost.
F C P T S = F S D + F D R + F P W
The purchase cost of equipment and tools only occurs during the construction period. Assuming that the preparation period is one year and the construction period is two years, the equipment fee can be expressed as:
F E P = { 0 , t 1 , t 4 , t Ζ F O + D C + B R F + L T M + C A I C , 2 t 3
The construction starts at 0; the construction cost is the value of the construction cost change rate, which changes with time. The construction cost can be expressed as:
C C S = I N T E G ( R C , 0 )
The dynamic cost of construction can be expressed as:
C C D = C C S ( 1 ( 1 + y ) ( t 1 + t 2 ) )
The construction and installation cost, which includes the installation cost and the construction and implementation cost, can be expressed as:
C A I C = I E F + C C
The installation cost and construction and implementation cost can be expressed as:
I E F = F O E I + F S D I + F T E I + F C C E
C C = F T E + F B E + F A E + F B C
The basic preparation cost can be expressed as:
F B R = ( F A + C A I C + I A ) R
The fixed assets can be expressed as:
F A = C A I C + F E P + F O
The purchase cost of equipment and tools consists of the equipment fee and the freight and miscellaneous expenses of equipment, which can be expressed as:
F E P = F E + F E t
where the freight and miscellaneous expenses of equipment are the product of the equipment fee and the freight rate of equipment.
F E t = F E r E
The initial value of the spread reserve fee is 0, and the value of the spread reserve fee change rate changes with time. The reserve for price difference can be expressed as:
F S r = I N T E G ( R S r , 0 )
The change rate of reserve for price difference is affected by the project construction investment, the annual cost-rising index, the year of construction, and the time interval.
R S r = { 0 , t 1 t 4 ( 1 + I A C ) ( Y C + Y C   I 1 ) C I P
The project construction management fee can be expressed as:
F C M = F E I + F S + F M + F E S

3.3.2. O&M Module

The cost of the grid enterprises in the operation and maintenance stage is affected by the original value of the accrued fixed assets that can be calculated [47]. For example, the equipment purchase cost is transferred to the product cost in the form of depreciation, which is an important part of the fixed assets of the product.
The definition of operation and maintenance fees is also repeatedly clarified in the policy, making the cost verification more accurate and practical. For example, the operation and maintenance fee stipulated in the Document No. 8 of the Electric Power Reform refers to the expenses for the power grid enterprise to maintain the normal operation of the power grid, including material costs, repair costs, labor costs, and other operating costs. No. 9 of Electric Power Reform stipulates that expenses irrelevant to the transmission and distribution business of power grid enterprises shall not be included in the transmission and distribution pricing costs [48,49].
Therefore, the operation and maintenance module in this paper is mainly composed of material costs, repair costs, labor costs, and other operating costs. The equation is as follows, and the meanings of variables in Equations (21)–(32) are shown in Table 5:
R O M C = { 0 , T < T E C P T D M P ( M R O T ) + F O + F L + F M + F E , T > T E C P a n d   F O 20 %   O M C
O M C S = I N T E G ( R O M C , 0 )
O M C D = O M C ( 1 ( 1 + y ) ( t 1 + t 2 + t 3 ) )
F M = F A R M and n e w ( F M + F N ) 2.5 % n e w F A
R O M C = { 0 , T < T E C P L O A O M ( 1 + i ) n L A O A O M t , T > T E C P
W O A O M = L C R L
L O A O M = C P I + L A C I
L A C I = C I P P C
I C = L A C I ( 1 + i ) n L A C I
F L = F L P Q
S W G = P C S R A W G
P C S = I N T E H G ( S W G , 0 )

3.3.3. D&D Module

Factors influencing costs during the decommissioning phase comprise residual value, demolition costs, and other costs, such as waste disposal. The longer the system is in use, the smaller the residual value will be; the fixed asset value is formed by the preliminary preparation costs and construction costs, so that the system is organically linked with other subsystems. According to Article 31 of the "Interim Regulations and Implementation Rules of the Enterprise Income Tax of the People’s Republic of China", the proportion of residual value is within 5% of the original price, which shall be determined by the enterprise [50,51]. The equation for the decommissioning and disposal cost module is as follows, and meanings of variables in Equations (33)–(36) are shown in Table 6:
R D C = F O D C + D C + F R V
D C S = I N T E G ( R D C , 0 )
D C D = ( D C - F R V + F O D C ) ( 1 ( 1 + y ) ( t 1 + t 2 + t 3 + t 3 ) )
R = 1 ( ( 1 R s ) n ) t

4. Case Application

Based on the above-mentioned cost analysis and calculation model, this study introduces a 110 kV transmission and transformation project of A Power Grid Company as an empirical analysis, measures its life cycle cost, and makes an in-depth discussion on issues such as power grid engineering cost changes after power reform.

4.1. Basic Data

The data of this study mainly include three parts: Related report data of a 110 kV transmission and transformation project of A Power Grid Company, the policies and regulations concerned, and calculation data of self-built models. The main input data sources and sizes of each module are shown in Table 7 below. The data derived from the life cycle cost calculation module show the cost changes of a certain transmission and transformation project in the next 23 years.
According to the analysis of the cause–effect diagram of the previous life cycle cost, the preparatory phase is set to be one year, the construction phase to be two years, the operation and maintenance phase to be 20 years, and the full life cycle life of the 110 kV transmission and transformation project to be 23 years.

4.2. Analysis of Simulation Results
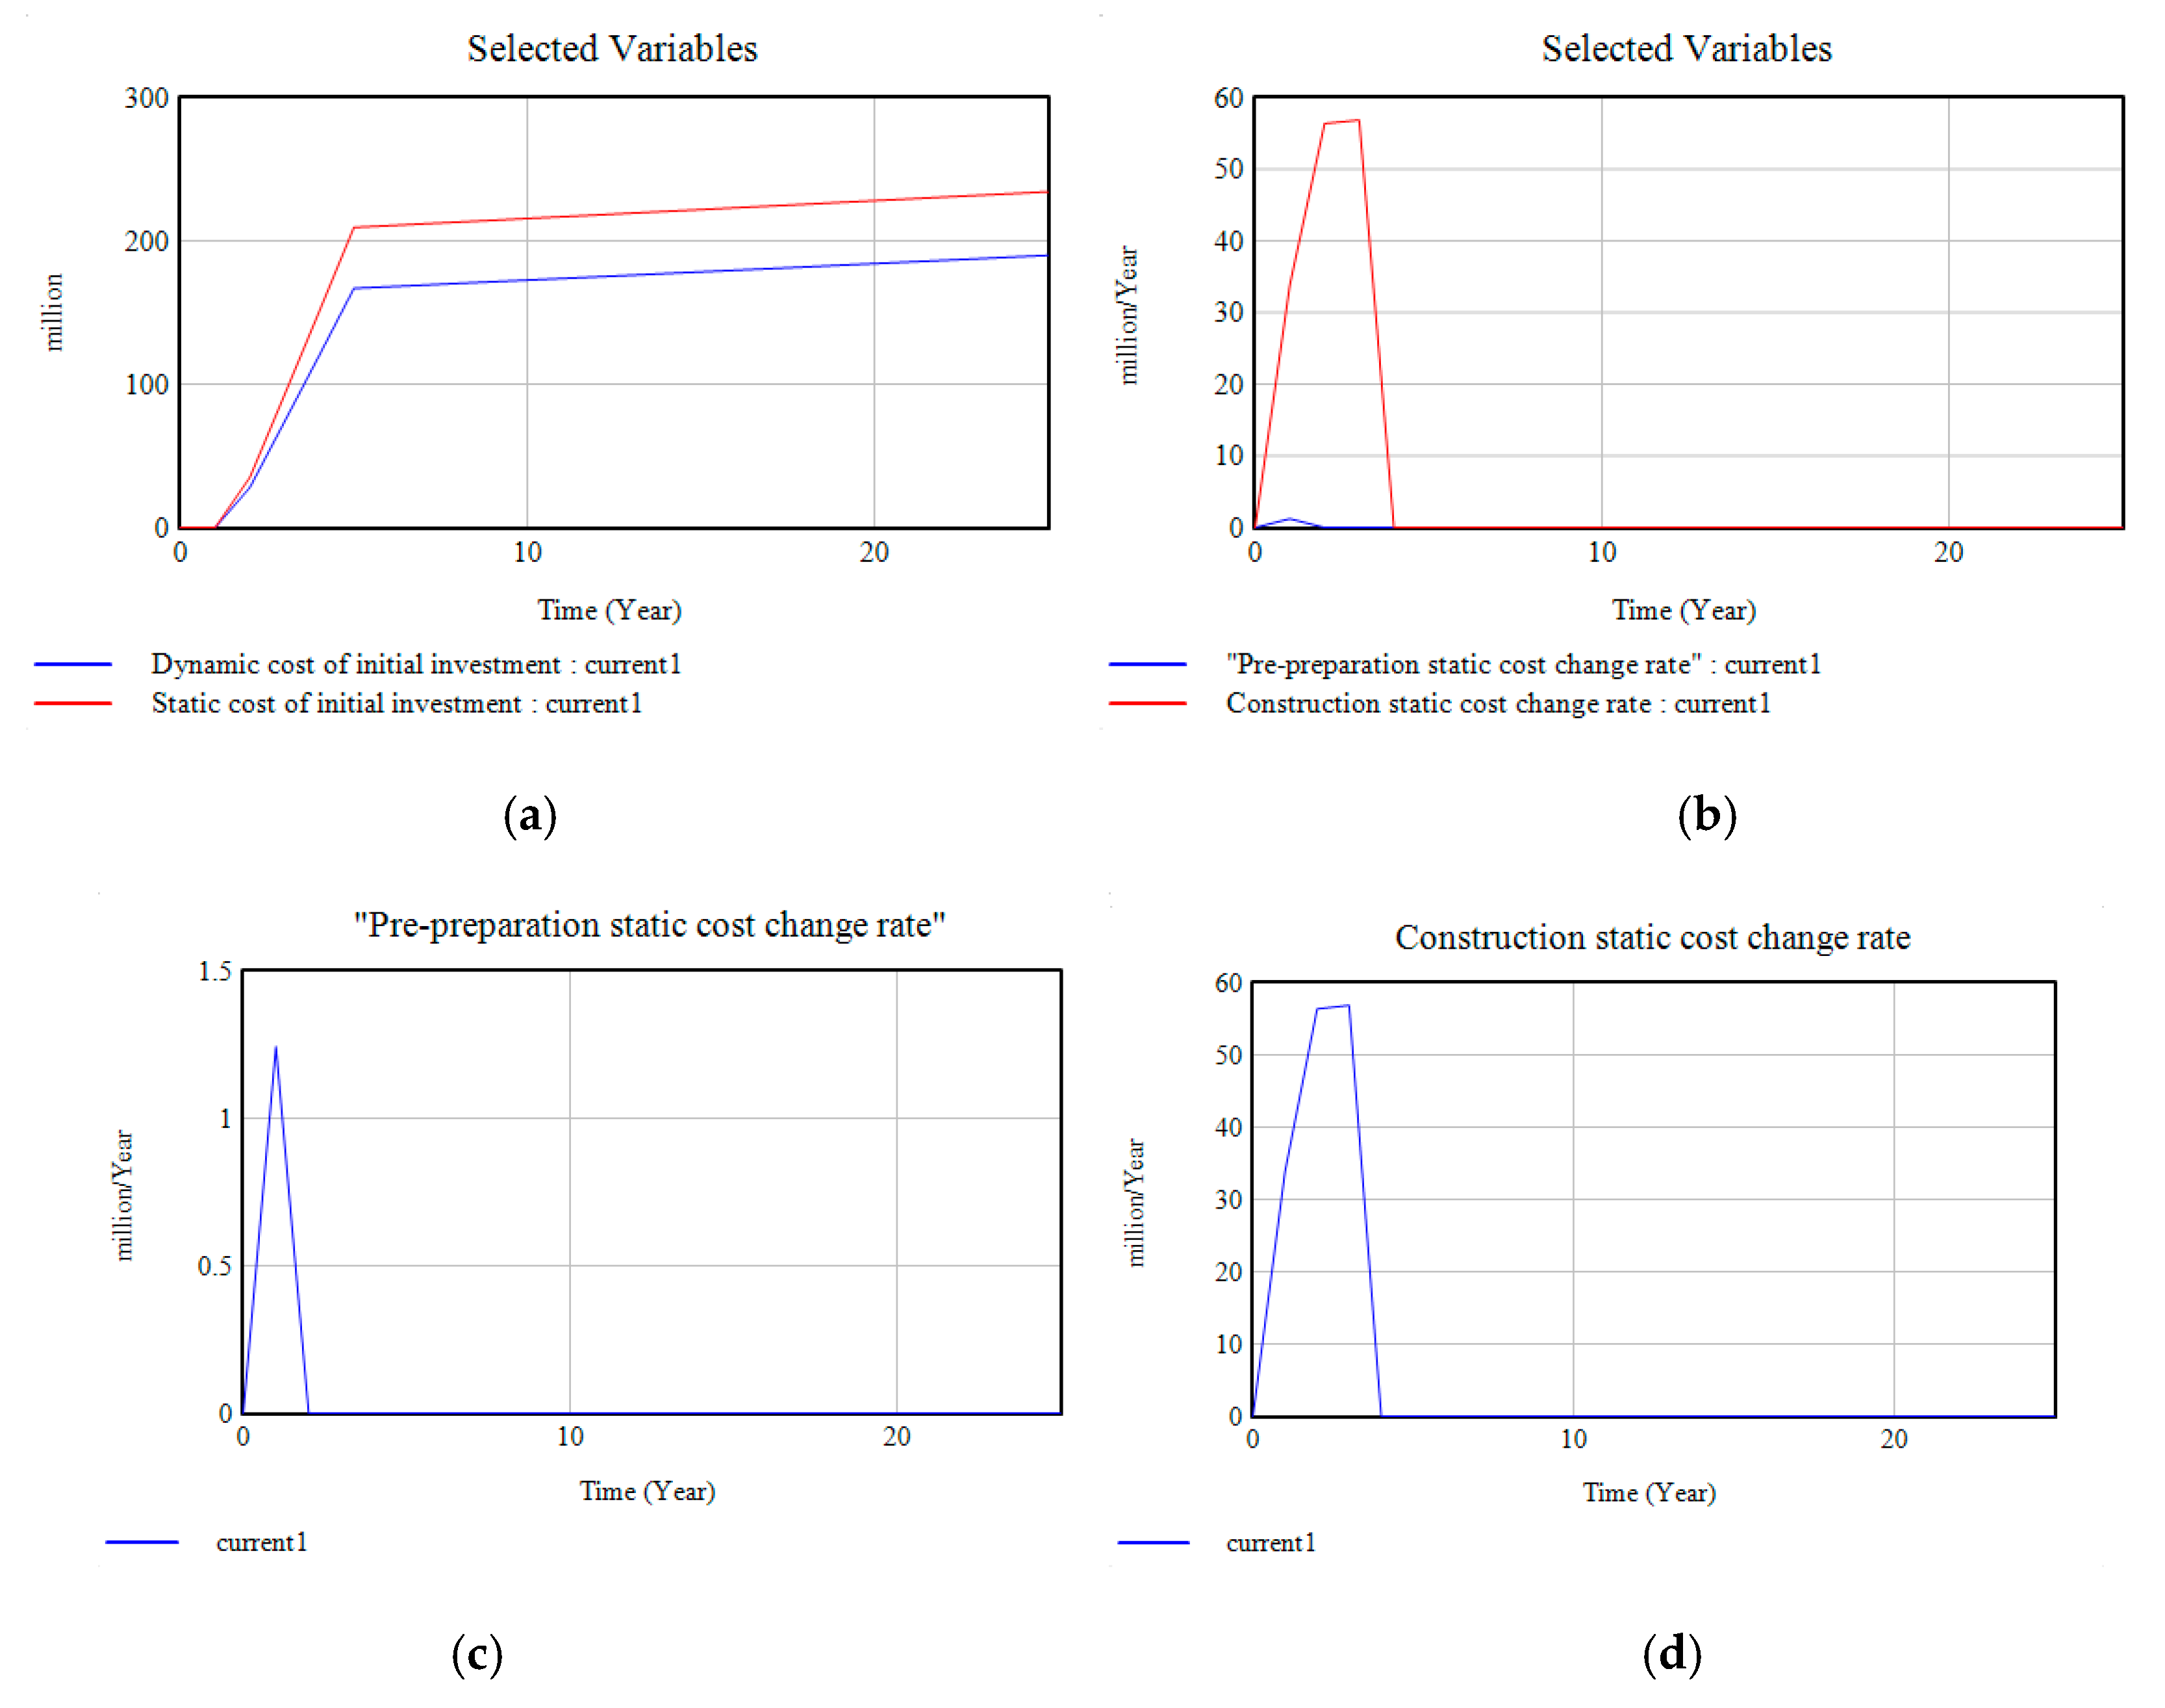
In the context of the current transmission and distribution price reform, there has been a change in the cost and effective asset reconciliation of power grid enterprises. In order to meet the policy requirements, grid LCC accounting is extremely important. Based on the methods for approving transmission and distribution prices issued by the National Development and Reform Commission and the “Supervision and Inspection Measures”, with the relevant experience of reforming pilot cities and integrating the actual situation of 110 kV transmission and transformation projects of A Power Grid Company, a simulation model of the cost and rate of change in the life cycle is established, including the “initial investment module, operation and maintenance cost module, and decommissioning cost module”. Simultaneously, the static costs with no allowance for time value and the dynamic costs with regards to the time value of capital are analyzed. The simulation results of CI module, O&M module and D&D module are shown in Figure 4, Figure 5 and Figure 6 respectively.

4.2.1. CI Module

It can be seen from Figure 4a that the dynamic initial investment cost, which takes into account the time value of funds, is lower than the static initial investment cost, which does not take into account the time value of funds. Through the comparison of the two, this paper fully shows that the equivalent funds that occur at different times have different values. Therefore, even if inflation is not taken into consideration, the funds available for investment are more valuable than the equivalent amount of funds available in the future.
Figure 4b–d analyze the cost changes in the initial investment stage from the perspective of the preparatory stage and the construction stage. The Figure 4c illustrates drastic increases in the static cost change rate in the first, second, and third years. This is because the project’s engineering investment is most intensive in its preparatory stage and construction stage. Therefore, in the context of electricity reform, strengthening the cost of the two key stages of the initial investment cost is more conducive to enhancing the supervision and review of costs and the role of incentives.
The model simulation predicts that the static initial investment of the project is 147.5475 million yuan and that the dynamic initial investment is 115.812 million yuan.

4.2.2. O&M Module

It can be seen from Figure 5a that the dynamic cost and static cost are on the rise year by year during the 23 year operating period. Figure 5b shows a sharp increase in the rate of change in static costs of operation and maintenance costs in the fourth to fifth years, which is due to the more preparation work in the initial stage of project operation. Then, over time, the gradual rise in maintenance costs gives rise to the growth in the total cost of operation and maintenance.
As shown in Figure 5c, with the growth in long-term loans during the operation period generated by the interests during the construction period and the amounts of construction investment loans, the financial expenses gradually come into being, thus realizing the boom from the fourth year to the fifth year, when the project is put into operation.
As the key object of the cost of the operation and maintenance phase, fixed assets can be seen in Figure 5d. During the first three years, there was a rapid growth in fixed assets in the initial investment phase, which was near steady in the third year, i.e., during the construction period. Then, due to the continuous operation of buildings and equipment, it is affected by depreciation. The fixed assets that were formed continue to decrease when in use.

4.2.3. D&D Module

As shown in Figure 6, the cost of A Power Grid Company’s decommissioning and disposal has a negative growth trend during the 23 to 24 years of the project due to the higher residual value of the project than the sum of the demolition costs and other costs. A 24 year drop in the residual value gave rise to a positive trend of the cost of decommissioning and disposal. Given the fact that the dynamic cost considers the time value of funds from a social perspective, the dynamic cost of the residual value is lower than the static cost, which causes the static cost of the decommissioning treatment to start to rise.
With the background of the transmission and distribution price reform, power grid companies are facing severe investment risks. Therefore, companies should carefully calculate their costs and strengthen LCC control.

4.3. Model Validation

Before analyzing the simulation results of the developed model, it is needed to verify and validate the effectiveness of the model. There are diverse validation approaches to ensure that the simulation results are authentic [26]. In order to verify the developed model, the dimensional consistency needs to be checked first. Next, the model behavior reproduction test, which is the core validation test and is commonly used, is adopted in this section as the major validation approach. Through this verification test, the ability of the model to reproduce the behavior of major variables is examined qualitatively and quantitatively. The model verification results from 2016 to 2018 are shown in Table 8.
Table 8 shows the model verification results of the 110 kV transmission and transformation project of A Power Grid Company from 2016 to 2018, which only involved a two-year construction period. It can be seen from Table 8 that the relative errors of these main variables are less than 5%, indicating that the proposed System dynamics model can simulate the realistic situations of the analyzed LCC well.

5. Sensitivity Analysis

Since the discount rate is set by the central bank, the formulation of the discount rate has an impact on the amount of money that takes into account the time value of funds. Meanwhile, due to the Development and Reform Commission and Energy Bureau’s Development and Reform Price Regulation [2019] No. 897 “Transmission and Distribution Pricing Cost Monitoring and Examination Measures” issued by the National Development and Reform Commission and the Energy Bureau in May 2019, the calculation of fixed residual value rate, depreciation period, and accruable fixed assets in the new situation has been clearly specified. Therefore, this chapter selects the depreciation rate, residual value rate, discount rate, and accruable fixed assets as the main influencing factors of the life cycle cost of the power grid project for sensitivity analysis. In this study, the relevant data of 110 kV transmission and transformation projects in 2016 were used as a reference object. Using the system dynamics simulation software VENSIM, the impacts of four key factors on the full life cycle cost of power grid engineering were tested with a ± 2% or ± 20% variation.

5.1. Scenario 1: Discount Rate

The discount rate is changed by ± 2% on the basis of 8%. The dynamic life cycle cost and annual life cycle cost (LCCA) of the grid project considering the time value of funds are shown in Figure 7 and Figure 8 below. Initial investment, changes in operation and maintenance costs, and decommissioning costs are shown in Figure 9 and Figure 10 below.
As seen from Figure 7, Figure 8, Figure 9 and Figure 10 above, at the same rate of change, the change in discount rate has the greatest impact on dynamic LCC and decommissioning and disposal costs. When the discount rate increases by 2%, the dynamic LCC decreases by about 4.53% to 8.79%, and dynamic decommissioning and disposal costs are reduced by about 21%. The impact on initial investment, operation and maintenance costs, and annual costs is in the second position. No matter if static or dynamic, the discount rate fluctuates by two percentage points, which has a significant impact on the total life cycle cost and the cost of each stage, which indicates that the discount rate is a sensitive factor and that the formulation of the future discount rate is one of the important factors affecting the LCC of power grid projects. When the discount rate decreases, the LCCA also decreases, but the LCC, initial investment costs, operation and maintenance costs, and decommissioning and disposal costs increase. Since the introduction of annual cost value is intended for better judgement of the cost of two or more projects with different lifespans, in view of the reduction of the discount rate, observation of the annual cost value can lead to a more intuitive prediction of the future engineering cost of the grid project. Therefore, a reasonable discount rate based on actual conditions will help reduce costs and increase the efficiency of power grid projects.

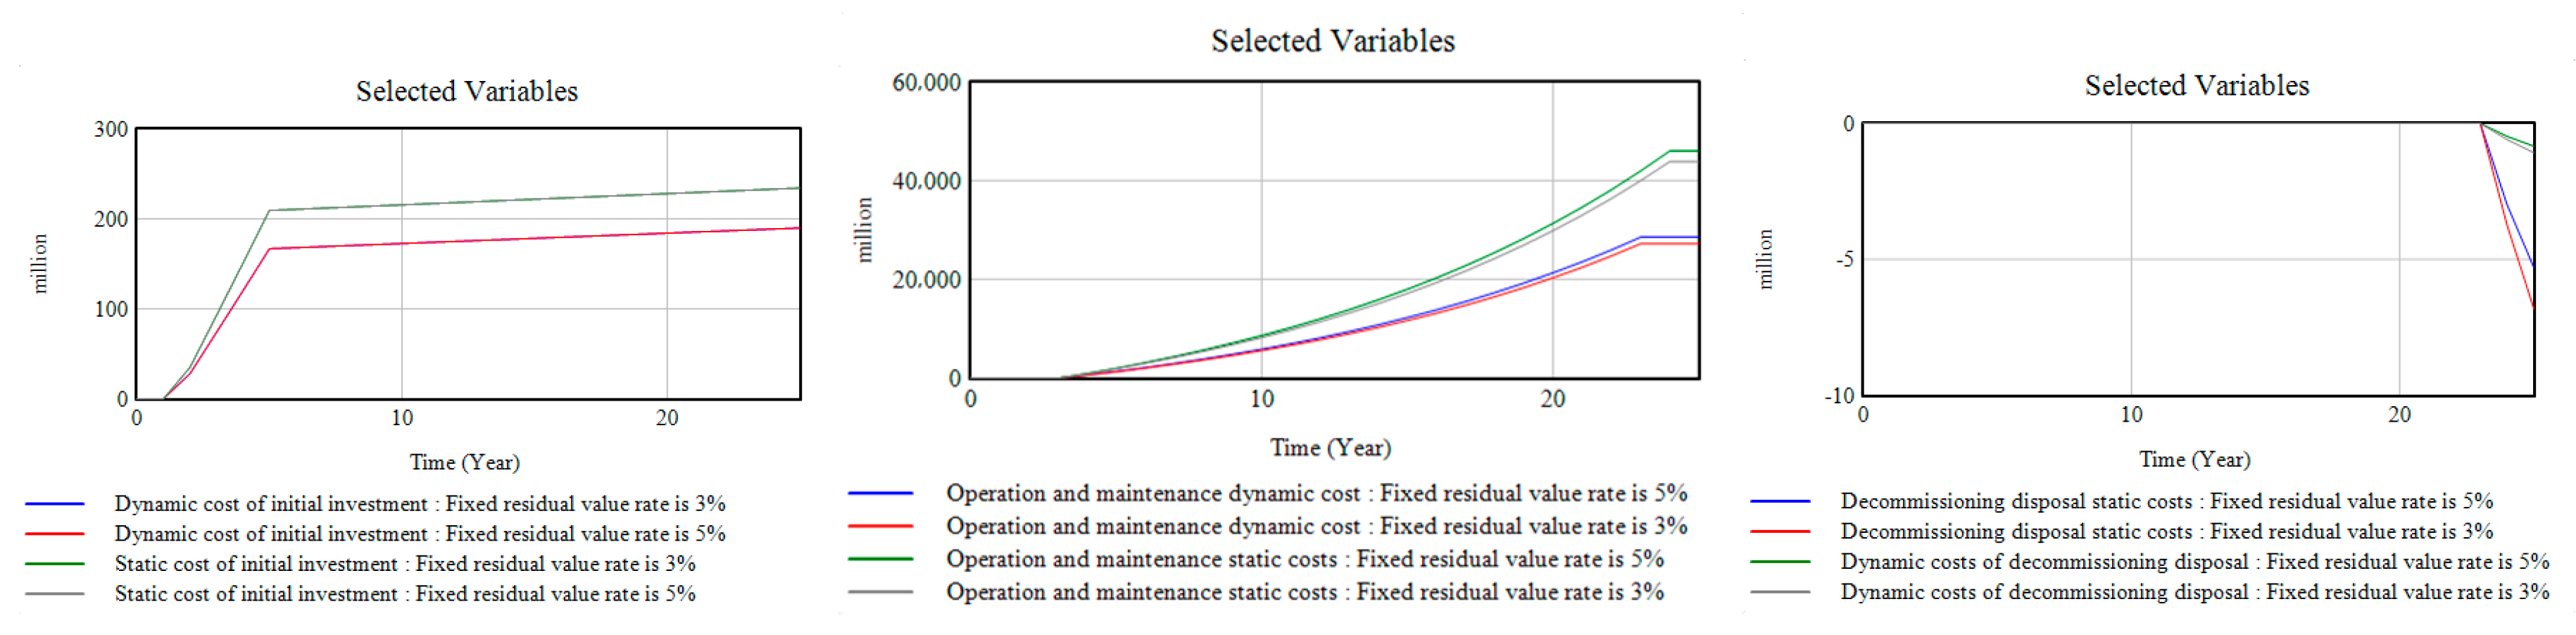
5.2. Scenario 2: Fixed Residual Value Rate

In this paper, the fixed residual value rate fluctuates by ± 2% on the basis of 5%. Considering the time value of funds from the perspective of the whole society, the dynamic and static costs and annual values of dynamic and static costs of the entire life cycle of power grid projects are shown in Figure 11 and Figure 12 below. Changes in initial investment, operation and maintenance costs, and decommissioning and disposal costs are shown in Figure 13 and Figure 14 below.
According to Figure 11 and Figure 12, Given the slight influence of the cost of decommissioning and disposal on the total life cycle cost, the fixed residual value rate fluctuation of 2% has little impact on LCC and LCCA. According to Figure 13 and Figure 14, the fixed residual value rate fluctuates by 2% and there is no significant change in the initial investment cost, mainly due to the residual values generated by the fixed assets of previous investment when in use. The fine-tuning of the fixed residual value rate has an obvious effect on the operation and maintenance phase and the decommissioning phase. In particular, it has the greatest impact on the decommissioning phase. When the fixed residual value rate increases by 2%, the dynamic and static decommissioning and disposal costs change by approximately 56.17%.
China’s power grid engineering cost accounting often fails to take into account the cost accounting of the decommissioning and disposal stage, but smooth accomplishment of the decommissioning of the power grid project will help enterprises to obtain the maximum residual value in the final stage. In the new situation, the change in the fixed residual value rate has a significant impact on the cost of the decommissioning and disposal stage. Therefore, formulating the principles and specific implementation methods for the decommissioning of power grid projects under the concept of full life cycle management is an important step in response to the electricity reform policy.

5.3. Scenario 3: Depreciation Period

In this paper, the depreciation period fluctuates by ± 20% on the basis of 26 years. The full life cycle dynamic cost, static cost, and annual cost of the grid project considering the time value of funds are shown in Figure 15 and Figure 16 below. Fluctuations in decommissioning and disposal costs are shown in Figure 17 and Figure 18 below.
According to the above four figures, the fluctuation in depreciation period of 20% has no significant impact on the initial investment cost, but rather on the dynamic and static costs, dynamic and static adult values, operation and maintenance costs, and decommissioning and disposal costs throughout the life cycle. Given the impact of the change in depreciation period on the size of the net residual value, there is a particularly obvious change of about 66.41% in the cost of decommissioning and disposal. Therefore, grid companies should pay special attention to the depreciable depreciation rate of fixed assets so that the invested capital can be recovered more quickly, thereby reducing or even eliminating the company’s losses, and so they can effectively and thoroughly carry out the full life cycle cost accounting of grid projects.

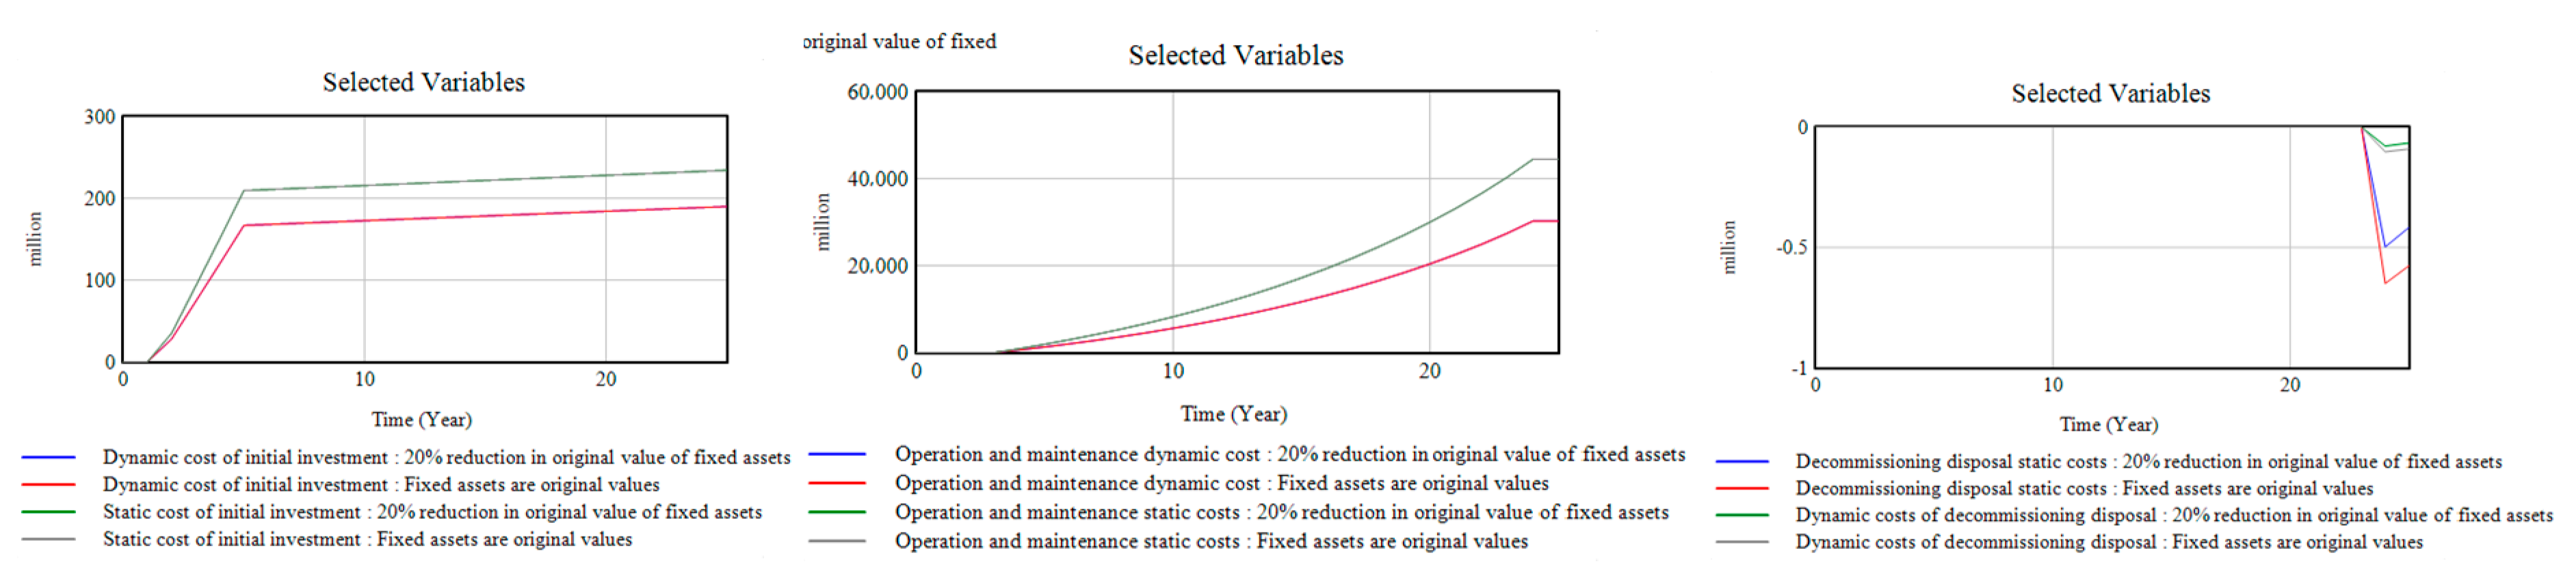
5.4. Scenario 4: Accrued Fixed Assets

In this article, there is a fluctuation of 20% in the accrued fixed assets from the original value. The dynamic life cycle cost and annual cost of a power grid project considering the time value of funds are shown in Figure 19 and Figure 20 below. Changes in initial investment, operation and maintenance costs, and decommissioning and disposal costs are shown in Figure 21 and Figure 22 below.
As depicted in Figure 19, Figure 20, Figure 21 and Figure 22, under the same change rate of fixed assets, there is no significant change in dynamic full life cycle cost, annual cost, initial investment, or operation and maintenance costs. However, fluctuation in the change rate has a major impact on decommissioning and disposal costs. Compared with the discount rate, fixed residual value rate, and depreciation period, the fluctuation of fixed assets on the overall life cycle cost of the project is not obvious. However, in the life cycle cost calculation of power grid projects, there is a necessity to pay attention to the classification based on the accruable fixed asset categories explicitly proposed in the electricity reform to strictly control the cost accounting, so as to realize the largest capital transfer for grid companies and further improve the institutionalization and standardization of cost supervision and examination.

6. Conclusion

In the context of China’s electricity reform, after the promulgation of the Electricity Reform Document No. 8 and Electricity Reform Document No. 9, the accounting methods and scope of assets of power grid enterprises changed. However, in terms of cost accounting, few studies on the LCC of power grid engineering have been considered. On this basis, this article considers the impact of power reform on the life cycle cost accounting methods and accounting scope of the power grid project, and uses system dynamics to establish the LCC-CLD to clearly show the interrelationship between the costs of each phase of the life cycle of the grid and the mechanism of action; based on this, an LCC model was established. At the same time, through the sensitivity analysis of the key factors of the electricity reform, this paper puts forward suggestions and strategies for power grid project management. Specifically speaking:
  • Under the power reform, the depreciation period, deductible fixed assets, operation and maintenance costs, and residual value rate are the main factors affecting cost accounting, which may lead to a decrease in the effective assets and an increase in the total cost of grid business accounting.
  • In cost accounting, operation, maintenance, decommissioning, and disposal cannot be ignored. In the empirical study, compared with the original billing method, the fixed assets will be relatively reduced under strict verification of assets, and the residual value will be changed due to the provision of depreciation period.
  • The discount rate is the key sensitivity factor of the system, and the impact of the total life cycle cost and the cost in each stage is significant, especially in the decommissioning and disposal stage. Empirical evidence shows that when the discount rate increases 2%, the LCC decreases by about 4.53%–8.79%, and the decommissioning and disposal cost decreases by about 21%. Furthermore, when the discount rate decreases, the LCCA decreases, and the initial investment cost of the LCC increases. Moreover, the change of fixed residual value rate causes no obvious change to the initial investment cost, but has obvious influence on the operation and maintenance stage and decommissioning and disposal stage. The depreciation period has little effect on the initial investment cost, but it has a significant impact on the life cycle cost, annual cost value, operation and maintenance cost, and decommissioning and disposal cost; at the same time, the impact on decommissioning and disposal costs is about 66.41%. The impact of accruable fixed assets on the LCC of the project is generally not obvious, but it is critical to the formation of effective assets for grid companies.
In line with the above empirical findings, several policy implications can be proposed in this part.
  • A cost accounting system that fits the institutional background needs to be constructed. Grid companies need to strictly define the cost structure of transmission and distribution pricing and to try to transform investment into effective assets recognized by the state so as to reduce the operating costs of power grid companies.
  • Under the situation of power reform, power grid enterprises should pay attention to the discount rate, flexibly grasp the values of residual value rate and depreciation period according to the enterprise’s situation, and further divide the range of fixed assets that can be depreciated.
  • Attention should be paid to the reform of the electric power system, attaching importance to the operation and maintenance stage and the decommissioning and disposal stage. At present, power grid enterprises generally pay attention to the initial investment cost and neglect the operation, maintenance, decommissioning, and disposal. However, empirical evidence shows that power reform has a great impact on operation and decommissioning, so it is necessary to strengthen the collection and accumulation of data. At the same time, the Chinese government should further improve the supervision and examination mechanism for transmission and distribution costs, and continuously improve the institutionalization and standardization of cost supervision and examination.

Author Contributions

Y.W. and S.S. conceived and designed the research method used in this paper; M.G. and J.W. collected related policy documents and reference used for the analysis; Z.T. and J.Z. checked the language of this paper; Y.W. provided critical comments and supervised the related research work; S.S. performed the empirical analysis and wrote the paper. All authors have read and agreed to the published version of the manuscript.

Funding

This research was funded by Fundamental Research Funds for the Central Universities, grant number 2018ZD13; Science and Technology Foundation of State Grid Corporation of China, grant number SGHEJY00JJJS1900017; Project of Beijing Social Science Fund, grant number 18GL042; and Key Research and Development Program of Hebei Province, grant number 19216109D.

Conflicts of Interest

The authors declare no conflict of interest.

References

  1. Liao, Z.; Chen, C.; Zang, X. Research on comparison of power grid planning program based on life cycle cost. In Proceedings of the 2016 IEEE International Conference on High Voltage Engineering and Application (ICHVE), Chengdu, China, 19–22 September 2016. [Google Scholar]
  2. Yang, C.; Su, Z.; Wang, X.; Liu, Y.; Qi, Y. Design of investment management optimization system for power grid companies under new electricity reform. In AIP Conference Proceedings; AIP Publishing LLC.: Long Island, NY, USA, 2017. [Google Scholar]
  3. Li, W.; Zhu, J.; Zhu, Z. The Energy-saving Benefit Evaluation Methods of the Grid Construction Project Based on Life Cycle Cost Theory. Energy Procedia 2012, 17, 232. [Google Scholar] [CrossRef] [Green Version]
  4. Jeromin, I.; Balzer, G.; Backes, J.; Huber, R. Life Cycle Cost Analysis of Transmission and Distribution Systems. In Proceedings of the 20th International Conference and Exhibition on Electricity Distribution (CIRED 2009), Prague, Czech Republic, 8–11 June 2009; pp. 1–6. [Google Scholar]
  5. Wang, Y.; Wang, G.; Zuo, Y.; Fan, L.; Wei, J. Comprehensive evaluation of power grid enterprises’ credit rating under the reform of transmission and distribution price. In AIP Conference Proceedings; AIP Publishing LLC.: Long Island, NY, USA, 2017. [Google Scholar]
  6. Wu, J.F. The Frame of Informational Reform in the Supervision System of Power Operation-The District-Level Power Supervising Organs of Chinese Cities for Example. Appl. Mech. Mater. 2011, 71–78, 3246–3252. [Google Scholar] [CrossRef]
  7. Robertson, G.P.; Grace, P.R. Greenhouse Gas Fluxes in Tropical and Temperate Agriculture: The need for a Full-Cost accounting of Global Warming Potentials. Environ. Dev. Sustain. 2004, 6, 51–63. [Google Scholar] [CrossRef]
  8. Wu, Y.N.; Huang, Z.J. Application of a Case-Based Reasoning Method in Estimating the Power Grid Project Cost. In Proceedings of the 2008 4th International Conference on Wireless Communications, Networking and Mobile Computing, Dalian, China, 12–14 October 2008. [Google Scholar]
  9. Goto, M.; Inoue, T.; Sueyoshi, T. Structural reform of Japanese electric power industry: Separation between generation and transmission & distribution. Energy Policy 2013, 56, 186–200. [Google Scholar]
  10. Yong, H.; Wenxu, T.; Zhongfu, T. A Long-Term Marginal Cost Based Transmission and Distribution Pricing Model for Power Transmission and Distribution in Various Voltage Classes and Its Application. Power Syst. Technol. 2011, 35, 175–180. [Google Scholar]
  11. Zhao, H.; Zhao, H.; Guo, S. Comprehensive Performance Evaluation of Electricity Grid Corporations Employing a Novel MCDM Model. Sustainability 2018, 10, 2130. [Google Scholar] [CrossRef] [Green Version]
  12. Deng, X. Regulation of Transmission and Distribution Charges and Utility Practice in Texas USA. Power Technol. Econ. 2007, 1, 37–41. [Google Scholar]
  13. Giulietti, M.; Grossi, L.; Waterson, M. Price transmission in the UK electricity market: Was NETA beneficial? Energy Econ. 2010, 32, 1165–1174. [Google Scholar] [CrossRef] [Green Version]
  14. Bueno-Lorenzo, M.; Moreno, M.Á.; Usaola, J. Analysis of the imbalance price scheme in the Spanish electricity market: A wind power test case. Energy Policy 2013, 62, 1010–1019. [Google Scholar] [CrossRef]
  15. Sichao, K.; Yamamoto, H.; Yamaji, K. Evaluation of CO2 free electricity trading market in Japan by multi-agent simulations. Energy Policy 2010, 38, 3309–3319. [Google Scholar] [CrossRef]
  16. Li, A.; Qing, X.; Zheng, H.W. Method of Third Party Supervision on Transmission and Distribution Costs. Autom. Electr. Power Syst. 2016, 40, 1–7. [Google Scholar]
  17. Lai, C.L.; Ip, W.H.; Lee, W.B. The system dynamics model for engineering services. Manag. Serv. Qual. 2001, 11, 191–199. [Google Scholar] [CrossRef]
  18. Roesfiansjah, R.; Arun, K.; Firoz, A.; Shougi, A. A System Dynamics Conceptual Model on Retail Electricity Supply and Demand System to Minimize Retailer’s Cost in Eastern Australia. Procedia Eng. 2012, 49, 330–337. [Google Scholar]
  19. Zhou, L.C.; Lisha Li, N.; Zeng, M. Modelling and Simulation of Power Grid Engineering Project based on System Dynamics on the Background of Smart Grid. Syst. Eng. Procedia 2012, 3, 92–99. [Google Scholar]
  20. Khataie, A.H.; Bulgak, A.A.; Segovia, J.J. Activity-Based Costing and Management applied in a hybrid Decision Support System for order management. Decis. Support Syst. 2012, 52, 142–156. [Google Scholar] [CrossRef]
  21. Khataie, A.H.; Bulgak, A.A.; Segovia, J.J. Advanced decision support tool by integrating activity-based costing and management to system dynamics. In Proceedings of the Picmet Technology Management for Global Economic Growth, Phuket, Thailand, 18–22 July 2010. [Google Scholar]
  22. Niu, D.X.; Wang, W.J. Based on sustainable development about thermal power project life cycle cost evaluation. Sci. Sci. Technol. Manag. 2009, 6, 145–148. [Google Scholar]
  23. Dong, J.J.; Li, J. Application of Full Life Cycle Cost Management Theory in Power Engineering Cost Management. Electr. Power Constr. 2009, 7, 88–91. [Google Scholar]
  24. Zhang, H.; Wang, J.X.; Cao, X.Y. Replacement and Investment strategy of rural distribution transformer replacement using life cycle cost and risk analysis. J. Xi’an Jiaotong Univ. 2015, 8, 133–140. [Google Scholar]
  25. Sterman, J.D. Business Dynamics: Systems Thinking and Modeling for a Complex World; McGraw-Hill Higher Education: New York, NY, USA, 2000. [Google Scholar]
  26. Marzouk, M.; Seleem, N. Assessment of existing buildings performance using system dynamics technique. Appl. Energy 2018, 211, 1308–1323. [Google Scholar] [CrossRef]
  27. National Development and Reform Commission of the People’s Republic of China. Available online: http://www.nea.gov.cn/2015-11/30/c_134867851.htm (accessed on 30 November 2015).
  28. Measures for Pricing of Transmission and Distribution Price of Provincial Power Grid (for Trial Implementation). Available online: http://www.gov.cn/xinwen/2019-05/28/content_5395367.htm (accessed on 28 November 2015).
  29. Measures for Pricing of Transmission and Distribution Price of Provincial Power Grid (for Trial Implementation). Available online: http://www.gov.cn/gongbao/content/2015/content_2953958.htm (accessed on 9 June 2015).
  30. Measures for Supervision and Examination of Transmission and Distribution Pricing Cost (for Trial). Available online: http://www.gov.cn/xinwen/2017-01/04/content_5156506.htm (accessed on 22 December 2016).
  31. Opinions on Comprehensively Deepening the Reform of Price Mechanism. Available online: http://www.gov.cn/xinwen/2017-11/11/content_5238855.htm (accessed on 11 November 2017).
  32. Measures for Pricing Transmission Prices of Regional Power Grids (for Trial Implementation). Available online: https://www.ndrc.gov.cn/xwdt/tzgg/201912/t20191224_1216085.html (accessed on 29 December 2017).
  33. Measures for Supervision and Examination of Transmission and Distribution Pricing Cost. Available online: http://www.gov.cn/xinwen/2019-05/28/content_5395367.htm (accessed on 28 May 2019).
  34. Zhang, L.; Ye, H.; Chen, X. Transmission and Distribution Pricing Method Based on Peak-load Pricing. Autom. Electr. Power Syst. 2017, 41, 92–98. [Google Scholar]
  35. Einhorn, M.A. The Effect of Load Management upon Transmission and Distribution Costs: A Case Study. Energy J. 1988, 9, 73–87. [Google Scholar] [CrossRef]
  36. Electric Power System Reform Plan. Available online: http://www.gov.cn/zhengce/content/2017-09/13/content_5223177.htm (accessed on 10 February 2002).
  37. Electricity Price Reform Plan. Available online: http://www.gov.cn/zhengce/content/2018-04/17/content_5281575.htm (accessed on 3 July 2002).
  38. Uduma, K.; Tomasz, A. Sustainable Energy Development: The Key to a Stable Nigeria. Sustainability 2010, 2, 1558–1570. [Google Scholar] [CrossRef] [Green Version]
  39. Sakdirat, K.; Jessada, S.; Peng, J.Y. Life Cycle Cost, Energy and Carbon Assessments of Beijing-Shanghai High-Speed Railway. Sustainability 2020, 12, 206. [Google Scholar]
  40. Wang, Y.; Wang, X.H.; Wang, S.; Yu, H.Y.; Zhang, F.L.; Li, R.P. Power Grid Operation and Maintenance Cost Allocation Method Based on Power Transmission and Distribution Price Reform. Grid Technol. 2020, 44, 332–339. [Google Scholar]
  41. Xue, Z.; Liu, H.; Zhang, Q.; Wang, J.; Fan, J.; Zhou, X. The Impact Assessment of Campus Buildings Based on a Life Cycle Assessment–Life Cycle Cost Integrated Model. Sustainability 2019, 12, 294. [Google Scholar] [CrossRef] [Green Version]
  42. Zhou, B.Y.; Hu, H.; Dai, L. Assessment of the Development of Time-Sharing Electric Vehicles in Shanghai and Subsidy Implications: A System Dynamics Approach. Sustainability 2020, 12, 345. [Google Scholar] [CrossRef] [Green Version]
  43. Fu, J.J.; Tong, Y.H. Economics of Industrial Technology, 3rd Ed. ed; Tsinghua University Press: Beijing, China, 1996; pp. 100–101. [Google Scholar]
  44. Duan, K.Y. Calculation Model of Comprehensive Plan Balance of Power Grid Enterprises Based on System Dynamics. Ph.D. Thesis, North China Electric Power University, Beijing, China, 2014. [Google Scholar]
  45. Li, J. Research on Cost Control of Power Grid Construction Project Based on Life Cycle. Ph.D. Thesis, North China Electric Power University, Beijing, China, 2015. [Google Scholar]
  46. Wang, L. Research on Investment Decision Support Model of Power Grid Enterprise Based on System Dynamics. Ph.D. Thesis, North China Electric Power University, Beijing, China, 2015. [Google Scholar]
  47. Lu, Y. Research on dynamic management model of power grid project cost based on target control. Ph.D. Thesis, North China Electric Power University, Beijing, China, 2016. [Google Scholar]
  48. Kong, J.T. Evaluation of Distribution Network Investment Effect Based on System Dynamics. Ph.D. Thesis, Beijing Jiaotong University, Beijing, China, 2016. [Google Scholar]
  49. Liu, Y.X. Research on Decision Support System of Power Grid Enterprise Operation Based on System Dynamics. Ph.D. Thesis, North China Electric Power University, Beijing, China, 2016. [Google Scholar]
  50. Xu, X.M. Research on Investment Decision-Making of Complex Power Grid Optimization Based on Power Demand and Investment Capacity. Ph.D. Thesis, North China Electric Power University, Beijing, China, 2017. [Google Scholar]
  51. Zhao, W.B.; Han, Y.; Niu, D.X. Analysis of economic benefit of wind power based on system dynamics. In AIP Conference Proceedings; AIP Publishing LLC.: Long Island, NY, USA, 2018. [Google Scholar]
Figure 1. System dynamics model program for LCC accounting.
Sustainability 12 03297 g001
Figure 2. Power system life cycle causal relationship feedback diagram.
Sustainability 12 03297 g002
Figure 3. Power system life cycle cost calculation model.
Sustainability 12 03297 g003
Figure 4. Initial investment cost module output. (a) Initial investment cost; (b) Change of expenses in initial investment stage; (c) Pre-preparation static cost change rate; (d) Construction static cost change rate.
Sustainability 12 03297 g004
Figure 5. Operation and maintenance (O&M) module output. (a) Operation and maintenance dynamic cost; (b) Cost changes during operation and maintenance; (c) Financial charge; (d) Fixed assets.
Sustainability 12 03297 g005
Figure 6. Decommissioning and disposal (D&D) module output.
Sustainability 12 03297 g006
Figure 7. Changes in LCC and annual life cycle cost (LCCA) (2016–2039) when the discount rate drops from 8% to 6%.
Sustainability 12 03297 g007
Figure 8. Changes in LCC and LCCA (2016–2039) when the discount rate increases from 8% to 10%.
Sustainability 12 03297 g008
Figure 9. Changes in cost of initial investment (CI), operation and maintenance cost (OMC), and decommissioning disposal cost (DDC) (2016–2039) when the discount rate drops from 8% to 6%.
Sustainability 12 03297 g009
Figure 10. Changes in CI, OMC, and DDC (2016–2039) when the discount rate increases from 8% to 10%.
Sustainability 12 03297 g010
Figure 11. Changes in LCC and LCCA (2016–2039) when the fixed residual value rate decreased from 5% to 3%.
Sustainability 12 03297 g011
Figure 12. Changes in LCC and LCCA (2016–2039) when the fixed residual value rate increased from 5% to 7%.
Sustainability 12 03297 g012
Figure 13. Changes in CI, OMC, and DDC (2016–2039) when the fixed residual value rate decreased from 5% to 3%.
Sustainability 12 03297 g013
Figure 14. Changes in CI, OMC, and DDC (2016–2039) when the fixed residual value rate increased from 5% to 7%.
Sustainability 12 03297 g014
Figure 15. Changes in LCC and LCCA (2016–2039) when depreciation period changed from 26 years to 21 years.
Sustainability 12 03297 g015
Figure 16. Changes in LCC and LCCA (2016–2039) when the depreciation period changed from 26 years to 31 years.
Sustainability 12 03297 g016
Figure 17. Changes in CI, OMC, and DDC (2016–2039) when depreciation period changed from 26 to 21 years.
Sustainability 12 03297 g017
Figure 18. Changes in CI, OMC, and DDC (2016–2039) when depreciation period changed from 26 to 31 years.
Sustainability 12 03297 g018
Figure 19. Changes in LCC and LCCA (2016–2039) when accruable fixed assets increased by 20%.
Sustainability 12 03297 g019
Figure 20. Changes in LCC and LCCA (2016–2039) when accruable fixed assets decreased by 20%.
Sustainability 12 03297 g020
Figure 21. Changes in CI, OMC, and DDC (2016–2039) when accruable fixed assets increased by 20%.
Sustainability 12 03297 g021
Figure 22. Changes in CI, OMC, and DDC (2016–2039) when accruable fixed assets decreased by 20%.
Sustainability 12 03297 g022
Table 1. Main transmission and distribution tariff policies in China.
2015Some Opinions on Further Deepening the Reform of the Electric Power System (NDRC of PRC, 2015a, b)
√ The implementation of the transmission and distribution price reform needs to clarify the composition of electricity costs and clarify the interests of all parties.
2015Supervision and Examination Method of Transmission and Distribution Tariff Costs (Trial Implementation) (NDRC of PRC, 2015a, b)
√ The Measures stipulate the principles, composition, and verification methods for the cost supervision and audit of transmission and distribution pricing.
2016Pricing Method of Power Transmission and Distribution Tariff Costs (Trial Implementation) (NDRC of PRC, 2016a, b)
√ The regulatory permitted income is based on strict cost supervision and examination, and the permitted income of the grid enterprise is equal to the permitted cost plus reasonable income.
2017Opinions on Comprehensively Deepening the Reform of the Price Mechanism (NDRC of PRC, 2017)
√ The policy stipulates the principle of regional grid transmission price compliance, the calculation method of permitted income, and the calculation method and adjustment mechanism of transmission price.
2019Supervision and Examination Method of Transmission and Distribution Tariff Costs (NDRC, NEA, 2019)
√ The policy clearly stipulates that it cannot be included in the transmission and distribution cost project, and refines the classification, boundary, and audit method of transmission and distribution pricing costs.
Table 2. Comparison of depreciation expenses before and after electricity reform.
Before the Electricity ReformAfter Electricity Reform
Calculation formulaOriginal value of fixed assets × depreciation rateDepreciable original value of fixed assets for transmission and distribution × pricing depreciation rate
Depreciable fixed assetsAll fixed assetsThe scope of depreciable fixed assets that need to be approved in accordance with the planning and construction of decision-making procedures, including lines, transformer equipment, and other assets related to power transmission and distribution business.
Depreciation lifeCalculated according to the experience of the grid assetsThe depreciation life is determined on 1 January 2015, based on the actual conditions of the local natural environment and the development level of the power grid. The rate of residual value of fixed assets is determined at 5%.
Table 3. Comparison of operation and maintenance cost calculations before and after power reform.
Charge DetailsBefore Electricity ReformAfter Electricity Reform
StockIncrement
Operation and maintenance costsMaterial feeAccording to the actual calculation, it does not consider the relevance to the transmission and distribution business.The original value of the fixed assets at the end of the year before the audit and examination × the average material rate for the three years.Not higher than 1% of the original value of new fixed assets in the forecast year.
Repair feeAccording to the actual calculation, it does not consider whether the relevant asset is a valid asset.The original value of fixed assets at the end of the year before the audit × the average repair rate for three yearsNot higher than 1.5% of the original value of new fixed assets in the forecast year.
Employee’s salaryAccording to employee performance appraisal methods, employees’ salaries and welfare expenses are calculated.In accordance with the Ministry of Enterprise Human Resources.Employee’s salary will fluctuate from the original employee’s salary to labor costs, and the original employee’s salary will be included in the labor costs along with the expenses for agricultural electrical, labor dispatch, and temporary employment. Among them, employee benefits, housing provident funds, employee education funds, and union funds must not exceed 14%, 12%, 2.5%, and 2% of the total wages included in the pricing cost.
Other feeActually countedThe original value of the fixed assets at the end of the year before the audit and audit × the average three-year rate of other expenses.Other fee shall not be higher than 70% of the historical rate level of the three years before the beginning of the supervision period of the grid operation enterprise, and shall not be higher than 2.5% of the original value of new fixed assets during the supervision period.
Table 4. Meanings of variables in Equations (3)–(20).
VariablesMeaningsVariablesMeanings
B R F Basic preparation cost F E I Project insurance
C A I C Construction and installation cost F T E Traffic engineering cost
C C Construction and implementation cost F B E Basic engineering cost
C C D Dynamic cost of construction F A E Construction auxiliary engineering cost
C C S Static cost of construction F B C Building construction cost
C I Initial investment F B R Basic preparation cost
C I P Project construction investment F A Fixed assets
C L F Construction land cost F E P Purchase cost of equipment and tools
D C Dynamic cost F E Equipment fee
I A C Annual cost-rising index F E t Freight and miscellaneous expenses of equipment
I A Intangible assets F S r Reserve for price difference
I E F Installation cost F C M Project construction management fee
F B R Basic preparation cost F S Project supervision cost
F T Bidding fee F E S Equipment supervision cost
F P T T P M Management fee for quota preparation of power transmission and transformation projectPCDDynamic cost of pre-preparation
F S M Management fee for preparation of electric power construction standardsPCSPre-preparation static cost
F S C Feasibility study cost P C Preparation cost
F O E I Installation cost of other equipment R Rate
F S D I Installation cost of substation equipment R C Change rate of construction cost
F T E I Installation of transmission equipment R P C Change rate of pre-preparation cost
F C C E Installation cost of communication and control equipmentPCRChange rate of pre-preparation cost
F L T M Cost of large transport measures r E Freight rate of equipment
F O Other expenses R S r Change rate of reserve for price difference
F C P T S Technical service fee of construction project S A D F Survey and design cost
F S D Survey and design costt1Discount period in the preparatory stage
F D R Design document review feet2Discount period of construction
F P W Pre-project work costyDiscount rate
F M Management expense Y C Year of construction
Y C I Time interval from construction budget preparation level to project year
Table 5. Meanings of variables in Equations (21)–(32).
VariablesMeaningsVariablesMeanings
C I P Project construction investmentOTNumber of major repairs
CPIInterest during constructionPCOwn funds
F O Other chargesQArtificial quantity
F L Labor cost R O M C Growth rate of operation and maintenance costs
F M Maintenance cost R M Maintenance rate
F F Financial charges R L Proportion of working capital loans
F L P Per capita wage R A W G Annual wage growth rate
F A Fixed assetsPCSThe average wage
iInterest rate in construction periodSWGWage growth rate
L A C I Loan amount of construction investmentTTime
LCWorking capital T E C P End year of construction period
LOAOMLong term loan amount in operation period T D M P Duration in multi-pulse
MROverhaul cost t Service life
n Repayment periodt2Discount period of construction
OMCDDynamic cost of pre-preparationt3Discount period of operation and maintenance stage
O M C S Operation and maintenance static costWOAOMWorking capital loan amount
yDiscount rate
Table 6. Meanings of variables in Equations (33)–(36).
VariablesMeaningsVariablesMeanings
D C Demolition cost R S Fixed residual value rate
F O D C Other expenses such as waste disposal R D C Change rate of demolition cost
F R V Residual value of fixed assetst4Discount period of decommissioning and disposal stage
n Useful life of fixed assets t Service life
O F A Original value of fixed assetsyDiscount rate
R Salvage rateDCSStatic demolition cost
DCDDynamic demolition cost
Table 7. Data inputs and sources.
Data NameNumerical ValueData SourcesData NameNumerical ValueData Sources
Feasibility study fee0.1838 million yuanProvisions of the National Development and Reform Commission Interim Provisions on consulting fees for preliminary work of construction projectsBuilding construction cost15.007796 million yuanRelevant report data of a 110 kV power transmission and transformation project of grid company A
Design document evaluation fee0.124 million yuanGuo Guan Fang Di [2006] No. 37 charging standard for preliminary design reviewInstallation fee11.933005 million yuanRelevant report data of a 110 kV power transmission and transformation project of grid company A
Basic reserve rate10%The basic reserve fee rate of the power transmission and transformation projectEquipment fee22.2245 million yuanRelevant report data of a 110 kV power transmission and transformation project of grid company A
Survey and design cost1.978514 million yuanCharging standard for engineering designBasic engineering cost4.525385 million yuanRelevant report data of a 110 kV power transmission and transformation project of grid company A
2016–2017 national average wage growth rate7.3%According to the salary statistics of 2016–2018Traffic engineering cost0.5 million yuanRelevant report data of a 110 kV power transmission and transformation project of grid company A
Management fee for establishment of power construction quota0.1347 million yuanNo more than 0.5%–1.5% of construction and installation workloadConstruction auxiliary engineering cost1.803328 million yuanRelevant report data of a 110 kV power transmission and transformation project of grid company A
Basic cost rate of civilized construction6%China 2004 list fixed rateInstallation cost of other equipment0.3 million yuanRelevant report data of a 110 kV power transmission and transformation project of grid company A
Basic cost rate of safety construction9%China 2004 list fixed rateInstallation cost of substation equipment0.4 million yuanRelevant report data of a 110 kV power transmission and transformation project of grid company A
Basic cost rate of temporary facilities9%China 2004 list fixed rateConstruction site acquisition and cleaning fee0.761689 million yuanRelevant report data of a 110 kV power transmission and transformation project of grid company A
Salvage rate5%Document No. 9 of electricity reformSurvey and design cost1.978514 million yuanRelevant report data of a 110 kV power transmission and transformation project of grid company A
Interest rate during construction7%Relevant report data of a 110 kV power transmission and transformation project of grid company ASupervision fee0.985539 million yuanRelevant report data of a 110 kV power transmission and transformation project of grid company A
Annual cost-rising index5%Relevant report data of a 110 kV power transmission and transformation project of grid company AProduction preparation cost0.01401 million yuanRelevant report data of a 110 kV power transmission and transformation project of grid company A
Note: For the civilized construction basic fee rate, safe construction basic fee rate, and temporary facilities basic fee rate, the construction project is based on the fixed labor cost of the sub-item quantity list item.
Table 8. Results of model validation.
VariablesItems2016 (Million Yuan)2017 (Million Yuan)2018 (Million Yuan)
CIActual values33.724391.4039148.2536
Simulation values33.724388.7224144.199
Relative errors0.0000%−0.030223484−0.028118087

