1. Introduction
In order to ensure rapid and healthy socioeconomic development, the concept of sustainability came into being [
1]. Today, convenient and flexible transportation has greatly promoted the rapid development of the global economy and society, but at the same time, the increase in traffic has also negatively affected sustainability. As the fastest growing industry in transportation [
2], the average annual growth rate of aviation is 5%. While promoting economic development and solving social employment issues [
3], aviation has also caused huge environmental impacts [
4]. As a key point and infrastructure of aviation, airports not only play a role in connecting ground traffic and air traffic [
5] but also serve as interactive hubs for airlines, air traffic service providers, and passengers [
6]. The sustainability of airports and aviation are complementary to each other. Therefore, while continuously exploring aviation development, airports should also enhance their sustainability to meet the development demand of the industry.
At present, implementation activities have been widely carried out worldwide to promote airport sustainability. Federal Aviation Administration (FAA) proposed the noise compatibility program and voluntary airport low emissions program and established the airport improvement program to reduce their environmental impact by providing some airports with renovation funds [
7]. In 2016, nearly 20 airports signed the “Airports Sustainability Declaration” at the Airports Going Green Conference (AGGC) [
8]. In addition, some airports have begun to explore their own sustainable development. San Francisco International Airport (SFO) adopted the economic viability, operational efficiency, natural resource conservation, and social responsibility (EONS) guidelines of Airports Council International (ACI) to develop its sustainability plans and practices and made a five-year plan in 2017 [
9]. Sea-Tac Airport released the Sustainable Airport Master Plan (SAM) [
10]. Heathrow Airport invested 500,000 pounds to reduce environmental impacts such as aviation noise and carbon emissions [
11]. Groningen Airport in the Netherlands launched the Green Sustainable Airport (GSA) Program in Europe in 2010, which aims to improve the airport environment and promote sustainable development of aviation by reducing greenhouse gases, emissions, and noise [
12]. The Kansai airport group has formulated a sustainable development strategy from four aspects, climate change, resource utilization, environmental harmony, and management, to mitigate the environmental impact of the airport [
13]. Hong Kong international airport has also formulated a sustainable development policy and assessed airport sustainability by involving all the participants in aspects of airport operations as stakeholders [
14]. Therefore, it can be seen that global airports have begun to implement sustainable development projects in response to the increasing environmental impact of aviation.
In the exploration of sustainability, technological innovation was considered as the primary plan for achieving sustainable development [
15], and current research mostly focuses on reducing the environmental impact of airports. However, with the increase of air traffic, technological innovation cannot solve a series of problems brought by aviation [
16]. We need to address sustainability from a management perspective. The assessment of sustainability is a prerequisite for effective management [
17]. Only based on the correct evaluation can airport sustainability be guaranteed and improved by taking targeted measures. The evaluation criteria and methods have a key role and significance for sustainability [
18]. Therefore, in order to achieve sustainability of airports and aviation, it is necessary to construct scientific evaluation criteria and methods of airport sustainability.
The evaluation of airport sustainability is a special issue of integrating theory with practice. It is necessary to clarify the existing practical operational problems of airports and understand the relationship between the theory and practice. Some scholars discuss airport sustainability from a certain aspect of daily operation and give some suggestions on practical operation, such as airport energy management [
19], water resource utilization [
20], airport pavement materials [
21], and the development of commercial aspects of airports [
22], and so on. Although these studies are easy to carry out, they lack structure and integrity. However, there are relatively few assessment studies specifically for airport sustainability, and some related studies include the following. Milan Janic involved the airport when assessing the sustainability of the air transport system [
23]. Vincenzo Fasone pointed out two goals in airport system management; one is the airport’s financial sustainability, and the other is that infrastructure investment and maintenance of the airport can meet the transportation needs [
24]. Kılkıs used the Sustainability Ranking of Airports (SRA) Index to evaluate airport sustainability, including five dimensions and 25 evaluation indicators [
25]. Postorino et al. proposed a common framework from the four dimensions of economy, society, environment, and operation to reduce the environmental impact of airports and promote aviation sustainability [
26]. Ming-Tsang Lu established an evaluation method of airport sustainability with a balanced scorecard model [
27]. Monsalud quantified airport sustainability with the impact matrices and analyzed effective sustainability practices at U.S. airports [
28]. Laya Olfata used a fuzzy dynamic network to evaluate the operational efficiency of airport systems and determine the level of sustainability [
29]. The United Kingdom Airport Commission proposed an evaluation framework based on Multi-Criteria Analysis (MCA) in 2014 to assess the environmental and social impacts of airports [
30]. The current related research mainly focused on the development of aviation, airport operational practices, airport development decisions, and airport green development. There are not many studies on airport sustainability, and the comprehensive assessment of airport sustainability generally adopts the methods of constructing indicator systems and models. Airport sustainability (AS) is not a constant value, and it changes with socioeconomic development. We should pay attention to its dynamic changes to explore the development potential of airports. On the basis of existing research achievements, this paper takes into account an airport’s operational needs in the definition of airport sustainability by combining the development characteristics of the airport and uses comprehensive indicators to evaluate AS dynamically. This method can enrich the evaluation content and methods of airport sustainability and provide more possibilities for AS’s extended research, such as prediction and improvement.
In order to evaluate airport sustainability more scientifically, this paper gives the definition of airport sustainability based on the connotation of sustainable development and airport operational characteristics. It adopts a combination of indicator system and comprehensive index and uses the flexibility and optimism of the benefit of the doubt (BoD) model to reflect the changing process of airport sustainability. The evaluation process can fully reflect the relationship between the practice and theory of the airport. This paper is organized as follows:
Section 2 gives the definition, dimensions, and evaluation framework of airport sustainability.
Section 3 proposes the evaluation method of the synthetic airport sustainability index based on the BoD model, including index model, weight calculation, and indicator processing. The results and discussions of the Guangzhou Baiyun International Airport (CAN) case study are analyzed in
Section 4, and
Section 5 is the conclusion.
4. Numerical Case Study
This paper selects Guangzhou Baiyun International Airport (CAN) as a case study. CAN is the third largest hub airport in China, and it is an important link for sustainable development in Guangzhou, the Pearl River Delta region, and the country. Taking the development situation of the past 10 years (2008–2017) as a data resource, the above-mentioned AS evaluation methods and procedures are used to evaluate and analyze AS of CAN.
4.1. Data Resource
This paper gathers data of statistical AS indicators of CAN and calculates the other indicators through analysis and models. The statistical data sources are from the annual report of the airport [
49], the airport service evaluation report issued by the Civil Aviation Passenger Service Evaluation [
50,
51], the Civil Aviation Administration website, and the flight operation efficiency report [
52]. The calculation models include The AMS/EPA (American Meteorological Society/Environmental Protection Agency) Regulatory Model (AERMOD) model, which is used to calculate the concentration of pollutants around the airport; ICAO DOC 9911, which is used to calculate noise distribution around the airport; and the input-output model, which is used to calculate direct and indirect economic benefits.
4.2. Indicator
4.2.1. Indicators Processing
In order to make the indicators have the same magnitude, the value of indicators was normalized. The 54 normalized indicators of CAN from 2008 to 2017 are shown in
Figure 2.
Then, the indicators of each dimension needed to be screened. Firstly, the Spearman and Kendall correlation coefficient matrices of each indicator were constructed, and the confidence level of independence indicator was set to 5%. Secondly, the non-parametric Bayesian discrimination was performed for the two indicator screening schemes, and then the independent indicator screening scheme was selected according to the discrimination accuracy. Thirdly, CGVM, PCA, and FCFA were used to screen representative indicators, and non-parametric shells were used for each indicator screening method. Finally, the representative indicator screening scheme was selected according to the non-parametric Bayesian discrimination accuracy. The non-parametric Bayesian discriminant accuracy of different indicator screening methods for each dimension is shown in
Table 3.
The selected screening scheme was as follows. Spearman and PCA were used to select seven indicators for independence and representativeness of the economic dimension, respectively. Kendall and PCA were used to select six indicators for independence and representativeness of the environmental dimension, respectively. Kendall and FCFA were used to select four indicators for independence and representativeness of the social dimension, respectively. Kendall and FCFA were used to select eight indicators for independence and representativeness of the operational dimension, respectively. These 25 indicators constitute the AS evaluation indicator system of CAN, as shown in
Table 4.
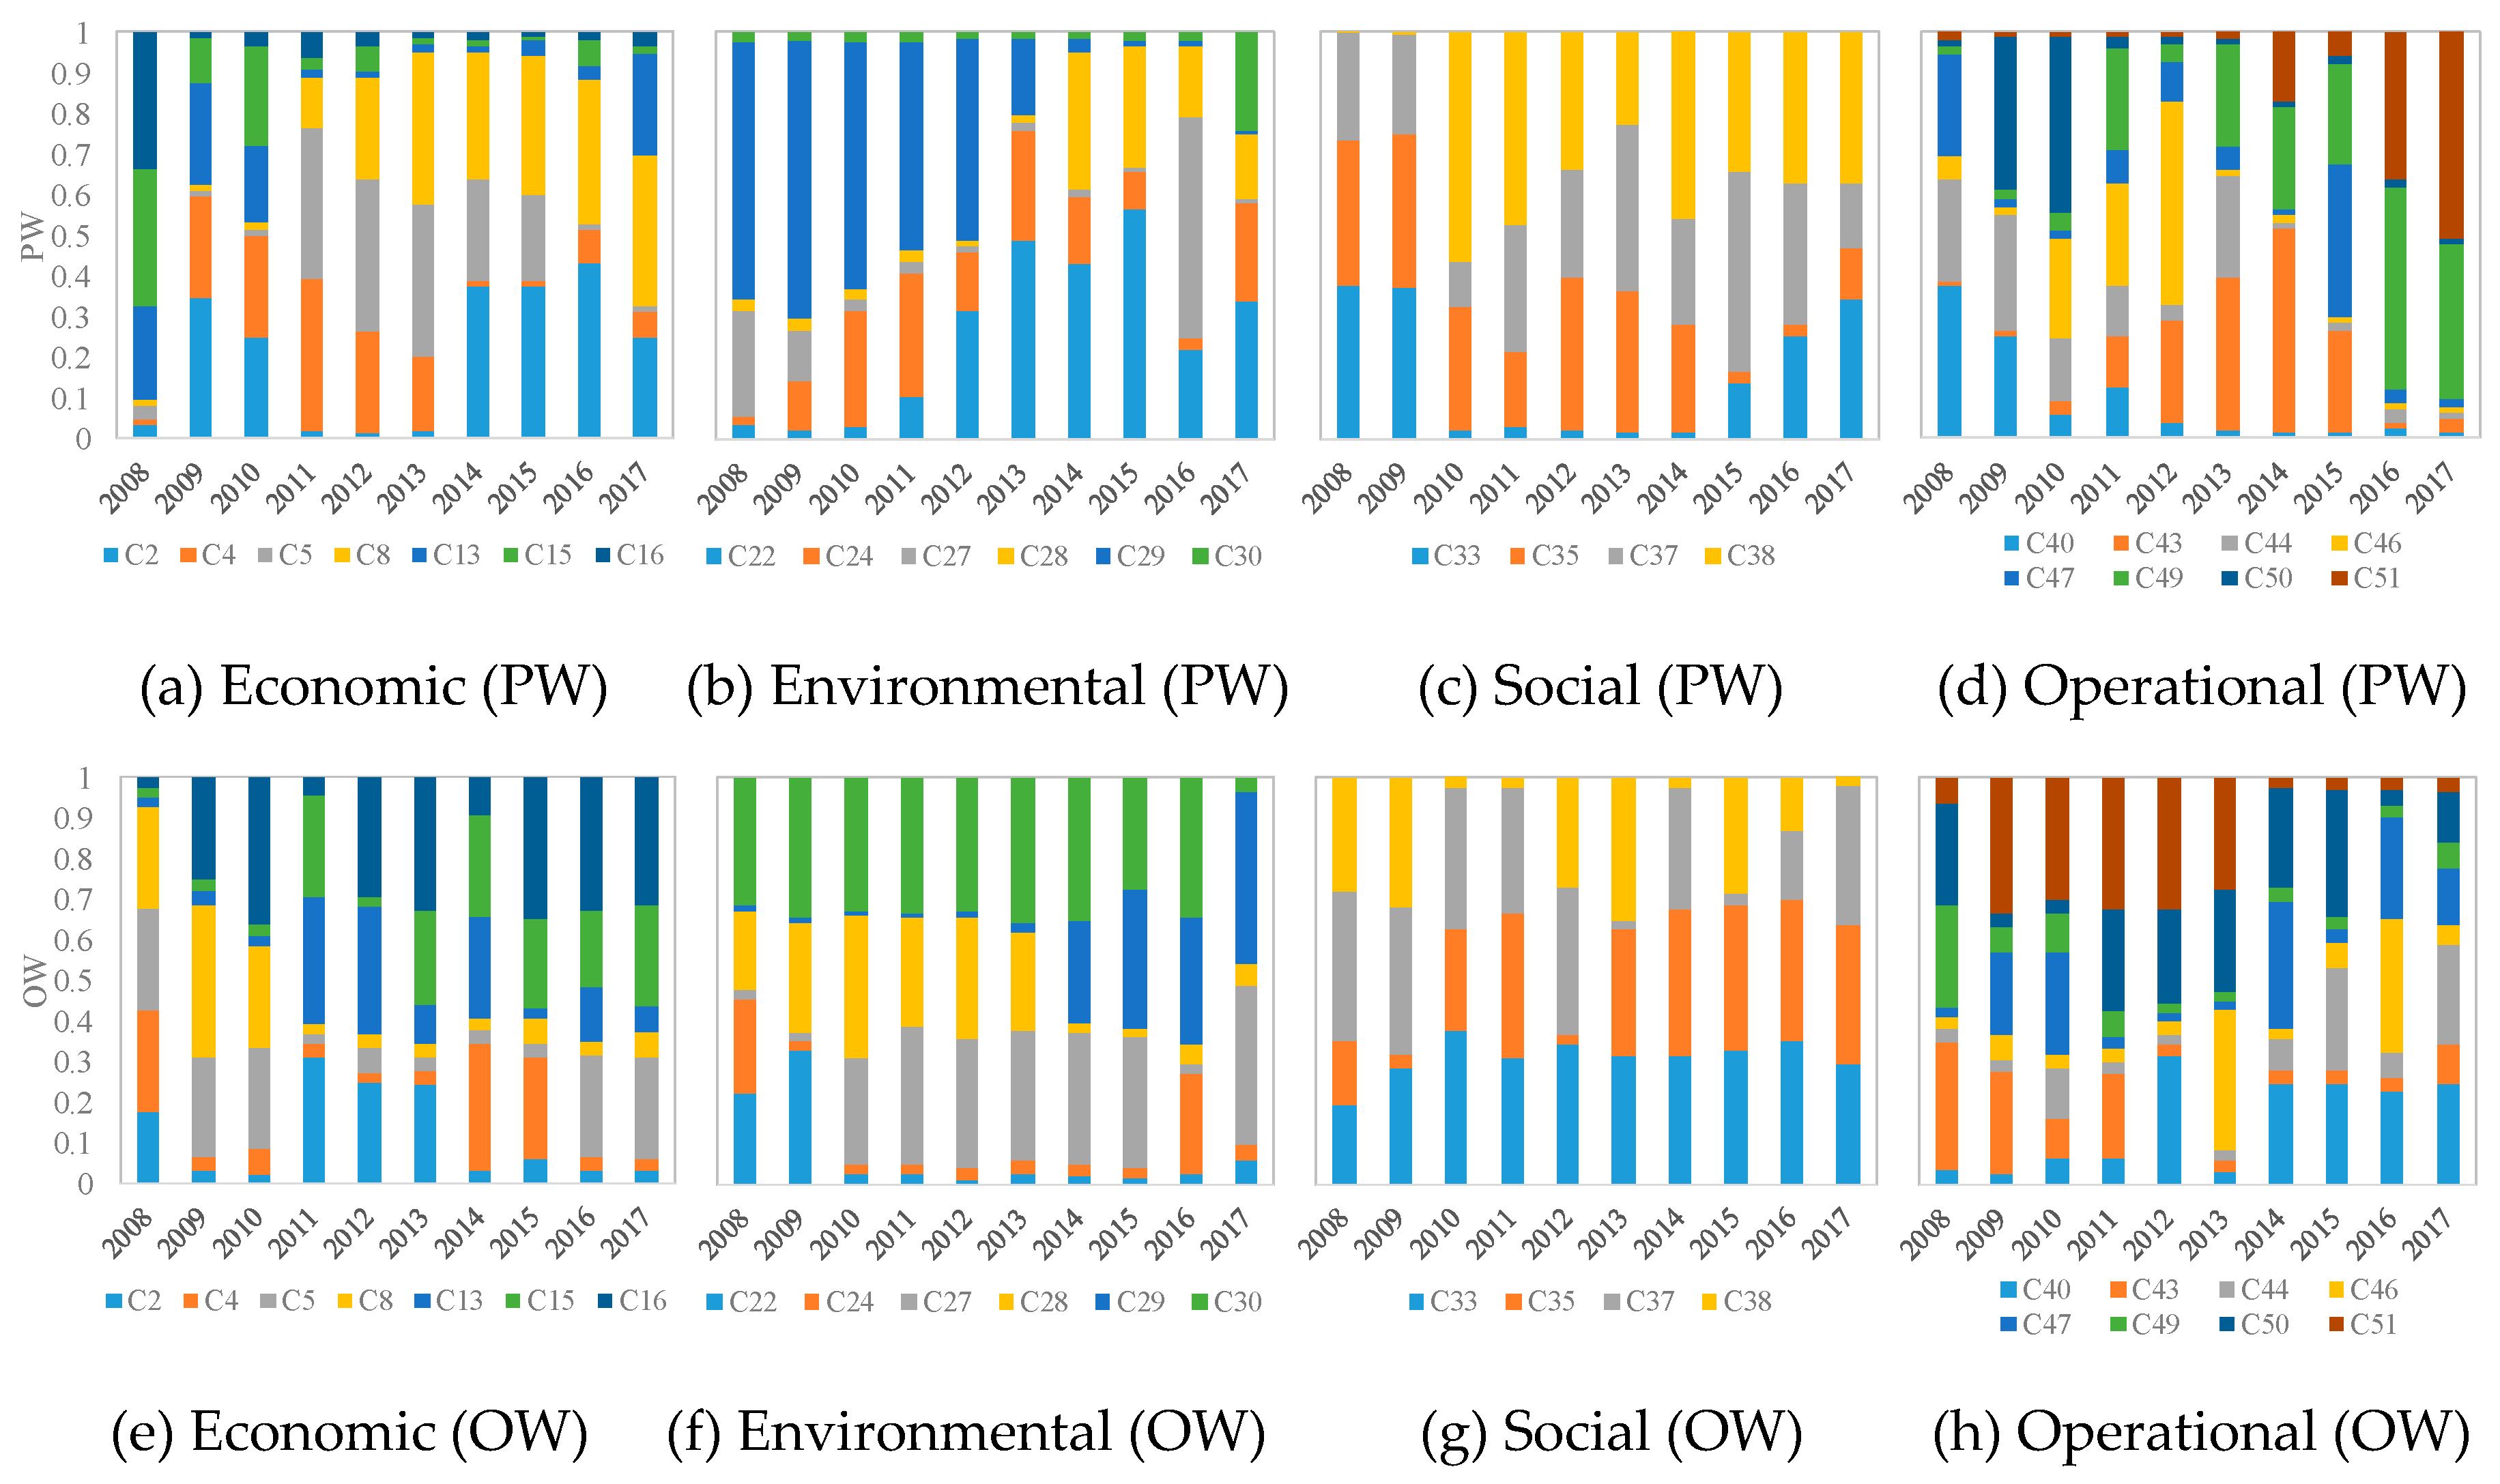
4.2.2. Indicator Weighting
The BoD model in
Section 3.3 was used to determine the pessimistic indicator weight (PW) and optimistic indicator weight (OW) for each indicator. The results are shown in
Figure 3.
4.2.3. Determination of Standard Value
The standard value of the indicator usually takes the maximum value, which is the 100th percentile of the sample, but this determination method of the standard value has not been tested and verified. This paper determines the reasonable percentile value of the evaluation indicator by analyzing the standard deviation of the synthetic ASI under each percentile.
It can be seen from
Table 5 that the deviation of the economic, environmental, and operational ASI is minimal at median (50th percentile), and the deviation of the social ASI is minimal at the 60th percentile, but the difference from the median is only 0.002. Therefore, in order to unify the calculation method, this paper uses the median as the standard value to calculate the economic, environmental, social, and operational ASI, and d is set as equal to 50% in Formula (3).
4.3. ASI
According to the normalized indicator value, indicator weight, and standard value, we used Formula (2) to calculate the economic, environmental, social, and operational ASI of CAN from 2008 to 2017. The comparison of each ASI and nominalized indicator is shown in
Figure 4.
In the economic dimension, C13, C15, and C16 are negative indicators and continue to grow while the remaining positive indicators fluctuate. These indicators eventually lead to a downward trend in the economic ASI. The environmental dimensional indicators are all negative indicators except C28, and the normalized value decreases with the increase of indicator value. In recent years, the environmental impact of the airport has become heavier, which is in line with the downward trend in the environmental ASI. The evaluation indicators in the social and operational dimensions fluctuate up and down; therefore, the social and operational ASI does not show a continuous upward and downward trend, and it is also a volatile change.
According to Formula (9), the pessimistic weight and optimistic weight of each dimension and ASI are shown in
Table 6.
If other determination methods of the indicator system weight are adopted, such as the entropy weight method (EWM) and principal component analysis method (PCA), the corresponding ASI evaluation results are shown in
Table 7.
Comparing the EWM, PCA, and BoD, the standard deviation of the PCA result is 0.6, which is obviously higher than 0.25 of EWM and 0.16 of BoD. In addition, the variation coefficient of the EWM’s weight distribution is 0.379, but PW and OW of BoD are 1.006 and 0.847, which are significantly better than EWM. The BoD model can flexibly adjust the weight coefficient according to the actual airport data collected, which can better reflect the dynamic development process of the airport and the characteristics of sustainable development of the airport. The comprehensive evaluation results of the ASI change smoothly, which is consistent with the long-term stability of the airport’s sustainable development strategy.
The ASI of CAN has a downward trend during 2008–2017, as shown in
Figure 5, and it is a wave-like decline. By analyzing the variety of the ASI in each dimension, the change of ASI is mainly due to the economic and environmental ASI of CAN showing a downward trend in this decade. In terms of the economic ASI, the C2 indicator performed poorly among all indicators. The performance of C2 from 2013 to 2017 is worse than that from 2008 to 2012, indicating that CAN needs to pay attention to the development of its non-aeronautical business to promote economic sustainability. In addition to the C29 indicator showing an upward trend, other environmental indicators are showing a downward trend, indicating that CAN has to manage its pollutant emissions. The social and operational ASI undulate, and there is no continuous growth in all dimensions of the AS, which has caused the ASI of CAN to fluctuate up and down without forming stable growth momentum. In terms of social ASI, the performance of the C38 indicator fluctuated greatly, so C38 needs to be emphasized. When it comes to the operational ASI, the overall performance of each indicator fluctuated greatly, and there was no obvious development trend. Among them, the indicators that need to be paid attention to are C49 and C50, which have declined since 2014. This paper evaluates CAN’s ASI from four dimensions and comprehensively considers the operational characteristics of CAN and the impact caused by economic development. According to the law of change, if the economic and environmental ASI is strengthened, it can promote the ASI of CAN.
4.4. Discussion
Promoting AS has become a key issue that attracts much attention. Taking the development of the transportation industry as a reference, this paper analyzes the impact of external factors on AS from the four aspects of the sustainable development needs, the development background of civil aviation, the economic environment, and competitiveness [
53]. The main influencing factors are shown in
Table 8.
For the extraction methods of important influencing factors, there are currently parallel genetic algorithms and random stepwise integration, bagging, etc. Due to the small sample size and large number of dimensions, this study used the parallel genetic algorithm (PGA) to analyze the influencing factors. The parallel genetic algorithm (PGA) was used to analyze the relationship between the actual data from 2008 to 2017 and the AS. The impact of various influencing factors on the AS is shown in
Figure 6.
The size of the circle in
Figure 6 indicates the degree of impact. It can be seen that F1 and F4 are the two most influential factors, indicating that the sustainability demand of Guangzhou and the national development background of civil aviation in the past decade have a relatively large impact on the ASI. The reason that F1 hinders the development of the airport may be that CAN has not yet effectively utilized the economic benefits brought by the increased passenger volume, and the increased passenger volume has a worse impact on the airport environment; therefore, the ASI failed to grow with F1.
F4 promotes the development of the airport, while F6 does not have a significant impact on the ASI, which indicates that CAN has more mileage on extra-provincial routes, and the extra-provincial route mileage has a greater impact on the ASI of CAN.
In this paper, the linear regression model method is used to analyze the influence mechanism of the airport’s sustainable development ability based on the obtained airport sustainable development comprehensive index and influencing factors. The Tobit regression is one of the linear regression models. It is mainly used to explore the relationship between unobservable variables and observable independent variables. Because the airport sustainable development index has upper and lower limits, the Tobit regression is more suitable for regression analysis of such independent variables. Tobit regression was performed on ASI and two influencing factors using Stata 16.0 software. The regression results are shown in
Table 9.
The regression model of ASI can be expressed as:
This regression model is based on the relationship between historical ASI and influencing factors. After extracting important influencing factors through PGA, it can be seen from
Table 9 that F4 promotes the development of the airport, while the impact of F1 is the opposite. It shows that CAN could use the development of the civil aviation industry in China effectively and strive to take advantage of policy advantages to transform F4 into a favorable factor for ASI. However, at the same time, it will bring a more serious impact on the airport environment; the more use of F1 means a greater number of people affected by the environment, which will restrict airport sustainability.
The ASI can be a predicted value as long as F1 and F4 are known.
Figure 7 is a comparison chart between the calculated value of the comprehensive indicator evaluation method (ASI) and the calculated value of the regression model (ASI_Tobit). It can be seen in the figure that the change trend of ASI_Tobit and the ASI is consistent, which is a volatile decline, and ASI_Tobit shows a continuous downward trend after 2014. According to the regression function, the ASI of 2018 is 0.915. That is, if CAN is in accordance with the current mode of operation and development, the ASI may continue to decline in the short term.


