1. Introduction
The highway mileage of China ranks first in the world. However, the highways bear a huge traffic demand caused by 250 million cars [
1]. What is worse, many national or provincial main roads built in the 1980s–1990s have difficulty meeting the current demand and need to be reconstructed or expanded. Given a limited amount of land, many cities choose to utilize the hard shoulder and expand highways into a quasi-six-lane or a quasi-eight-lane road, as shown in
Figure 1. In Henan Province, nearly one third of the highways have been reconstructed in this way [
2]. In order to meet the needs of temporary parking, emergency parking bays are constructed. Compared with a traditional parking belt, the parking bay saves space and improves the utilization rate of road resources. For example, if a parking bay that is 70 m long and 3.75 m wide is set in the expressway every 500 m, there will be about 1687.5m
2 of space saved per thousand meters. However, at the same time, they may impact the mainline.
Parking bays may not be common worldwide but they have been widely and gradually used in China. However, there is little related research on their impact. Liu et al. studied the effectiveness of emergency parking areas on highways and declared that parking bays could make parking safer [
3]. Cui et al. analyzed the influences of spacing of the emergency parking bays on driving behaviors and proposed a recommended spacing setting level [
4]. Liu analyzed the feasibility of widening the Q-Y Highway from the perspective of placing parking bays [
5]. Quantitative research on the possible impacts caused by parking bays has not yet been carried out.
In addition, there are no standards defining clear and unified specifications for the design of parking bays. The existing specifications are mainly for traditional parking belts. The Technical Standard of Highway Engineering (JTG-B01-2014) in China [
6] and the Highway Safety Design and Operations Guide in the USA [
7] both ask for the placement of a parking belt if the width of the hard shoulder is less than 2.5 m. In China, different versions of the Design Specification for Highway Alignment suggest different design parameters. In JTJ-011-1994, the recommended length of the bay taper is 20 m and the effective length of the parking area should be longer than 30 m [
8]. In JTG-D20-2006, a 100–150 m bay taper length and minimum parking length of 50 m are required [
9]. In JTG-D20-2017, these two indexes become 70 m and 40 m [
10]. As we can see, the related parameters vary among different standards and there is no quantitative study proving which one is correct. The current design of parking bays is mainly based on experience.
Emergency parking bays on expressways are similar to bus bays in terms of design. However, there is more research focused on the design of bus bays and their impact on traffic capacity. Dejeammes et al. optimized a bus stop guidance system through the study of the capacity of the linear bus stops and bus bays [
11]. A study on the entrance and exit angles of bus bays conducted by Nakamura et al. introduced an advanced design applicable to urban streets [
12]. Yang’s research showed that different kinds of bus stops, including linear bus stops and bus bays with or without overflow, have different effects on the mainline, and suggests the capacity range for each design [
13]. The delay model of vehicles in bus bays proposed by Chen showed a dramatic increase in bus departure times when the section flow is large [
14].
Based on the above, studies on parking bays are insufficient. With increasing traffic demand, there is no doubt that parking bays could be used widely on expressways in the future, not only in China but worldwide. There is a pressing need to carry out research on the quantitative impact of design indexes and the applicable conditions for parking bays, so that the design of parking bays is standardized, safe and reliable.
2. Analysis of Influencing Factors on Vehicles Entering and Leaving Parking Bays
Usually, emergency parking bays can be classified into a direct type or a parallel type. In this paper, we focus on the simplest direct type of parking bay, which is the most economical and space saving. As shown in
Figure 2, an emergency parking bay is composed of the deceleration area, the parking area and the acceleration area. The deceleration area ranges from the position where vehicles start decelerating on the mainline to the end of the entrance taper. The parking area is a lane parallel to the mainline. The acceleration area ranges from the exit taper to the position of vehicles stopping their acceleration on the mainline.
Vehicles requiring temporary parking will slow down on the mainline in advance and drive into the far-right lane. Different vehicles begin to slow down from different positions, and thus the starting point of the deceleration area is uncertain. After parking, vehicles drive into the mainline and keep accelerating until they reach the desired speed. Similarly, the end of the acceleration area is also uncertain. During deceleration and acceleration, the velocity difference between the vehicle requiring parking and the others running on the mainline may cause unsafe maneuvers, such as unexpected lane changing, deceleration, or even emergency braking of the vehicles following behind. The influencing factors which can be observed directly are as follows.
(a) Traffic volume is one of the key factors. With low traffic volume, the following distance will usually be longer. This reduces the probability of traffic accidents caused by vehicles entering or leaving parking bays. On the contrary, with increasing traffic volume, traffic accidents will also change accordingly.
(b) Traveling speed is another important factor. The faster the mainline vehicle, the greater the velocity difference between the parking vehicle and others. At the same time, a longer deceleration and acceleration length is also required. Both factors will raise the accident rate.
(c) Acceleration and deceleration lengths differ across vehicles and depend on many factors such as speed, weight and tire texture of the vehicle. For example, at the same speed, heavier vehicles may require a longer deceleration length due to greater inertia. Therefore, it is difficult to decide on the optimized length of the bay taper. Usually, a longer bay taper is preferred. However, a longer bay taper means more mainline space is occupied, and more resources and cost are needed. Hence, we need to find a balance between utility and cost.
Generally, the designed speed of expressways is relatively unified at about 100–120 km/h and the actual traveling speed is mainly affected by traffic volume. The controllable part of the deceleration area or acceleration area is the length of the bay tapers. Therefore, this paper chooses hourly traffic volume and the length of the bay tapers as the two main concerns.
3. Research Method
Because transportation systems are complex, it is difficult for us to obtain the quantitative impact through a mathematical model or equation. Nevertheless, as long as there are enough experiments, a relatively accurate result can be got based on the Monte Carlo method. We chose a microscopic simulation software, VISSIM, to complete adequate simulation experiments.
Figure 3 describes the research method of this study. After analyzing influencing factors, a basic simulation scenario was established in VISSIM according to engineering experience and actual operations of the Hangzhou-Ningbo Expressway. After that, the simulation results were compared with the actual values from monitoring video to validate or adjust the simulation model. Once validated, control experiments were setup to get statistical results and then, conclusions were drawn.
4. Simulation and Verification
4.1. Set Simulation Parameters
4.1.1. Road Parameters
As mentioned before, there are many highways in China expanded into quasi-six-lane roads or, more commonly, quasi-eight-lane roads, which are also more complex. Therefore, this paper took quasi-eight-lane roads as the research object for the following analysis.
Hangzhou-Ningbo Expressway is the first expressway built in Zhejiang Province, which is a developed area in southeast China. The expressway was opened in 1996 and completed expansion from six lanes to quasi eight lanes in 2007. For quasi-eight-lane roads, the Hangzhou-Ningbo Expressway is a representative one. Both its road and traffic conditions meet the requirements of related specifications, and its setting parameters of emergency parking bays are commonly adopted in engineering. Therefore, the road parameters of the Hangzhou-Ningbo Expressway were taken as a reference for simulation experiments in this paper.
As shown in
Figure 4, the expressway had four lanes in one direction, with the widths of 3.5 m, 3.75 m, 3.75 m, 3.75 m from inside to outside. The emergency parking bay was placed in the middle of the mainline, which was a 900 m of straight line. The parking bay was designed as 3.75-m-wide and 70-m-long, including a 30 m parking section and two 20 m bay tapers.
4.1.2. Vehicle Inputs
Through monitoring video, we estimated the traffic flow for each lane and the proportion of each vehicle type in the peak hour. Vehicle inputs are referred to
Table 1.
4.1.3. Desired Speed Distributions
According to the Specifications for Highway Safety Audit (JTG B05-2015) in China [
15],
Table 2 gives the recommended values of the desired speed for different vehicle types.
In addition, research showed that [
16], on the section whose designed speed is 100 km/h or above, for cars, the highest traveling speed is 10 km/h higher than the designed speed, and the desired speed for an aggressive driver is about 5 km/h higher than the traveling speed, while a conservative driver may take the lowest desired speed, which is 5 km/h lower than the designed speed. For buses and trucks, the lowest traveling speed is 10 km/h lower than the desired speed, and the desired speed for an aggressive driver is about 5 km/h higher.
The designed speed of the Hangzhou-Ningbo Expressway is 120 km/h. Consequently, in VISSIM, the speed range of cars was set as 115–135 km/h, and 70–85 km/h for buses and trucks. Furthermore, we assumed that the desired speed distribution was approximately an S-shaped curve centered at 120 km/h for cars and 80 km/h for buses and trucks. The specific distribution of desired speed in VISSIM is shown in
Figure 5.
4.1.4. Driving Behaviors
The Wiedemann 99 model was selected as the basis of the car following model in VISSIM. To avoid deadlocks caused by late lane changes, parking routings would only happen in the fourth lane in simulations. In fact, it’s true that vehicles with parking demand will drive into the far-right lane in advance.
4.1.5. Attribute Outputs
The total period of each experiment was 3600 simulation seconds, and attributes of all vehicles in the entire simulation were recorded and output every 0.1 simulation seconds, including simulation time, car number, lane number, position, lane changes, speed, acceleration, delay time, queue time and so on.
4.2. Verification
In this paper, the moment when the front bumper of a vehicle entered the entrance taper was considered as the entering moment (as shown in
Figure 6), and the speed of this moment was the entering speed.
Based on video image processing, the entering speed of buses and trucks ranged around 30–40 km/h. Because of greater flexibility, the entering speed of cars was higher, around 50 km/h.
According to the simulation results, average entering speed was about 37 km/h for buses and trucks and 48 km/h for cars, which agreed well with the results of video processing. Hence, the simulation model could be considered as the correct reflection of traffic operations.
5. Results and Discussion
5.1. Control Experiments
According to the Technical Standard of Highway Engineering (JTG B01-2014) in China [
6], the maximum service volume of expressways is 2200 pcu/(h·ln) for 120 km/h designed speed, which means the traffic volume shall not exceed 8800 pcu/h for four lanes. At the same time, the value is no more than 7000 veh/h based on the proportion of vehicle types in
Table 1.
Therefore, two key arguments of control experiments consisted of seven hourly volumes, from 1000 veh/h to 7000 veh/h at 1000 veh/h intervals, and five lengths, from 10 m to 50 m at 10 m intervals.
5.2. Results Analysis
With different volume inputs, the number of vehicles passing through varied. As the volume increased, the traveling speed of the mainline was lower, which can be clearly seen in
Table 3.
5.2.1. Impacts on the First Vehicle behind in the Same Lane
In each simulation experiment lasting for 3600 s, the number of vehicles entering and exiting the parking bay varied from 60 to 100 under different conditions.
Table 4 shows some statistics of the first following vehicle when a parking vehicle started decelerating. The statistics includes average delay time, the distribution of deceleration, and the probability of lane changes.
Table 5 shows the performance of the first following vehicle when a parking vehicle entered the exit taper.
As the hourly volume increased, the deceleration or acceleration of a parking vehicle had a more significant impact on the first following vehicle, regarding a longer delay time and more braking (except 7000 veh/h). There was no apparent regular pattern in lane changes. Although with reducing following distance, a vehicle behind was more likely to choose to change lane, the opportunity for lane changes was less due to the higher volume on the mainline. When the volume was within 7000 veh/h, impacts were relieved with an increase the bay taper length. However, the relief was very little. One possibility was that the increment of the bay taper was little compared to a total deceleration or acceleration area (usually about 150–200 m). In fact, a small change in bay tapers is hard to be detected by drivers, and they will take actions as usual. In some situations, the distribution of deceleration and the probability of lane changes even stayed the same, which may be due to the pseudo-random method used in VISSIM.
Another finding was that the delay time caused by a deceleration before parking was less than that caused by an acceleration after parking when the volume was less than 3000 veh/h.
5.2.2. Impacts on Waiting Time When Merged into Mainline
After parking, the average waiting time for merging into the mainline is shown in
Table 6. As the hourly volume increased, following distance became shorter. As a consequence, the probability of a safe merging was reduced, which led to a longer waiting time. On the other hand, as the exit taper length increased, the waiting time trended to be shortened. The influence caused by the bay taper became more prominent with a larger volume. Because the increasing volume slowed down the traveling speed of the mainline, vehicles just needed a shorter acceleration area to catch up with the mainline. Through a longer exit taper, speed difference between a parking vehicle and the mainline could be reduced more easily. Due to the difference in acceleration performance and length, heavy vehicles (including buses and trucks) needed to wait for a longer time to get a suitable inserted gap.
5.2.3. Impacts on the Mainline
As shown in
Figure 7, the area from the beginning of the road section (B1 and B2) to the position where vehicles entered or left the parking bay (A1 and A2) was considered as an affected area. All vehicles in the affected area were considered as affected objects. This study took the maximum deceleration and delay time of each affected object as the safety and efficiency impact indexes during entering or leaving. For the safety impact, where a behind vehicle on the mainline took the maximum deceleration was regarded as its affected position. For the efficiency impact, where a behind vehicle reached when a parking vehicle entered the entrance taper or the exit taper was regarded as its affected position. The maximum deceleration or the delay time was assigned to the corresponding position. In simulations, every 10 m of each lane was considered a counted area, and a section of 380 m was taken for the study. The impact indexes of each experiment were recorded, counted and stacked. As long as there were enough experiments, we could get the final results (shown in
Figure 8,
Figure 9,
Figure 10 and
Figure 11).
From
Figure 8 and
Figure 9, we can see that the safety impact on the mainline when vehicles entered the parking bay had a similar pattern as they left. The impact trended to spread from a parking vehicle, like the ripples caused by a stone falling into the water. When the volume exceeded 6000 veh/h, the distribution of the impact on the mainline didn’t have an obvious characteristic. In order to make figures clearer and more understandable, only the results of 1000–5000 veh/h was drawn. When the volume was less than 6000 veh/h, the impact was propagated from A1 or A2 to B1 or B2, and gradually weakened during propagation. The impact almost disappeared after a propagation about 180 m. Besides, the impact increased from the lane closest the median divider to the one farthest. Impacts on the fourth lane were directly caused by vehicles demanding parking. Impacts on the third lane was caused by the behind vehicles slowing down and merging to the third lane from the fourth. Thus, as a chain reaction impacts finally spread to the first lane. With increasing hourly volume, the affected area expanded, and the influence became more obvious. When the volume exceeded a certain limit, following distance on the mainline was insufficient, which also brought many decelerations. In this case, the distribution of the impact was not so obvious. On the other hand, with a longer bay taper, the affected area was improved a little.
Usually, a deceleration of more than −2.5 m/s
2 is considered as an uncomfortable or even unsafe braking [
17]. Focusing on the probability of vehicles with more than −2.5 m/s
2 deceleration, we can draw some conclusions from
Table 7. With a longer bay taper, the safety impact tended to be reduced in the process of entering the parking bay, while it was improved firstly and then exacerbated in the process of leaving the parking bay. Once the volume exceeded 7000 veh/h, the impact became random. As we can see, the change caused by the bay taper was very little; the main change was brought by the increase of hourly volume.
From
Figure 10 and
Figure 11, we can see that when vehicles entered the parking bay, the efficiency impact on the mainline had a similar pattern as the safety impact. However, it was quite different in the leaving process. Due to safety concerns, there must be a safe gap when a vehicle decided to leave the bay. In other words, there must be no vehicle within a certain distance behind the exit position. As a result, most of vehicles being counted were in the middle or the latter section, so as seen in
Figure 11, the impact on the middle and latter mainline was greater.
Focusing on the average delay of the following vehicles in the mainline, some findings are shown in
Table 8. The average delay was moderately affected by the length of the bay taper. When vehicles entered the parking bay, the delay time remained stable with increasing the bay taper length. However, the delay time decreased somehow then increased while the length of the bay taper increased. Once the volume exceeded 7000 veh/h, the pattern became random.
From the discussion above, we can see that the longest bay taper may not be the best solution. For the simplest direct type of parking bay, the length of bay tapers recommended in the Design Specification for High way Alignment (JTG-D20-2017) could be too long, causing unnecessary waste of space. he 20–30 m bay taper widely adopted in current designs is proven to be a scientific choice according to the experiment results. It can maintain a good performance with various traffic volumes.
5.3. Applicable Traffic Volume
It could be seen from the simulation results that when vehicles entered or left the parking bay the influence on the mainline was exacerbated with increasing traffic volume. In order to find out the maximum volume suitable for the placement of emergency parking bays, the following comparison and analysis were carried out.
To make analysis more representative, every volume input was converted to a lane occupancy. Here we took the occupancy of the road space as lane occupancy, calculated by Equation (1) [
18] below:
where,
O = Lane occupancy.
L = Average length of vehicles (m).
K = Traffic density (veh/km).
Comprehensively considering the processes of entering and leaving, two impact indexes (delay index and deceleration index) were calculated. The average delay of the behind vehicles on the mainline during the processes of entering and leaving was taken as the delay index, and the probability of vehicles with more than −2.5 m/s2 deceleration was taken as the deceleration index.
We took the parking bay with a 20 m bay taper, which is the most widely adopted, as an example for analysis. Through simulation records, we got the average length of vehicles and the traffic density of each condition. Then lane occupancy could be obtained and shown in
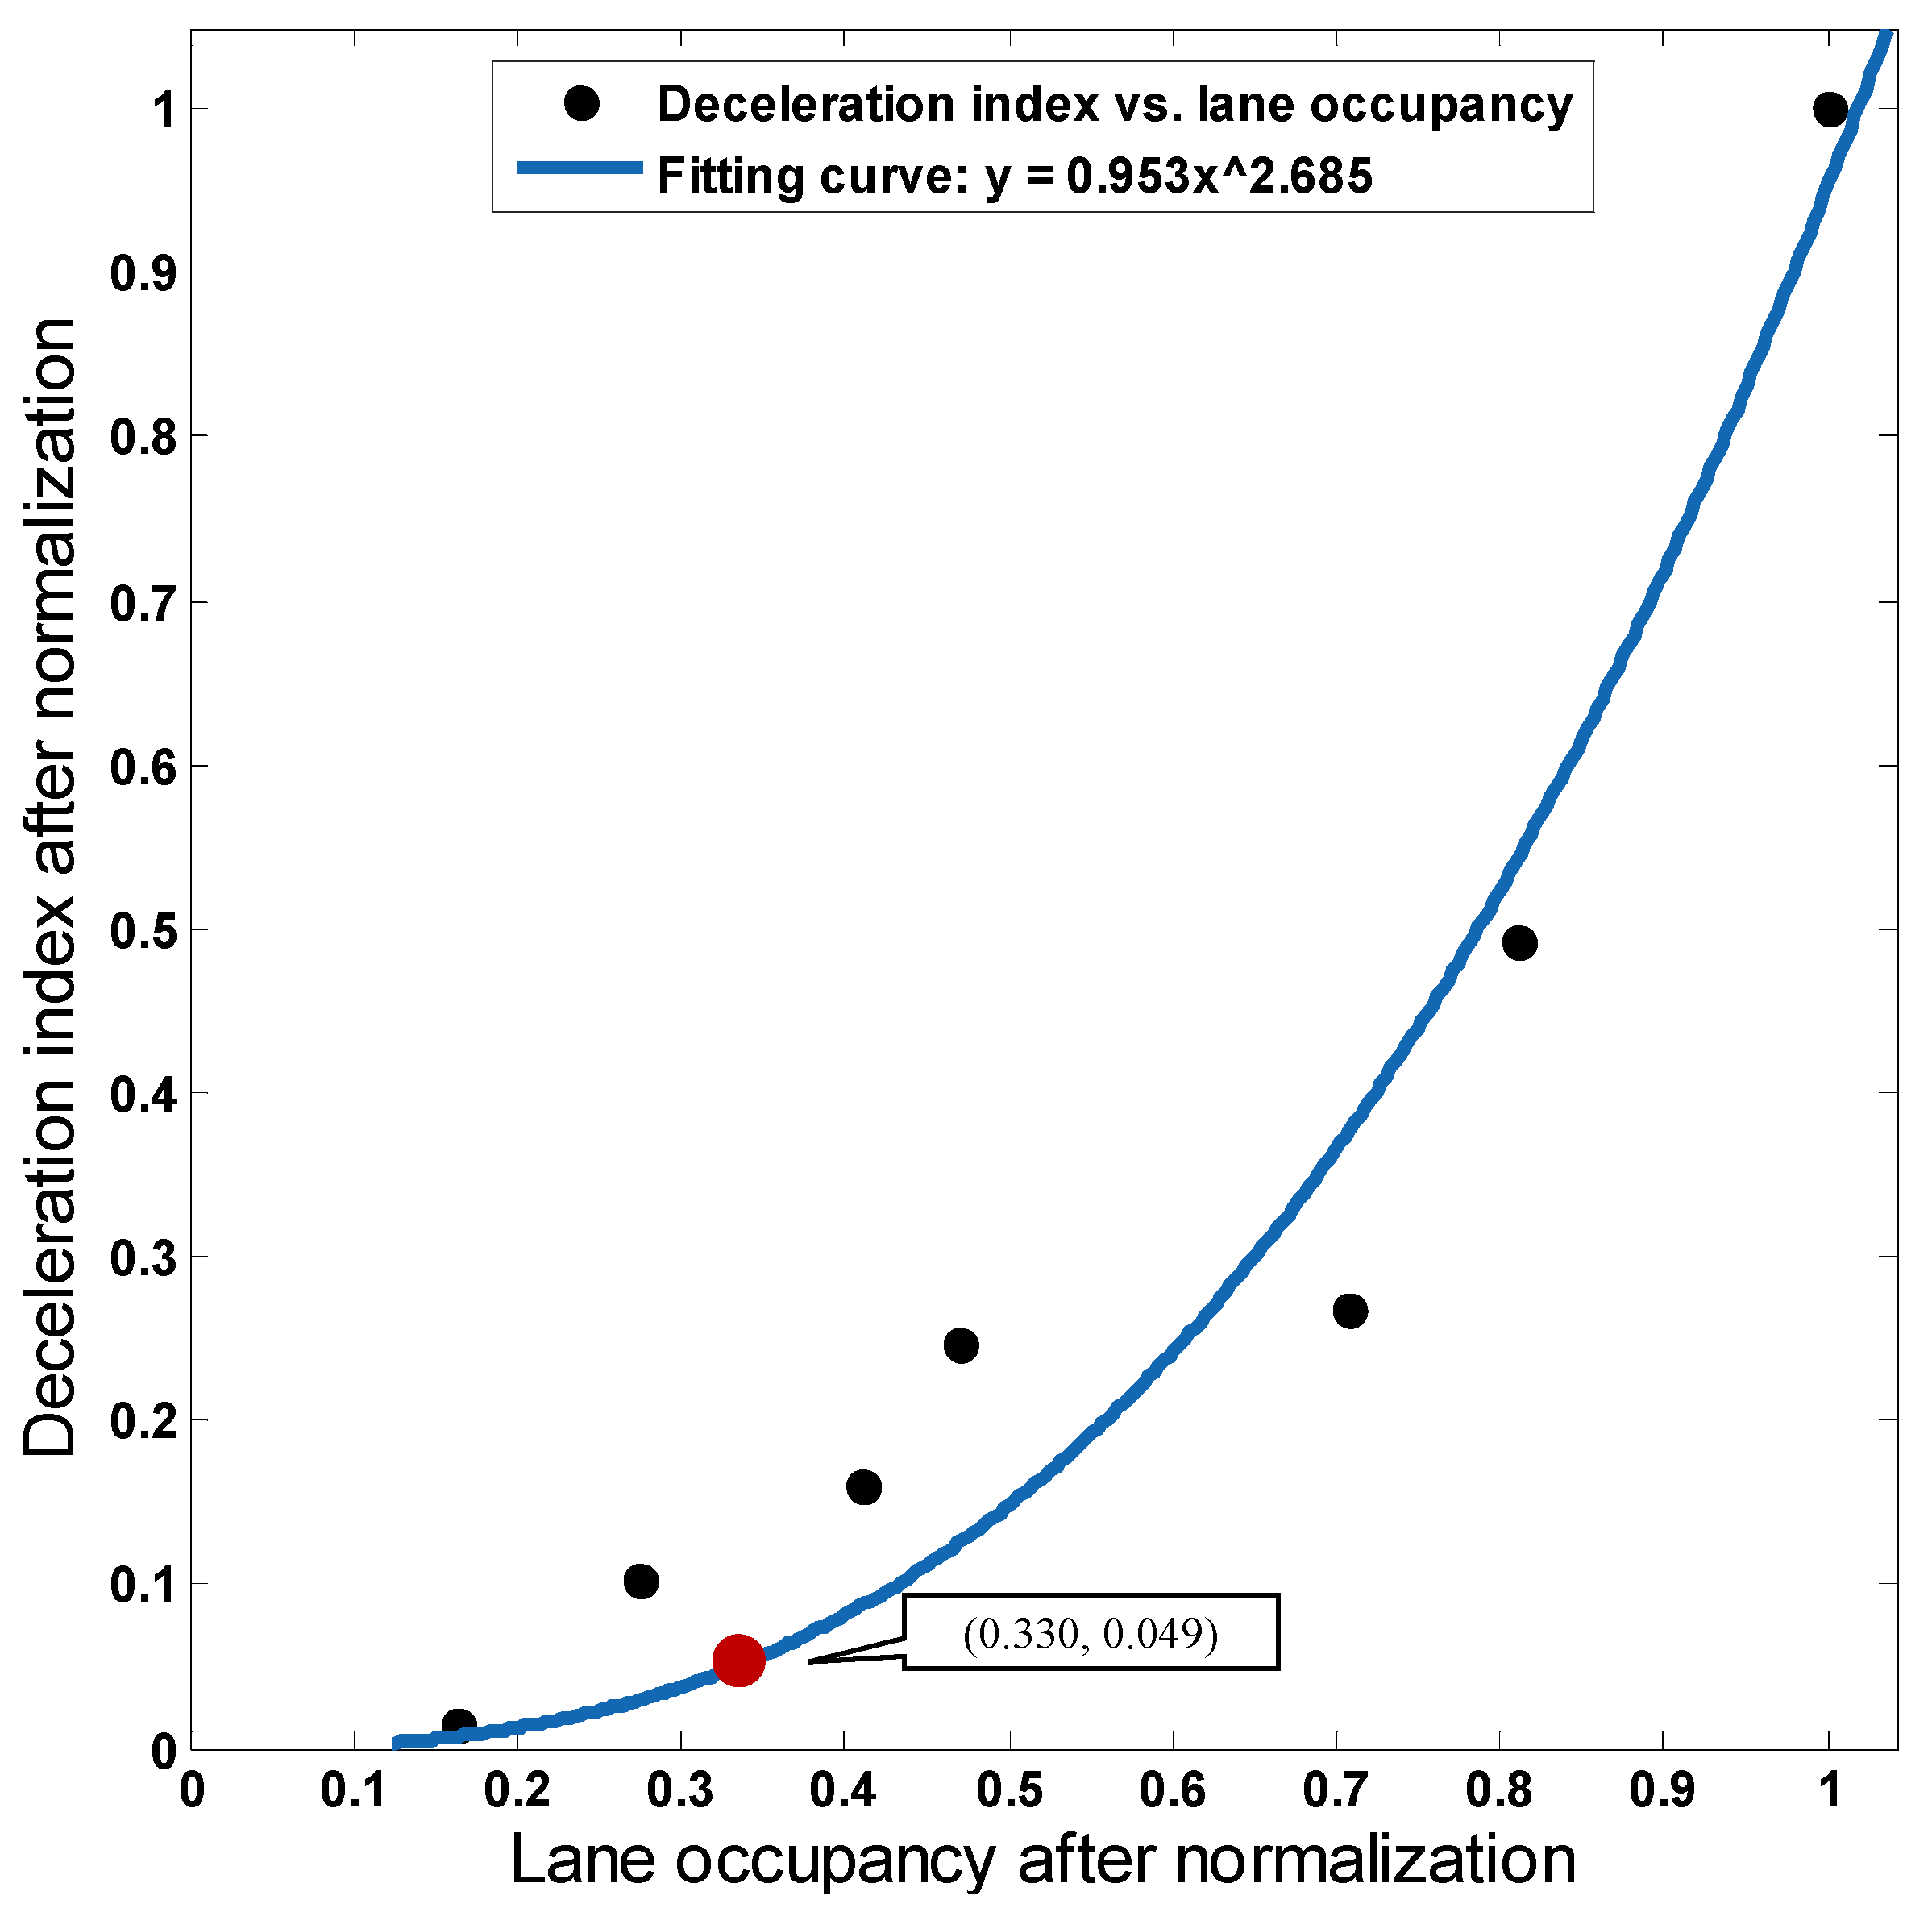
Table 9. When the volume increased to 7000 veh/h, and the lane occupancy increased to 46%, both two indexes had a significant increase in the case of placing parking bays. For a further quantitative analysis, we focused on the changes of two impact indexes with increasing lane occupancy. Firstly, we normalized the indexes and occupancies. Secondly, a scatter plot was drawn and fitted with power function (shown in
Figure 12 and
Figure 13). Thirdly, the point with the smallest curvature radius in each fitting curve was calculated (as the red dots shown in
Figure 12 and
Figure 13). Lastly, corresponding lane occupancies of these points were determined. After that, we got two critical values for two impact indexes, 25% lane occupancy for the delay index and 15% for the deceleration index. Considering the safety and efficiency impacts, when the lane occupancy exceeded 20%, which was about 3000 veh/h, emergency parking bays were not suitable for placing on expressways.
6. Conclusions
Based on the Monte Carlo method, this paper established a simulation model in VISSIM to investigate the safety and efficiency impacts of emergency parking bays in expressways. Two key arguments (hourly volume and the length of bay tapers) and two observed indexes (delay time and the probability of unsafe deceleration maneuvers) were focused upon to do the analysis. The major findings of this research are as follows.
(1) Traffic volume brought a great change to the impact on the mainline and there was a positive correlation between them. For low volume conditions, arrival vehicles had less impacts on the mainline compared with departure vehicles. However, for high volume conditions, arrival vehicles showed more impacts than the departure ones.
(2) A longer bay taper didn’t improve the impact effectively, but it reduced the waiting time of the departure vehicles, especially at high volume conditions. Based on the efficiency study, it was found that lengthening bay tapers within a certain range could reduce the size of affected area and the 20–30 m bay tapers widely used in current designs were suitable.
(3) Under low volume conditions, emergency parking bays didn’t cause a great impact on traffic safety and operations. However, when the occupancy of the road space exceeded 20% (about 3000 veh/h), there was a significant increase in delay time and deceleration on the mainline. Therefore, this paper proposed the applicable traffic volume for the placement of emergency parking bays on expressways.
The methodology and results of this study make great contributions to academia and engineering. Firstly, the conclusions can be used for assessing the design and implementation of emergency parking bays. The research results can also provide a theoretical support for related specifications. Moreover, based on the results, many further studies on relevant safety facilities can be carried out in the future, such as the location of warning signs. Finally, emergency parking bays can be adopted more widely and safely on expressways, allowing road resources to be more efficient and sustainable.
This paper only focused on quasi-eight-lane roads so far. Other types of highways will be considered in the future.
Author Contributions
Conceptualization, Z.Y. and X.C.; methodology, Z.Y. and X.C.; software, X.C.; validation, Z.Y. and X.C.; data curation, X.C.; writing—original draft preparation, Z.Y., X.C. and D.S.; writing—review and editing, Z.Y., X.C. and D.S.; visualization, Z.Y. and X.C.; supervision, Z.Y., X.C. and D.S.; funding acquisition, Z.Y. All authors have read and agreed to the published version of the manuscript.
Funding
This study was supported by the National Key Research and Development Plan of China (Grant No.2017YFC0803902 and No. 2018YFB1600301).
Acknowledgments
The authors want to express their deepest gratitude to Zhejiang Expressway Co., Ltd for providing the monitoring video of the Hangzhou-Ningbo Expressway.
Conflicts of Interest
The authors declare no conflict of interest.
References
- National Bureau of Statistics of China. China Statistical Yearbook 2019; China Statistics Press: Beijing, China, 2020.
- Wei, J. Study on Capacity of Quasi-Six-Lane Expressway. Master’s Thesis, Chang’an University, Shanxi, China, 2010. [Google Scholar]
- Liu, F.; Liu, H.; Li, D.; Zhang, J. Analysis on the Effectiveness of Emergency Parking Area in Highway. J. Highw. Transp. Res. Dev. Appl. Technol. Ed. 2007, 7, 159–161. [Google Scholar]
- Cui, X.; Chen, Y.; Xing, X.; Li, C. An Analysis on Influences of Spacing of Emergency Parking Harbors on Driving Behaviors. J. Transp. Inf. Saf. 2017, 4, 29–35. [Google Scholar]
- Liu, C. The Feasibility for Widening of Q-Y Highway. Master’s Thesis, Hebei University of Technology, Tianjin, China, 2010. [Google Scholar]
- Ministry of Transportation of the People’s Republic of China. Technical Standard of Highway Engineering: JTG B01-2014; China Communications Press: Beijing, China, 2014.
- AASHTO. Highway Safety Design and Operations Guide; AASHTO: Washington, DC, USA, 1997. [Google Scholar]
- Ministry of Transportation of the People’s Republic of China. Design Specification for Highway Alignment: JTJ 011-1994; China Communications Press: Beijing, China, 1994.
- Ministry of Transportation of the People’s Republic of China. Design Specification for Highway Alignment: JTG D20-2006; China Communications Press: Beijing, China, 2006.
- Ministry of Transportation of the People’s Republic of China. Design Specification for Highway Alignment: JTG D20-2017; China Communications Press: Beijing, China, 2017.
- Dejeammes, M.; Coffin, F.; Ladreyt, T.; Dessaigne, M.F.; Fouet, V.; Dolivet, C.; Zac, R. Bus stop design and automated guidance for low-floor buses: Evaluation of prototypes with investigation of human factors. Transp. Res. Rec. 1999, 1666, 85–91. [Google Scholar] [CrossRef]
- Nakamura, F.; Yabe, T.; Suzue, S. A study on improvement of bus-bay design. J. East. Asia Soc. Transp. Stud. 2005, 6, 449–456. [Google Scholar]
- Yang, X.; Xu, H.; Wang, J.; Long, K. Study of Setting Conditions of Bus Bay Stop. China J. Highw. Transp. 2011, 24, 122–127. [Google Scholar]
- Chen, B.; Li, X. Research on the Bus’s Departure Delay of the Harbor-shaped Bus Station. Urban Public Transp. 2017, 5, 25–29. [Google Scholar]
- Ministry of Transportation of the People’s Republic of China. Specifications for Highway Safety Audit: JTG B05-2015; China Communications Press: Beijing, China, 2016.
- Zheng, A.; Niu, Z. Research on Coordination between Motorway Operation Speed and Design Speed. J. Wuhan Yejin Univ. Sci. Technol. 2003, 3, 55–57. [Google Scholar]
- Kong, L. Simulation Models and Optimal Control for Traffic Flow Evolution on Urban Expressway System under Accident Conditions. Master’s Thesis, Beijing Jiaotong University, Beijing, China, 2015. [Google Scholar]
- Zhang, Y.; Wang, J. Capacity analysis of expressway section based on flow lane occupancy model. Cent. South Highw. Eng. 2000, 25, 63–65. [Google Scholar]
Figure 1.
Quasi-eight-lane expressway.
Figure 1.
Quasi-eight-lane expressway.
Figure 2.
Composition of a direct type of parking bay.
Figure 2.
Composition of a direct type of parking bay.
Figure 3.
Research method flowchart.
Figure 3.
Research method flowchart.
Figure 4.
Background for simulations (in meters).
Figure 4.
Background for simulations (in meters).
Figure 5.
Desired speed distribution.
Figure 5.
Desired speed distribution.
Figure 6.
Diagram of the entering moment. (a) Top view of the simulation (b) 3D scene of the simulation (c) Screenshot of the monitoring video.
Figure 6.
Diagram of the entering moment. (a) Top view of the simulation (b) 3D scene of the simulation (c) Screenshot of the monitoring video.
Figure 7.
Diagram of one impact on the mainline. (a) Entering the bay (b) Leaving the bay.
Figure 7.
Diagram of one impact on the mainline. (a) Entering the bay (b) Leaving the bay.
Figure 8.
Safety impact on the mainline when vehicles drove into the parking bay.
Figure 8.
Safety impact on the mainline when vehicles drove into the parking bay.
Figure 9.
Safety impact on the mainline when vehicles drove out of the parking bay.
Figure 9.
Safety impact on the mainline when vehicles drove out of the parking bay.
Figure 10.
Efficiency impact on the mainline when vehicles drove into the parking bay.
Figure 10.
Efficiency impact on the mainline when vehicles drove into the parking bay.
Figure 11.
Efficiency impact on the mainline when vehicles drove out of the parking bay.
Figure 11.
Efficiency impact on the mainline when vehicles drove out of the parking bay.
Figure 12.
Fitting curve for delay index.
Figure 12.
Fitting curve for delay index.
Figure 13.
Fitting curve for deceleration index.
Figure 13.
Fitting curve for deceleration index.
Table 1.
Vehicle inputs for each lane.
Table 1.
Vehicle inputs for each lane.
| | Lane Number (from the Inside to the Outside) |
|---|
| 1 | 2 | 3 | 4 |
|---|
| Traffic composition (%) | Cars | 100 | 88.33 | 36.30 | 17.91 |
| Buses | 0 | 10.83 | 2.05 | 1.49 |
| Trucks | 0 | 0.83 | 61.64 | 80.60 |
| Volume (veh/h) | 1000 | 950 | 600 | 250 |
Table 2.
Recommended values of the desired speed.
Table 2.
Recommended values of the desired speed.
| Designed speed (km/h) | 100 or 120 | 80 | 60 |
| Desired speed (km/h) | Cars | 120 | 110 | 90 |
| Heavy Vehicles (Buses and Trucks) | 80 | 80 | 75 |
Table 3.
Results of the actual traffic and traveling speed.
Table 3.
Results of the actual traffic and traveling speed.
| Hourly Volume (veh/h) | Traveling Speed of the Mainline (km/h) |
|---|
| Inputs in Simulations | Measured Traffic | Cars | Buses and Trucks |
|---|
| 1000 | 1020 | 118.39 | 80.76 |
| 2000 | 2007 | 116.75 | 79.57 |
| 3000 | 3016 | 115.78 | 73.00 |
| 4000 | 3988 | 114.37 | 69.13 |
| 5000 | 5005 | 110.59 | 67.56 |
| 6000 | 6033 | 105.11 | 66.07 |
| 7000 | 7049 | 94.85 | 65.80 |
Table 4.
Statistics of the first vehicle behind an entering one.
Table 4.
Statistics of the first vehicle behind an entering one.
| Hourly Volume (veh/h) | Length of the Bay Taper (m) | Delay Time (s) | Distribution of Deceleration (%) | Proportion of Lane Changes (%) |
|---|
0~
−1.5 m/s2 | −1.5~
−2.5 m/s2 | −2.5~
−4 m/s2 | Exceed
−4 m/s2 |
|---|
| 1000 | 10 | 0.06 | 98.25 | 1.75 | 0 | 0 | 0 |
| 20 | 0.06 | 98.25 | 1.75 | 0 | 0 | 0 |
| 30 | 0.06 | 98.25 | 1.75 | 0 | 0 | 0 |
| 40 | 0.06 | 98.25 | 1.75 | 0 | 0 | 0 |
| 50 | 0.05 | 98.25 | 1.75 | 0 | 0 | 0 |
| 2000 | 10 | 0.95 | 73.24 | 22.54 | 4.23 | 0 | 8.33 |
| 20 | 0.90 | 73.24 | 23.94 | 2.82 | 0 | 8.33 |
| 30 | 0.89 | 73.24 | 23.94 | 2.82 | 0 | 8.33 |
| 40 | 0.88 | 73.24 | 23.94 | 2.82 | 0 | 8.33 |
| 50 | 0.87 | 73.24 | 25.35 | 1.41 | 0 | 8.33 |
| 3000 | 10 | 1.69 | 70.13 | 12.99 | 15.58 | 1.30 | 8.97 |
| 20 | 1.67 | 70.13 | 15.58 | 12.99 | 1.30 | 8.97 |
| 30 | 1.66 | 68.83 | 16.88 | 12.99 | 1.30 | 8.97 |
| 40 | 1.61 | 69.23 | 16.67 | 12.82 | 1.28 | 8.86 |
| 50 | 1.58 | 69.23 | 16.67 | 12.82 | 1.28 | 8.86 |
| 4000 | 10 | 3.22 | 48.24 | 32.94 | 16.47 | 2.35 | 10.47 |
| 20 | 3.19 | 48.24 | 32.94 | 16.47 | 2.35 | 10.47 |
| 30 | 3.15 | 47.06 | 34.12 | 16.47 | 2.35 | 10.47 |
| 40 | 3.11 | 47.06 | 34.12 | 16.47 | 2.35 | 10.47 |
| 50 | 3.05 | 48.24 | 32.94 | 16.47 | 2.35 | 10.47 |
| 5000 | 10 | 3.78 | 51.11 | 31.11 | 17.78 | 0 | 19.78 |
| 20 | 3.68 | 51.11 | 31.11 | 17.78 | 0 | 19.78 |
| 30 | 3.64 | 52.22 | 31.11 | 16.67 | 0 | 18.68 |
| 40 | 3.61 | 53.33 | 30.00 | 16.67 | 0 | 19.78 |
| 50 | 3.52 | 54.44 | 28.89 | 16.67 | 0 | 18.68 |
| 6000 | 10 | 4.64 | 43.75 | 25.00 | 29.17 | 2.08 | 8.16 |
| 20 | 4.53 | 43.75 | 27.08 | 27.08 | 2.08 | 8.16 |
| 30 | 4.48 | 43.75 | 29.17 | 25.00 | 2.08 | 8.16 |
| 40 | 4.47 | 43.75 | 31.25 | 22.92 | 2.08 | 8.16 |
| 50 | 4.47 | 43.75 | 31.25 | 20.83 | 4.17 | 8.16 |
| 7000 | 10 | 8.02 | 17.86 | 28.57 | 39.29 | 14.29 | 12.28 |
| 20 | 8.50 | 24.56 | 22.81 | 35.09 | 17.54 | 12.07 |
| 30 | 7.94 | 22.81 | 24.56 | 33.33 | 19.30 | 15.52 |
| 40 | 7.05 | 20.69 | 31.03 | 31.03 | 17.24 | 13.56 |
| 50 | 8.60 | 24.14 | 25.86 | 34.48 | 15.52 | 13.56 |
Table 5.
Statistics of the first vehicle behind an exiting one.
Table 5.
Statistics of the first vehicle behind an exiting one.
| Hourly Volume (veh/h) | Length of the Bay Taper (m) | Delay Time (s) | Distribution of Deceleration (%) | Proportion of Lane Changes (%) |
|---|
0~
−1.5 m/s2 | −1.5~
−2.5 m/s2 | −2.5~
−4 m/s2 | Exceed
−4 m/s2 |
|---|
| 1000 | 10 | 1.02 | 87.72 | 8.77 | 3.51 | 0 | 6.90 |
| 20 | 1.02 | 87.72 | 8.77 | 1.75 | 1.75 | 6.90 |
| 30 | 1.03 | 89.47 | 7.02 | 1.75 | 1.75 | 6.90 |
| 40 | 0.95 | 91.23 | 7.02 | 0 | 1.75 | 6.90 |
| 50 | 0.95 | 91.23 | 7.02 | 0 | 1.75 | 6.90 |
| 2000 | 10 | 1.72 | 76.06 | 16.90 | 4.23 | 2.82 | 16.67 |
| 20 | 1.78 | 76.06 | 16.90 | 4.23 | 2.82 | 19.44 |
| 30 | 1.77 | 76.06 | 16.90 | 2.82 | 4.23 | 19.44 |
| 40 | 1.74 | 77.47 | 15.49 | 2.82 | 4.23 | 18.06 |
| 50 | 1.84 | 80.28 | 11.27 | 1.41 | 7.04 | 16.67 |
| 3000 | 10 | 1.81 | 72.73 | 15.58 | 10.39 | 1.30 | 25.64 |
| 20 | 1.80 | 75.33 | 11.69 | 10.39 | 2.60 | 24.36 |
| 30 | 1.86 | 77.92 | 9.09 | 10.39 | 2.60 | 24.36 |
| 40 | 1.91 | 75.64 | 14.10 | 8.97 | 1.28 | 18.99 |
| 50 | 1.92 | 79.49 | 11.54 | 5.13 | 3.85 | 15.19 |
| 4000 | 10 | 2.06 | 62.35 | 22.35 | 10.59 | 4.71 | 31.40 |
| 20 | 1.94 | 61.18 | 23.53 | 10.59 | 4.71 | 31.40 |
| 30 | 1.69 | 67.06 | 21.18 | 8.24 | 3.53 | 29.07 |
| 40 | 1.81 | 67.06 | 22.35 | 7.06 | 3.53 | 27.91 |
| 50 | 1.89 | 68.24 | 20.00 | 8.24 | 3.53 | 26.74 |
| 5000 | 10 | 2.45 | 63.33 | 18.89 | 6.67 | 11.11 | 26.37 |
| 20 | 2.35 | 64.44 | 15.56 | 10.00 | 10.00 | 28.57 |
| 30 | 2.39 | 68.89 | 15.56 | 8.89 | 6.67 | 21.98 |
| 40 | 2.11 | 72.22 | 12.22 | 8.89 | 6.67 | 20.88 |
| 50 | 2.02 | 71.11 | 13.33 | 8.89 | 6.67 | 17.58 |
| 6000 | 10 | 2.24 | 64.58 | 16.67 | 8.33 | 10.42 | 26.53 |
| 20 | 1.97 | 68.75 | 12.50 | 8.33 | 10.42 | 26.53 |
| 30 | 1.96 | 68.75 | 14.58 | 6.25 | 10.42 | 26.53 |
| 40 | 1.77 | 68.75 | 12.50 | 8.33 | 10.42 | 28.57 |
| 50 | 2.18 | 68.75 | 10.42 | 8.33 | 12.50 | 20.41 |
| 7000 | 10 | 4.48 | 69.64 | 17.86 | 12.50 | 0 | 12.28 |
| 20 | 4.14 | 66.67 | 19.30 | 10.53 | 3.51 | 18.97 |
| 30 | 3.83 | 70.18 | 7.02 | 15.79 | 7.02 | 17.24 |
| 40 | 4.05 | 67.24 | 15.52 | 10.35 | 6.90 | 10.17 |
| 50 | 4.01 | 68.97 | 13.79 | 8.62 | 8.62 | 11.86 |
Table 6.
Average waiting time for driving into the mainline.
Table 6.
Average waiting time for driving into the mainline.
| Hourly Volume (veh/h) | Length of the Bay Taper (m) | Average Waiting Time (s) |
|---|
| Cars | Buses and Trucks |
|---|
| 1000 | 10 | 0.10 | 0.01 |
| 20 | 0.04 | 0.03 |
| 30 | 0.05 | 0.02 |
| 40 | 0 | 0.16 |
| 50 | 0 | 0.18 |
| 2000 | 10 | 0.39 | 0.48 |
| 20 | 0.37 | 0.52 |
| 30 | 0.39 | 0.49 |
| 40 | 0.35 | 0.49 |
| 50 | 0.34 | 0.58 |
| 3000 | 10 | 0.69 | 1.14 |
| 20 | 0.61 | 1.19 |
| 30 | 0.59 | 1.15 |
| 40 | 0.61 | 1.15 |
| 50 | 0.33 | 1.24 |
| 4000 | 10 | 1.01 | 2.13 |
| 20 | 0.99 | 2.28 |
| 30 | 1.34 | 2.46 |
| 40 | 1.34 | 2.54 |
| 50 | 0.99 | 2.42 |
| 5000 | 10 | 2.59 | 4.35 |
| 20 | 2.53 | 4.23 |
| 30 | 2.56 | 4.13 |
| 40 | 2.37 | 3.91 |
| 50 | 1.97 | 3.31 |
| 6000 | 10 | 5.96 | 9.47 |
| 20 | 5.07 | 8.16 |
| 30 | 4.15 | 7.46 |
| 40 | 3.40 | 5.98 |
| 50 | 3.10 | 5.21 |
| 7000 | 10 | 8.60 | 19.87 |
| 20 | 7.08 | 16.76 |
| 30 | 6.21 | 14.60 |
| 40 | 5.61 | 10.95 |
| 50 | 4.56 | 7.12 |
Table 7.
Probability of vehicles with more than −2.5 m/s2 deceleration.
Table 7.
Probability of vehicles with more than −2.5 m/s2 deceleration.
| Hourly Volume (veh/h) | Progress | Length of the Bay Taper (m) |
|---|
| 10 | 20 | 30 | 40 | 50 |
|---|
| 1000 | In | 0% | 0% | 0% | 0% | 0% |
| Out | 0.47% | 0.47% | 0.46% | 0.47% | 0.47% |
| 2000 | In | 1.62% | 1.88% | 1.88% | 1.57% | 1.29% |
| Out | 2.82% | 2.81% | 2.56% | 2.75% | 3.08% |
| 3000 | In | 5.50% | 5.01% | 4.92% | 4.76% | 4.57% |
| Out | 3.30% | 3.52% | 3.30% | 3.07% | 3.17% |
| 4000 | In | 6.96% | 6.30% | 5.72% | 5.47% | 5.52% |
| Out | 6.20% | 6.04% | 5.41% | 5.51% | 5.78% |
| 5000 | In | 8.14% | 8.05% | 7.58% | 6.88% | 6.59% |
| Out | 5.57% | 5.34% | 5.23% | 5.25% | 5.91% |
| 6000 | In | 14.34% | 13.06% | 12.48% | 11.21% | 10.24% |
| Out | 11.20% | 11.12% | 11.09% | 12.07% | 12.79% |
| 7000 | In | 29.21% | 34.77% | 26.83% | 21.93% | 26.62% |
| Out | 24.63% | 21.53% | 23.20% | 23.24% | 23.81% |
Table 8.
Average delay of the following vehicles.
Table 8.
Average delay of the following vehicles.
| Hourly Volume (veh/h) | Progress | Length of the Bay Taper (m) |
|---|
| 10 | 20 | 30 | 40 | 50 |
|---|
| 1000 | In | 0.10 s | 0.10 s | 0.10 s | 0.10 s | 0.09 s |
| Out | 0.17 s | 0.17 s | 0.18 s | 0.17 s | 0.17 s |
| 2000 | In | 0.36 s | 0.38 s | 0.36 s | 0.36 s | 0.37 s |
| Out | 0.18 s | 0.15 s | 0.15 s | 0.17 s | 0.17 s |
| 3000 | In | 0.71 s | 0.73 s | 0.73 s | 0.70 s | 0.70 s |
| Out | 0.47 s | 0.47 s | 0.44 s | 0.46 s | 0.46 s |
| 4000 | In | 1.14 s | 1.16 s | 1.16 s | 1.16 s | 1.16 s |
| Out | 1.08 s | 1.04 s | 1.02 s | 1.01 s | 1.00 s |
| 5000 | In | 1.79 s | 1.77 s | 1.77 s | 1.77 s | 1.79 s |
| Out | 1.65 s | 1.62 s | 1.60 s | 1.59 s | 1.62 s |
| 6000 | In | 2.75 s | 2.68 s | 2.68 s | 2.67 s | 2.76 s |
| Out | 2.99 s | 2.98 s | 2.97 s | 2.97 s | 3.17 s |
| 7000 | In | 6.49 s | 8.55 s | 7.31 s | 5.39 s | 8.86 s |
| Out | 7.38 s | 7.44 s | 6.73 s | 6.13 s | 7.66 s |
Table 9.
Changes of two impact indexes with increasing lane occupancy.
Table 9.
Changes of two impact indexes with increasing lane occupancy.
| Hourly Volume (veh/h) | Lane Occupancy (%) | Delay Index (s) | Deceleration Index (%) |
|---|
| 1000 | 8 | 0.14 | 0.38 |
| 2000 | 13 | 0.26 | 2.56 |
| 3000 | 19 | 0.59 | 3.97 |
| 4000 | 22 | 1.10 | 6.13 |
| 5000 | 33 | 1.69 | 6.66 |
| 6000 | 38 | 2.89 | 12.28 |
| 7000 | 46 | 7.92 | 24.93 |
© 2020 by the authors. Licensee MDPI, Basel, Switzerland. This article is an open access article distributed under the terms and conditions of the Creative Commons Attribution (CC BY) license (http://creativecommons.org/licenses/by/4.0/).


