1. Introduction
There are approximately 3 million 77 thousand agricultural enterprises in Turkey, 62.3% of which carry out both vegetative and animal production. Among the remaining enterprises, 37.2% of them practice only vegetative and 0.5% of them deal with only animal production. According to the typology classification of agricultural enterprises which was carried out within the scope of European Union adjustment laws, 16.7% of the agricultural enterprises in Turkey achieve specialized depasturing animal breeding. Approximately 60% of the enterprises have one to four cattle, and 6.1% of them have more than 20 [
1]. Based on this information, it can be said that 60% of the existing animal enterprises are small family-run businesses rather than business firms.
Stock breeding in Turkey had mostly been carried out with native races and as natural pasture breeding until the 1970s when progress was made in stock breeding by importing culture race animals and hybridization, which brought new aspects to the stock breeding sector. An increase in animal presence of both culture and hybrid races has been seen with the help of the support policies being maintained since the 2000s. The total cattle presence has risen to approximately 14 million in recent years. A total of 46% of the total cattle presence is culture races, and 13% of it consists of native races [
2].
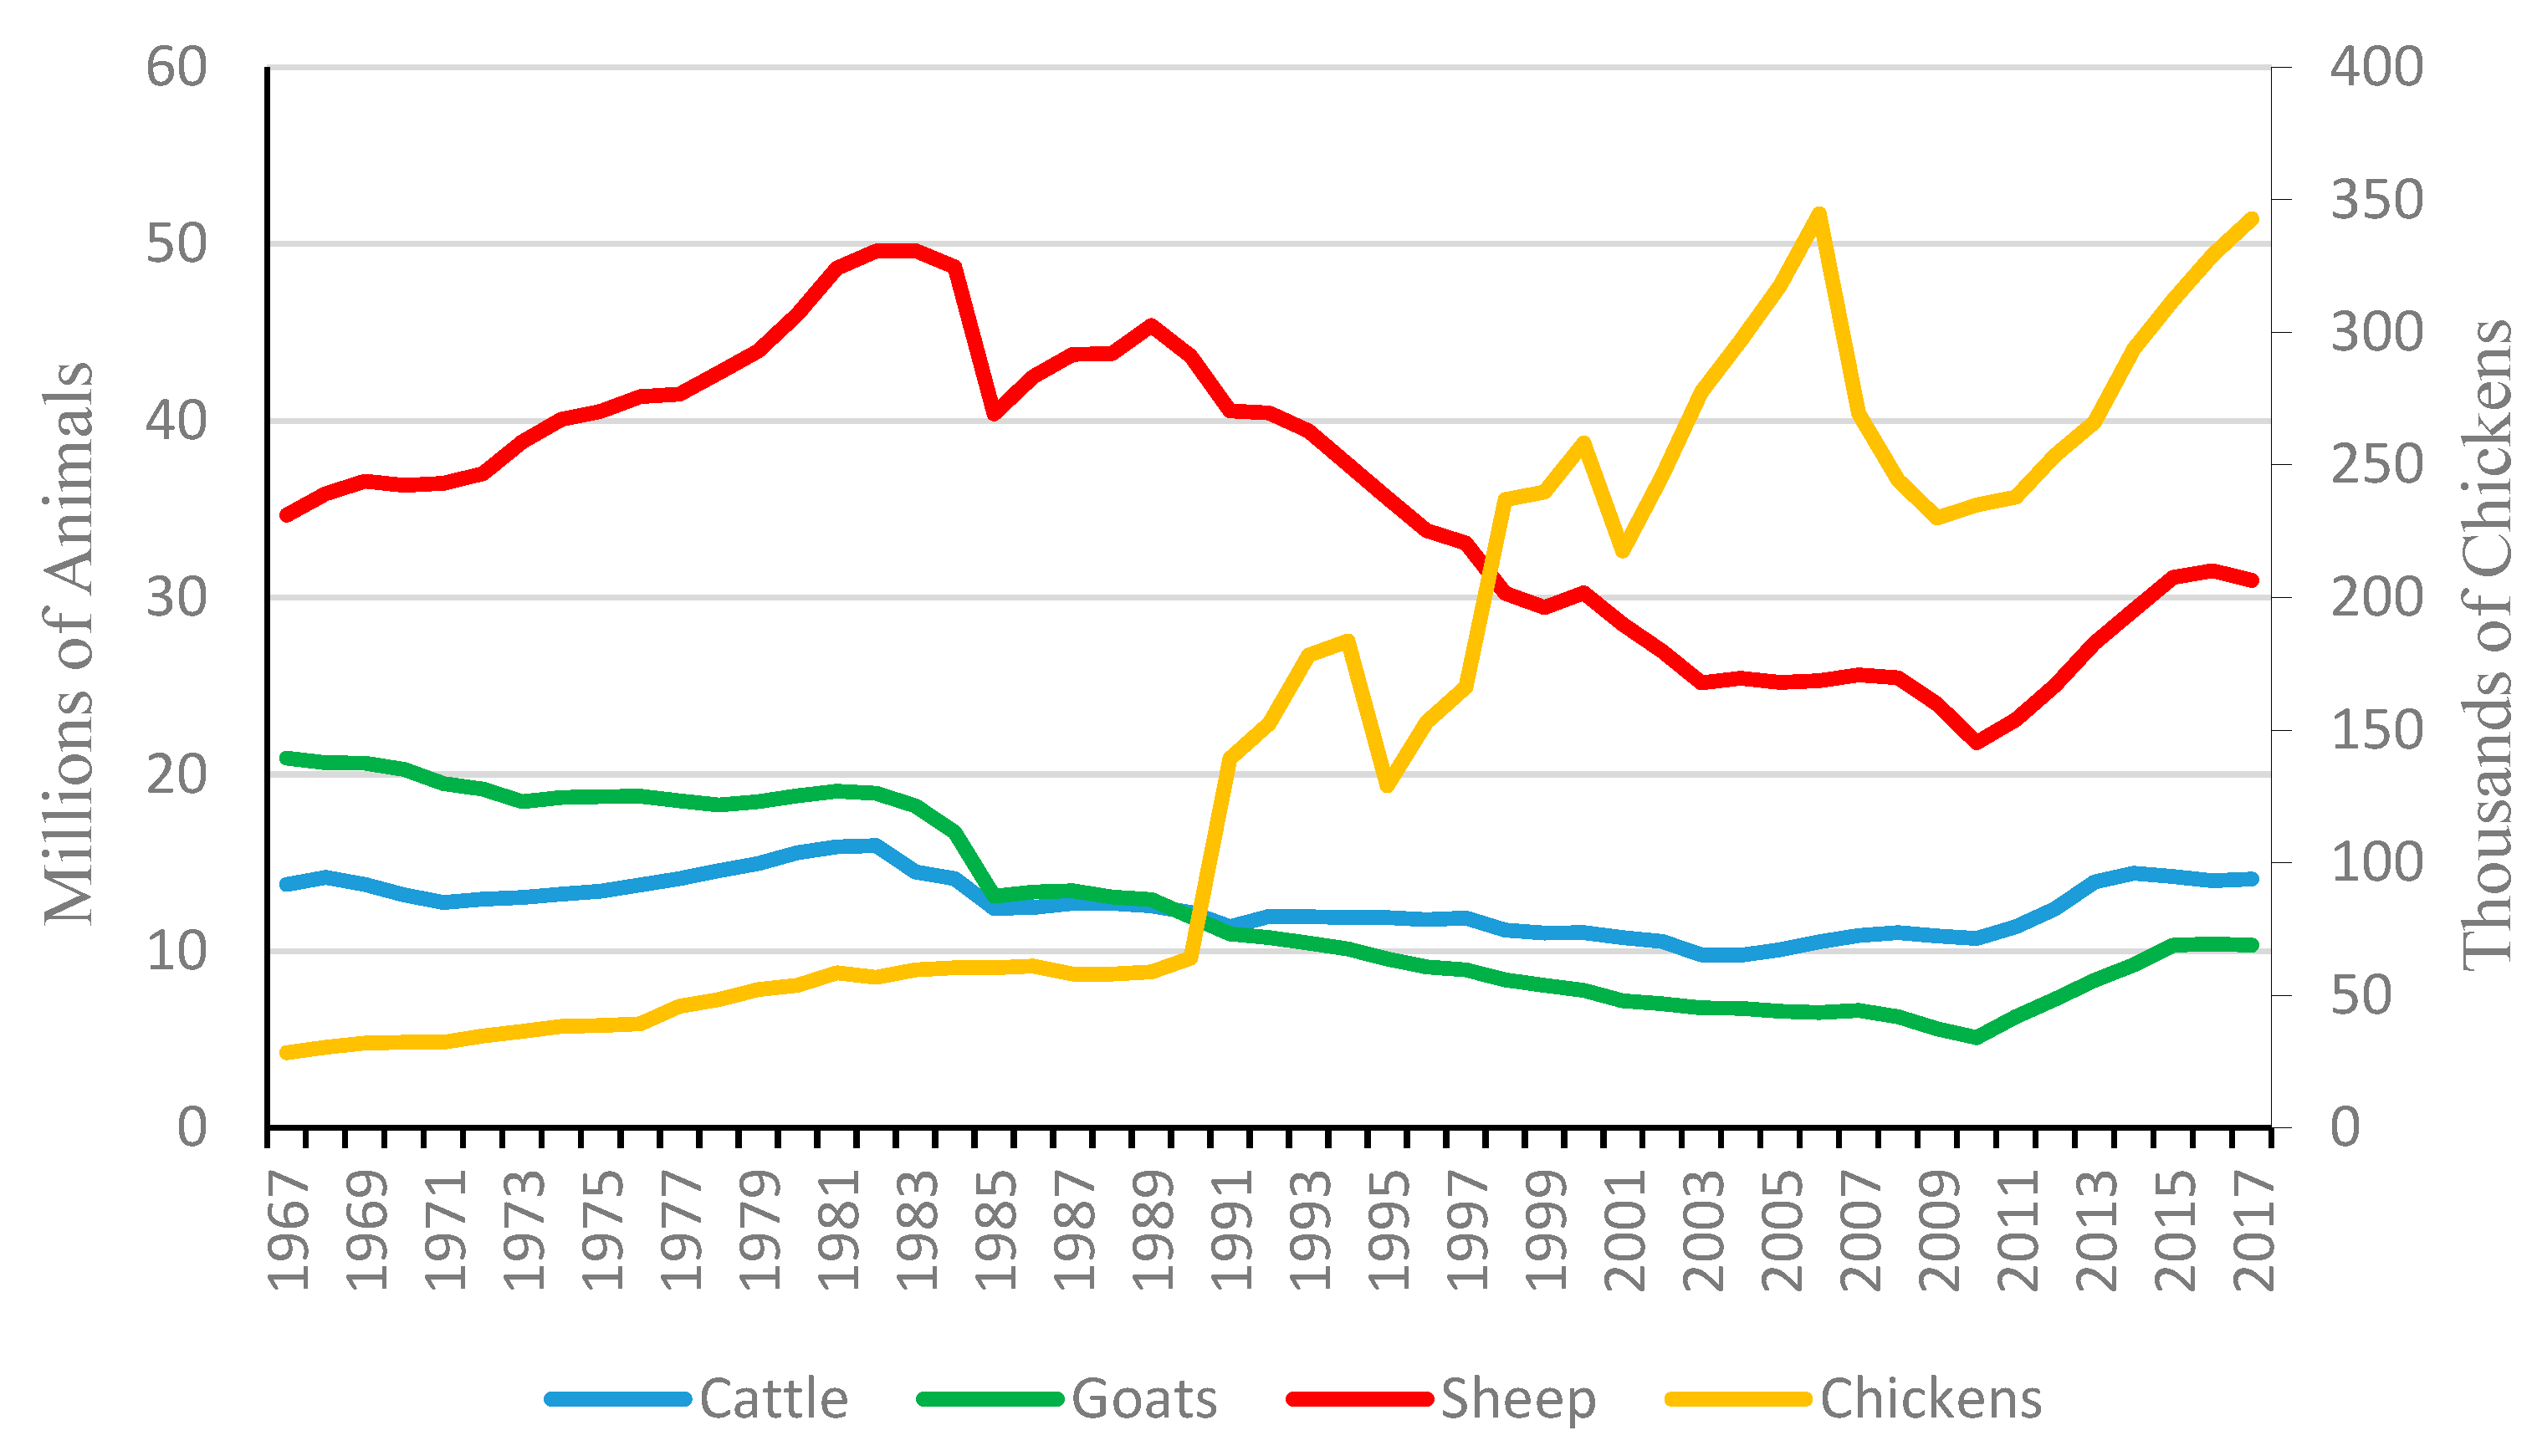
Regarding the number of cattle in Turkey, there was no significant change for many years. Namely, the amount of cattle in Turkey with 13.8 million in 1967 was recorded as 14 million in 2017. In the same years, the number of goats, which was 20 million, decreased by 50% to 10 million. The number of sheep, which was 50 million heads in 1983, decreased to 30 million in 2017. Decreases in all these animal numbers activated poultry to meet increasing animal protein demand. As can be seen, the number of poultry has increased quite rapidly (
Figure 1) [
3].
This situation is to discuss the sustainability of animal production in Turkey. In order to take measures, more support was given to animal production.
The support payments and their portions in the total agricultural support budget vary year by year in Turkey. The portion of the livestock supports in the total agricultural support budget was recorded to raise to 29.5% as three billion Turkish Liras, whereas it was 1.5% in 2001 [
4].
Livestock support items in Turkey have also varied throughout the years, roughage support was applied between the years 2000 and 2001, and meat incentive pay started to be given in 2004, for instance. Besides these, supports for pregnant heifer support and artificial insemination services continued from 2000 to 2007. Calf support for artificial insemination, apiculture, and aquaculture supports started in 2003 and is still active. Animal identification supports, scheduled vaccination support, germplasm preservation support, and milk cooling tank support started in 2005 and is still in operation. Together with all the supports mentioned, brood stock support started in 2008.
Breeders who carry out brood stock raising and owning at least five brood stock by the date of the valid code as a member of any organization are able to make use of support payments once a year for each animal. Enterprises to receive support payments and cattle are required to be recorded under the Turkvet/e-breeding database, and animals are required to be either a culture race or a culture race hybrid [
5]. However, the mentioned support item, which has been paid since 2008, did not appear in the adjudication related to agricultural supports in 2016 [
6]. While there were requirements such as artificial insemination and brucella vaccination necessity for female calf for calf support payments in 2015 and before, these requirements were not stipulated in the codes of practice disclosure, which was published in 2016. It was adequate for a calf born in 2016 to be recorded under the database of Turkvet and e-breeding, to live at least four months in the enterprise where it was born and vaccinated adequately according to the vaccine schedule. As an addition to these support items, brood ox, male cattle, brood sheep and goat, angora goat breeding and angora breeding, raw milk yield, and shepherd employment supports are also available [
5].
It is determined that statistical assessments were carried out in some studies dealing with livestock support policies in Turkey [
7,
8,
9,
10,
11,
12], whereas some studies aimed at a selected political tool [
13,
14,
15,
16,
17,
18,
19]. There is only one study analysing the effects of support policies on stock breeding sector in meso-level in the literature [
20]. The aforementioned study, which is a doctoral thesis, dealt with the effects of the support policies applied between 2005 and 2007 and analyzed the Western Marmara and Northeast Anatolian regions. The study was carried out with 540 livestock enterprises and the two regions were studied comparatively.
This study analyzes the effects of livestock support policies applied in Turkey with the panel FMOLS model and in 26 sub-regions and countrywide. The effects of support policies in the study are built upon the change in the large ruminant animals (cattle and buffalo) presence because most support payments on large ruminant animals are created in Turkey.
The findings of the study are expected to be a guideway for stating the flaws of the current policies and creating alternative ones. As it is the first extensive study on the support policies in Turkey carried out with panel data analysis method, it is thought to be an important contribution to the literature.
2. Data Description and Empirical Methodology
2.1. Model Specification
To investigate the long-run relationship of animal presence and livestock supports payment variables of Turkey and all the sub-regions from 2004 to 2014, this study employs the specific model followed
where:
= Animal presence of sub-regions i in t time
= Calf support of sub-regions i in t time
= Milk support of sub-regions i in t time
= Forage plant support of sub-regions i in t time
= Brood cattle support of sub-regions i in t time
= Total livestock support of sub-regions i in t time
= Coefficent
= Error term
2.2. Data Source
The data of the study were obtained from the official records of the Ministry of Food, Agriculture and Livestock (MFAL), and Turkish Statistical Institute (TURKSTAT). The directives and regulations were obtained from MFAL [
21] and Official Journal [
5,
6].
A panel data set was created for the study. In the process, data from 26 regions, which covers all the sub-regions in the scope of Level 2 of nomenclature of territorial units for statistics, were dealt with in a cross-sectional fashion. The considered period for the study is between 2004 and 2014, when livestock supports were intensively given. Prominent support payments and animal counts were used on the basis of different items for each region as variables.
2.3. Methodology
The main objective of this study is to explore the long-run relationship of animal presence, and livestock supports payment variables of Turkey and all the sub-regions. To test the relationship between animal presence and livestock supports, payment variables, mainly fully modified least square (FMOLS), were applied.
However, three different steps were performed to complete the procedure of this model. First, test of stationarity and order of integration among all variables. The study used panel unit root test proposed by Levin et al., known as LLC test [
22], to determine the stationarity and order of integration. Second, with the assumption that all the variables are in the same order of integration stationary at level I (0) or stationary at first difference I(1) Kao panel cointegration proposed by Kao [
23] has been applied to confirm the residual-based cointegration among all variables. These tests involve procedures that are designed to detect the presence of a unit root in the residuals of (cointegrating) regressions among the levels of panel data. Third, fully modified ordinary least square (FMOLS) proposed by Pedroni [
24] has been applied to explore the long-run relationship between animal presence and livestock supports payment variables of Turkey and all the sub-regions.
2.3.1. Panel Unit Root Test
In the previous literature, the unit root tests for the individual time series data (Phillips and Perron (PP) test and Dickey
–Fuller test (DF) and Augmented Dickey
–Fuller test (ADF), and others) were suffering from several problems. One of the main problems was low power against the alternative of stationarity of the series, especially if the sample size is small. Panel unit root test has several advantages, it provides a large number of point data, increases the value of the degree of freedom, and reduces multicollinearity between the two regressors. Moreover, panel unit root test provides us with more powerful test statistics that asymptotically follow a normal distribution. Previous studies [
22,
25,
26,
27] are prominent for their suggestion to use unit root test in panel data sets. In this study, we used the LLC test based on the following model:
where
is the first difference,
is the series for Turkey in the current penal in the time period t,
is the no of lags and
is the distributed random variables.
2.3.2. Panel Cointegration Approach
Two non-stationary series with some linear combination are said to be cointegrated. In the second step, this study applies panel cointegration test proposed by Kao [
23] for the null hypothesis of no cointegration in homogenous and heterogeneous panels. Assumed all variables are I(1), this study applies panel cointegration using Kao’ tests [
23]. The panel cointegration can be demonstrated as follows
where i = 1,…..,N, t = 1,…..,T,
= individual constant term,
= slop parameter,
= stationary distribution,
and
= integrated process of order I(1) for alli. Kao’ test derives two (DF and ADF) types of panel cointegration tests. Both tests can be calculated from:
and
where
is obtained from Equation (2). For null hypothesis,
and alternative hypothesis
are used. Kao’ test proposes four DF-type statistics. The first two DF statistics are based on assuming strict exogenity of the regressors with respect to the error in the equation, while the remaining allow for endogeneity [
23].
2.3.3. Fully Modify Ordinary Least Square (FMOLS)
The strong evidence allows us to apply FMOLS to confirm the long-run relationship among proposed variables. The panel FMOLS has numerous advantages. It allows serial correlation (SE), existence of endogeneity (EE), and cross-sectional heterogeneity. Moreover, it will propose both within dimension and between dimensions. Let us use Equation (2) to obtain the between-dimension Equation (6)
where
is the FMOLS estimator for individual variable.
3. Findings and Discussion
3.1. Descriptive Statistics of the Variables Used in the Model
Descriptive statistics of the variables used in the panel FMOLS model are given in
Table 1. The panel data set contains a total of 1586 pieces of data in six variables, 26 cross-section pieces of data (286) in an 11-year period (between 2004 and 2014 livestock supports). As support per animal (brood cattle support) started to be given since 2009, the data for this variable cover six years. It is understood that none of the variables shows normal distribution with their coefficients of skewness and kurtosis according to the normal distribution (Jarque
–Bera) test. Therefore, logarithmic transformation was applied to all the variables in the analyses of the study.
3.2. Panel Unit Root and Panel Cointegration Test Results
To test the panel unit root of each variable, the test proposed by Levin et al. was applied [
22]. The results of panel unit root test are reported in
Table 2.
According to the test, variables are non-stationary at level and become stationary at first difference. These results shows that most of the variables are stationary at first difference I(1), hence conventional estimation methods of panel data are not applicable here. This study will construct a panel data model method, which is robust to First difference I(1) stationary variables.
As panel unit root test results concluded that series are integrated with the same order I(1). the study proceeds to test cointegration. Thus, the second step explores the long-run equilibrium relationship among export and other macroeconomic variables. Results of Kao’s cointegration are reported in
Table 3. Hence, according to the P-value, there is cointegration among the selected set of variables using the Kao residual method.
After the analysis, it was seen that there is a relationship in the long term between animal presence and support payments of 26 sub-regions, which means they liaise. In other words, it can be said that the animal presence will parallelly respond to any variance in supports.
3.3. Panel FMOLS Model Results
The long-term effect of support payments on animal presence was assessed individually in 26-sub regions for both each and all of the regions with the FMOLS model. The panel sum also presents us with the information for the countrywide. The panel FMOLS results are given in
Table 4.
According to the panel FMOLS model results, the total livestock support (TLS) has a positive effect and its significance level is 1%, which is an expected result. It means that increments in the total livestock support affect animal presence in a positive way in the panel. The total livestock support coefficient was calculated as 0.30 for the whole panel. This result means that a 1.0% increase in the total livestock support in Turkey will result in a 0.3% increase in animal presence. The situation can be interpreted as a positive effect of livestock support policies in Turkey on animal presence.
When the results of panel FMOLS test are assessed regionally, all the coefficients for regions are positive and have a statistically acceptable importance level. The highest coefficient (1.78) belongs to TR71 region which includes Kırıkkale, Aksaray, Niğde, Nevşehir, and Kırşehir provinces, whereas the lowest coefficient (0.05) belongs to TRC2 region consisting of Şanlıurfa and Diyarbakır provinces. It means that a 1.0% increase in total livestock support payments will affect the animal presence in TR71 area by 1.78% and in TRC2 area by 0.05%.
Table 5 is prepared by calculating some of the regions’ animal presence and livestock support shares in order to interpret the results of panel FMOLS test better. According to the information above and in
Table 5, while there was an increase in culture races by approximately sevenfold and in hybrid races by approximately threefold in the period between 2004 and 2014, the utilization rate of support payments is significantly low, which is an important finding.
It can be said that there are other contributing causes affecting the animal presence in the mentioned area rather than the support payments for brood cattle and calf supports in provinces of The Southeastern Anatolia Project (GAP), The Eastern Anatolia Project (DAP), The East Blacksea Project (DOKAP), Konya Lowland Project (KOP) regions and grants for improving stock breeding can be counted as contributing causes). The effects of forage plants and milk support on animal presence were found negative across the panel. However, the situation changes in some of the regions. When forage plants support payments are analyzed, it is seen that it has a positive effect in TR21, TR22, TR31, TR41, and TRB1 regions. The highest coefficient is of TRB1 region (0.55), among the mentioned regions. It means that a 1.0% increase in forage plants support payments will affect the animal presence positively by 0.55%. Studies in the literature are commonly aimed at analyzing the effects of livestock supports on forage plant production. In one of the studies, it is advised that supports should be increased in eastern regions, which have comparative precedence and supports should be maintained and promoted by training works [
19]. This study, similar to ours, emphasizes regional differences. In another study, it is determined that forage plant supports are highly important for the production and the continuity of the production and the permanency of the support payments will enable the enterprises of the region to increase their alfalfa and koronga production [
28]. Taking animal feed as the most important expenditure item in stock breeding, it seeems inevitable that forage plants support payments will directly promote animal feed production and thereby animal presence. As a matter of fact, a field study aimed at analyzing the relationship between forage plant support and stock breeding businesses found out that there is a significant relationship between animal population of the enterprises and the increment rate of the population after forage plants support payments [
18].
The highest positive effect in milk support also belongs to TRB1 region. Accordingly, it can be said that a 1.0% increase in milk support payments will affect the animal presence positively by 1.62%. Another study, aimed at researching the effects of livestock supports, made and economic comparison of the effects of livestock support policies on the incomes of improved and traditional dairy cattle breeding enterprises. The shares of livestock supports were stated as 15.50% for improved enterprises, and 10% for traditional enterprises, and it is expressed that livestock supports used in milk cattle breeding enterprises have an important effect on their gross income [
17].
The effect of brood cattle support payments on animal presence is found positive (0.08) in the panel. It means a 1.0% increase in support payment per animal will increase animal presence by 0.08%.
It is important to evaluate both the culture and hybrid races as brood cattle support payments are given for both. It can be clearly seen in the exemplified regions in
Table 5 that the utilization rates are different for regions even though the payments are identically available for all of the regions. TR22 region took a 9.46% share from support payments with its 280 thousand animals, whereas the share of TRA2 region is 1.20% with 357 thousand animals in 2004. In 2014, TR22 region took a share of 10% with 720 thousand animals, whereas TRA2 region’s share was 3% with 994 thousand animals. The situation is similar for other eastern regions. On the other hand, while it showed a 63% increase in culture and hybrid animal presence from 2004 to 2014 but its share in the support payments decreased throughout the years.
It is clear that the purpose of the requirements for brood cattle and calf support payments is to provide the improvement of animal presence in Turkey on races of good quality and fertility and to increase the animal presence accordingly. It can be said that the reason for the utilization rate differences among regions despite the same standard requirements arises from the incompliance with the “brood cattle support” requirements which are “cattle should be from either culture or hybrid race” and the requirement of “artificial insemination” (this support was applied between the years 2008 and 2016. Brood cattle support and artificial insemination were repealed from the supports after 2016). It is a known fact that native cattle race is dominant in quantity in the eastern and some of the central regions. The reason for those regions’ lower share in support payments may or may not arguably be the dominancy of the native race animal population over the supported races.
In addition to these, it is known that there are differences among the regions in terms of meat and milk yield. The average milk yield of native race is 1313 kg, of culture hybrid is 2725 kg and of culture race is 3869 kg in 2015 in Turkey, and this is significant data for the understanding of the yield difference of culture race. The advantage of yield in meat and milk of the culture race brings the necessity for the farmers of the region to be specialized in stock raising. In a study carried out to make an inter-regional comparison, they selected Northeast Anatolian region for having the largest animal presence and Marmara region for its highest yield of meat and milk. A questionnaire study was performed in both of the regions. The study showed that there are important differences between the two regions in terms of farmers and enterprise structures. The educational levels of the farmers in Western Marmara region were found to be higher than the educational levels of North-eastern Anatolian farmers. The study indicated that the situation is a promoter for the farmers to be open to new applications and the education level of the farmers is an important parameter for modern stock breeding. In the study, it is determined that, in terms of supports, the farmers in Marmara region make more use of the artificial insemination, calf, forage plants support, and milk incentive pay than the farmers in Northeast Anatolian region [
19].
4. Conclusions
The support payment for brood cattle, which started in 2009 and was adopted as basic support and paid as between 250 and 350 Turkish Liras per animal, was revoked by the council of ministers’ decision by the year of 2016 [
5]. Although total animal support affects animal presence in the panel, it can be said that the cancellation is in place. It is clear that geographically different regions have similar values in terms of animal presence, but they do not utilize support payments at the same ratio.
Calf support has gained the essence of being the basic support after the revoke of the brood cattle support. There was a necessity of artificial insemination and related conditions in calf support payments in 2015 and before, but these requirements were revoked in 2016 by the council of ministers’ decision. While there was a payment of 75 Turkish Liras for each calf born from artificial insemination and meat races, it has been specified in 2016 that any calf from any insemination will be paid 350 Turkish Liras with the condition of living at least four months in the enterprise they were born and having scheduled vaccinations [
5,
6]. It can be said that the revoke of the artificial insemination condition and breeders’ getting five times more calf support payment will be beneficial for the breeder. However, by permitting hybridization of different races and revoking artificial insemination, doubts concerning degeneration in culture races and rehabilitation works made for years investing a certain amount of funds and time become a current issue.
In milk support, there are no specific conditions for producers. The only provision is that by the year 2016, producers who did not perform contract production and got their contract recorded under the milk recording system would not get raw milk support payment. This applicationseems important for improving contract production and reducing fluctuations in milk prices.
Forage Plant Support is another important livestock support item. In Turkey, 30-100 Turkish Liras of support payment was paid to forage plant farmers for a decare of forage plants according to the variety of the plant. However, breeders found the payment insufficient and they expected a regulation of the feed prices or even getting feed support in kind. In this sense, a tax exception for added value tax started to be applied in 2016, which is 8% for feed and 18% for fertilizer. This is an important step both for feed producers and livestock breeders.
The conclusion of this study is that even though the livestock support payments are equally applied for all the regions in Turkey, the utilization rate of western regions is higher, and it is notably lower in eastern and some central regions. Support payments are given to enterprises fulfilling the conditions and it is expected from them to show the reflex of receiving those payments. It will be considerably true to say that the reasons for western regions to get higher shares from the support payments are their well-organized associations and county/province organizations besides conscious breeders of high education level and agricultural income. Breeders in eastern regions and in central regions like TR72 and TR83 are incapable of and indifferent to the conditions for the support payments. Their low educational level and agricultural income, lower yield level of owned animal presence, resistance to being members of any organization, and finding artificial insemination services unnecessary and costly can be counted as the reasons for this situation. Another dimension of the situation is that the producer/breeder associations and agricultural organizations do not show enough sensitivity to these problems in the regions. It is clear that some regulations are crucial to improve stock breeding throughout the country and to enable the equal distribution of the support payments. Educational activities and publications about fulfilling the conditions of the support payments and accessing the supports should be organized, and obligations for the farmers should be set to attend those activities and to get attendance certificates. It will also be a cornerstone in the way to modern stock breeding.


