Scenarios of Sustainable Fishing in the Zapatosa Marsh (Colombia) Simulated with a System Dynamics Model

 , and
, and 
Abstract
:1. Introduction
System Dynamics in Fisheries and Fishing Systems
2. Materials and Methods
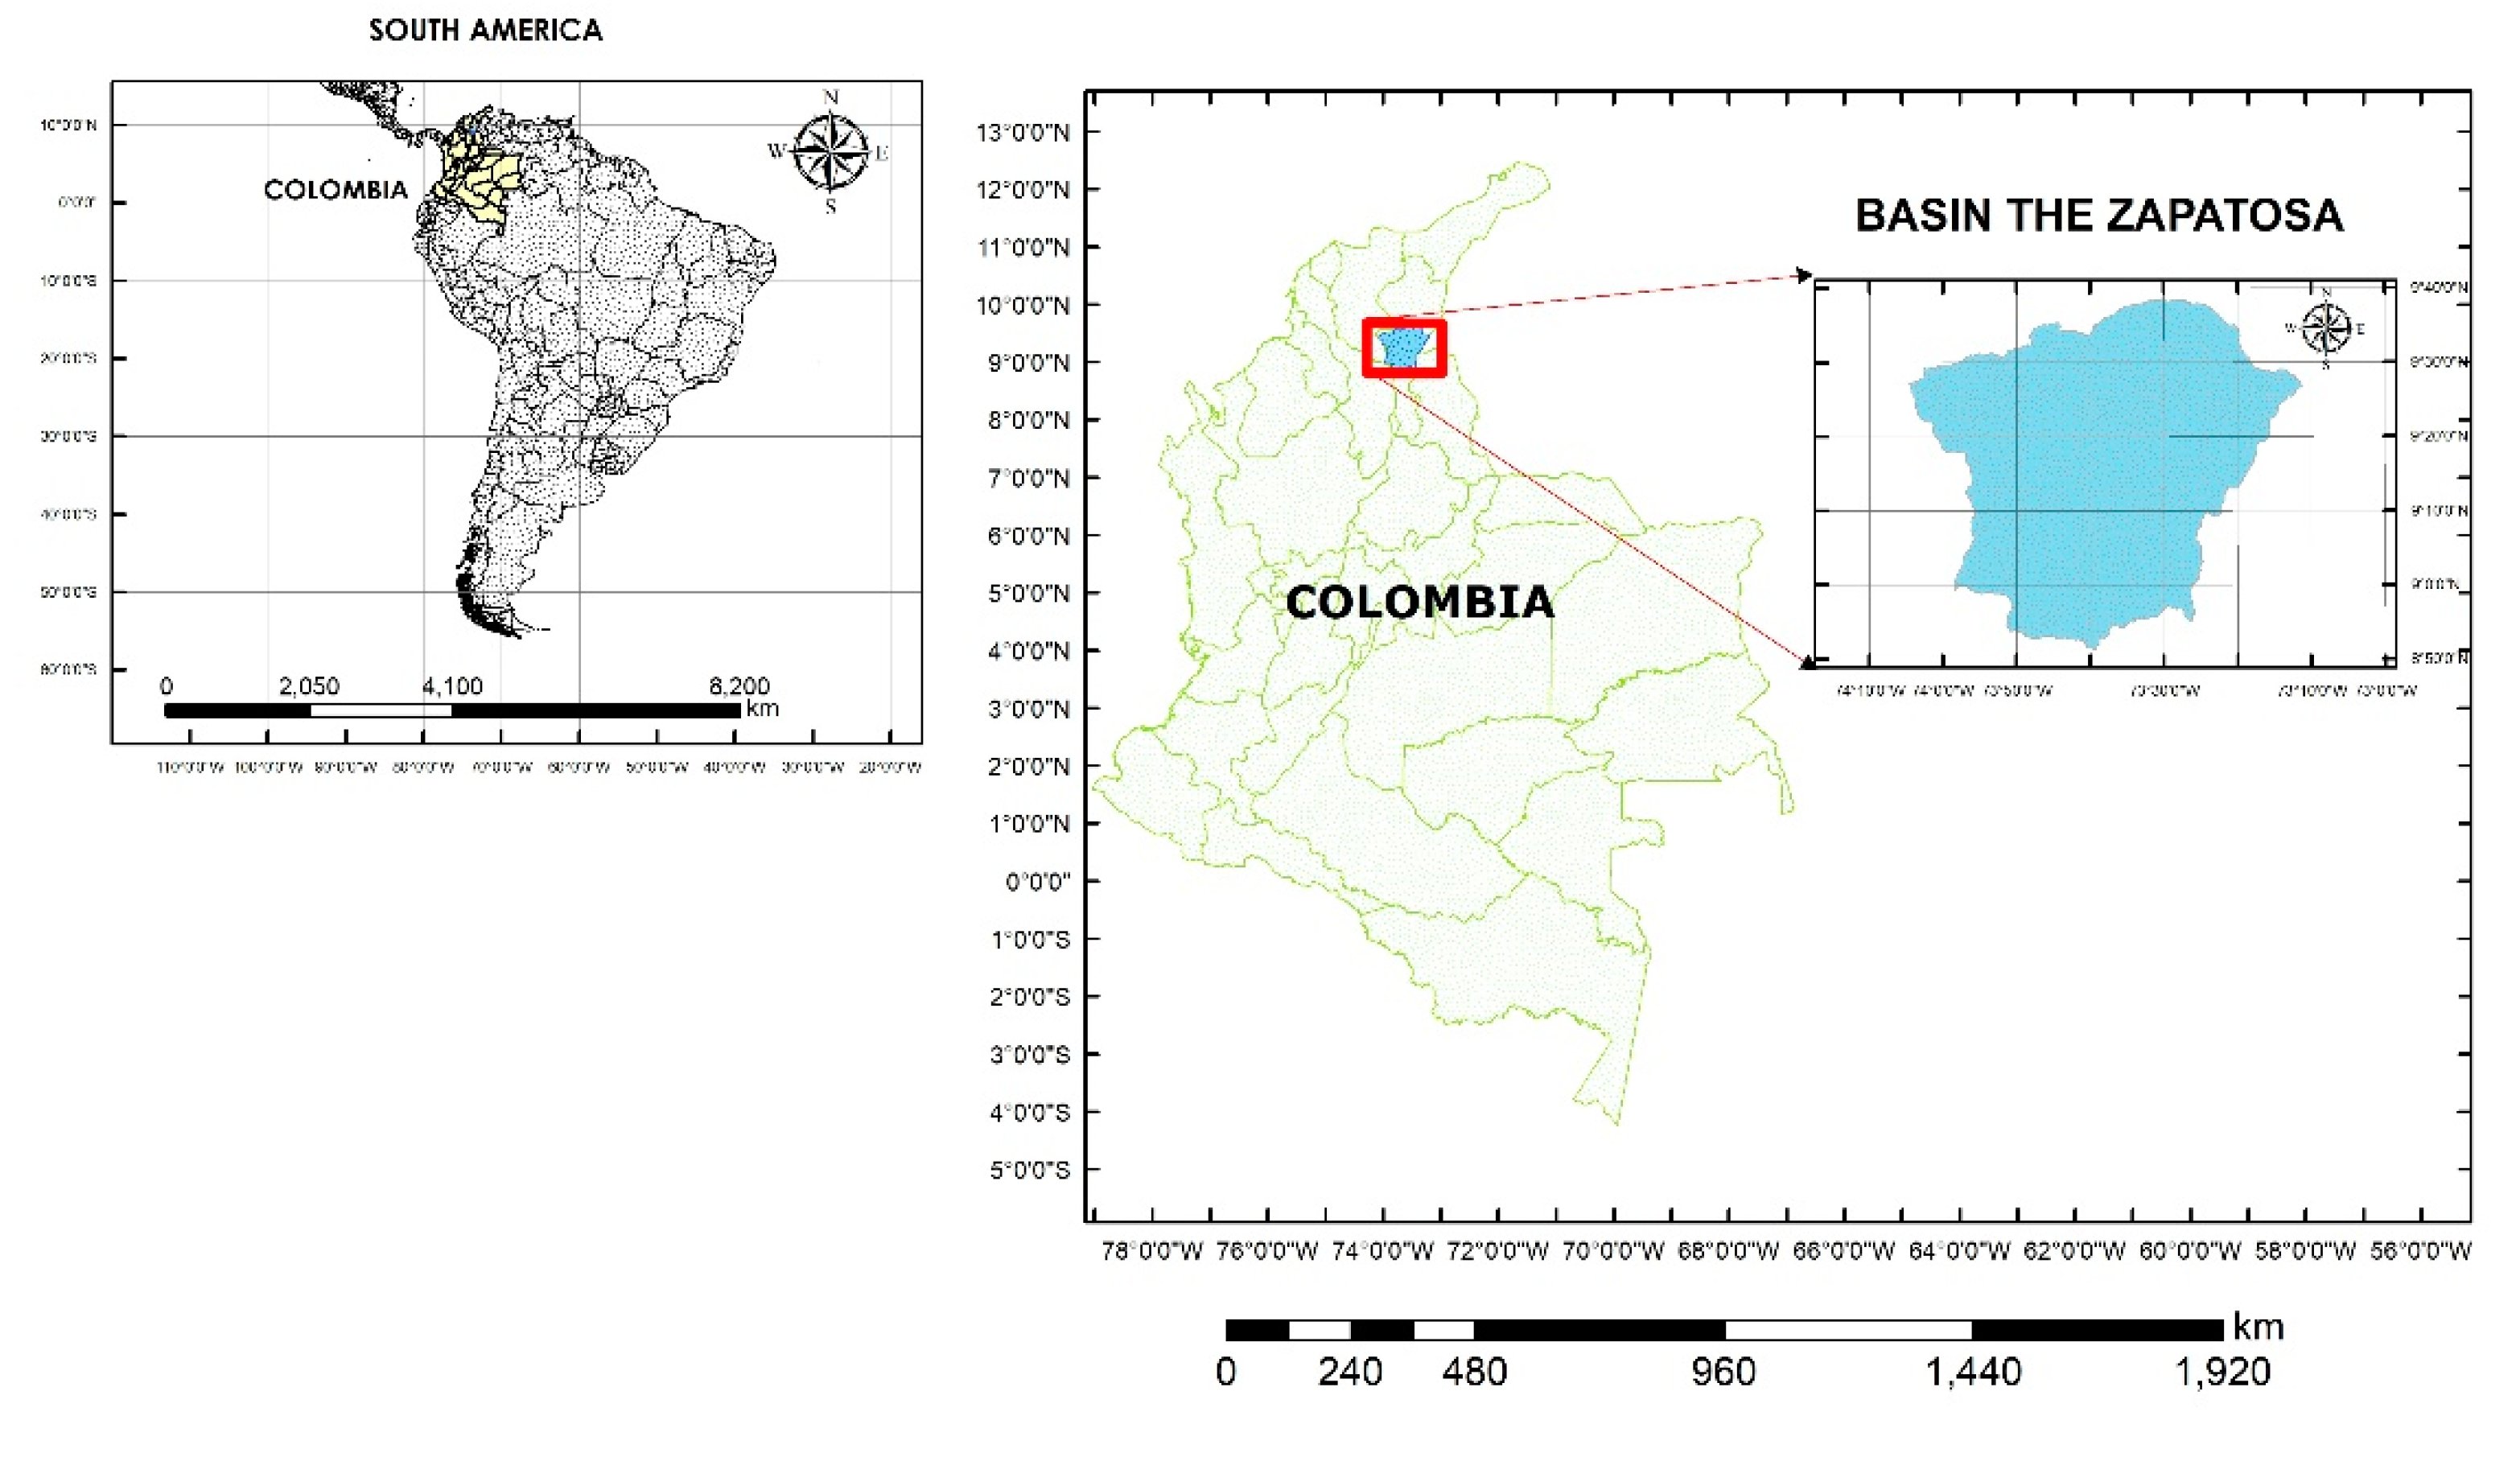
2.1. Area of Study
2.2. Information Colletion
2.3. Model Building
2.4. Parameterization and Calibration
2.5. Model Simulations and Scenarios
3. Results and Discussion
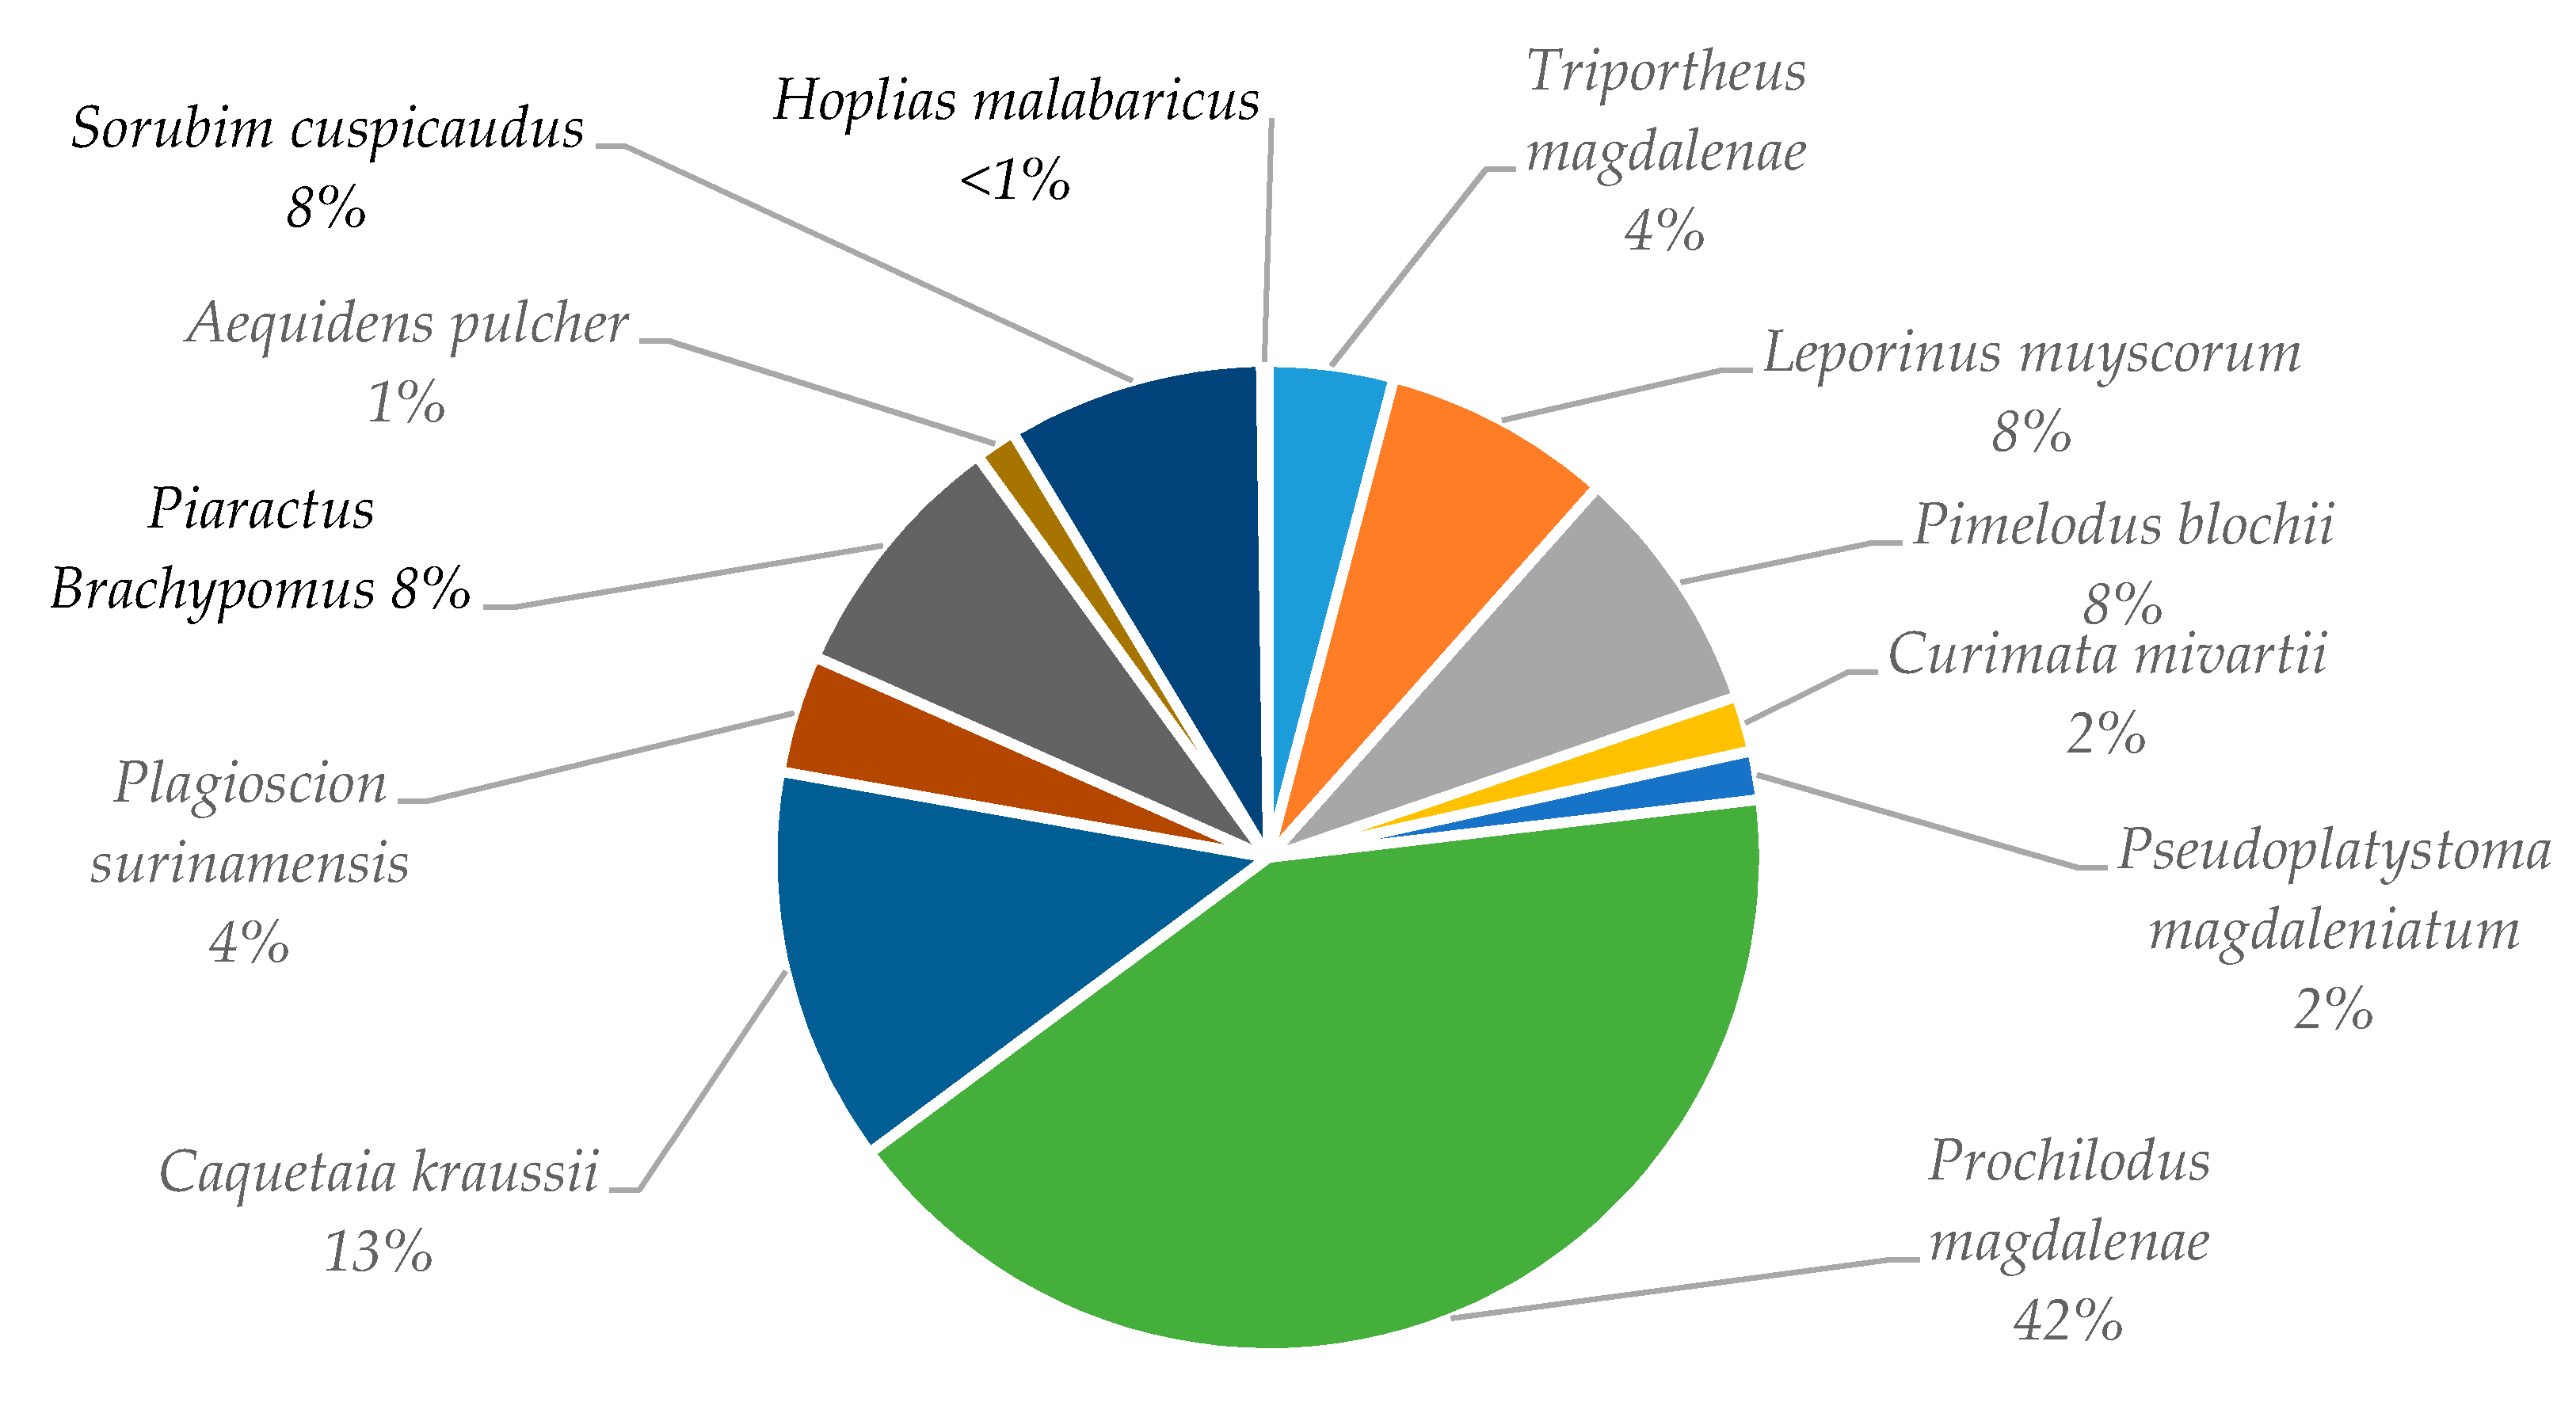
3.1. Survey
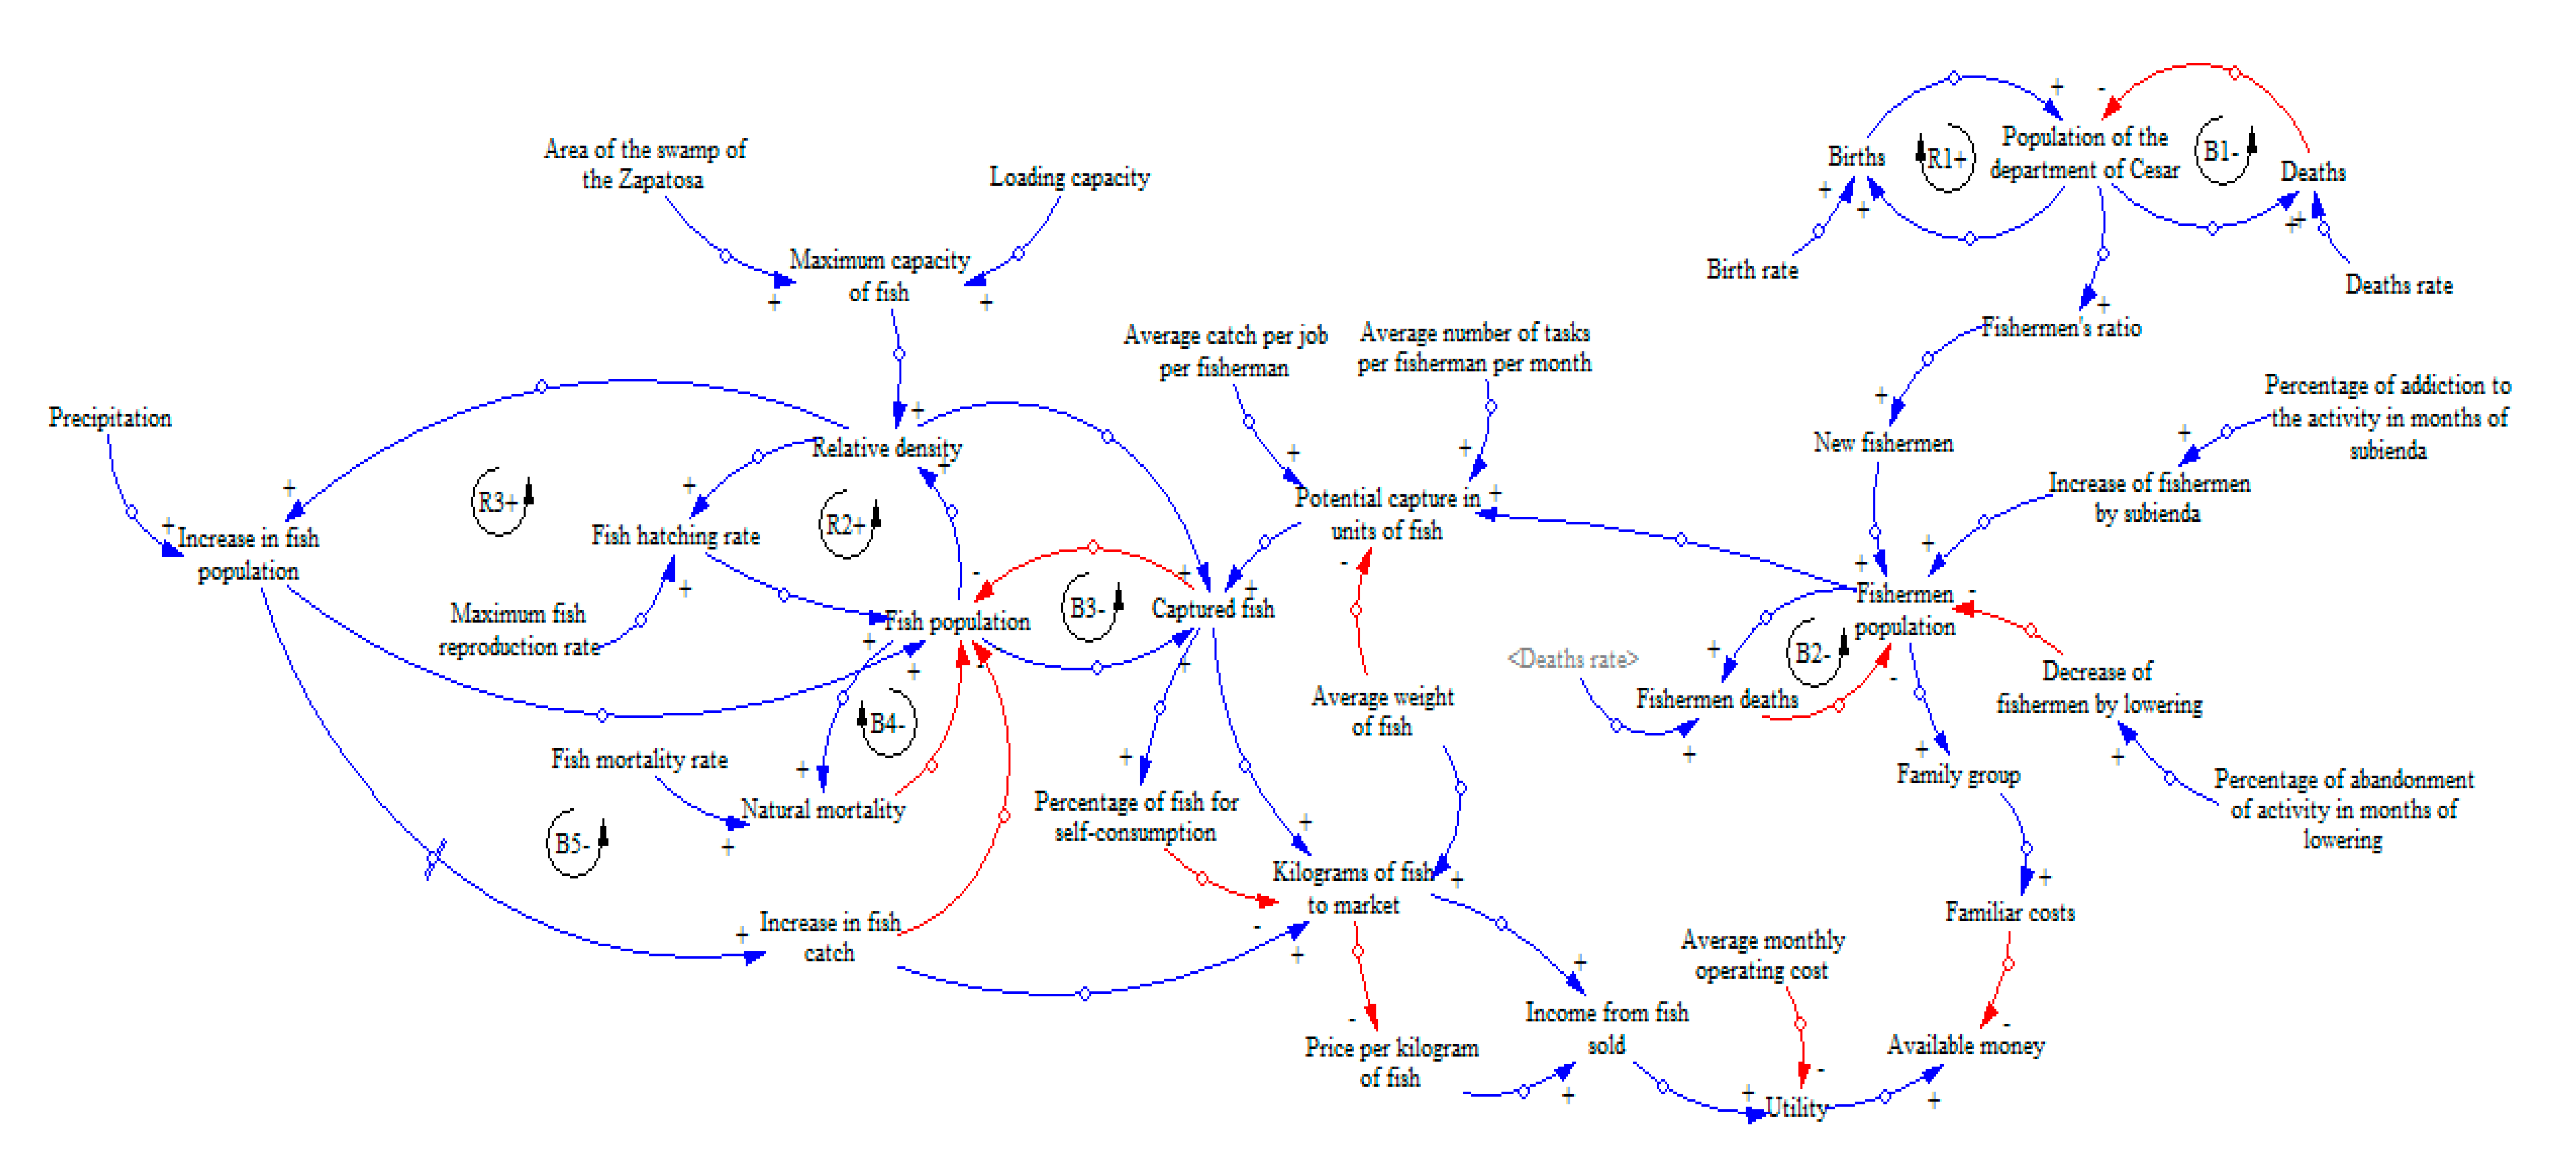
3.2. Causal Diagram
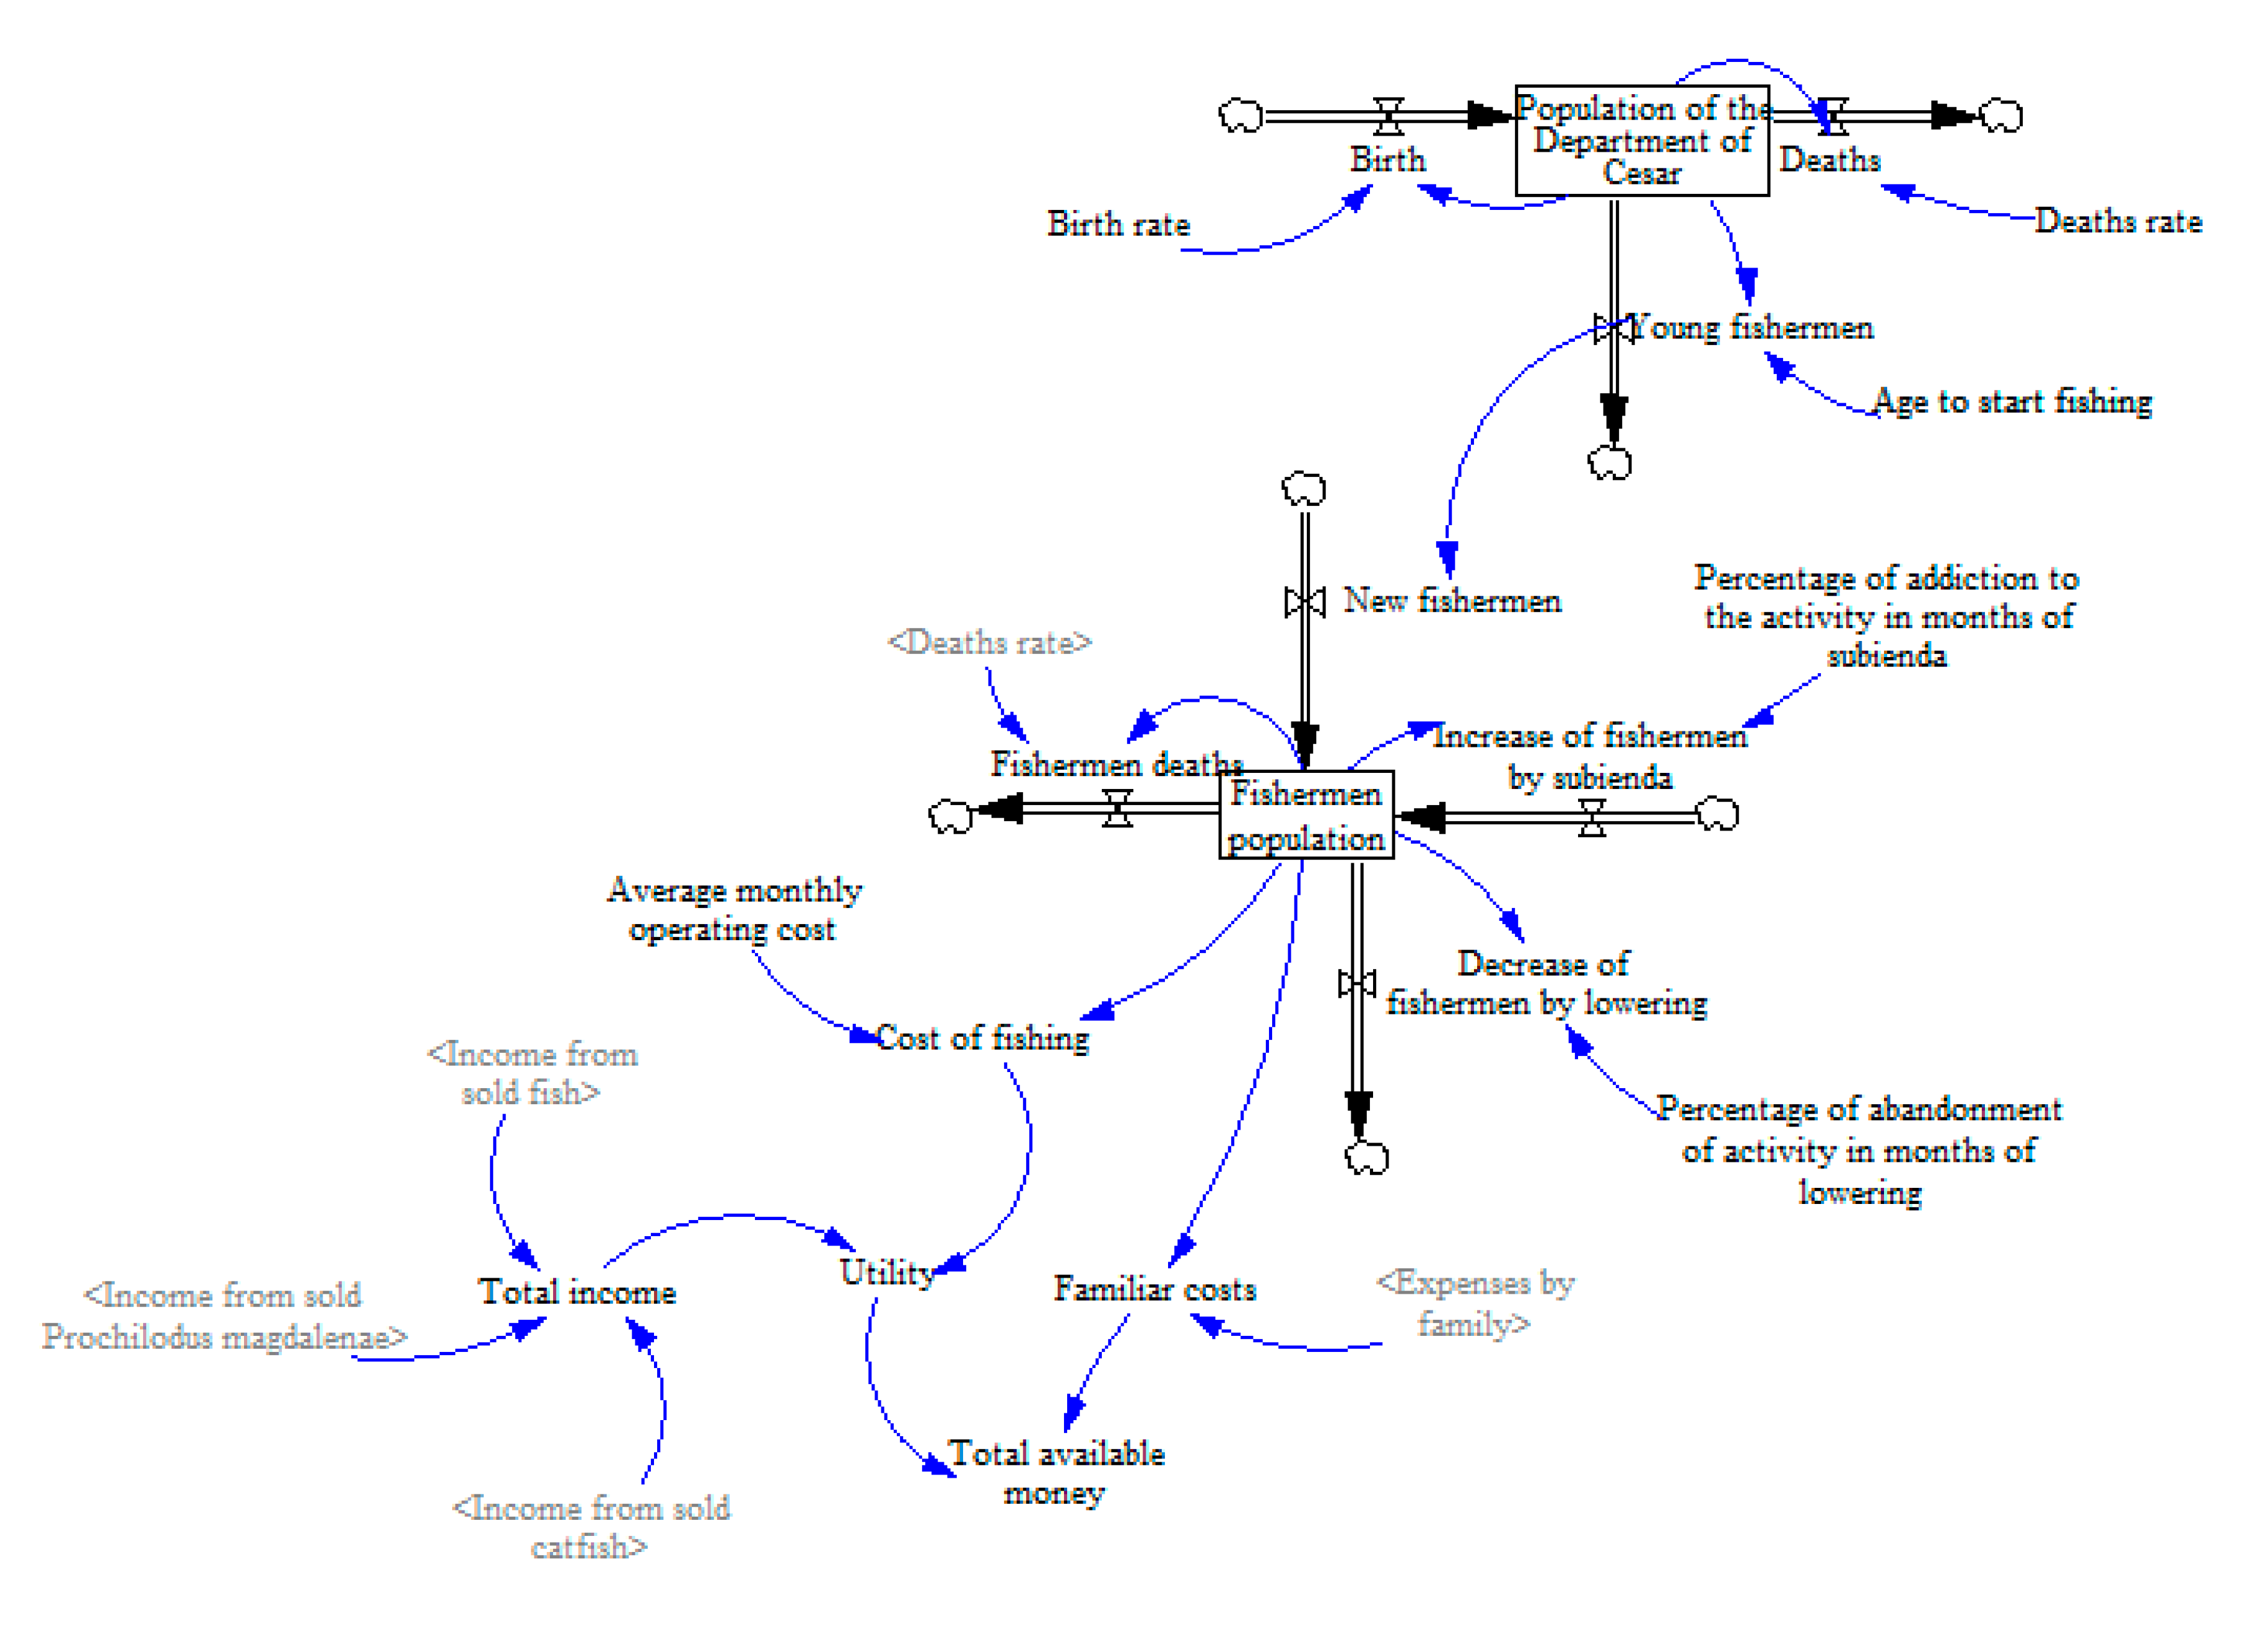
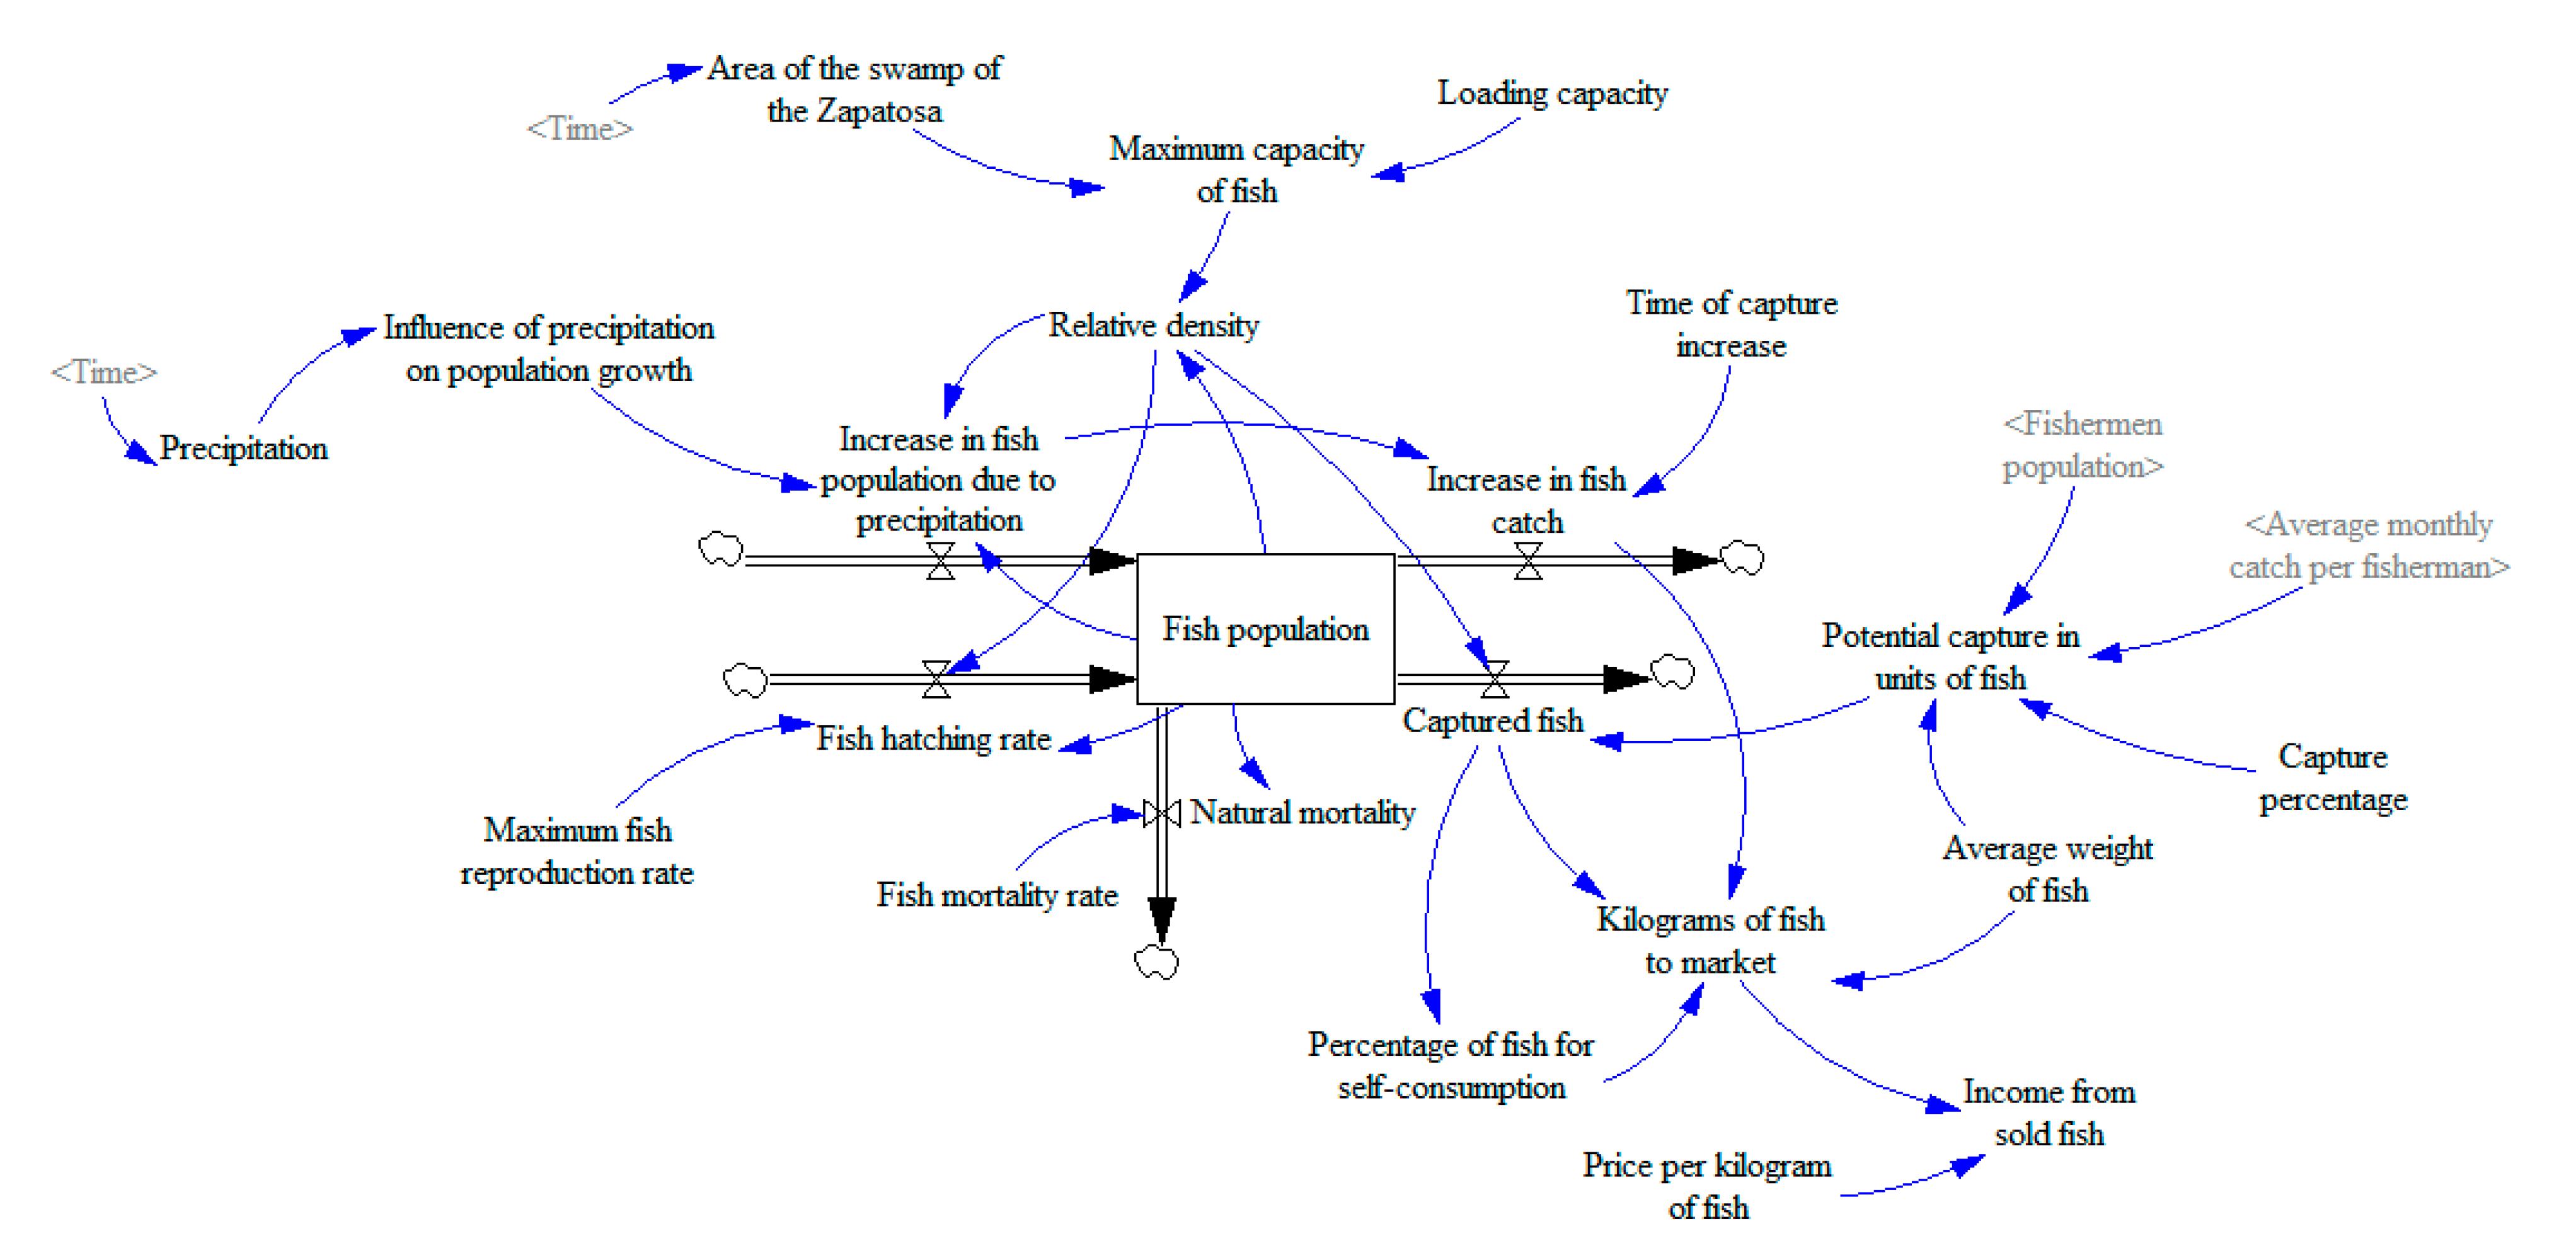
3.3. Stock and Flow Diagrams
3.4. Parameterization and Calibration
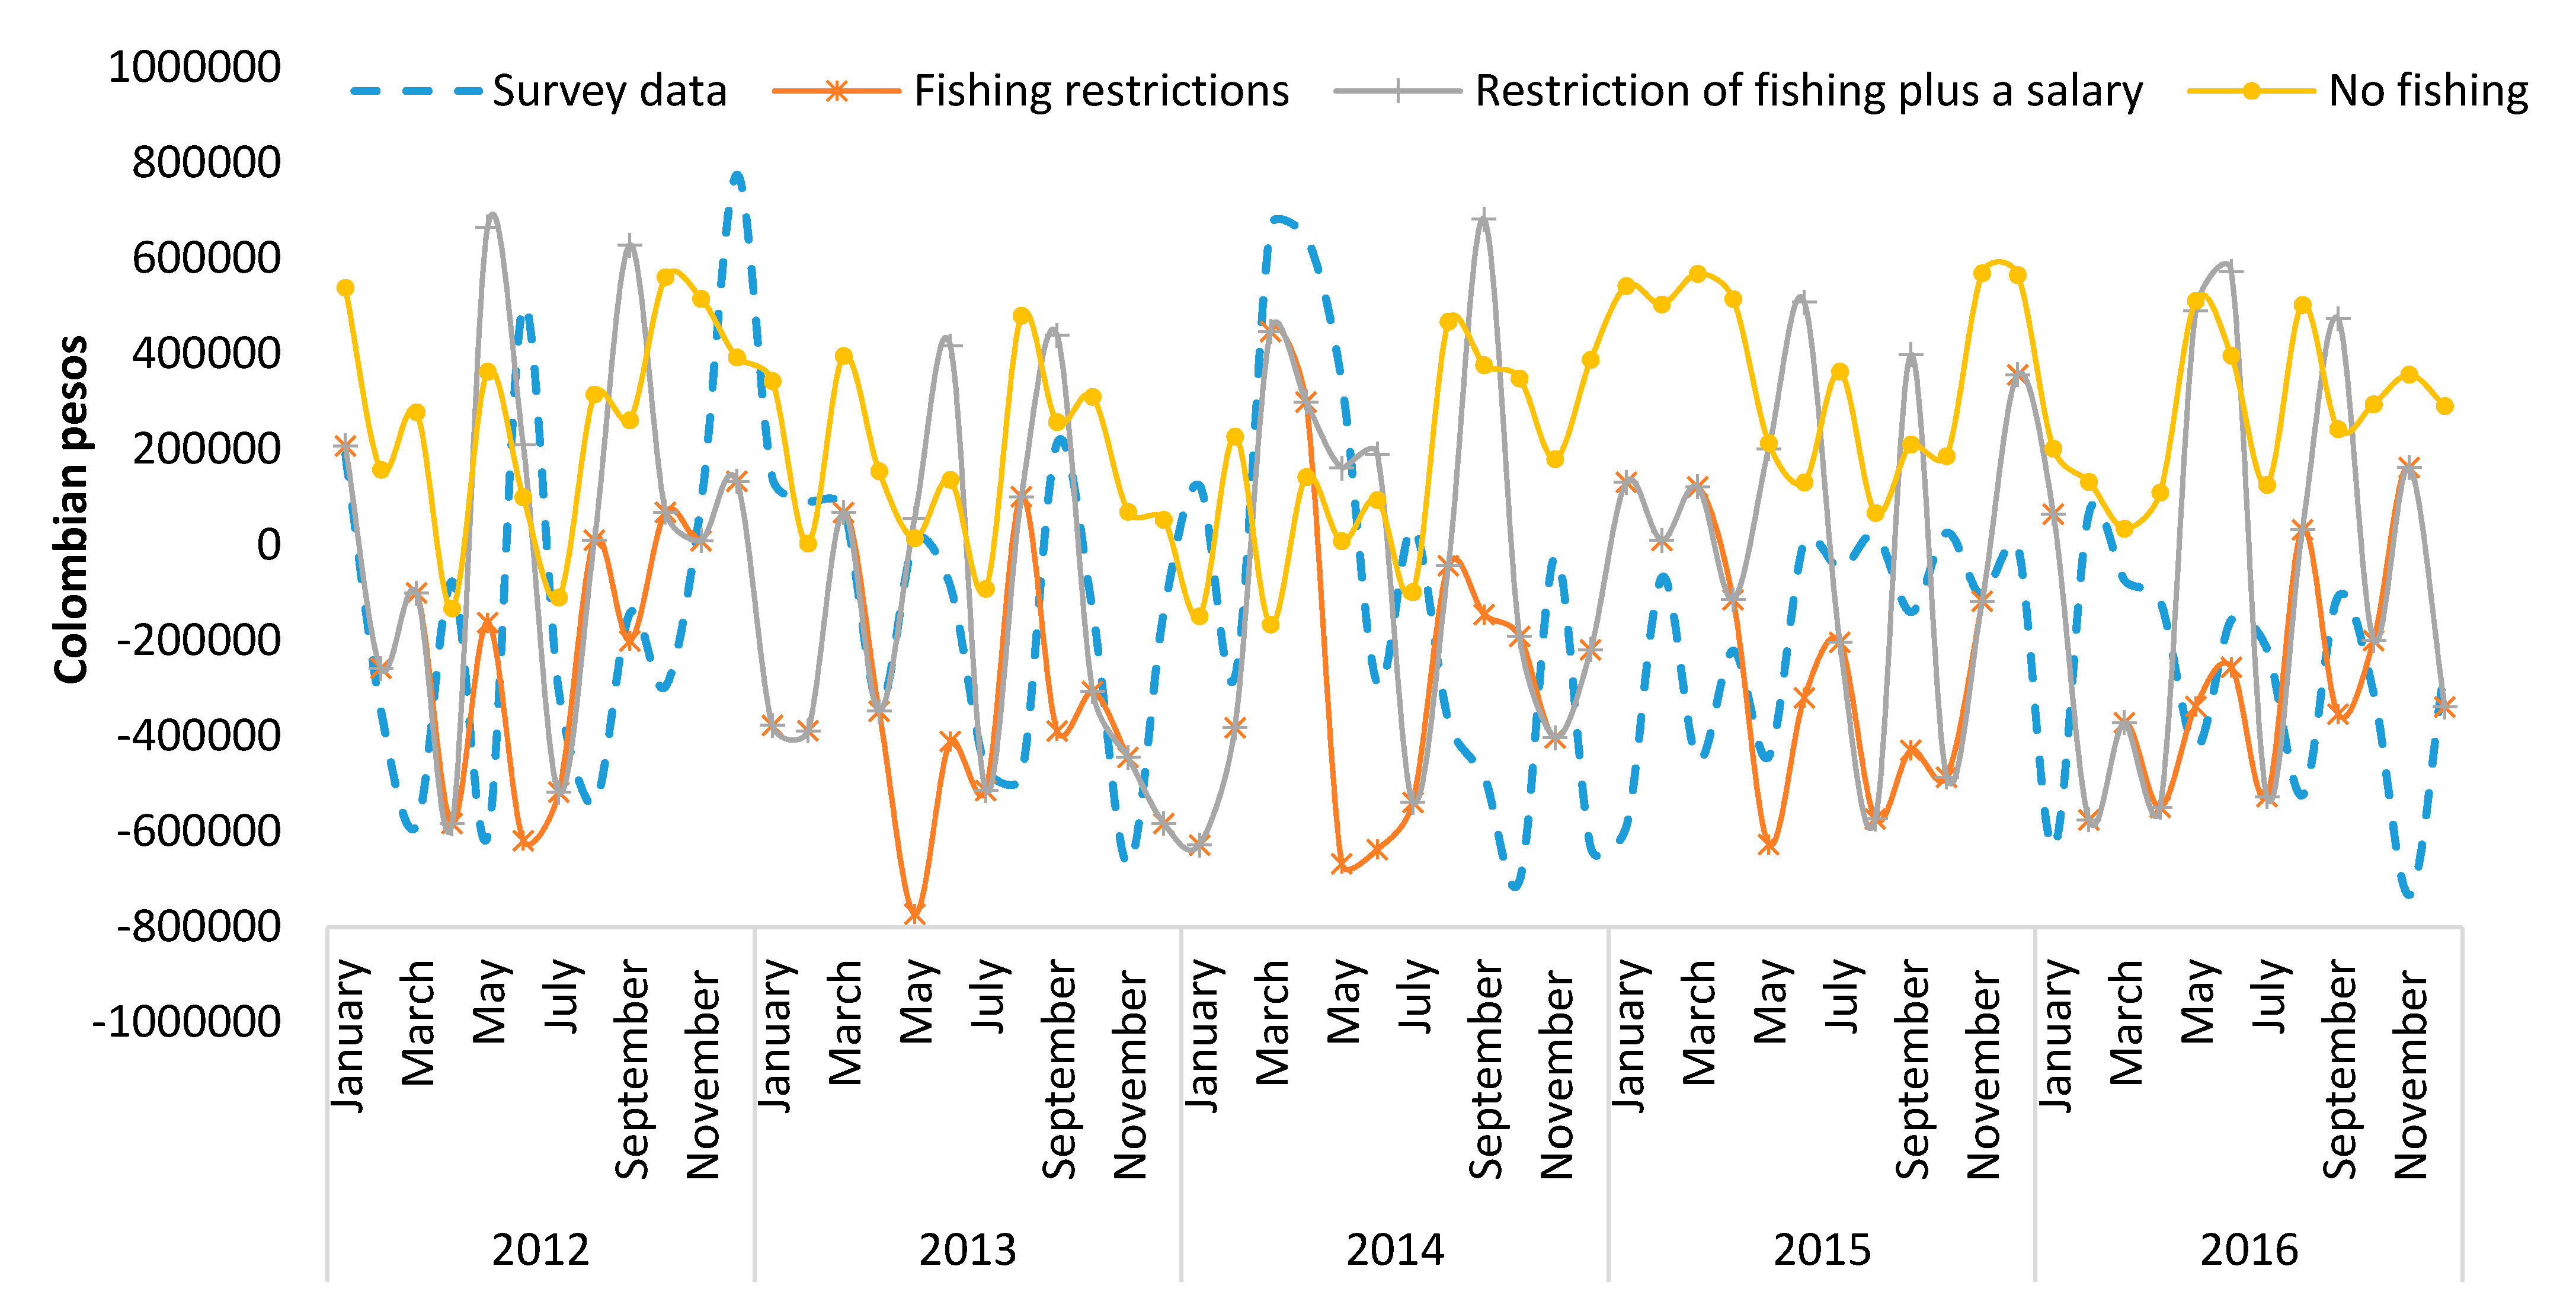
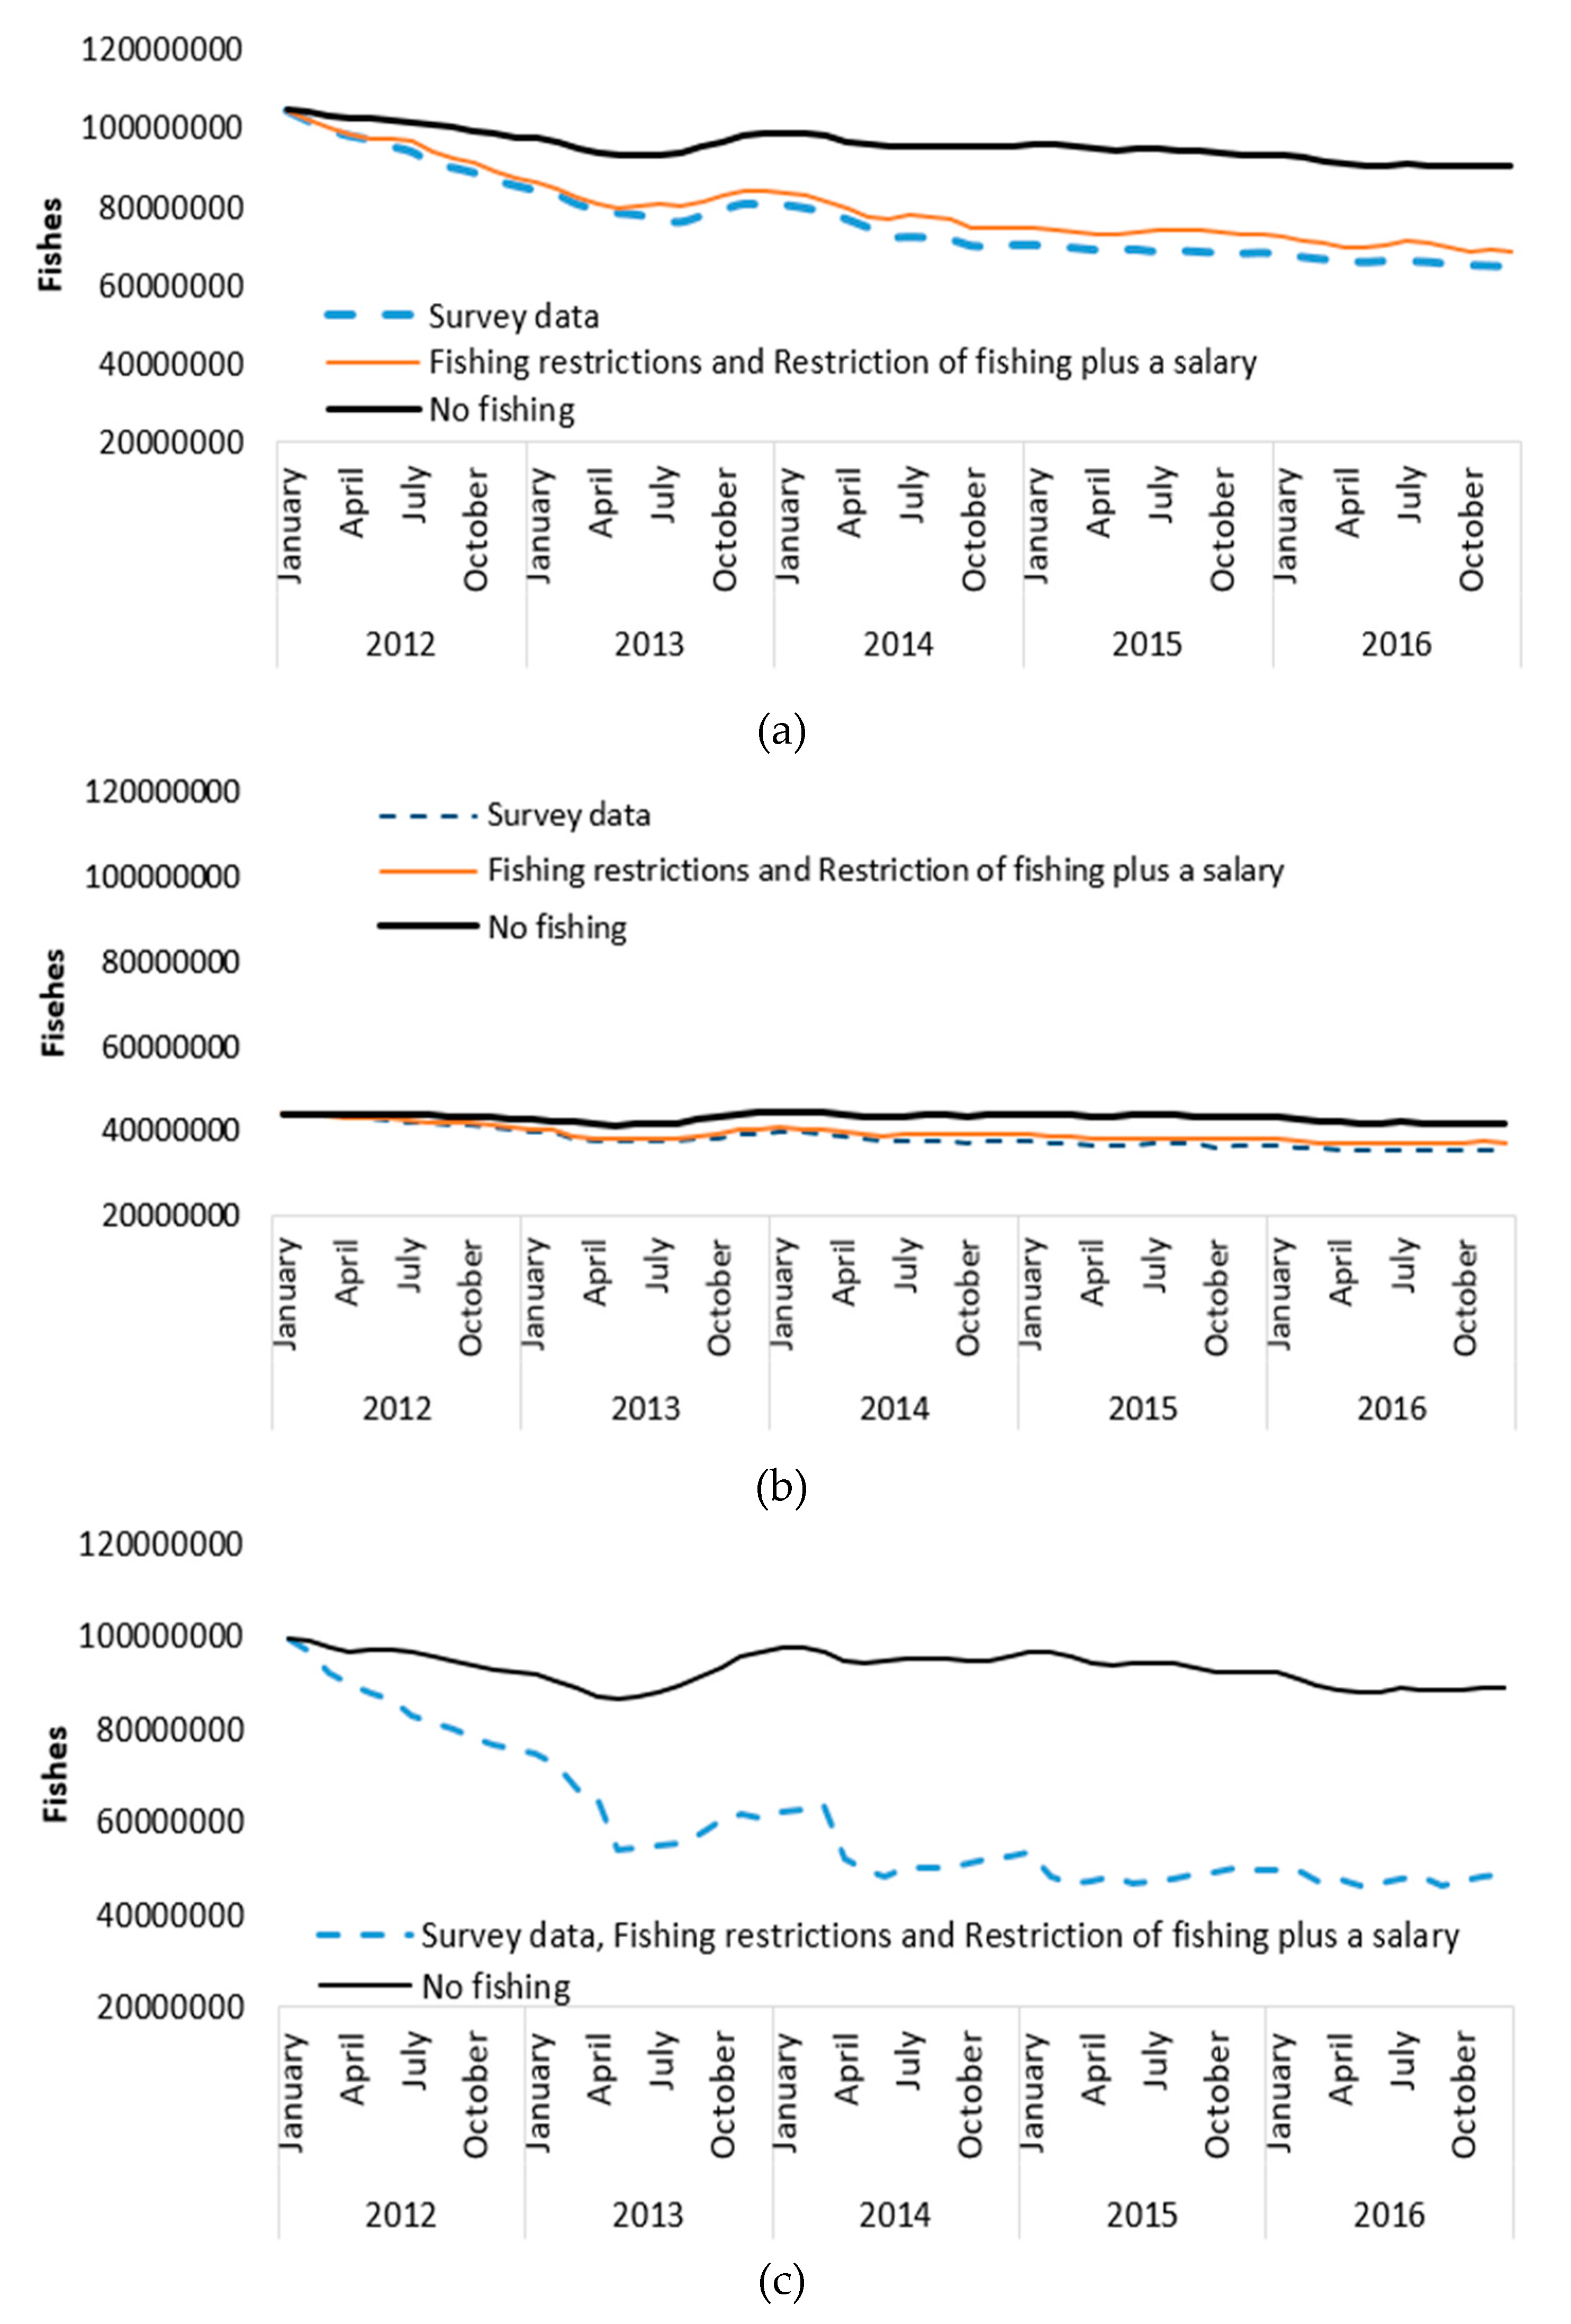
3.5. Simulated Scenarios
4. Conclusions
Author Contributions
Funding
Conflicts of Interest
Appendix A

| Variable | Type | Equations | Variable | Type | Equations |
|---|---|---|---|---|---|
| Population of the Departament of Cesar | Stock | INTEG (Birth-Deaths-Young fishermen) | Population of other species | Stock | INTEG (Increase in fish population due to precipitation + Fish hatching rate − Natural mortality − Captured fish − Increase in fish catch) |
| Fishermen population | Stock | INTEG (New fishermen+Increase of fishermen by “subienda” − Fishermen deaths − Decrease of fishermen by lowering) | Population of Prochilodus magdalenae | Stock | INTEG (Increase in Prochilodus magdalenae opulation due to precipitation + Prochilodus magdalenae catching rate − Natural mortality of Prochilodus magdalenae − Captured Prochilodus magdalenae − Increase in Prochilodus magdalenae catch |
| Birth | Flow | Population of the demartament of Cesar * Birth rate | Population of catfish | Stock | INTEG (Increase in catfish population due to precipitation + Catfish hatching rate-Natural mortality of catfish-Captured catfish-Increase in catfish catch) |
| Deaths | Flow | Population of the demartament of Cesar * Deaths rate | Average monthly catch per fisherman | Auxiliary | Average catch per task per fisherman * Average number of operations per fisherman per month |
| Young fishermen | Flow | (Population of the demartament of Cesar * 0.0024)/ Age to start fishing | Potential capture in units of fish | Auxiliary | ((Average monthly catch per fisherman * Capture percentage)/Average weight of fish) * Fishermen population |
| Increase of fishermen by subienda | Flow | PULSE TRAIN(11, 3, 12, 36) * Fishermen population * Percentage of addiction to the activity in months of subienda | Increase in fish catch | Flow | DELAY FIXED (Increase in fish population due to precipitation, Time of capture increase, 0) |
| Decrease of fishermen by lowering | Flow | PULSE TRAIN(3, 4, 12, 36) * Fishermen population * Percentage of abandonment of activity in months of lowering | Maximum capacity of fish | Auxiliary | Loading capacity * Area of the swamp of the Zapatosa |
| Familiar costs | Auxiliary | Expenses by family * Fishermen population | Relative density | Auxiliary | Population of other species /Maximum capacity of fish |
| Cost of fishing | Auxiliary | Fishermen population * Average monthly operating cost | Fish hatching rate | Flow | Maximum fish reproduction rate * Population of other species * (1 − Relative density) |
| Total income | Auxiliary | Income from sold catfish+Income from sold Prochilodus magdalenae+Income from sold fish | Increase in fish population due to precipitation | Flow | Influence of precipitation on population growth * Population of other species *(1 − Relative density) |
| Utility | Auxiliary | Total income-Cost of fishing | Natural mortality | Flow | Population of other species * Fish mortality rate |
| Total available money | Auxiliary | Utility-Familiar costs | Captured fish | Flow | Potential capture in units of fish * Relative density |
| Income by fisherman | Auxiliary | Total income / Fishermen population | Kilograms of fish to market | Auxiliary | ((Captured fish+Increase in fish catch) − “Percentage of fish for self-consumption”) * Average weight of fish |
| Utility by fisherman | Auxiliary | Income by fisherman-Average monthly operating cost | Income from sold fish | Auxiliary | Kilograms of fish to market * Price per kilogram of fish |
| Money available by fisherman | Auxiliary | Money for family expenses-Expenses by family | Price per kilogram of fish | Auxiliary | RANDOM NORMAL ( 400, 6000, 2297.7, 821.4, 0) |
| Expenses by family | Auxiliary | RANDOM UNIFORM (250,000, 1,000,000, 0 ) | Percentage of fish for self-consumption | Auxiliary | Captured fish*0.083 |
| Potential capture in units of Prochilodus magdalenae | Auxiliary | ((Average monthly catch per fisherman * Prochilodus magdalenae catch percentage)/Average weight of Prochilodus magdalenae) * Fishermen population | Average weight of fish | Auxiliary | RANDOM NORMAL (0.006, 0.95, 0.10002, 0.0403, 0) |
| Increase in Prochilodus magdalenae catch | Flow | DELAY FIXED (Increase in fish population due to precipitation, Time of capture increase, 0) | Potential capture in units of catfish | Auxiliary | ((Average monthly catch per fisherman*Catfish catch percentage)/Average weight of catfish) * Fishermen population |
| Maximum Prochilodus magdalenae capacity | Auxiliary | Loading capacity of Prochilodus magdalenae * Area of the swamp of the Zapatosa | Increase in catfish catch | Flow | DELAY FIXED (Increase in fish population due to precipitation, Time of capture increase, 0) |
| Prochilodus magdalenae Relative density | Auxiliary | Population of Prochilodus magdalenae / Maximum Prochilodus magdalenae capacity | Maximum catfish capacity | Auxiliary | Loading capacity of catfish * Area of the swamp of the Zapatosa |
| Prochilodus magdalenae hatching rate | Flow | Maximun fish reproduction rate of Prochilodus magdalenae * Population of Prochilodus magdalenae * (1 − Prochilodus magdalenae Relative density ) | Catfish relative density | Auxiliary | Population of catfish / Maximum catfish capacity |
| Increase in Prochilodus magdalenae population due to precipitation | Flow | Influence of precipitation on population growth * Population of Prochilodus magdalenae * (1 − Prochilodus magdalenae Relative density ) | Catfish hatching rate | Flow | Maximun fish reproduction rate of catfish * Population of catfish *(1 − catfish relative density ) |
| Natural mortality of Prochilodus magdalenae | Flow | Population of Prochilodus magdalenae * Mortality rate of Prochilodus magdalenae | Increase in catfish population due to precipitation | Flow | Influence of precipitation on population growth * Population of catfish * (1 − catfish relative density) |
| Captured Prochilodus magdalenae | Flow | Potential capture in units of Prochilodus magdalenae * Prochilodus magdalenae Relative density | Natural mortality of catfish | Flow | Population of catfish * Mortality rate of catfish |
| Kilograms of Prochilodus magdalenae to market | Auxiliary | ((Captured Prochilodus magdalenae + Increase in Prochilodus magdalenae catch) − “Percentage of Prochilodus magdalenae for self-consumption”) * Avarage weight of Prochilodus magdalenae | Captured catfish | Flow | Potential capture in units of catfish* catfish relative density |
| Income from sold Prochilodus magdalenae | Auxiliary | Kilograms of Prochilodus magdalenae to market * Price per kilogram of Prochilodus magdalenae | Kilograms of catfish to market | Auxiliary | ((Captured catfish+Increase in catfish catch) − “Percentage of catfish for self-consumption”) * Avarage weight of catfish |
| Price per kilogram of Prochilodus magdalenae | Auxiliary | RANDOM NORMAL (1000, 4000, 2461.6, 585.1, 0) | Income from sold catfish | Auxiliary | Kilograms of catfish to market * Price per kilogram of catfish |
| Percentage of Prochilodus magdalenae for self-consumption | Auxiliary | Captured Prochilodus magdalenae * 0.083 | Price per kilogram of catfish | Auxiliary | RANDOM NORMAL (800, 4000, 2141.25, 730.5, 0) |
| Average weight of Prochilodus magdalenae | Auxiliary | RANDOM NORMAL (0.119, 0.558, 0.226, 0.0741, 0) | Percentage of catfish for self-consumption | Auxiliary | Captured catfish * 0.083 |
| Average weight of catfish | Auxiliary | RANDOM NORMAL (0.136, 2.25, 0.50653, 0.2965, 0) |
References
- Incoder. Pesca y Acuicultura Colombia 2006; Incoder: Bogotá, Colombia, 2007; p. 55. [Google Scholar]
- Corporación Autónoma Regional del Sur de Bolívar; CSB, (Coordinación General). Plan de Manejo Integral de los Humedales, Subregión de la Depresión Momposina y Cuenca del Río Sinú; Ministerio del Medio Ambiente, CBS, Corpomojana, Corantioquia, Corpomag y CVS, Bolívar: Magangué, Colombia, 2002. [Google Scholar]
- Gallardo, N. Auntoridad Nacional de Acuicultura y Pesca (AUNAP); Comunicación Personal: Barranquilla, Colombia, 2018. [Google Scholar]
- Rangel, J. Informe Final de Actividades. Estudio de Inventario de Fauna, Flora, Descripción Biofísica y Socioeconómica y Línea de Base Ambiental Ciénaga de Zapatosa; Corpocesar-Universidad Nacional de Colombia: Bogotá, Colombia, 2007. [Google Scholar]
- Alcaldía de Chimichagua. Plan de Desarrollo Municipal 2006–2007; Un territorio en marcha, Alcaldía de Chimichagua: Chimichagua, Colombia, 2006; p. 38. [Google Scholar]
- Viloria-de-la-Hoz, J. Economía Extractiva y Pobreza en la Ciénaga de Zapatosa; No. 103.; Banco de la República-Centro de Estudios Económicos Regionales (CEER): Cartagena de indias, Colombia, 2008; pp. 5–16. [Google Scholar]
- Paz, A. Complejo Cenagoso de Zapatosa: Nuevo Sitio Ramsar de Colombia. 2008. Available online: https://es.mongabay.com/2018/04/zapatosa-nueva-area-protegida-colombia/ (accessed on 29 April 2019).
- Morelo, L. Caracterizaciones Biológicas. Informe Final-Producto Doce-Requerido Para el Tercer Desembolso del Convenio de Cooperación no. 15-12-067-002 Entre el Instituto de Investigación de Recursos Biológicos Alexander Von Humboldt y la Fundación Fluvial. 2015. Available online: http://repository.humboldt.org.co/bitstream/handle/20.500.11761/9345/11Fluvialia_Cienaga_Zapatosa.pdf?sequence=1&isAllowed=y (accessed on 8 April 2019).
- Senge, P. The Fifth Discipline; DOUBLEDAY: New York, NY, USA, 1990. [Google Scholar]
- Sterman, J.D. Business Dynamics: Systems Thinking and Modeling for a Complex World, 6nd ed.; Jeffrey, J., Shelsfud, J.J., Eds.; McGraw-Hill: New York, NY, USA, 2000. [Google Scholar]
- Meadows, D. Chapter One: The Basics. Thinking in Systems; Chelsea Green: White River Junction, VT, USA, 2008. [Google Scholar]
- McRoberts, K.C. Structure and impact of cattle manure trade in crop-livestock systems of Vietnam. Renew. Agric. Food Syst. 2018, 33, 86–101. [Google Scholar] [CrossRef]
- Dudley, R.G. A basis for understanding fishery management dynamics. Syst. Dyn. Rev. J. Syst. Dyn. Soc. 2008, 24, 1–29. [Google Scholar] [CrossRef]
- Camargo, S.A.F.D.; Petrere, M., Jr. Análise de risco aplicada ao manejo precaucionário das pescarias artesanais na região do reservatório da UHE-Tucuruí (Pará, Brasil). Acta Amazonica 2004, 34, 473–485. [Google Scholar] [CrossRef] [Green Version]
- Fadul, V.O. Modelo Dinámico del Sistema Sociobiológico Ciénaga Grande de Santa Marta. Master’s Thesis, Universidad de los Andes, Bogotá, Colombia, 2008. [Google Scholar]
- Garrity, E.J. System Dynamics Modeling of individual transferable quota fisheries and suggestions for rebuilding stocks. Sustainability 2011, 3, 184–215. [Google Scholar] [CrossRef] [Green Version]
- Martins, J.H.; Camanho, A.S.; Oliveira, M.M.; Gaspar, M.B. A system dynamics model to support the management of artisanal dredge fisheries in the south coast of Portugal. Int. Trans. Oper. Res. 2015, 22, 611–634. [Google Scholar] [CrossRef]
- Cenek, M.; Franklin, M.; Trammell, E.J.; Dahl, S. How will the Kenai fisheries respond to changing environmental conditions: Scenario based studies of coupled socio-ecological systems dynamics using an agent-based model. In Proceedings of the OCEANS–Anchorage, Anchorage, AK, USA, 18–21 September 2017; pp. 1–8. [Google Scholar]
- Storch, L.S.; Glaser, S.M.; Ye, H.; Rosenberg, A.A. Stock assessment and end-to-end ecosystem models alter dynamics of fisheries data. PLoS ONE 2017, 2, e0171644. [Google Scholar] [CrossRef] [PubMed]
- Inomata, S.O.; Gonzalez, A.M.G.O.; Román, R.M.S.; de Souza, L.A.; de Carvalho Freitas, C.E. Sustainability of small-scale fisheries in the middle Negro River (Amazonas–Brazil): A model with operational and biological variables. Ecol. Model. 2018, 368, 312–320. [Google Scholar] [CrossRef] [Green Version]
- Comisión Regional de Competitividad (CRC). Perfil de Competitividad del Departamento del Cesar–Programa de Asistencia Técnica a la CRC; CRC: Valledupar, Colombia, 2011. [Google Scholar]
- ECGP-CTA, ENCUESTA ACUÍCOLA Y PESQUERA ARTESANAL DEL DEPARTAMENTO DEL CESAR; Convenio Especial de Cooperación no. 2015-03-0051; Gobernación del Departamento del Cesar y Universidad Nacional de Colombia: Bogotá, Colombia, 2017.
- Meadows, D.; Fiddaman, T.; Shannon, D. FishBanks Ltd: Institute for Policy and Social Science Research; Hood House, University of New Hampshire: Durham, UK, 1898. [Google Scholar]
- Armendariz, V.; Armenia, S.; Atzori, A.S. Systemic analysis of Food Supply and Distribution Systems (FSDS) in City-Region systems. Agriculture 2016, 6, 65. [Google Scholar] [CrossRef] [Green Version]
- Aracil, J.; Gordillo, F. Dinámica de Sistemas; Alianza Editorial: Madrid, Spain, 1995; pp. 10–12. [Google Scholar]
- Departamento Administrativo Nacional de Estadística (DANE). Proyecciones de Poblaciones Departamentales Por Área: Censo Nacional de Población y Vivienda -CNPV- 2018. Available online: http://www.dane.gov.co/ (accessed on 10 October 2019).
- SEPEC. Informes Gráficos y Tabulares. Available online: http://sepec.aunap.gov.co/ (accessed on 7 March 2019).
- Lasso, C.; Lasso-Alcalá, O.; Pombo, C.; Smith, Y.M. Composición, abundancia y biomasa de la ictiofauna béntica del delta del río Orinoco (caño y boca de Pedernales, Manamo, Manamito, boca de Bagre) y golfo de Paria (río Guanipa, caño Venado). Bull. Biol. Assess. 2004, 37, 85–102. [Google Scholar]
- Ladino Martínez, L.M. Modelos de Dinámicas Migratorias con Factores de Reclutamiento, Depredación y Captura. Ph.D. Thesis, Universidad de Castilla la Mancha, Ciudad Real, Spain, 2012. [Google Scholar]
- Olaya-Nieto, C.W.; Ubarnes-Coronado, G.M.; Ensuncho-Morales, J.E. Crecimiento y mortalidad de mojarra amarilla caquetaia kraussii en la ciénaga Grande de Lorica, Colombia. Rev. Logos Cienc. Tecnol. 2014, 5, 202–212. [Google Scholar] [CrossRef]
- Acosta Murgas, L.A. Impacto Ecológico de la Contaminación Orgánica en la Dinámica de la Comunidad Íctica en la Ciénaga de Zapatosa. Master’s Thesis, Universidad Nacional de Colombia, Palmira, Colombia, 2019. [Google Scholar]
- Contreras Almanza, I.A.E. Influencia de Condiciones Antrópicas Sobre la Reproducción en Hembras de Prochilodus Magdalenae (Steindachner, 1879) en el Complejo Cenagoso de la Zapatosa. Master’s Thesis, Universidad Nacional de Colombia, Palmira, Colombia, 2019. [Google Scholar]
- Arias Vanegas, E.J. Variación Espacio-Temporal en la Concentración de Mercurio del Bagre Rayado Pseudoplatystoma Magdaleniatum en la Ciénaga de Zapatosa. Master’s Thesis, Universidad Nacional de Colombia, Palmira, Colombia, 2019. [Google Scholar]
- Tedeschi, L.; Nicholson, C.; Rich, E. Using system dynamics modelling approach to develop management tools for animal production with emphasis on small ruminants. Small Rumin. Res. 2011, 98, 102–110. [Google Scholar] [CrossRef] [Green Version]
- Turner, B.L.; Menendez, H.; Gates, R.; Tedeschi, L.O.; Atzori, A.S. System dynamics modeling for agricultural & natural resource management issues: Review of some past cases and forecasting future roles. Resouces 2016, 5, 1–24. [Google Scholar]
- Rangel, J.O.; Peña, H.A. Plan de Manejo Ambiental del Complejo Cenagoso de Zapatosa; Universidad Nacional de Colombia: Valledupar, Colombia, 2007. [Google Scholar]
- Molina, R.; Atzori, A.S.; Campos, R.; Sanchez, H. Using system thinking to study sustainability of Colombian dairy system. Bus. Syst. Rev. 2014, 3, 123–141. [Google Scholar]


| Boundary | Description |
|---|---|
| Productive boundary | The main items are duration and number of fishing operations in the month, catch in kilograms of fish per operation; costs of the fishing operation, processing and added value, catch composition and fishing gear. |
| Environmental boundary | This module was designed to record information on the knowledge and implementation of fisheries management measures issued by control bodies, such as closed seasons and minimum catch sizes. |
| Enterprise boundary | Information was collected on the identification of the state of the associativity in the artisanal fishing sector, the participation in associations or organizations, the support of public or private entities for the promotion of the associativity and the registration of information on the marketing activity of the products. |
| Variable | Value | Unit | Source |
|---|---|---|---|
| Population of the Department of Cesar | 979,015 | People | DANE, 2011 [26] |
| Birth rate | 0.005 | 1/month | DANE, 2018 [26] |
| Deaths rate | 0.00341 | 1/month | DANE, 2018 [26] |
| Age to start fishing | 240 | Month | Survey |
| Fishermen population | 344 | People | Gallardo, 2018 [3] |
| Percentage of increased activity in months of subienda | 0.01 | 1/month | Survey |
| Percentage of lowering activity in months of bajanza | 0.01 | 1/month | Survey |
| Average monthly operating cost | 120,042 | Colombian pesos | Survey |
| Average number of tasks per fisherman per month | 25 | Day | Survey |
| Average catch per fisherman in a fishing day | 3.67 | kg * day | SEPEC, 2018 [27] |
| Population of other species | 11,950,000 | Fish | Estimated |
| Loading capacity | 726 | Fish | Lasso, et al., 2004 [28] |
| Maximum fish reproduction rate | 0.1 | 1/month | Landino, 2015 [29] |
| Fish mortality rate | 0.0074 | 1/month | Olaya, et al., 2014 [30] |
| Percentage of fish for self-consumption | 0.083 | 1/month | Survey |
| Average weight of fish | 0.10002 | kg | Acosta, 2019 [31] |
| Time of capture increase | 7 | Month | Estimated |
| Capture percentage | 0.4 | 1/month | Survey |
| Price per kilogram of fish | 2297 | Colombian pesos | Survey |
| Population of Prochilodus magdalenae | 12,123,000 | Fish | Estimated |
| Loading capacity of Prochilodus magdalenae | 763 | Fish | Lasso, et al., 2004 [28] |
| Maximum fish reproduction rate of Prochilodus magdalenae | 0.05 | 1/month | Landino, 2015 [29] |
| Mortality rate of Prochilodus magdalenae | 0.0063 | 1/month | Landino, 2015 [29] |
| Percentage of Prochilodus magdalenae for self-consumption | 0.083 | 1/month | Survey |
| Average weight of Prochilodus magdalenae | 0.226 | kg | Contreras, 2019 [32] |
| Capture percentage of Prochilodus magdalenae | 0.42 | 1/month | Survey |
| Price per kilogram of Prochilodus magdalenae | 2461 | Colombian pesos | Survey |
| Population of catfish | 5,817,900 | Fish | Estimated |
| Loading capacity of catfish | 145 | Fish | Lasso, et al., 2004 [28] |
| Maximum fish reproduction rate of catfish | 0.05 | 1/month | Landino, 2015 [29] |
| Mortality rate of catfish | 0.002132 | 1/month | Landino, 2015 [29] |
| Percentage of catfish for self-consumption | 0.083 | 1/month | Survey |
| Average weight of catfish | 0.50653 | kg | Arias, 2019 [33] |
| Capture percentage of ccatfish | 0.18 | 1/month | Survey |
| Price per kilogram of catfish | 2141 | Colombian pesos | Survey |
| Scenario | Description |
|---|---|
| Scenario 1: Fishing restrictions | In this scenario, the current fishing ban established by the Colombian government for the species Prochilodus magdalenae during the months of May and June was applied. Similarly, in the model was applied the fishing ban for the species Pseudoplatystoma magdaleniatum, established in May and September but also extended to the other two species of catfish. |
| Scenario 2: Restriction of fishing plus a payment for ecosystem services | In this case, the fishing bans of Scenario 1 will be applied, adding for these periods a payment of a monthly minimum salary to the fishermen for cleaning and caring for the swamp and to provide ecosystem services. |
| Scenario 3: No fishing at all and compensative salary | In this scenario the fishermen stop artisanal fishing and engage in other activity for which they will receive a monthly minimum salary as determined by law. |
© 2020 by the authors. Licensee MDPI, Basel, Switzerland. This article is an open access article distributed under the terms and conditions of the Creative Commons Attribution (CC BY) license (http://creativecommons.org/licenses/by/4.0/).
Share and Cite
Castaño-Barreto, A.C.; Jaramillo-Cruz, C.A.; Molina Benavides, R.A.; Atzori, A.S. Scenarios of Sustainable Fishing in the Zapatosa Marsh (Colombia) Simulated with a System Dynamics Model. Sustainability 2020, 12, 3458. https://doi.org/10.3390/su12083458
Castaño-Barreto AC, Jaramillo-Cruz CA, Molina Benavides RA, Atzori AS. Scenarios of Sustainable Fishing in the Zapatosa Marsh (Colombia) Simulated with a System Dynamics Model. Sustainability. 2020; 12(8):3458. https://doi.org/10.3390/su12083458
Chicago/Turabian StyleCastaño-Barreto, Andres Camilo, Carlos Alberto Jaramillo-Cruz, Raul Andres Molina Benavides, and Alberto Stanislao Atzori. 2020. "Scenarios of Sustainable Fishing in the Zapatosa Marsh (Colombia) Simulated with a System Dynamics Model" Sustainability 12, no. 8: 3458. https://doi.org/10.3390/su12083458
APA StyleCastaño-Barreto, A. C., Jaramillo-Cruz, C. A., Molina Benavides, R. A., & Atzori, A. S. (2020). Scenarios of Sustainable Fishing in the Zapatosa Marsh (Colombia) Simulated with a System Dynamics Model. Sustainability, 12(8), 3458. https://doi.org/10.3390/su12083458