Spatial-Temporal Response Patterns of Tourist Flow under Real-Time Tourist Flow Diversion Scheme


Abstract
:1. Introduction
1.1. Background
1.2. Research Motivation
- What is the interactive relationship among tourist information demand, RTFDS, and tourists’ decision-making behavior?
- What are the main factors that affect tourists’ behavior adjustment under RTFDSI and their sensitivity? How much is the effect of RTFDS on tourists’ behavior adjustment?
- What measures can be taken to adjust and optimize RTFDS dynamically?
2. Literature Review
2.1. RTFDS and Impact on Tourists
2.2. Tourists’ Behavior Adjustment
2.3. Tourists’ Behavior Simulation
2.4. The Main Contribution
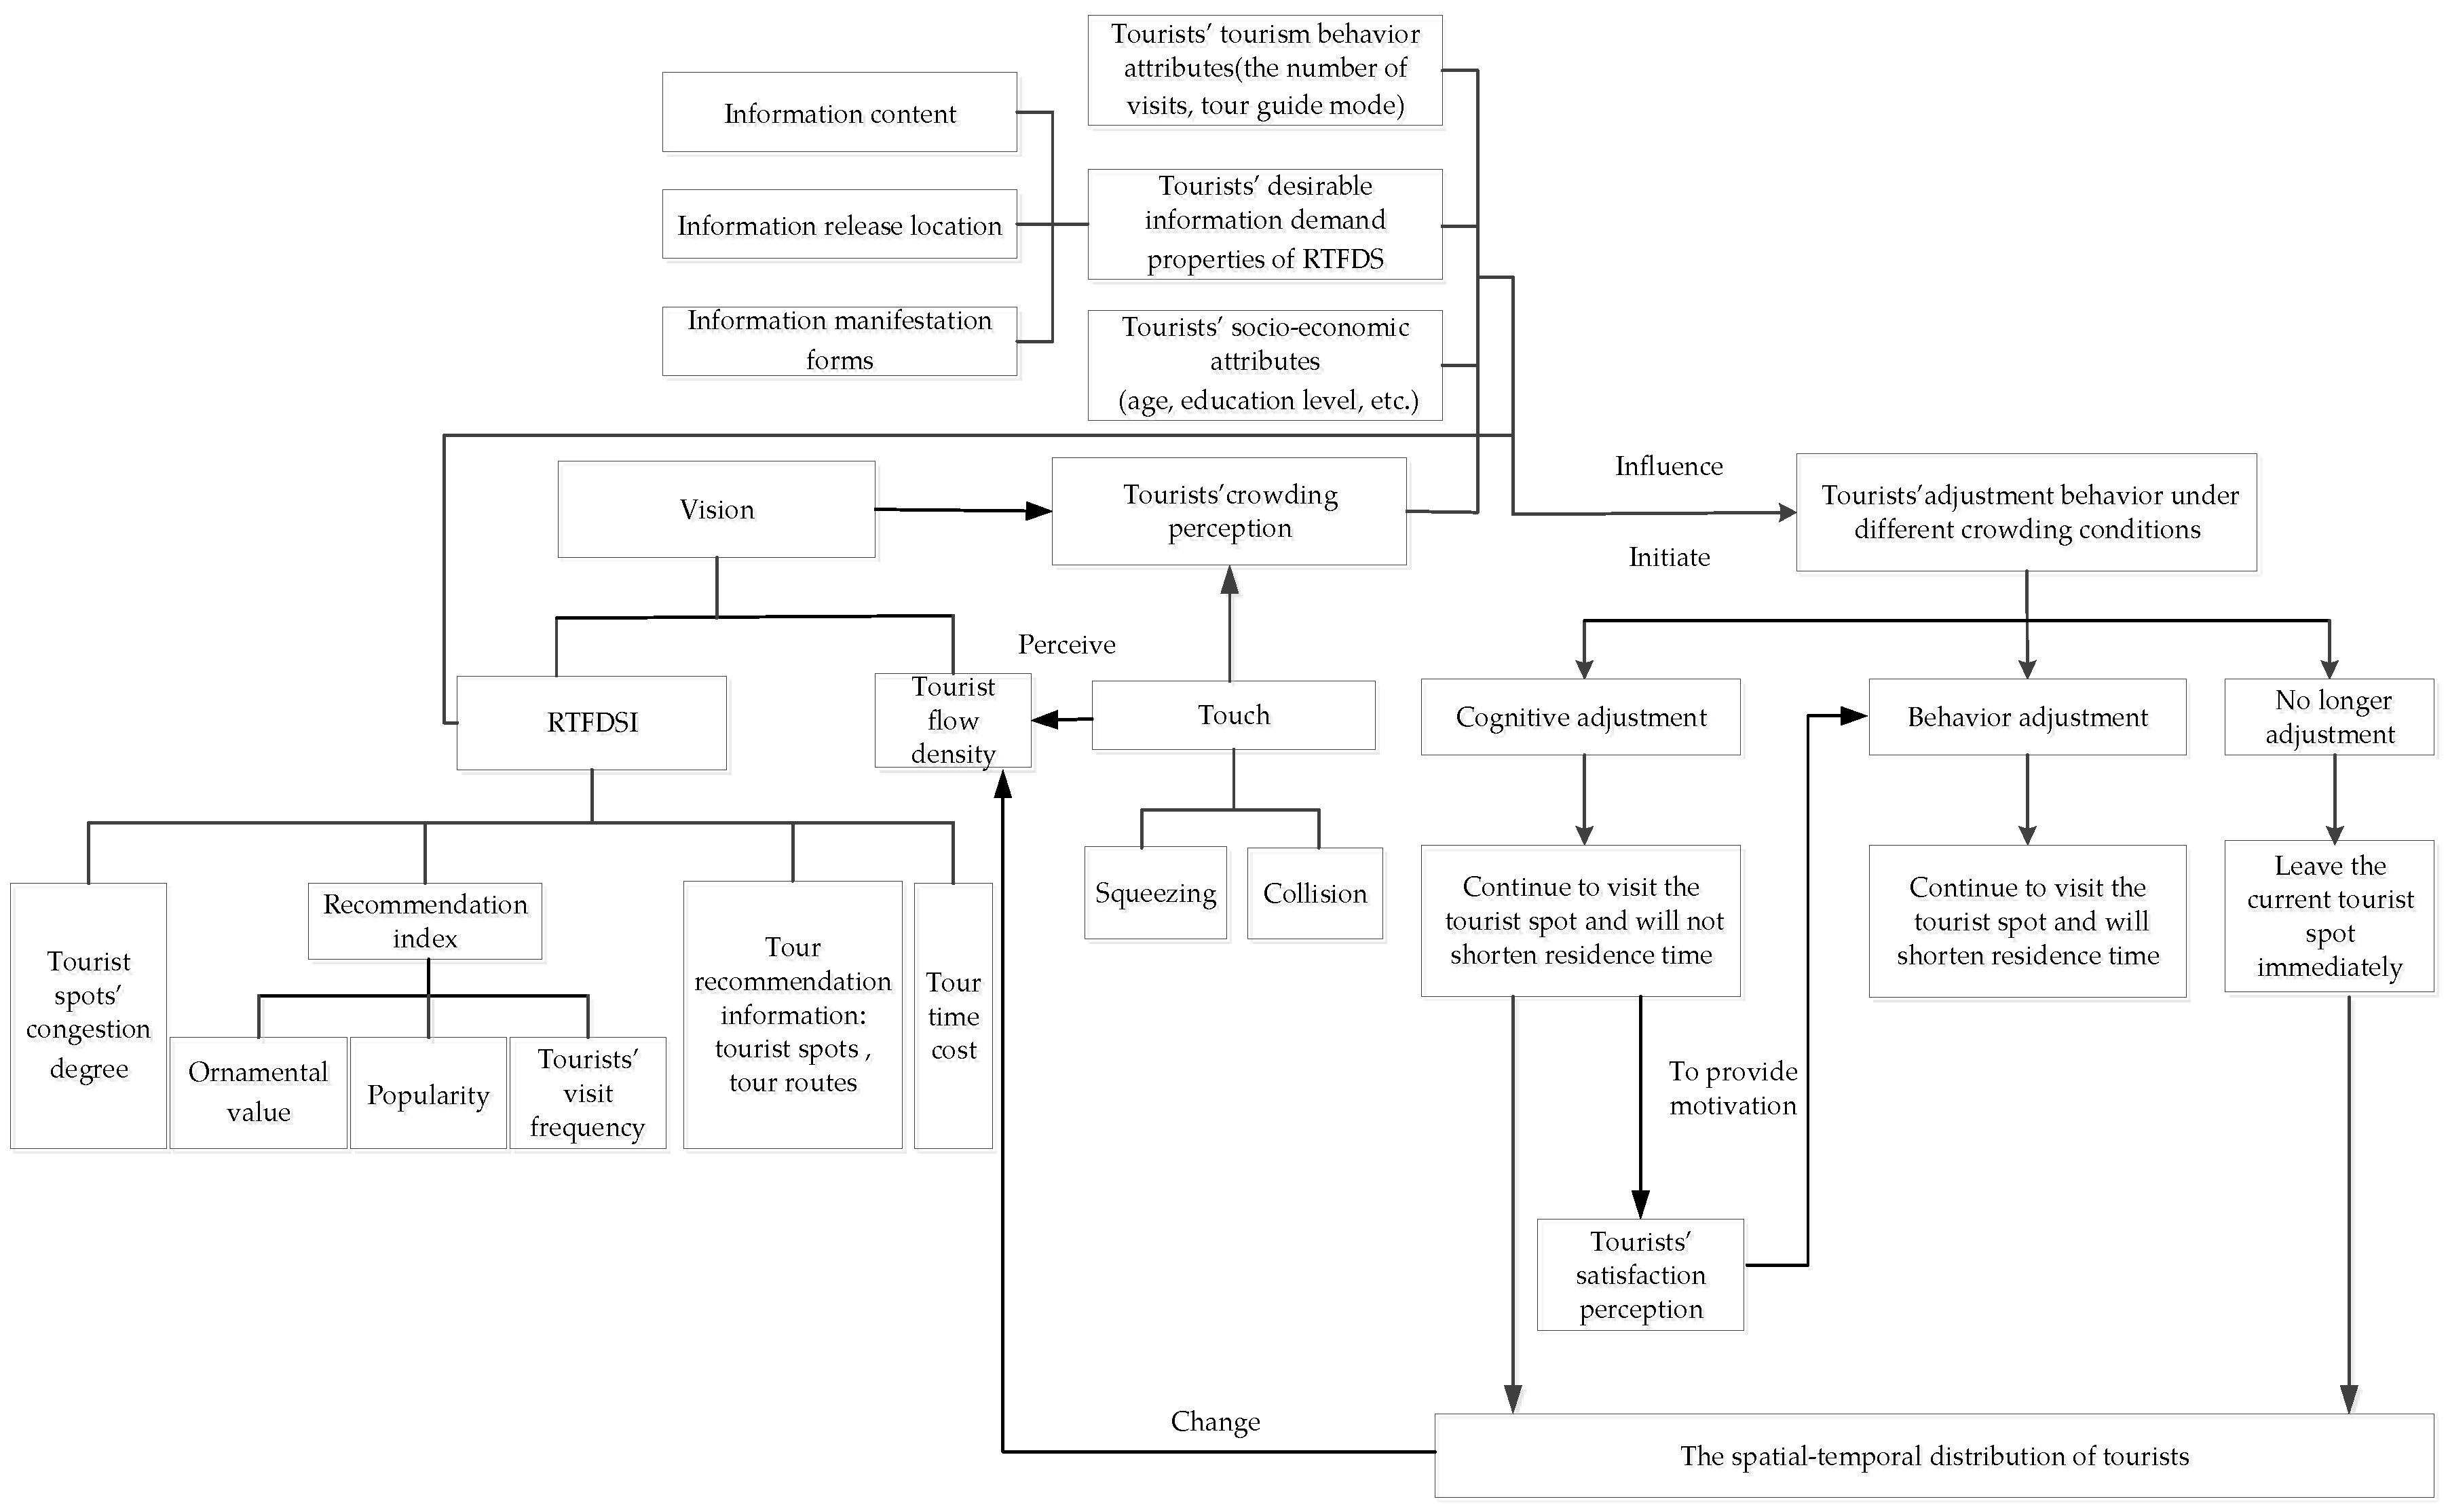
3. Tourists’ Behavior Adjustment under RTFDSI
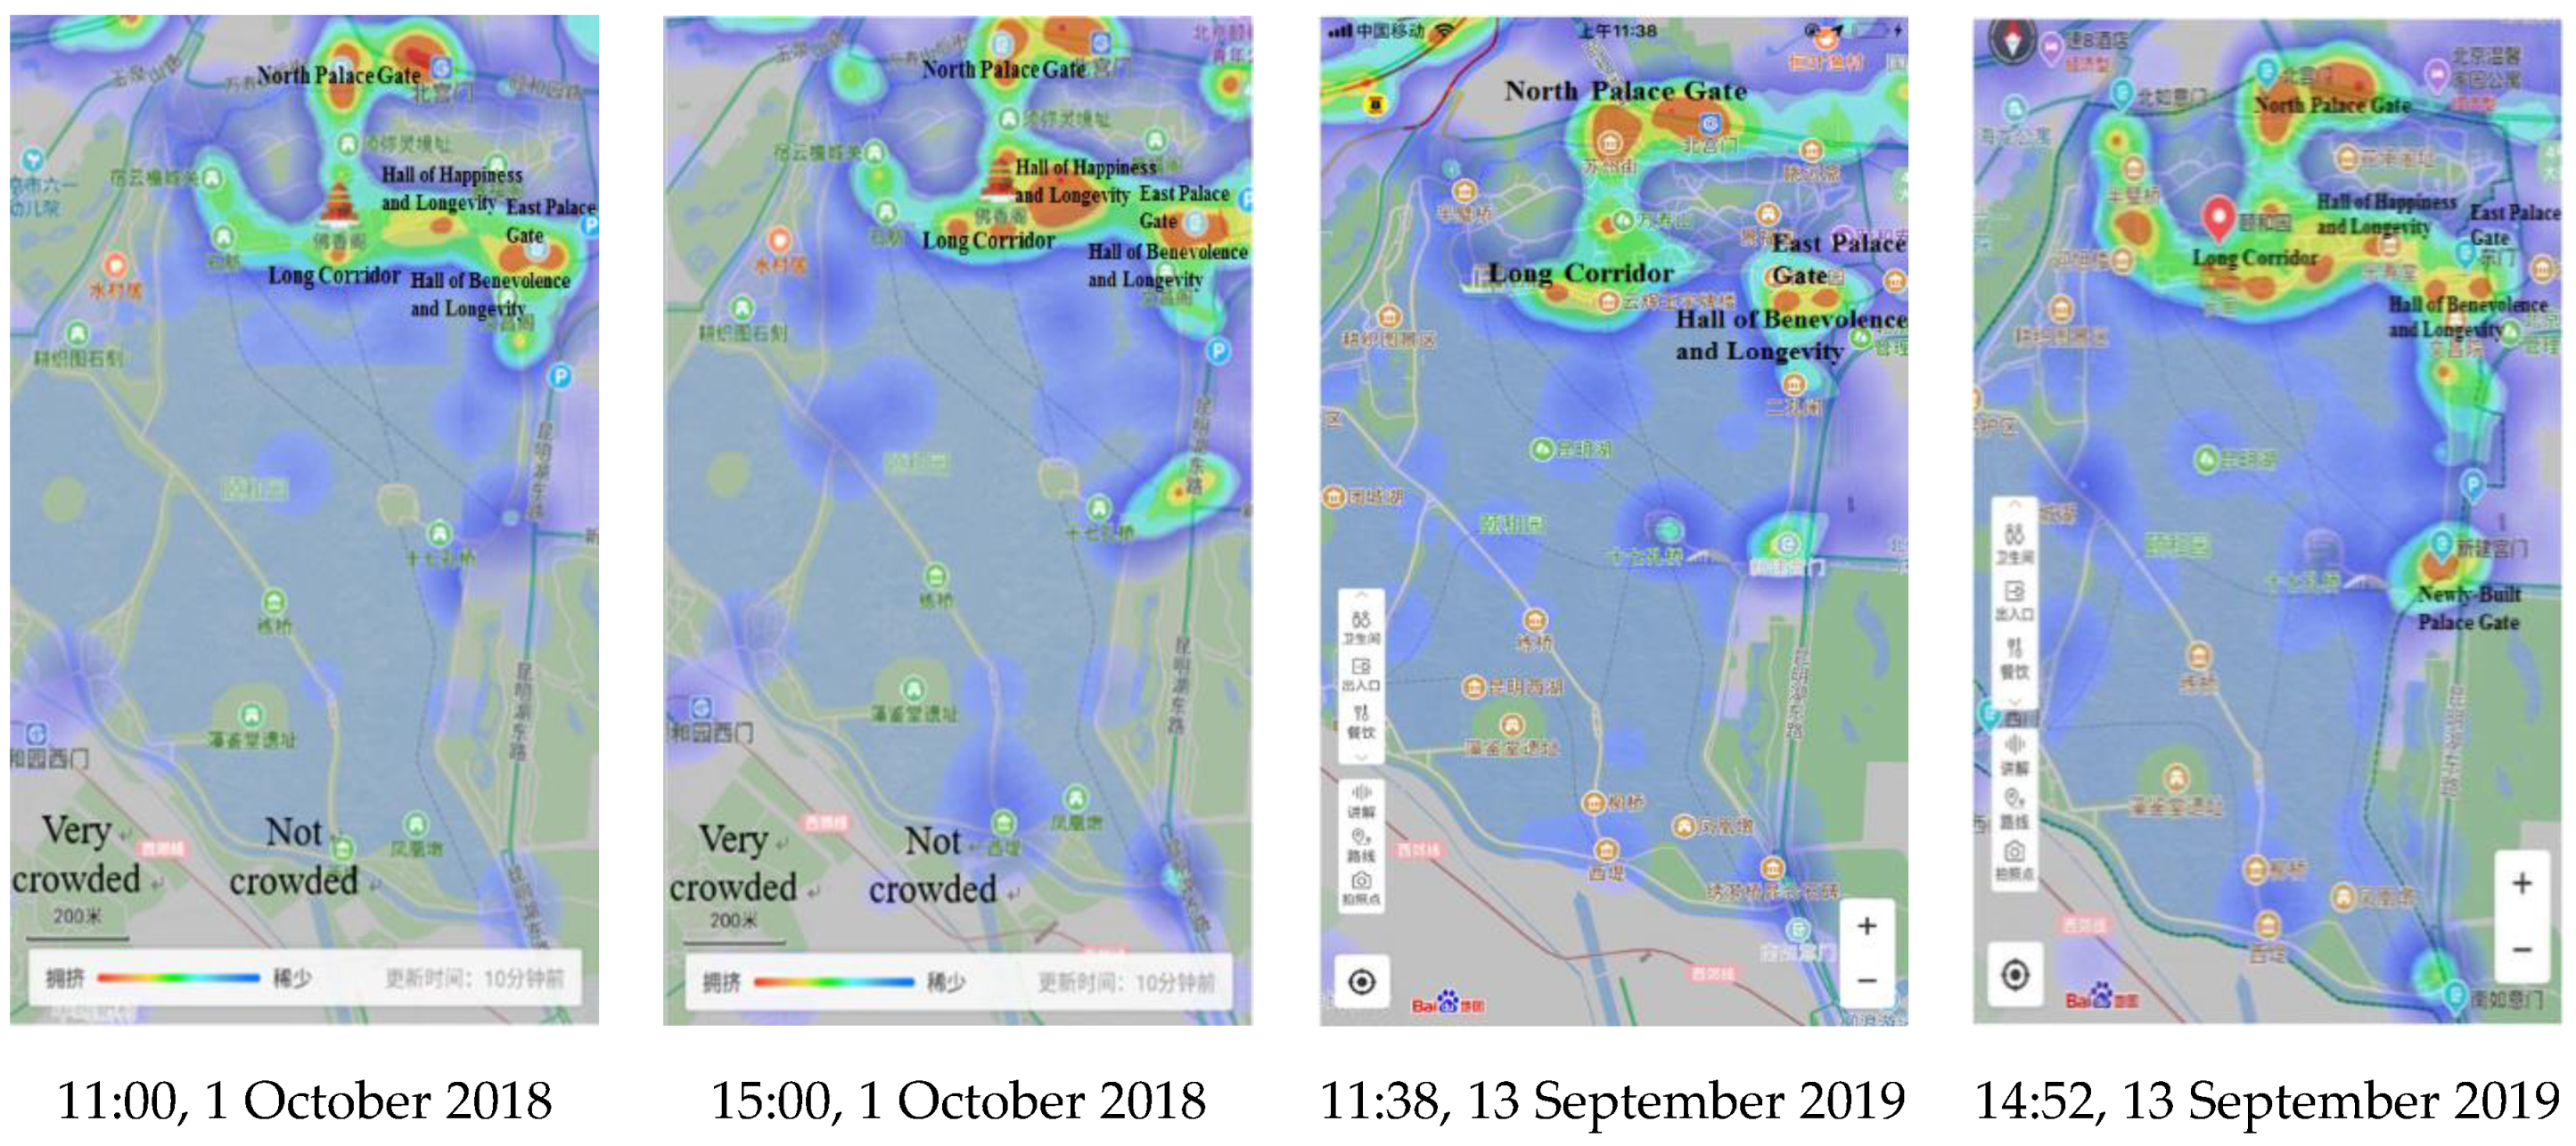
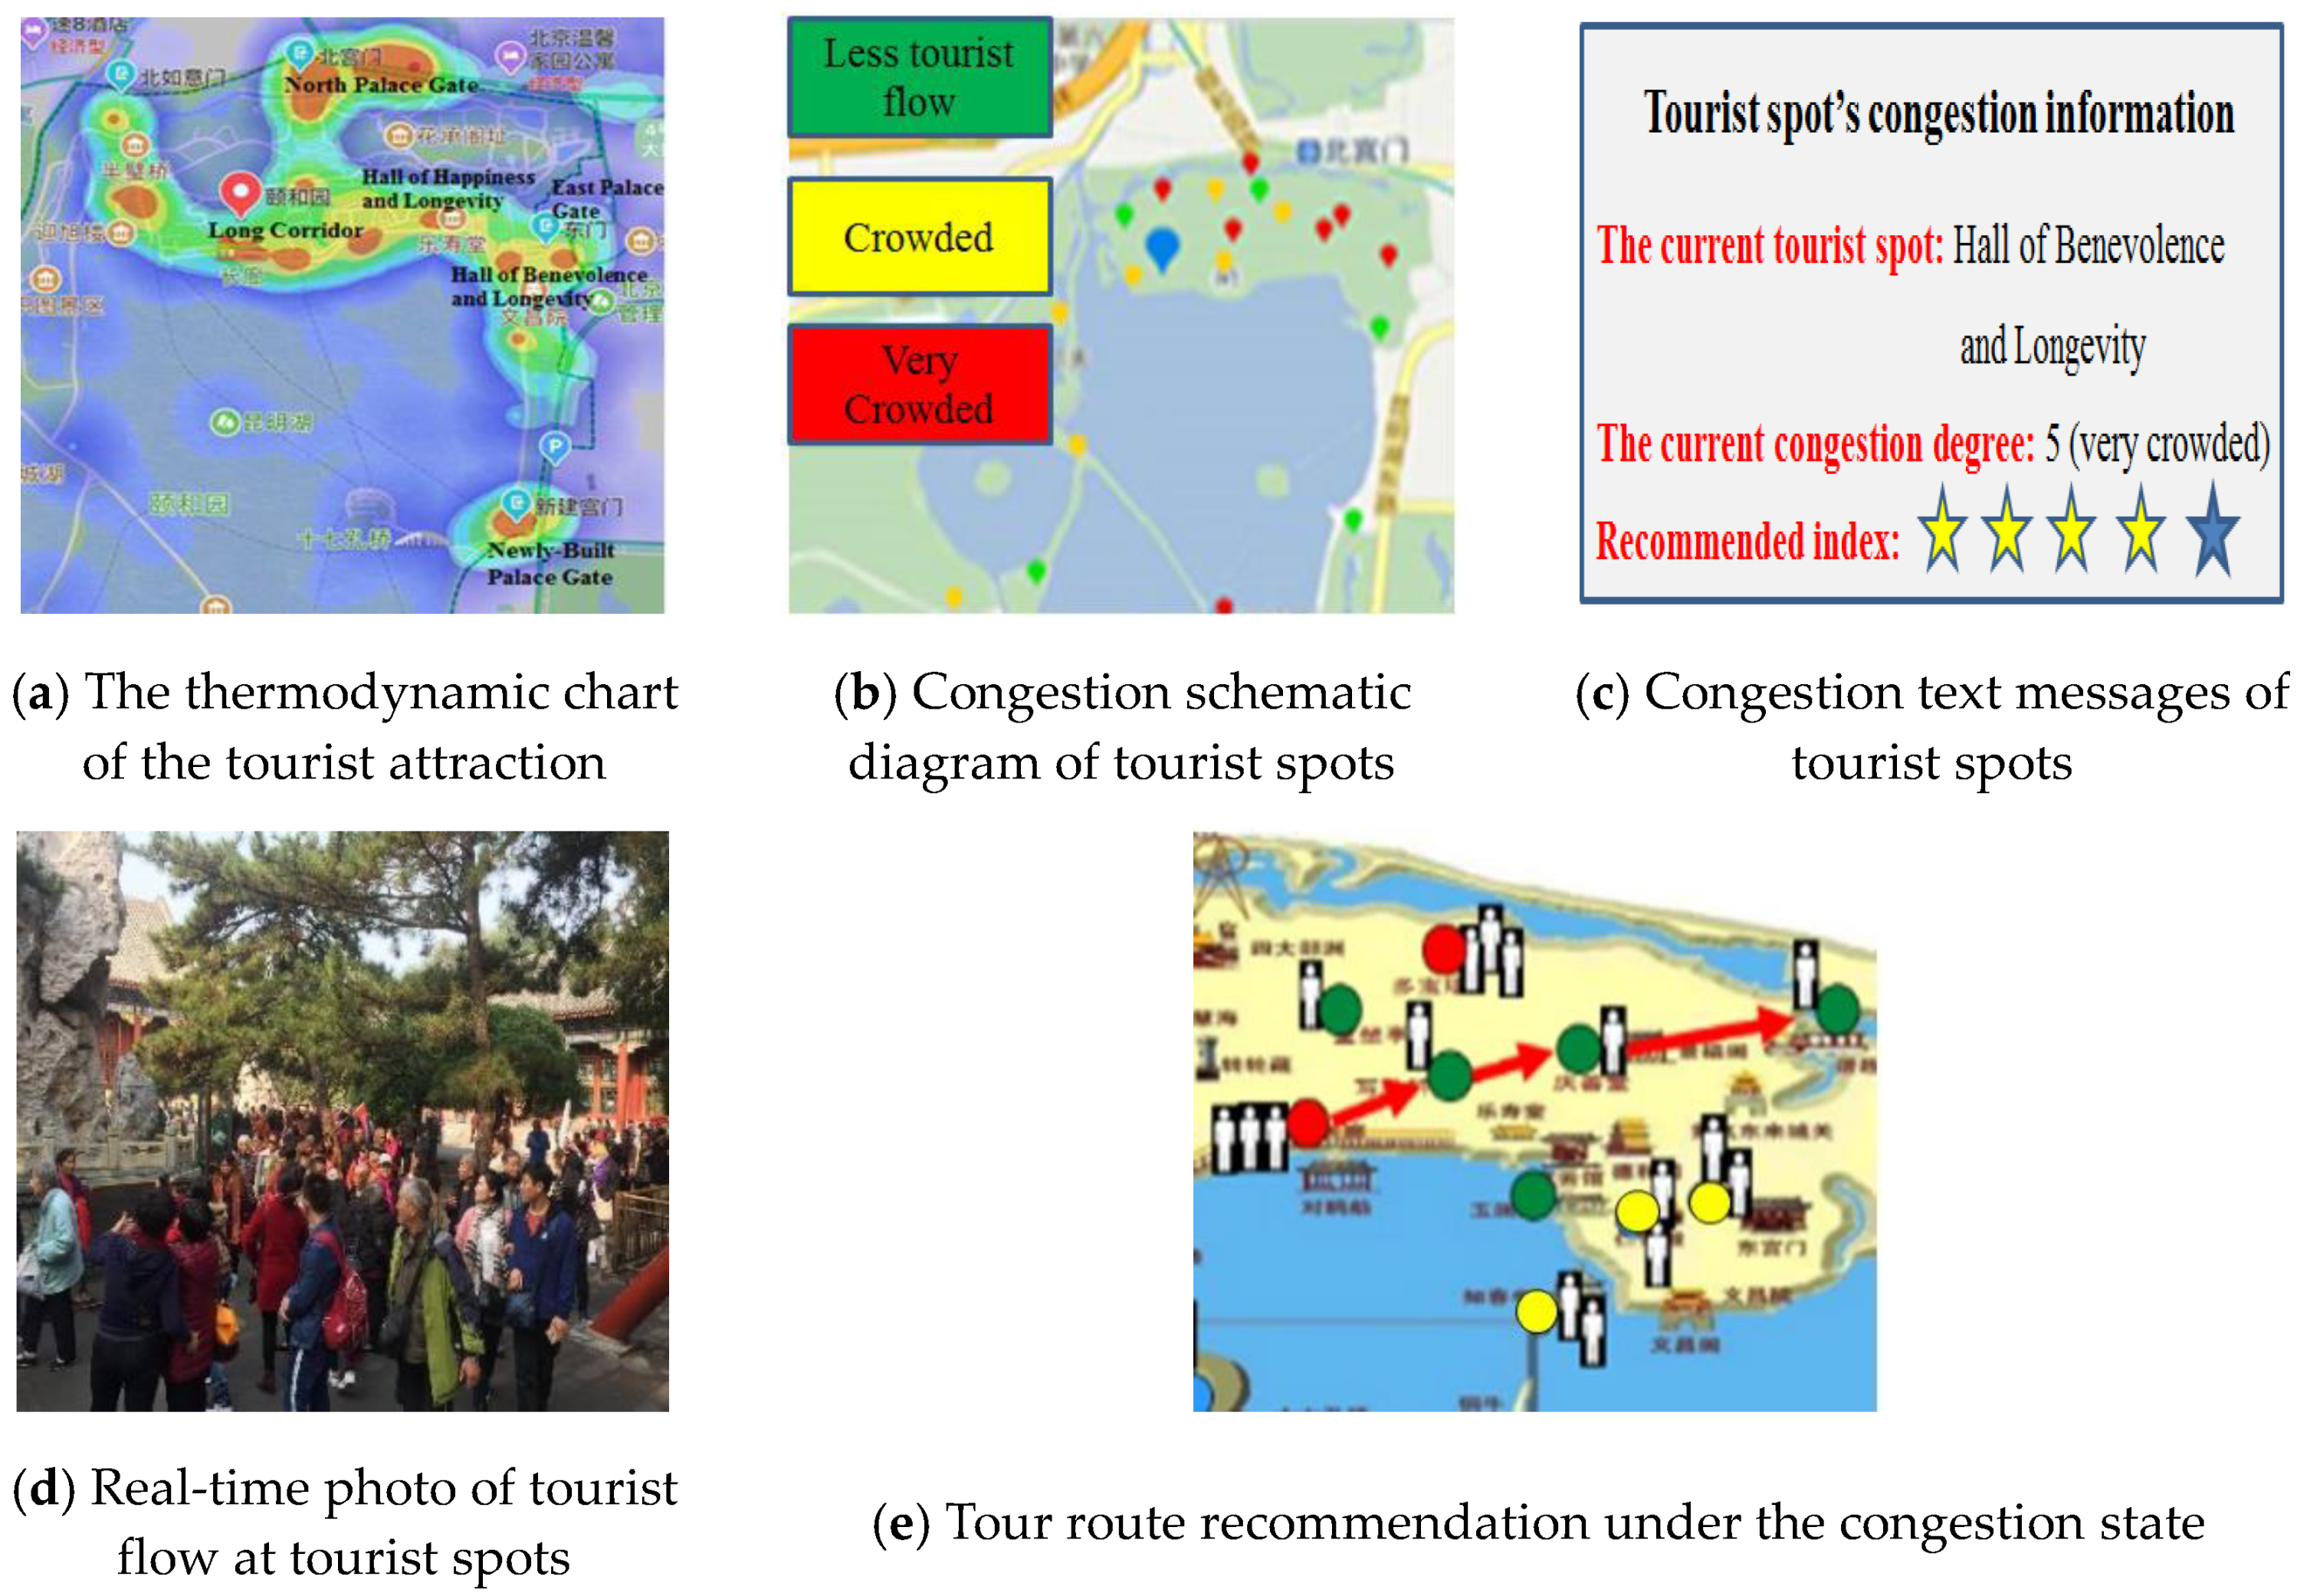
3.1. RTFDS and Its Information Release
3.2. Tourists’ Behavior Adjustment under RTFDSI
- (1)
- Information acquisition, perception, and congestion evaluation stage
- (2)
- Initiate behavior adjustment stage
- (3)
- Behavior adjustment stage
4. Methodology
4.1. Framework of Multinomial Logit Model
4.2. Estimation Method of Multinomial Logit Model
5. Case Study
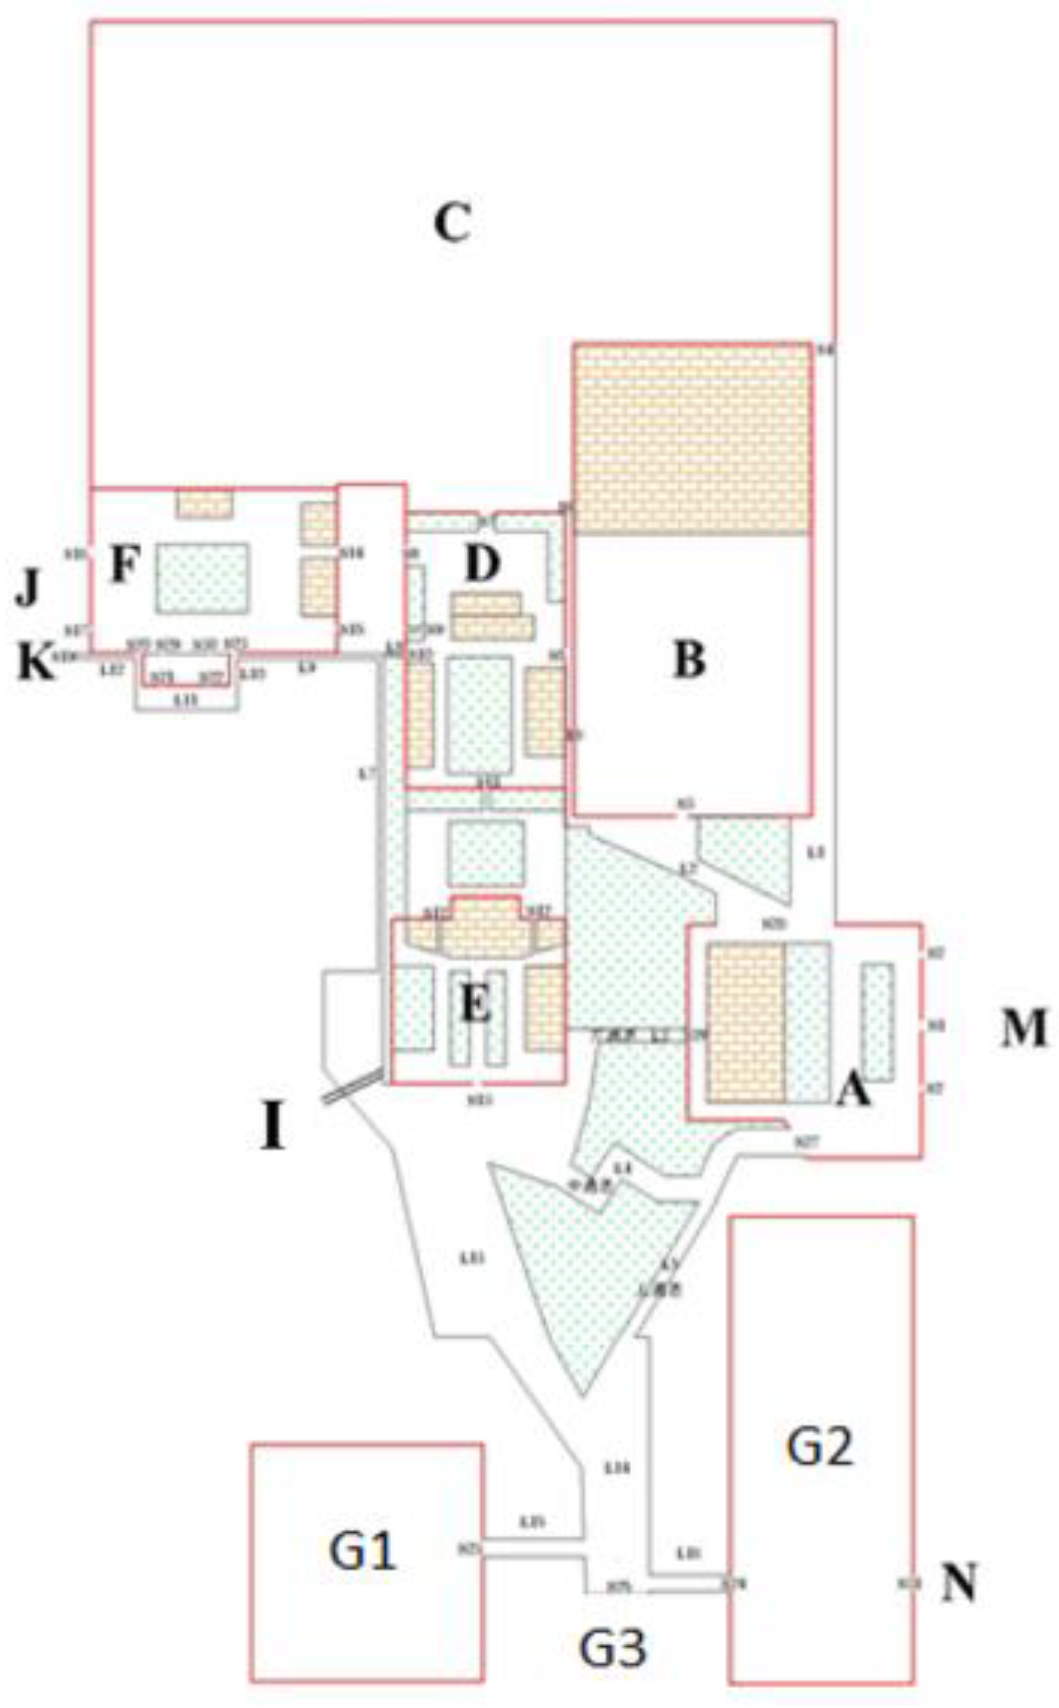
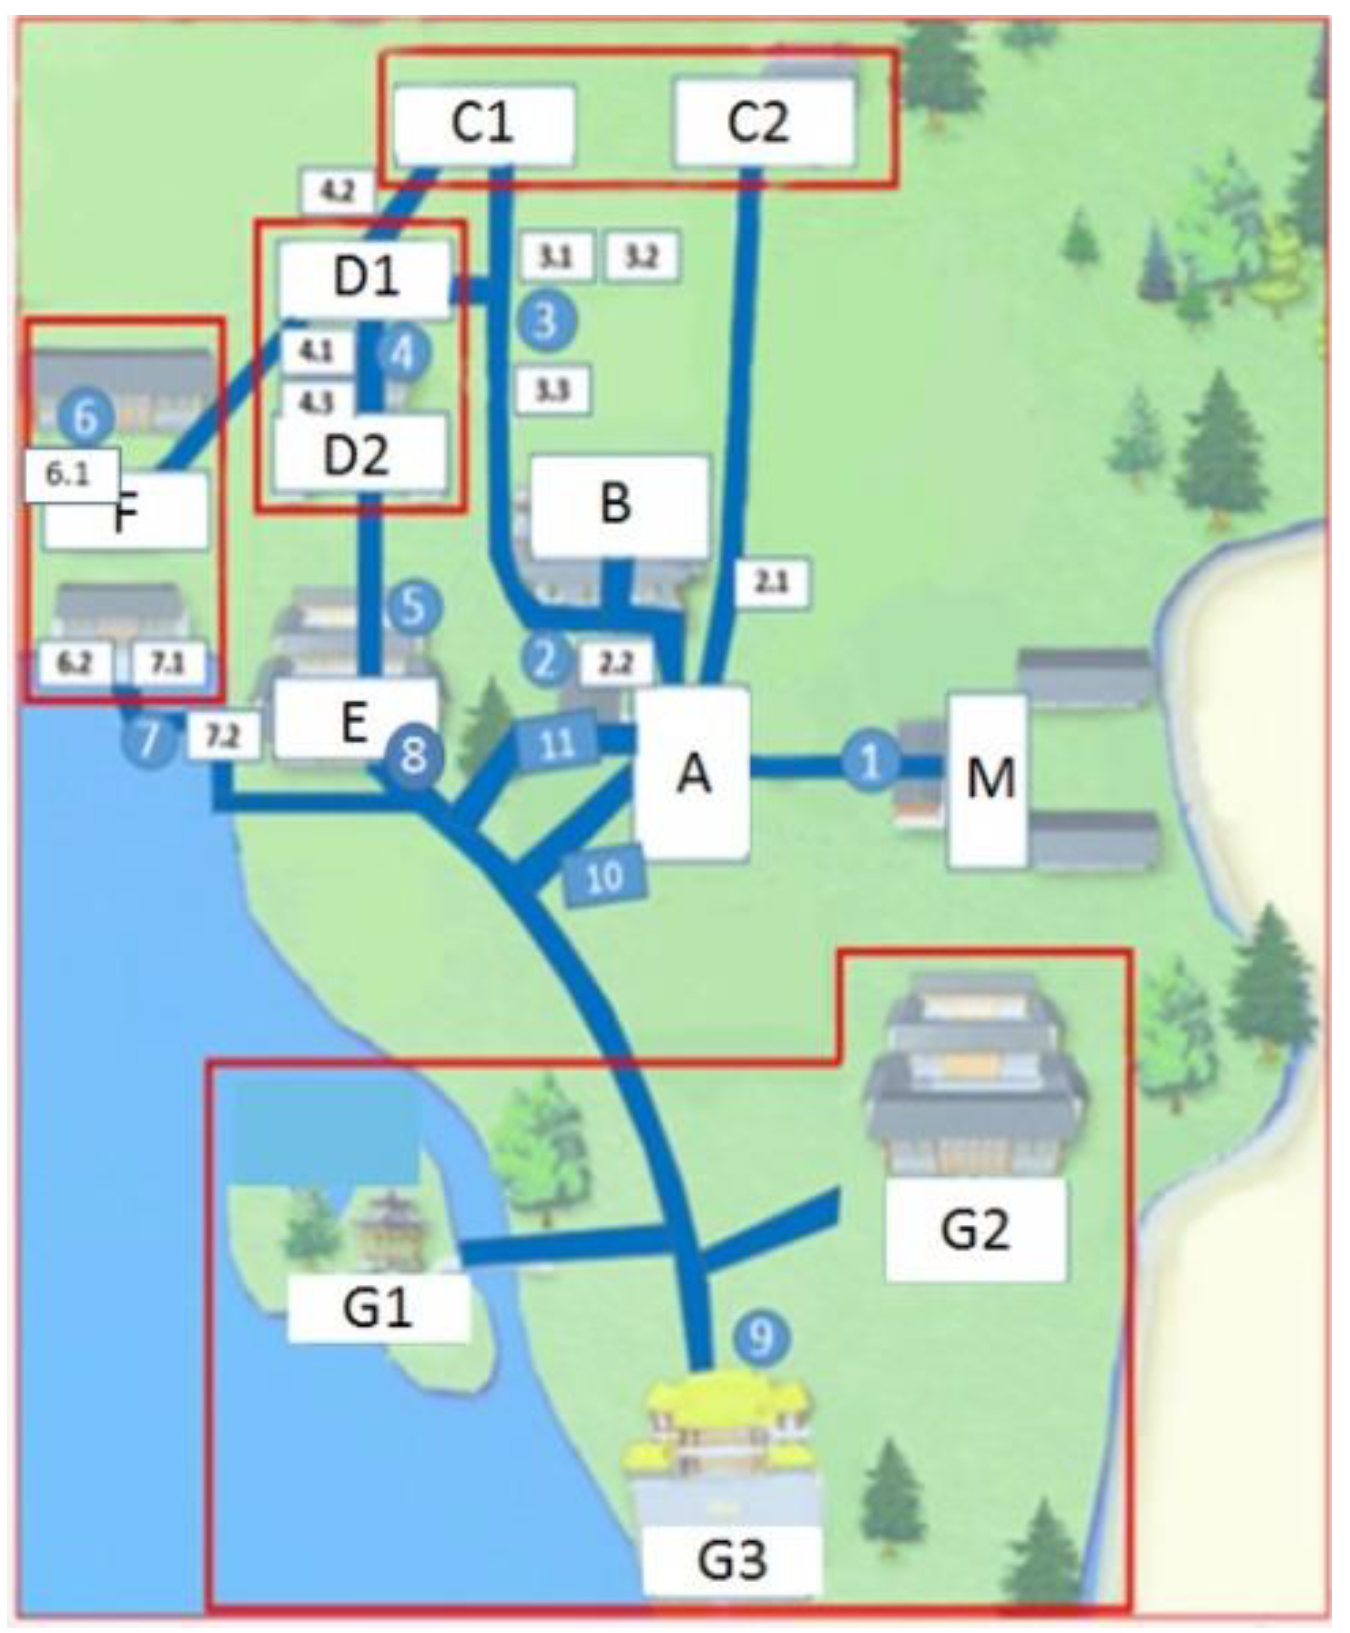
5.1. Case Introduction and Description
- (1)
- Tourists’ socio-economic attributes, including gender, age, education level, occupation, monthly income, and whether tourist is a local tourist.
- (2)
- Tourists’ tourism behavior, including tourists’ tourism information (residence time, tourist congestion perception degree) of the current, previous, and next expected tourist spot, tour guide method, the number of visits, visiting purpose, travel mode, companions.
- (3)
- Tourists’ information demand of RTFDS, including preferred information release content, information manifestation form, information release location, information release media, information release frequency.
- (4)
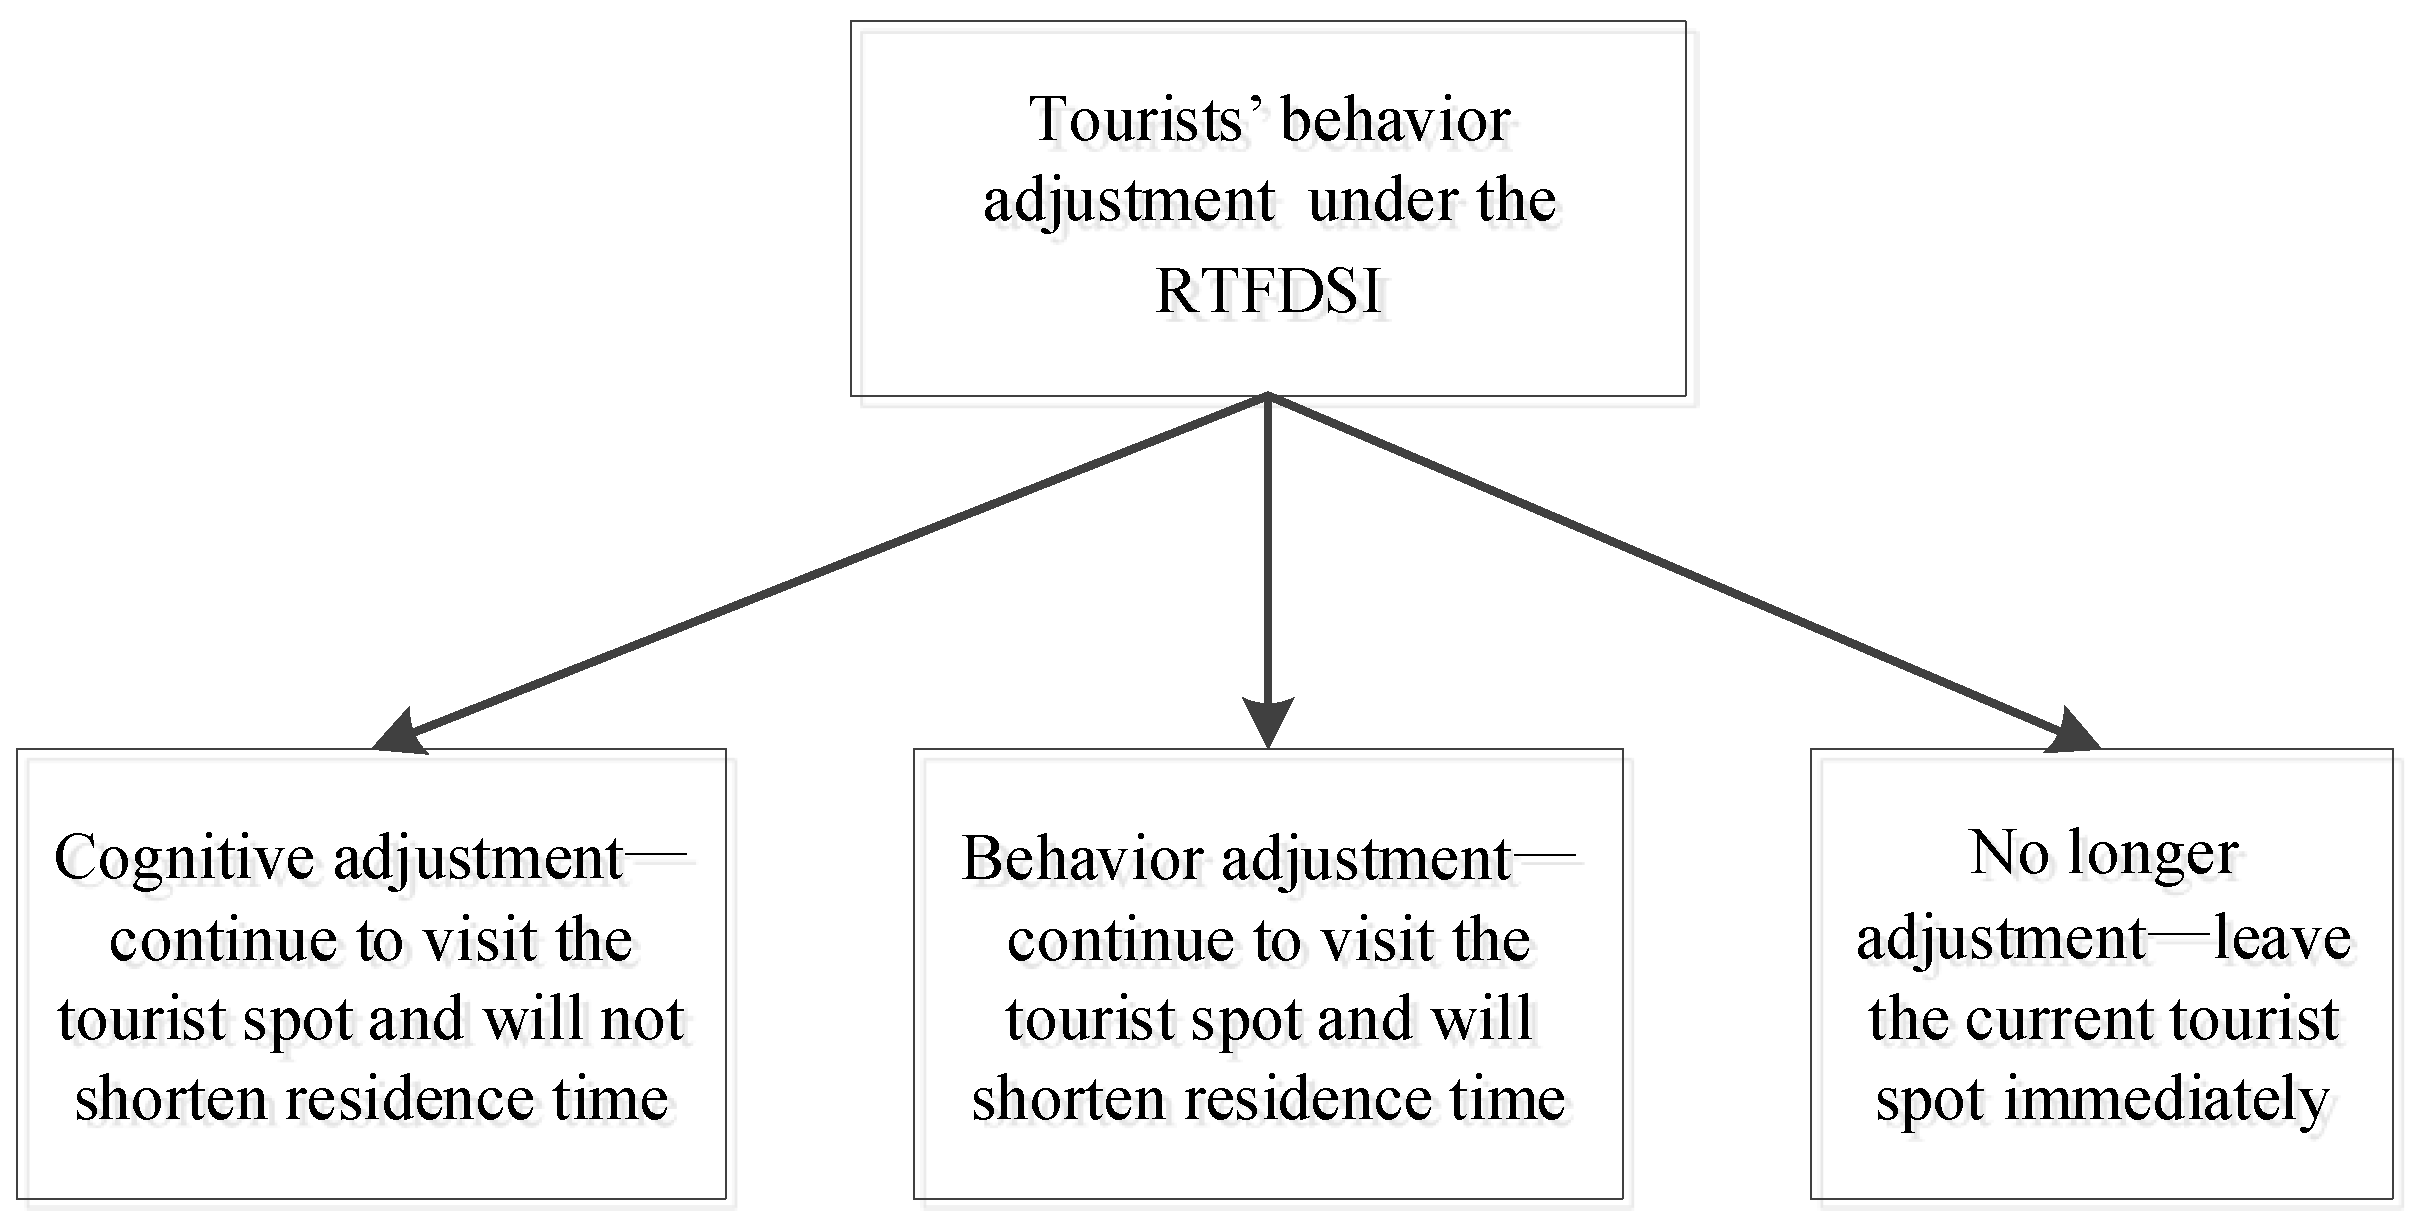
- Tourists’ preferred behavior adjustment under RTFDSI was investigated and obtained. The tourists’ stated preference behavior adjustment scenario under RTFDSI is the following:
5.2. Data Analysis
5.2.1. Information Release of RTFDS
5.2.2. Tourists’ Behavior Adjustment under RTFDSI
6. Results and Discussion
6.1. Estimation Results of Tousists’ Behavior Adjustment Model
- (1)
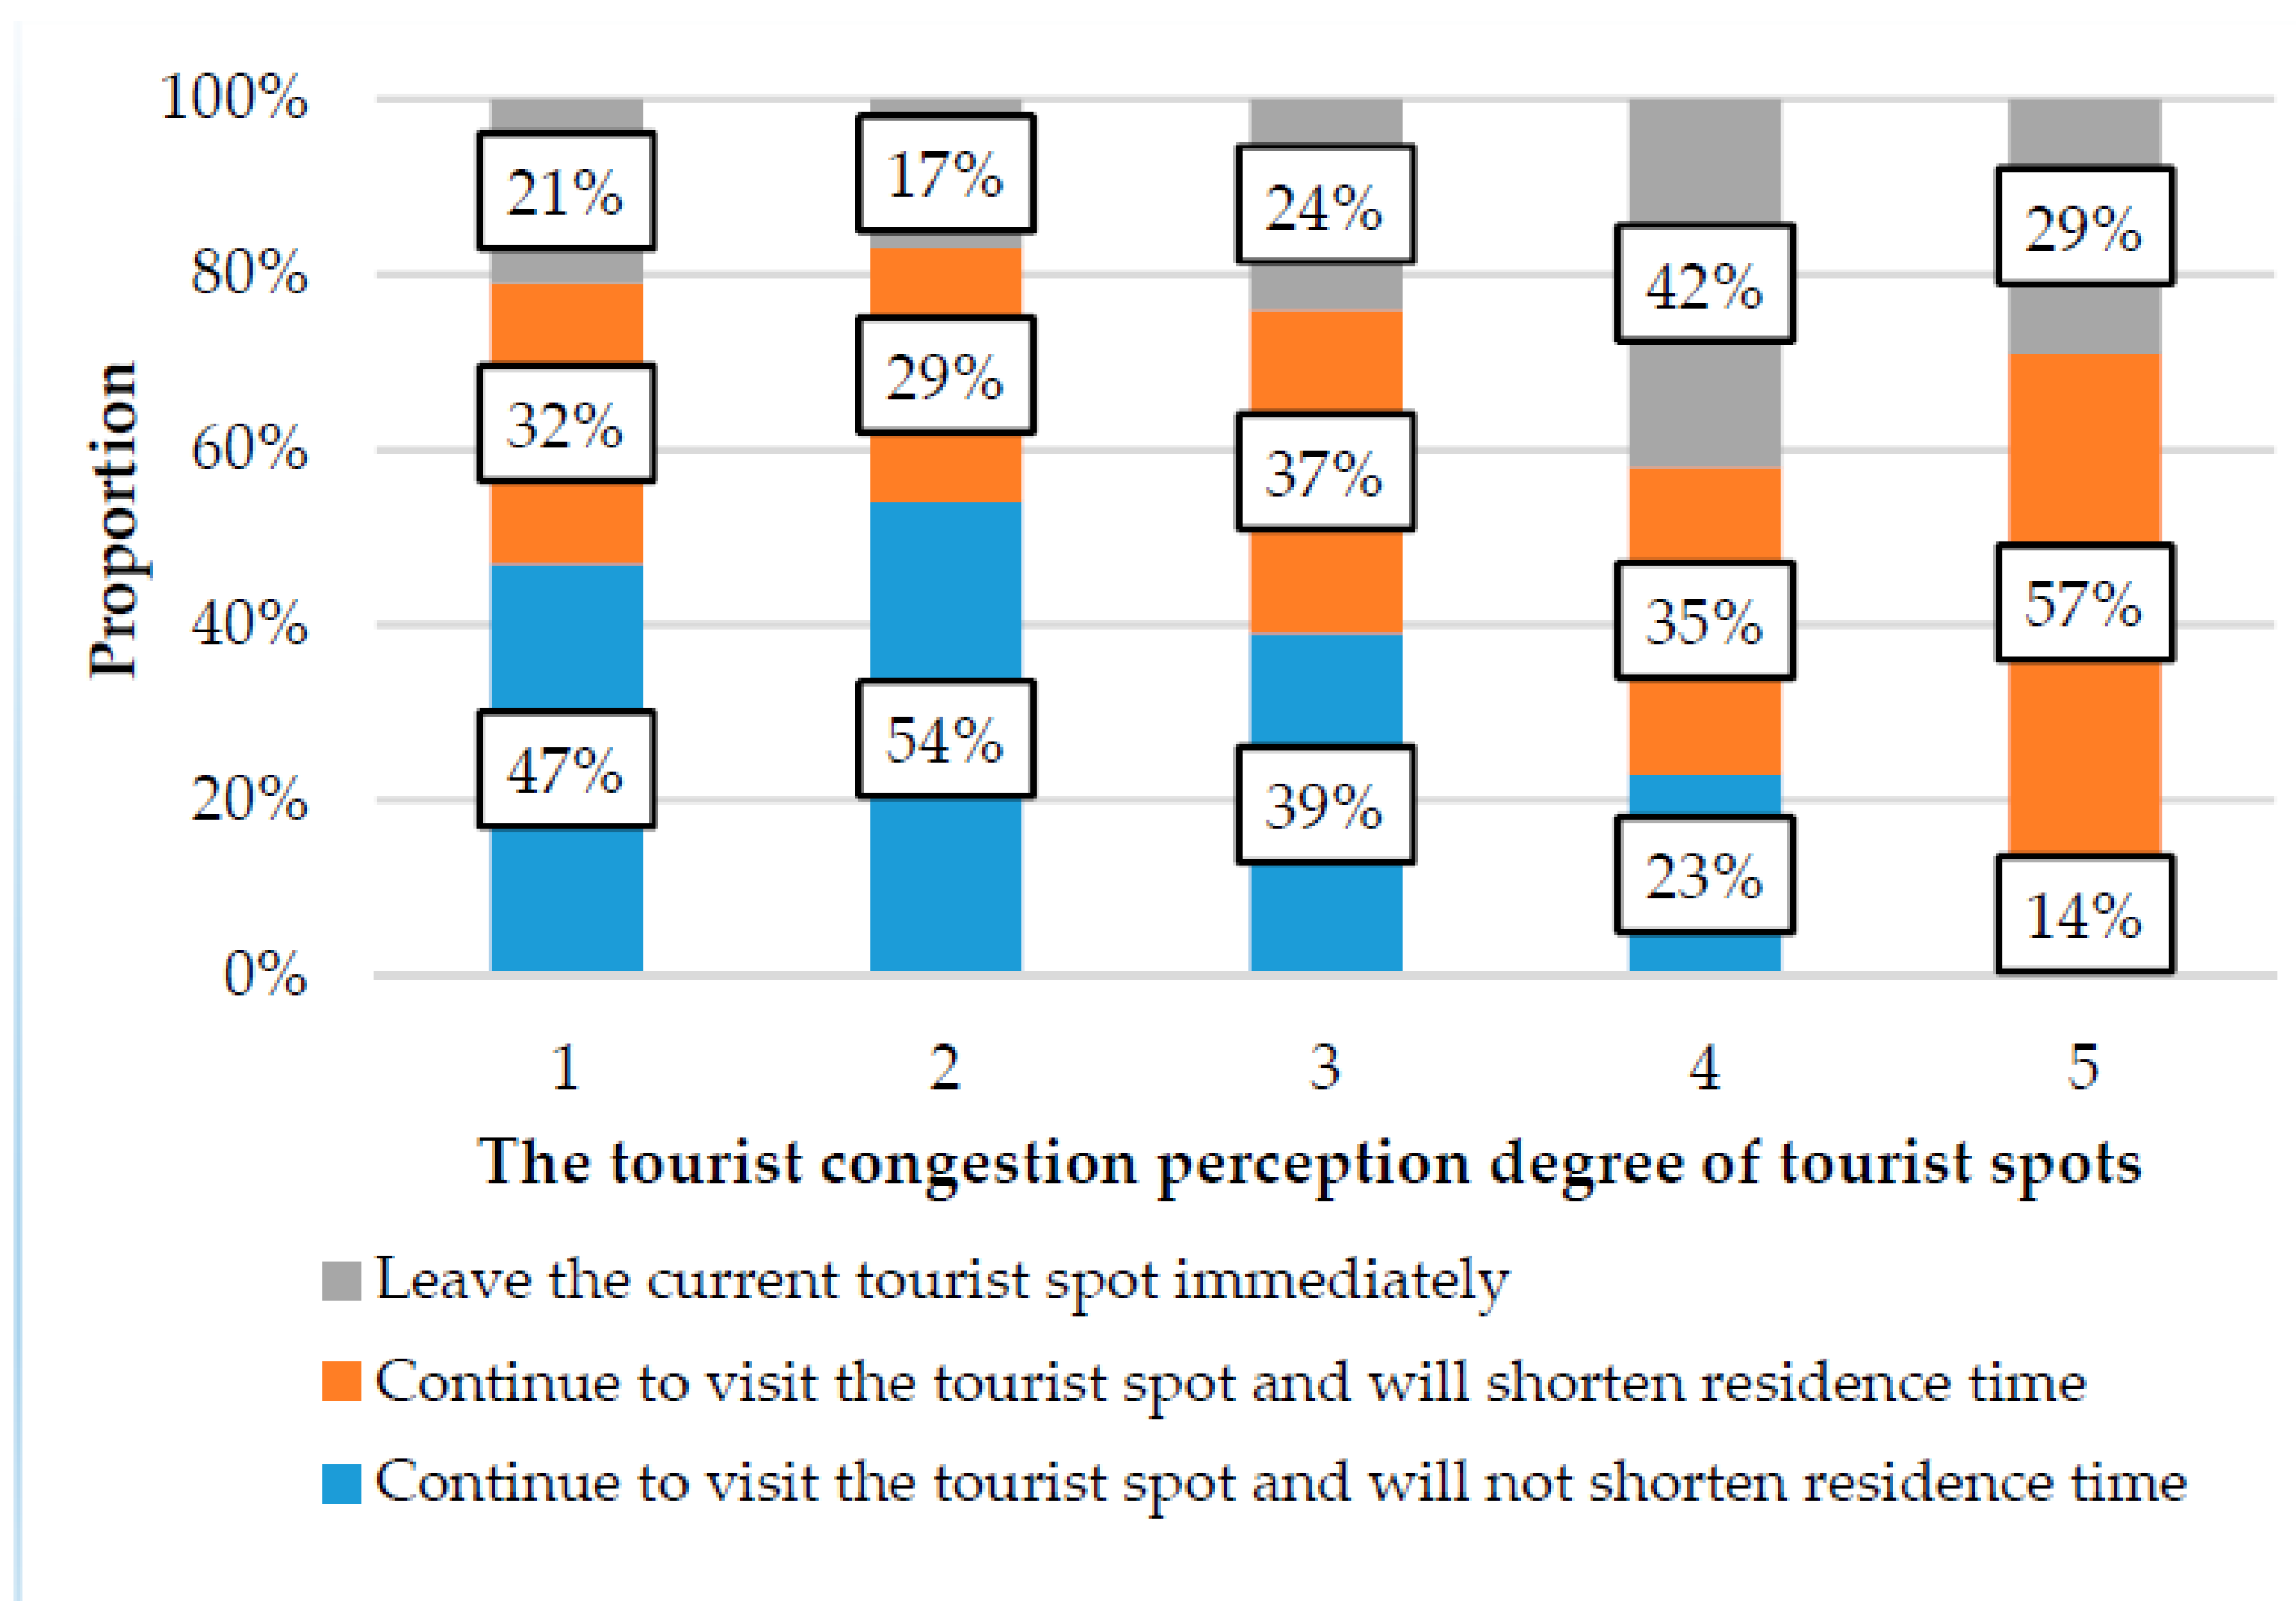
- In terms of RTFDSI, the coefficient is positive, which indicates that when the tourist spot tourist congestion perception degree is low (equals to 1 or 2), the tourist tends to continue to visit the tourist spot and will not shorten residence time. The coefficient is positive, which indicates that when the tourist spot tourist congestion perception degree is high (equals to 5), the tourist tends to continue to visit the tourist spot, but will shorten residence time.
- (2)
- In terms of tourists’ social and economic attributes, the influence coefficient is positive, which indicates that the older the tourist is, the more likely to continue to visit the tourist spot and will shorten residence time. The influence coefficients and are all positive, indicating that the tourist whose education level is undergraduate and junior college tends to shorten residence time or leave the current tourist spot immediately; the tourist whose education level is Master and Doctor tends to shorten residence time under RTFDSI.
- (3)
- For tourists’ tourism behavior attributes, the influence coefficient is positive, which indicates that the tourist who visits the first time tends to continue to visit the tourist spot and will not shorten residence time under RTFDSI. The influence coefficient is positive, which indicates that the tourist who visit 2–3 times tends to shorten residence time. The influence coefficient is positive, which indicates that the tourist who visit 4–5 times tends to leave the current tourist spot immediately.
- (4)
- In terms of tourists’ information demand, the influence coefficients and are positive, which indicates that the tourist who concerns about the congestion duration of core tourist spots and the tour route recommendation tends to leave the current tourist spot immediately. The influence coefficient is negative, which indicates that the tourist who concerns the distance between core and recommended periphery tourist spot is not inclined to “continue to visit and will not shorten the residence time”.
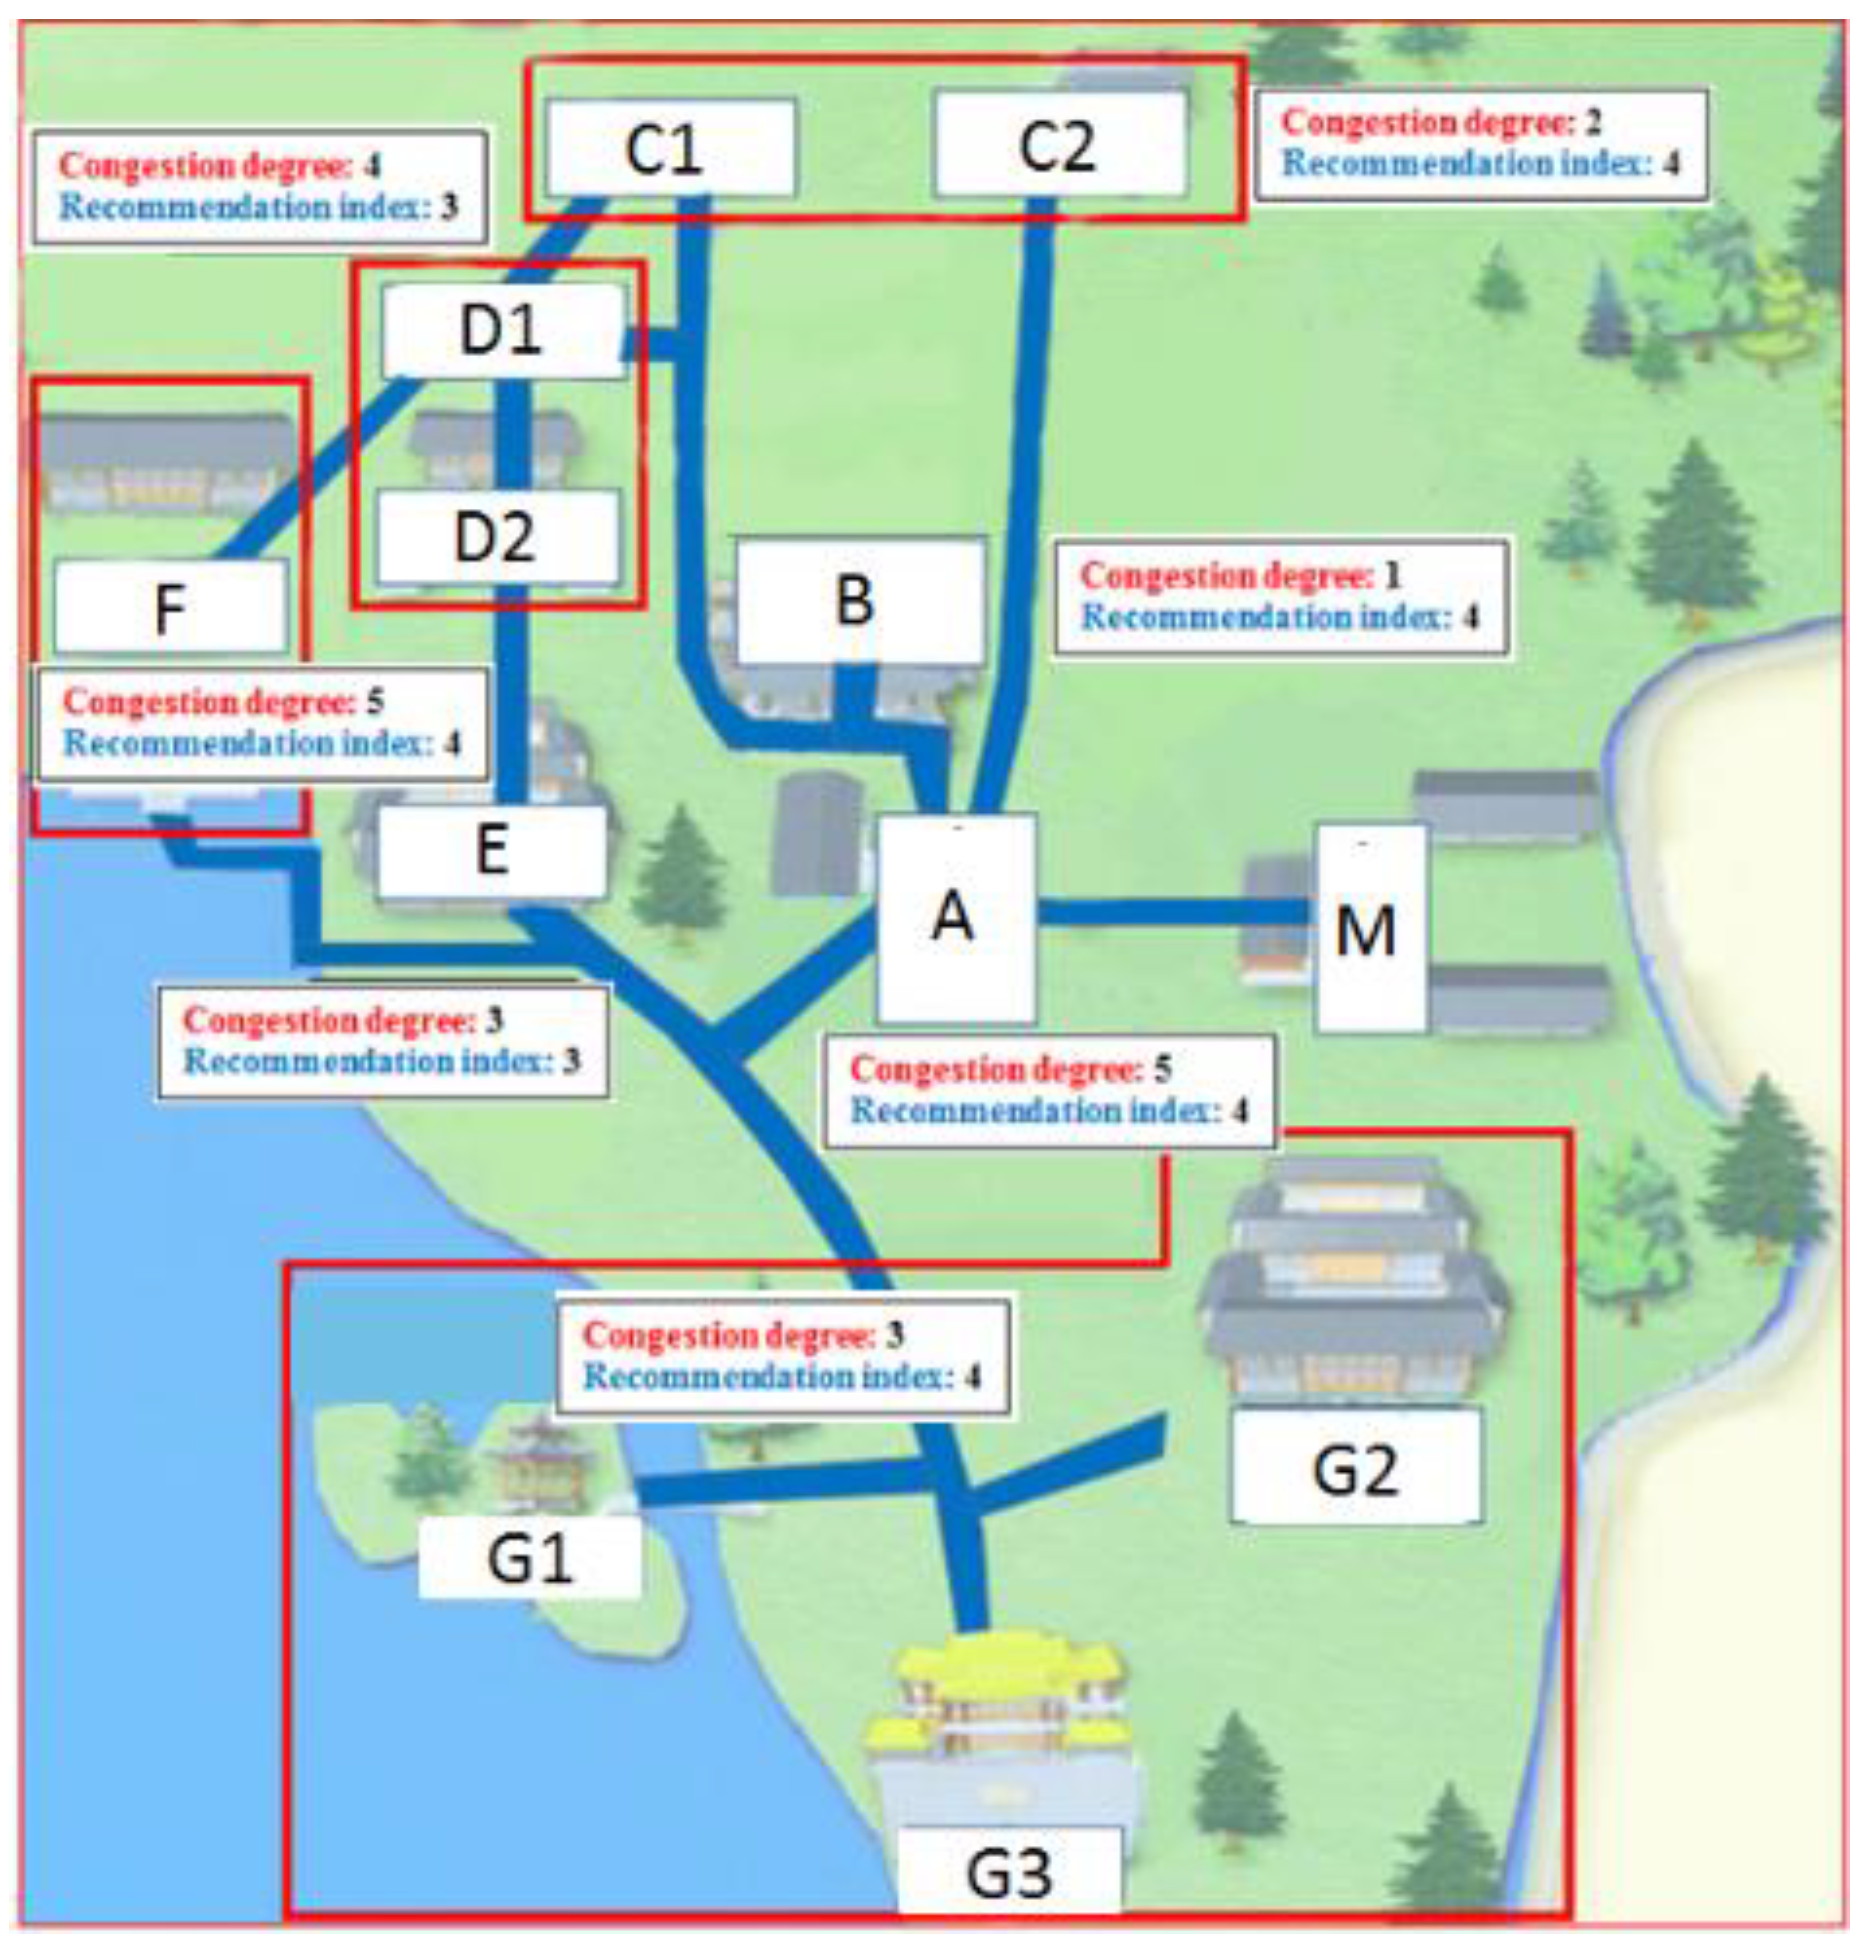
6.2. Tourists’ Behavior Adjustment under RTFDSI in The Palace Area
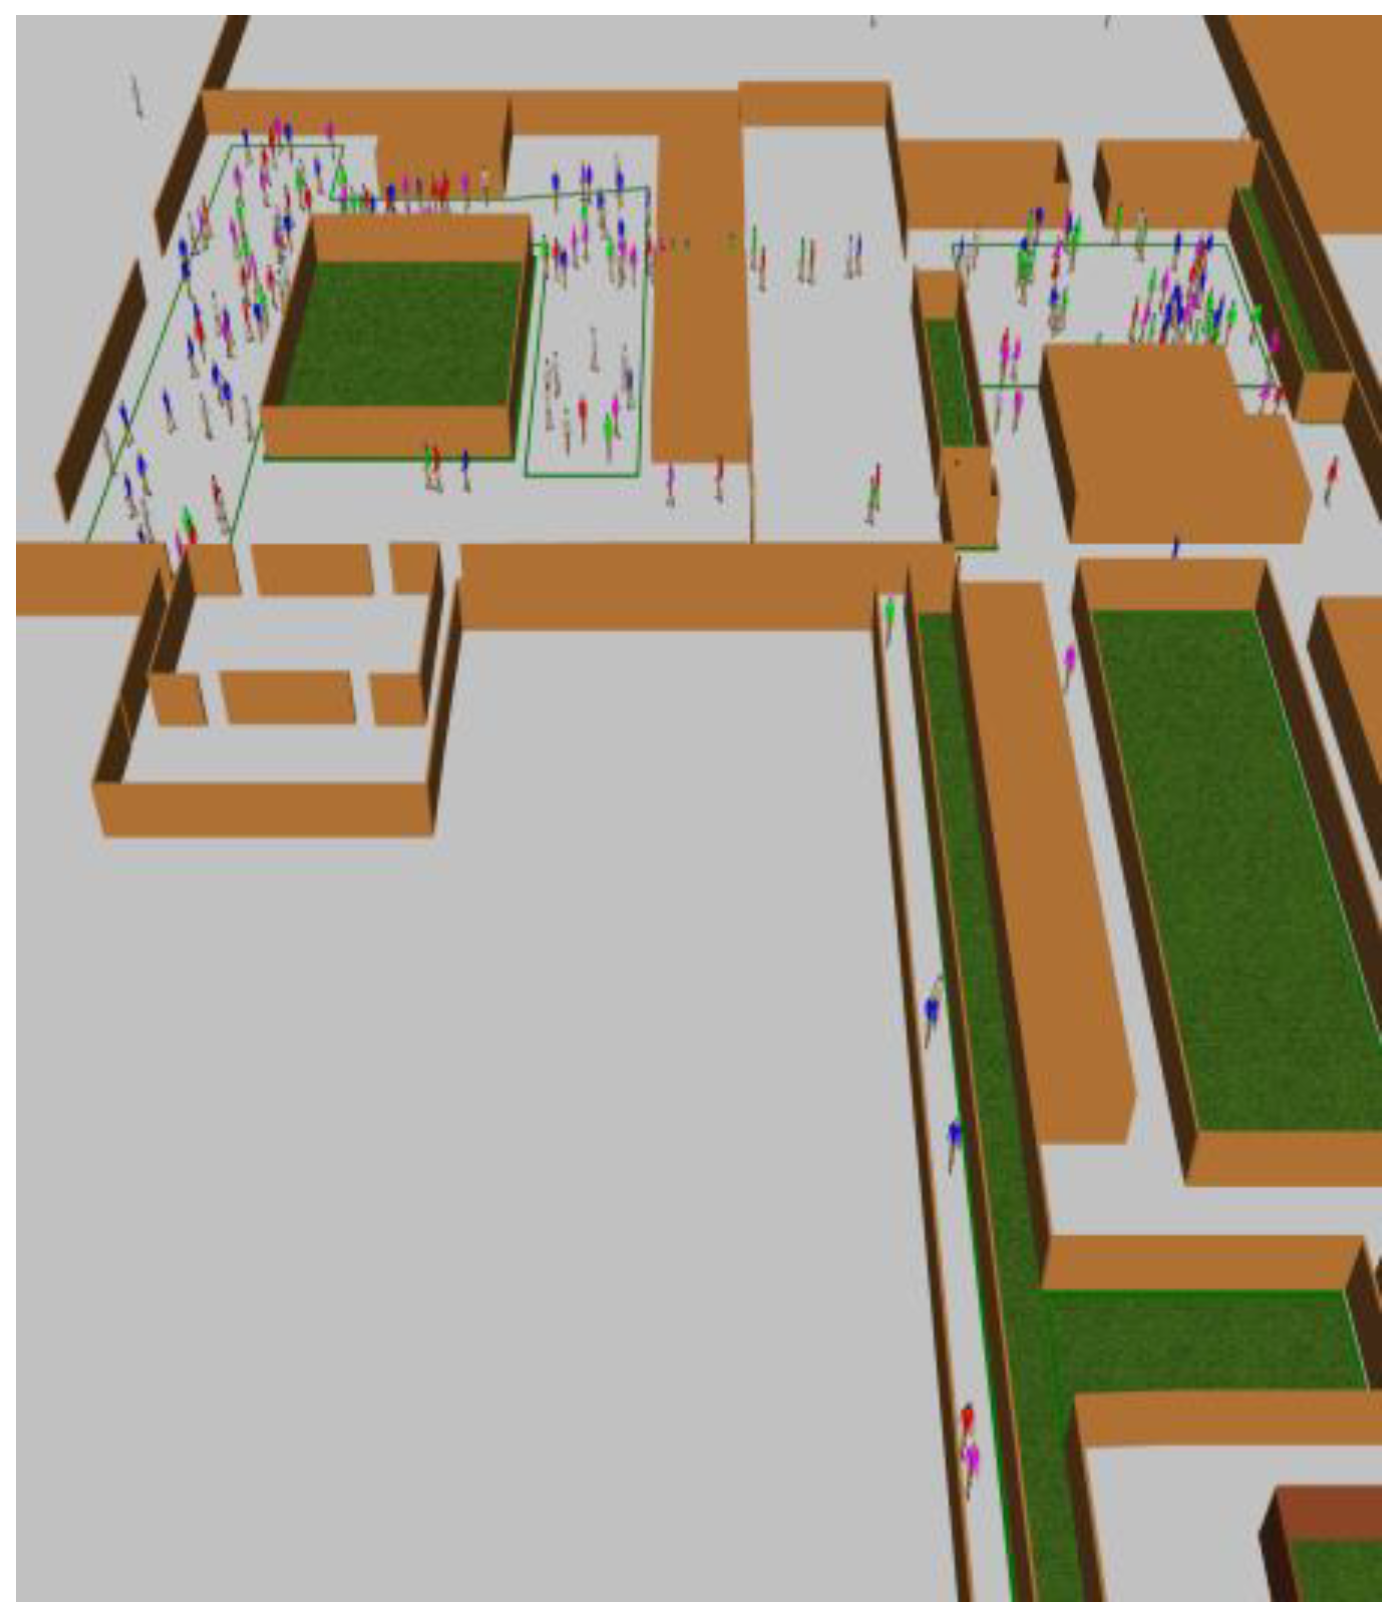
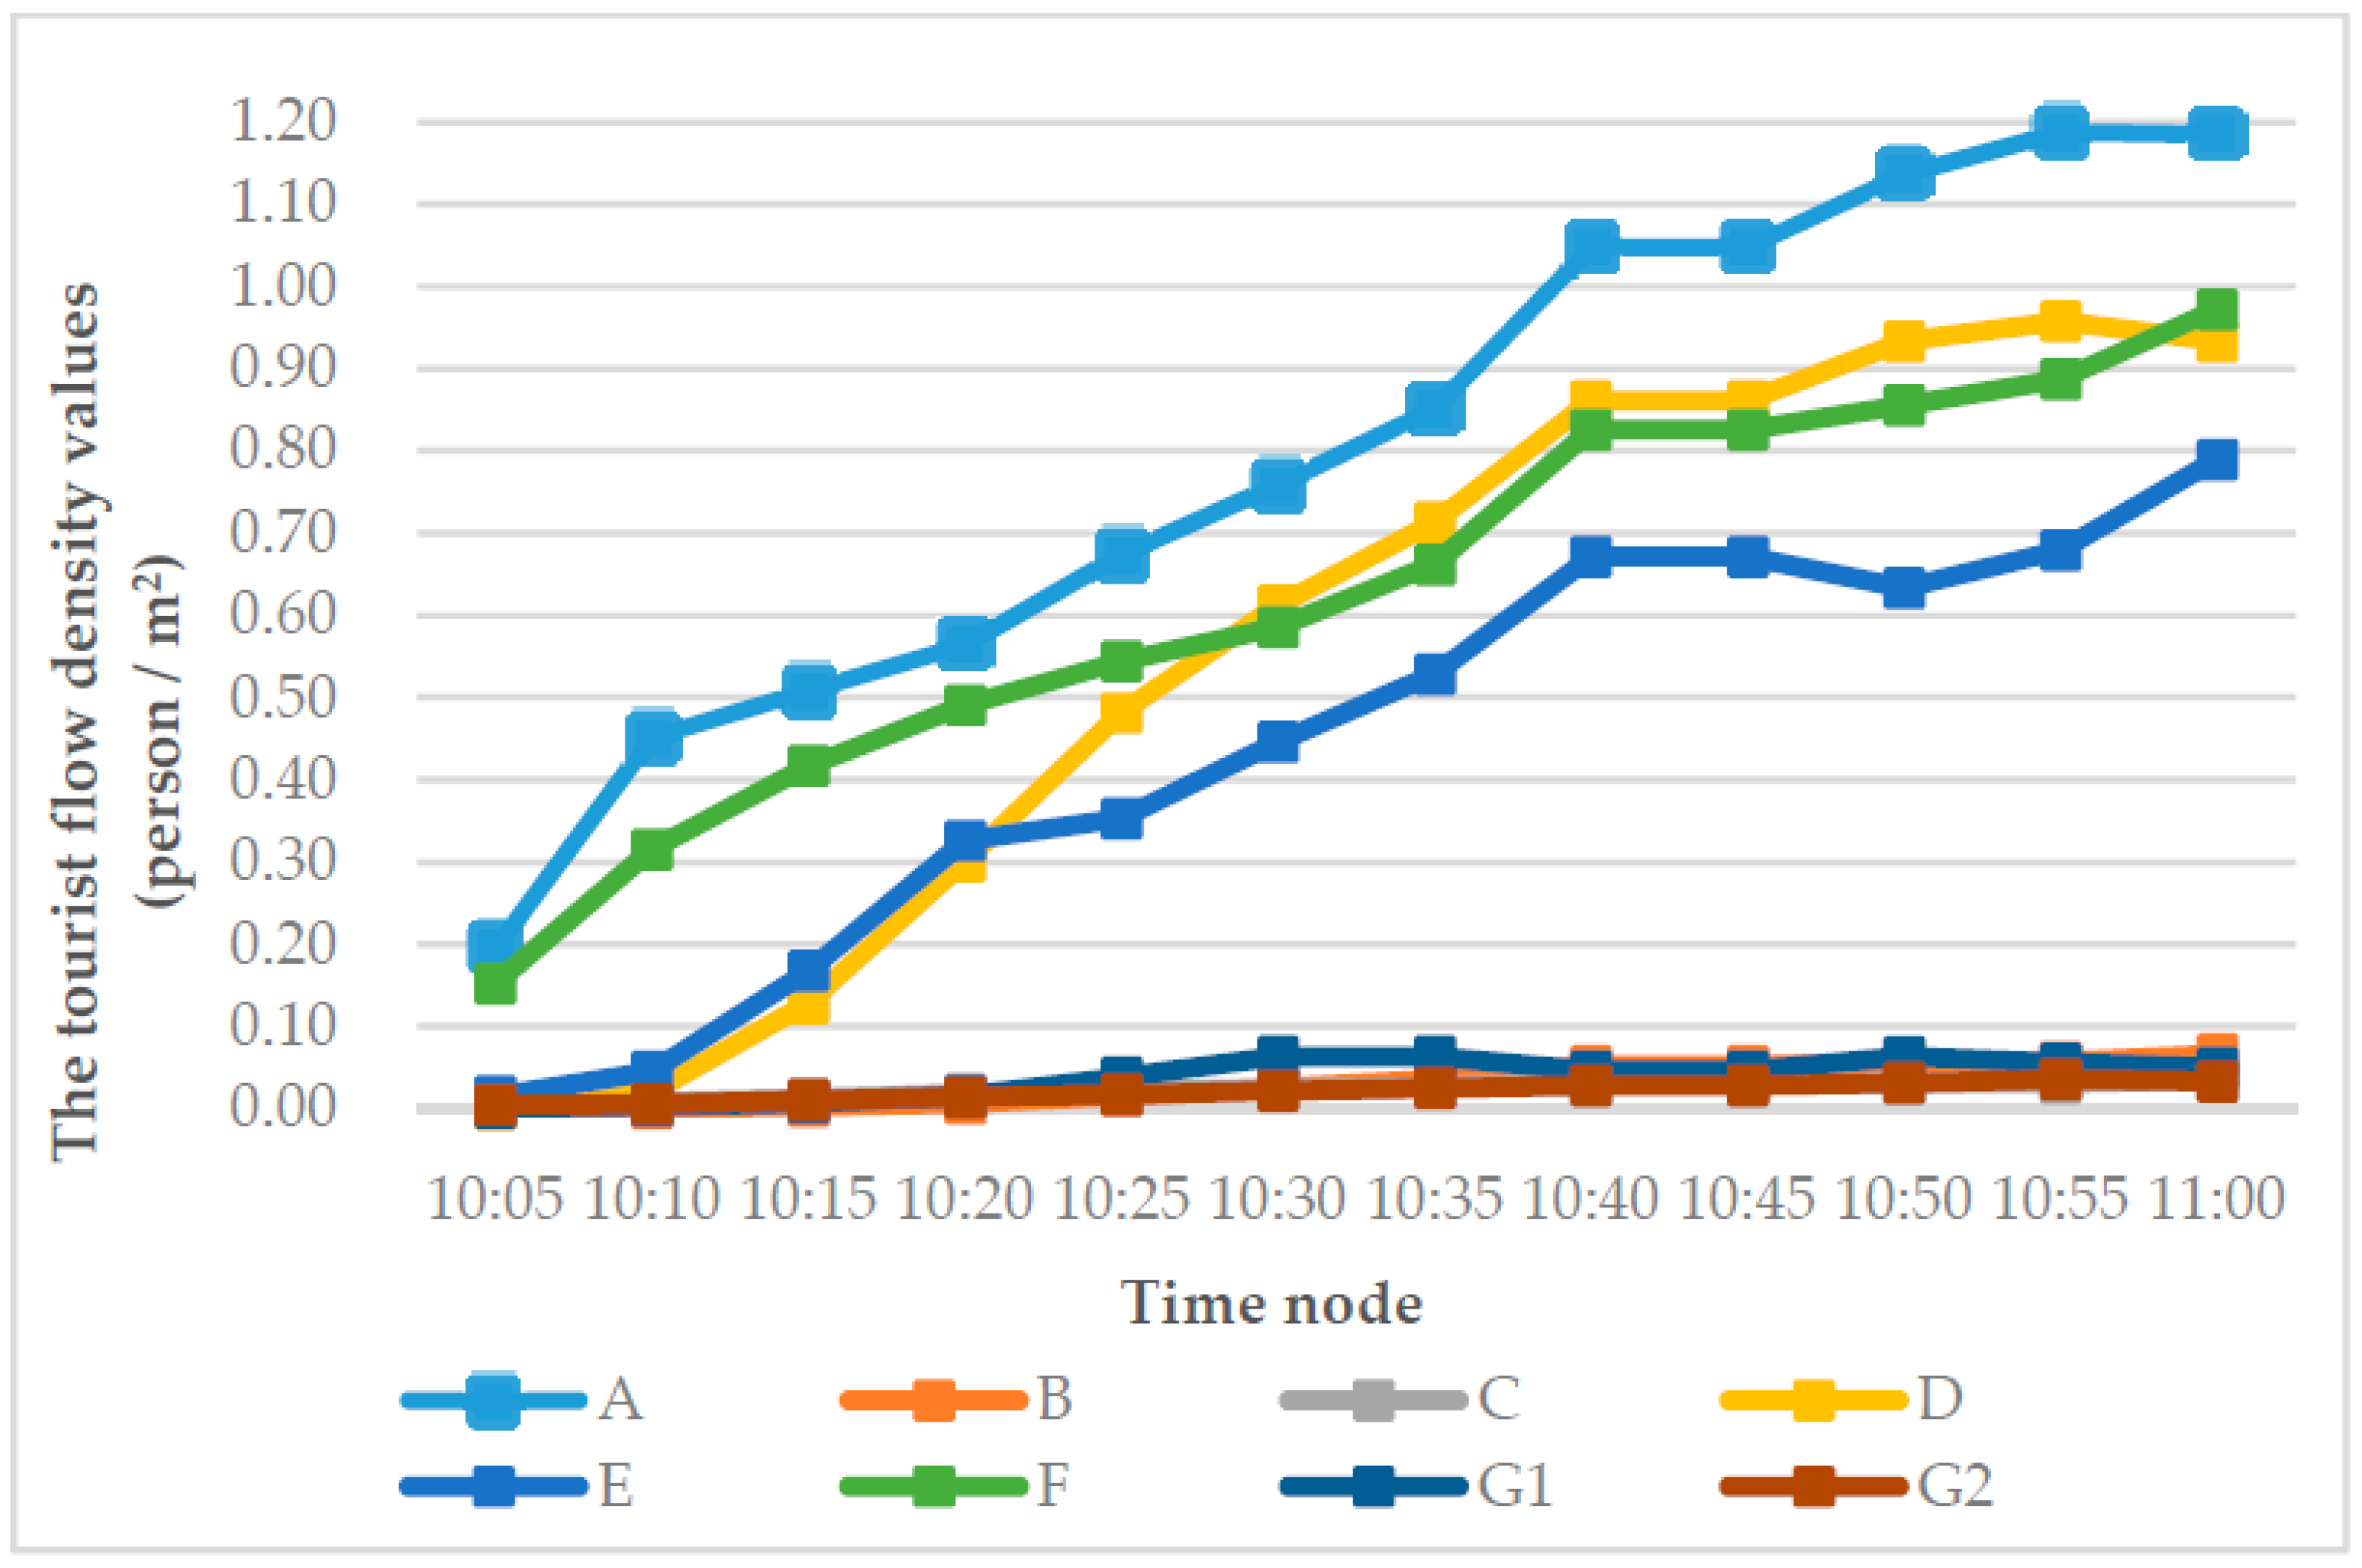
6.3. The Tourist Flow Diversion Simulation Model
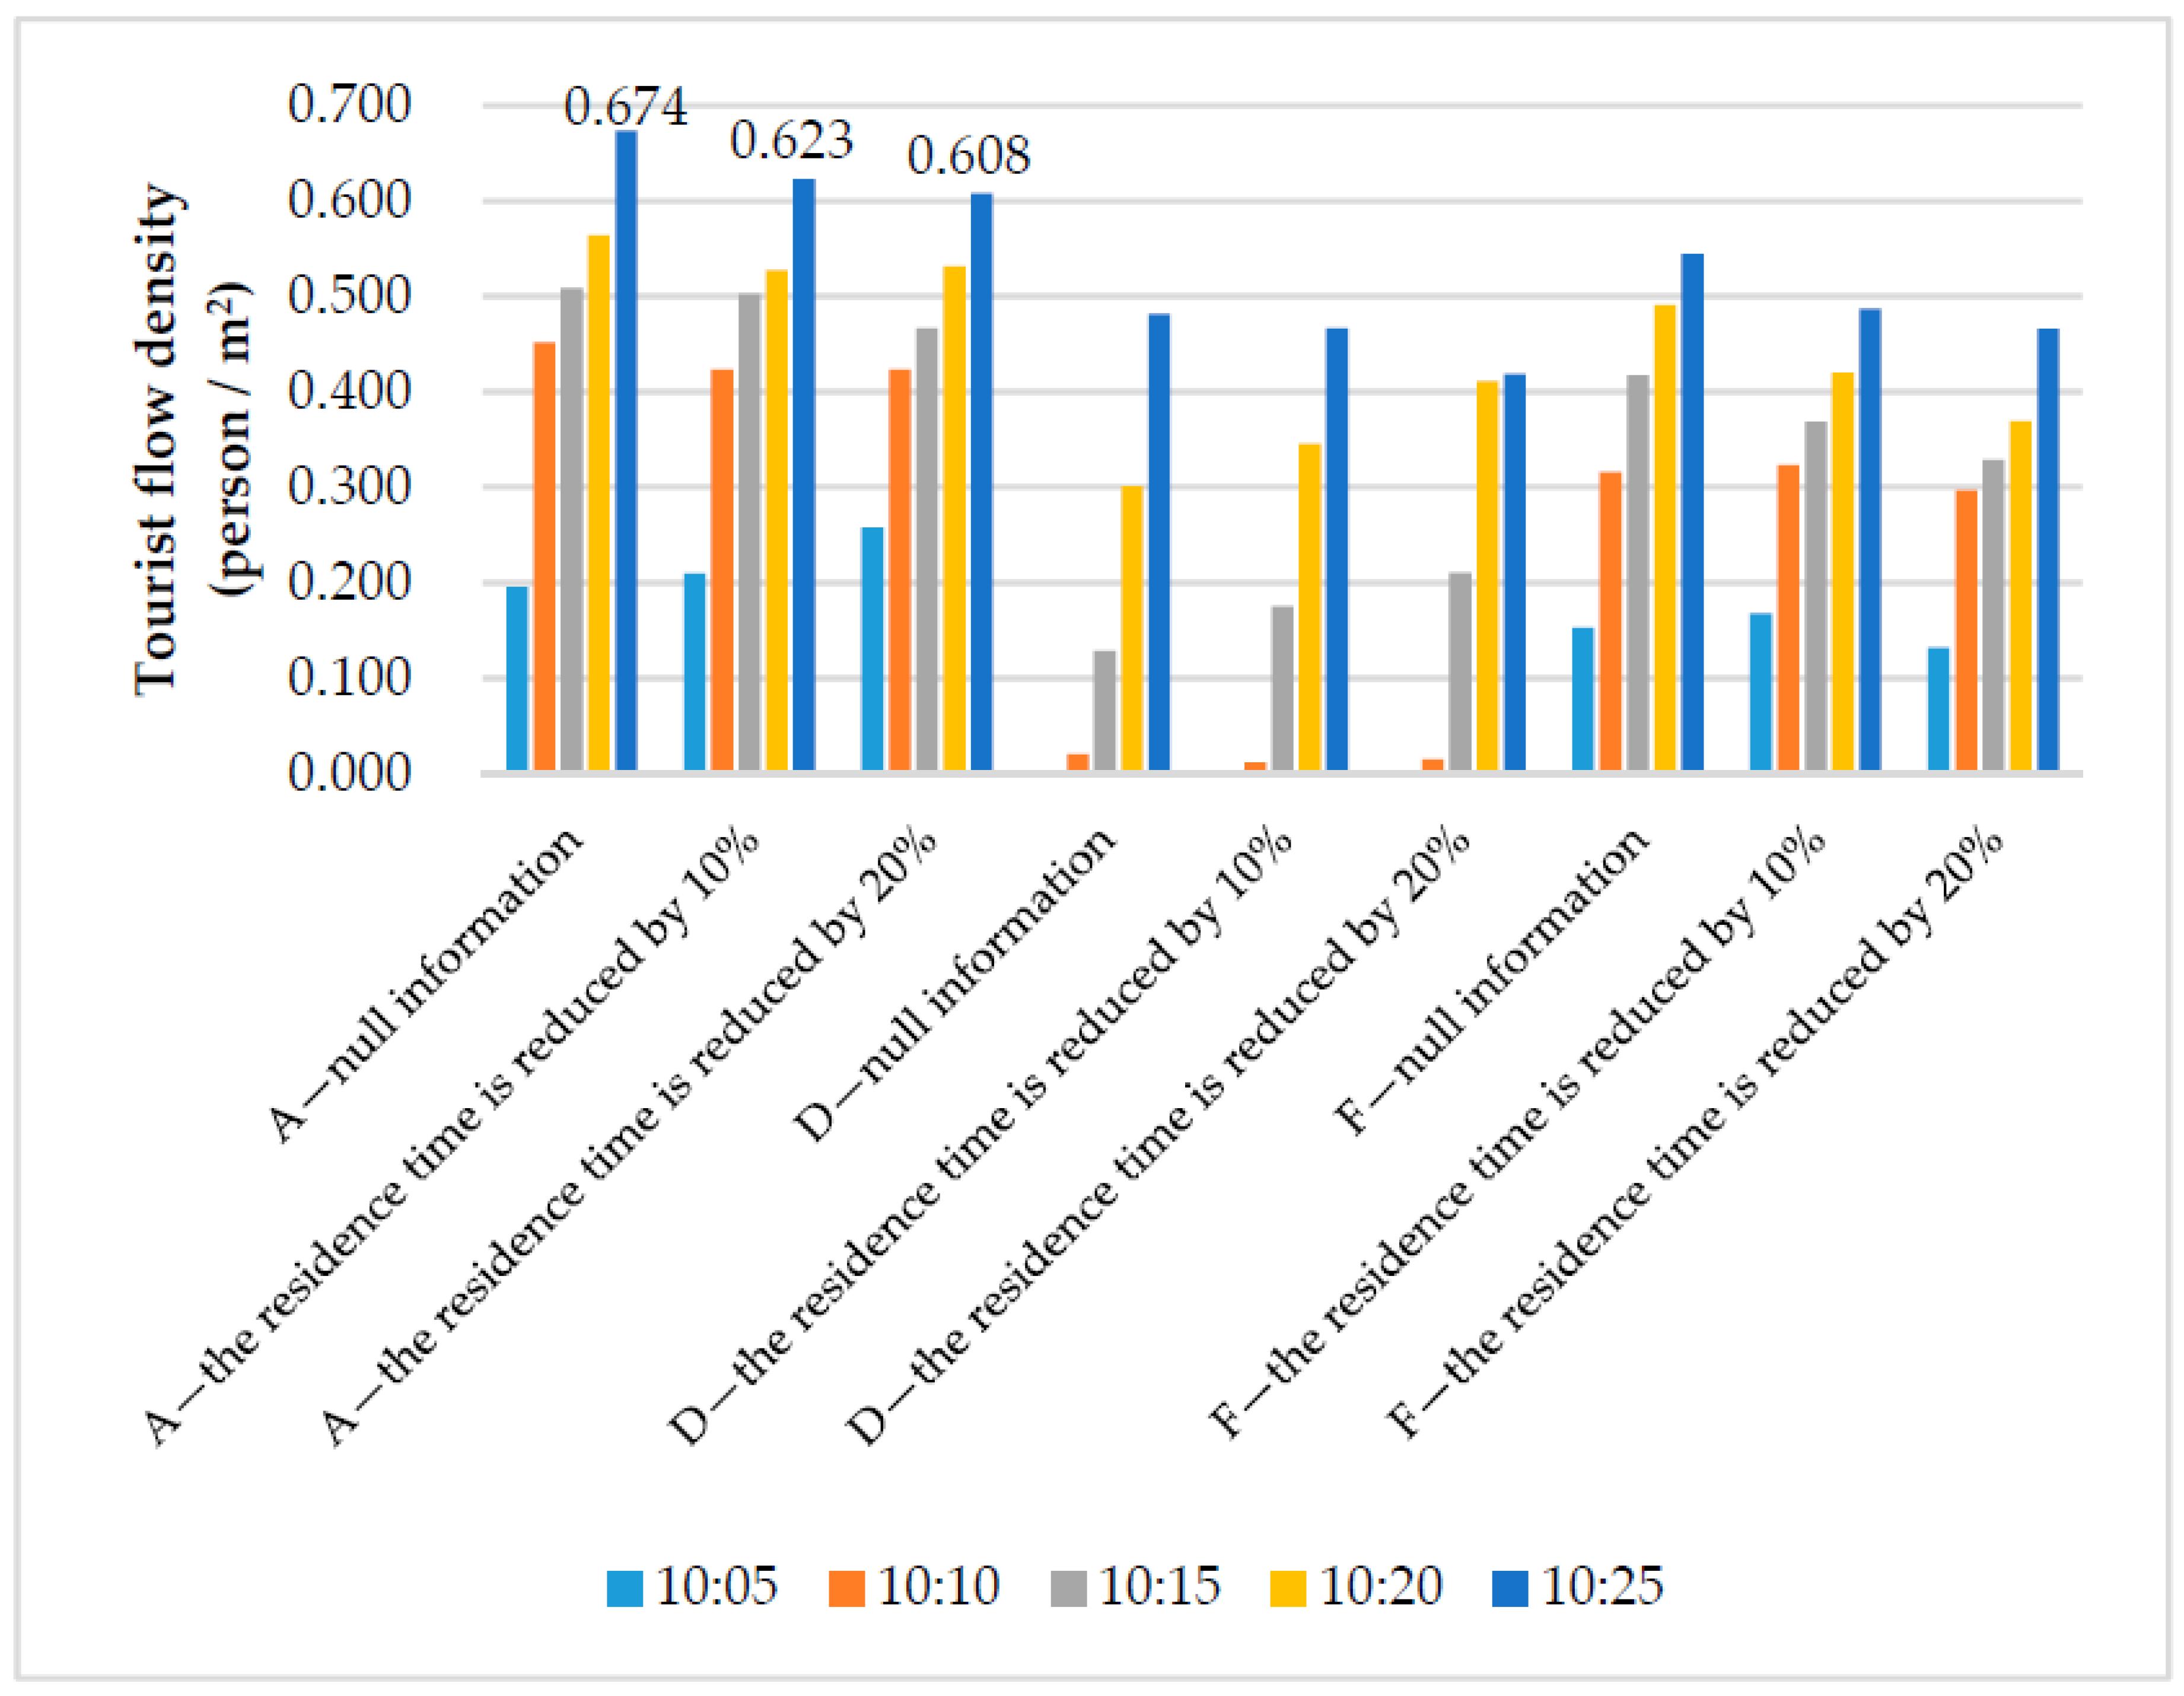
6.3.1. Tourist Flow Diversion Simulation Model under Null Information
6.3.2. Tourist Flow Diversion Simulation Model under Null RTFDSI
7. Conclusions
7.1. Theoretical and Managerial Implications
7.1.1. Theoretical Implications
7.1.2. Managerial Implications
7.2. Limitations and Future Research
Author Contributions
Funding
Conflicts of Interest
References
- Liao, Z.; Jin, M.; Ren, P.; Luo, Y. Research on scenic spot’s sustainable development based on a SD model: A case study of the jiuzhai valley. Sustainability 2014, 6, 4632–4644. [Google Scholar] [CrossRef] [Green Version]
- Zhang, S.; Tang, B. The analysis and countermeasure suggestion of overconcentration of tourist population in Beijing. Econ. Trade Update 2017, 4, 52–55. [Google Scholar] [CrossRef]
- Seraphin, H.; Sheeran, P.; Pilato, M. Over-tourism and the fall of venice as a destination. J. Destin. Mark. Manag. 2018, 9, 374–376. [Google Scholar] [CrossRef]
- Antonio, A.S. The problems of tourist sustainability in cultural cities: Socio-political perceptions and interests management. Sustainability 2018, 10, 503. [Google Scholar] [CrossRef] [Green Version]
- Lalicic, L. Solastalgia: An application in the overtourism context. Ann. Touris. Res. 2019, 102766. [Google Scholar] [CrossRef]
- Insch, A. The challenges of over-tourism facing New Zealand: Risks and responses. J. Destin. Mark. Manag. 2019, 15, 100378. [Google Scholar] [CrossRef]
- Koens, K.; Postma, A.; Papp, B. Is overtourism overused? Understanding the impact of tourism in a city context. Sustainability 2018, 10, 4384. [Google Scholar] [CrossRef] [Green Version]
- Li, J.; Ye, J.; He, Q.; Shao, C. A novel scheme to relieve parking pressure at tourist attractions on holidays. Sustainability 2016, 8, 164. [Google Scholar] [CrossRef] [Green Version]
- Zhu, H.; Guan, H.; Han, Y.; Li, W. A study of tourists’ holiday rush-hour avoidance travel behavior considering psychographic segmentation. Sustainability 2019, 11, 3755. [Google Scholar] [CrossRef] [Green Version]
- Lin, X.; Susilo, Y.; Shao, C.; Liu, C. The implication of road toll discount for mode choice: Intercity travel during the chinese spring festival holiday. Sustainability 2018, 10, 2700. [Google Scholar] [CrossRef] [Green Version]
- Han, Y.; Zhang, T.; Wang, M. Holiday travel behavior analysis and empirical study with Integrated Travel Reservation Information usage. Transport. Res. A Pol. 2020, 134, 130–151. [Google Scholar] [CrossRef]
- The China National Tourism Administration. Guidelines for Measurement of Carry Capacity of Tourist Area; LB/T034-2014; The China National Tourism Administration: Beijing, China, 2014.
- The China National Tourism Administration. The Stand of Responding to Tourist Scenic Area during Peak Hours; LB/T068-2017; The China National Tourism Administration: Beijing, China, 2017.
- Wan, Y. Core-periphery geographical theory in regional tourism planning. Econ. Geogr. 2002, 22, 372–375. [Google Scholar] [CrossRef]
- Huang, X. Tourists Spatial-Temporal Behavior Study, 1st ed.; China Travel & Tourism Press: Beijing, China, 2011; pp. 141–142. [Google Scholar]
- Li, W.; Han, Y.; Wang, P.; Guan, H. Invulnerability analysis of traffic network in tourist attraction under unexpected emergency events based on cascading failure. IEEE Access 2019, 7, 147383–147398. [Google Scholar] [CrossRef]
- Gai, W.; Du, Y.; Deng, Y. Evacuation risk assessment of regional evacuation for major accidents and its application in emergency planning: A case study. Saf. Sci. 2018, 106, 203–218. [Google Scholar] [CrossRef]
- Wang, B.; Shao, C.; Li, J.; Weng, J.; Ji, X. Holiday travel behavior analysis and empirical study under integrated multimodal travel information service. Transp. Policy 2015, 39, 21–36. [Google Scholar] [CrossRef]
- Parvaneh, Z.; Arentze, T.; Timmermans, H. Understanding travelers’ behavior in provision of travel information: A Bayesian belief approach. Procedia Soc. Behav. Sci. 2012, 54, 251–260. [Google Scholar] [CrossRef] [Green Version]
- Kattan, L.; de Barros, A.G.; Saleemi, H. Travel behavior changes and responses to advanced traveler information in prolonged and large-scale network disruptions: A case study of west LRT line construction in the city of Calgary. Transp. Res. F 2013, 21, 90–102. [Google Scholar] [CrossRef]
- Wang, B.; Shao, C.; Ji, X. Dynamic analysis of holiday travel behaviour with integrated multimodal travel information usage: A life-oriented approach. Transp. Res. A Pol. 2017, 104, 255–288. [Google Scholar] [CrossRef]
- Zhongan Online- Anhui Daily. Huangshan use big data command and dispatching system to divert tourists. Available online: http://ah.anhuinews.com/system/2014/10/04/006562349.shtml (accessed on 4 October 2014).
- Licheng Taihang Mountain Huangya Cave Tourism Development Co Ltd. Tourist Flow Control and Diversion Scheme in Huangya Cave during the Peak Period of Tourism. Available online: https://wenku.baidu.com/view/2070f05ebb1aa8114431b90d6c85ec3a87c28ba9.html (accessed on 30 April 2017).
- Li, K.; Chen, X.; Huang, S. The research on large tourist attraction flow diversion navigation system based on RFID technology. Tour. Overv. 2014, 9, 70–72. [Google Scholar]
- Zhang, H.; Xie, C. Tourist area traffic guidance system based on RFID Technology. Netw. Secur. Technol. Appl. 2014, 8, 111–112. [Google Scholar]
- Han, Y.; Yang, G.; Wu, X.; Zhang, S.; Li, W. Tour routes optimization design considering tourists congestion perception. J. Beijing Univ. Technol. 2018, 44, 1537–1546. [Google Scholar]
- O’Hara, M.E. Congestion effects in valuation of recreation land using revealed preference methods: An application to rock climbing resources at New York’s Shawangunk Ridge. Dissertations Theses, Colgate University, Hamilton, NY, USA, 2007. [Google Scholar]
- Sidi, J.; Fa, L.W.; Junaini, S.N. Simulation of traffic congestion at the tourist attraction spot of kuching waterfront, sarawak. In Proceedings of the International Conference on Computer Technology and Development, Kota Kinabalu, Malaysia, 13–15 November 2009; pp. 3–5. [Google Scholar] [CrossRef]
- Wanhill, S.R.C. Charging for congestion at tourist attractions. Int. J. Tour. Manag. 1980, 1, 168–174. [Google Scholar] [CrossRef]
- Anderson, D.H.; Brown, P.J. The displacement process in recreation. J. Leis. Res. 1984, 16, 61–73. [Google Scholar] [CrossRef] [Green Version]
- Hammitt, W.E.; Patterson, M.E. Coping behavior to avoid visitor encounters: Its relationship to wildland privacy. J. Leis. Res. 1991, 23, 225–237. [Google Scholar] [CrossRef]
- Manning, R.E.; Valliere, W.A. Coping in outdoor recreation: Causes and consequences of crowding and conflict among community residents. J. Leis. Res. 2001, 33, 410–426. [Google Scholar] [CrossRef]
- Shailes, A.; Senior, M.L.; Andrew, B.P. Tourists’ travel behaviour in response to congestion: The case of car trips to Cornwall, United Kingdom. J. Transp. Geogr. 2001, 9, 49–60. [Google Scholar] [CrossRef]
- Zhang, C. Tourist Coping Behavior in Crowding Environment: A Case Study on the Xixi National Wetland Park in Hangzhou. Master’s Thesis, Zhejiang Gong Shang University, Hangzhou, China, 2012. [Google Scholar]
- Le, Y.; Aoyagi, S.; Takahashi, K. Understanding Additional Stopover Behaviors of Car Tourists: An Analysis of Combined Route Search and Mobile GPS Travel Trajectory Data. In Proceedings of the 4th International Conference on Intelligent Transportation Engineering, Singapore, 6–8 September 2019; pp. 104–108. [Google Scholar]
- Wang, C.; Wei, F. Measuring the preferences of the visitor’s choice behavior based on the perception of crowding. J. Fujian Jiangxia Univ. 2015, 15, 16–23. [Google Scholar]
- Han, Y.; Wu, X.; Yang, G. Tourists’ congestion perception analysis based on ordered choice model. J. Transp. Syst. Eng. Inf. Technol. 2017, 17, 138–144. [Google Scholar] [CrossRef]
- Jin, Q.; Hu, H.; Kavan, P. Factors influencing perceived crowding of tourists and sustainable tourism destination management. Sustainability 2016, 8, 976. [Google Scholar] [CrossRef] [Green Version]
- Lawson, S.R. Computer simulation as a tool for planning and management of visitor use in protected natural areas. J. Sustain. Tour. 2006, 14, 600–617. [Google Scholar] [CrossRef]
- Zhang, R.; Wang, Q.; Zhou, Q. Micro-simulation of tourists? Behaviors in nature heritage resort: A case study on Mount Emei Tourist Area. IEEE Comput. Soc. 2007, 118–122. [Google Scholar] [CrossRef]
- Zhang, R. A Tourists’ spatial behavior simulator based on GIS and Multi-Agent system. J. Sichuan Norm. Univ. (Nat. Sci.) 2006, 29, 495–4987. [Google Scholar]
- Li, N. Agent-based simulation modeling of visitor behaviors at tourism attractions: The case of the Summer Palace, Beijing. Tourism Trib. 2014, 29, 62–72. [Google Scholar] [CrossRef]
- Geng, Q.; Huang, X.; Jiang, W.; Li, X. Design and implementation of attractions evaluation system based on Web. Comput. Mod. 2012, 10, 191–193. [Google Scholar]
- Yang, G. Research on Tourists’ Decision-Making Behavior under Information Dissemination. Master’s Thesis, Beijing University of Technology, Beijing, China, 2018. [Google Scholar]
- Han, Y.; Guan, H.; Li, D. Analysis of trip attitude adjustment of public transit of the elderly based on heider’s balance theory. J. Beijing Univ. Technol. 2015, 41, 906–911. [Google Scholar]
- Hassan, M.N.; Najmi, A.; Rashidi, T.H. A two-stage recreational destination choice study incorporating fuzzy logic in discrete choice modelling. Transp. Res. F 2019, 67, 123–141. [Google Scholar] [CrossRef]
- Li, Y.; Yang, L.; Shen, H.; Wu, Z. Modeling intra-destination travel behavior of tourists through spatio-temporal analysis. J. Destin. Mark. Manag. 2019, 11, 260–269. [Google Scholar] [CrossRef]
- Oppewal, H.; Huybers, T.; Crouch, G.I. Tourist destination and experience choice: A choice experimental analysis of decision sequence effects. Tour. Manag. 2015, 48, 467–476. [Google Scholar] [CrossRef]
- Wu, L.; Zhang, J.; Fujiwara, A. A tourist’s multi-destination choice model with future dependency. Asia Pac. J. Tour. Res. 2012, 17, 121–132. [Google Scholar] [CrossRef]
- Vieira, J.; Câmara, G.; Silva, F.; Santos, C. Airline choice and tourism growth in the Azores. J. Air Transp. Manag. 2019, 77, 1–6. [Google Scholar] [CrossRef]
- Alderighi, M.; Gaggero, A.A. Flight availability and international tourism flows. Ann. Tour. Res. 2019, 79, 102642. [Google Scholar] [CrossRef]
- Meleddu, M.; Paci, R.; Pulina, M. Repeated behaviour and destination loyalty. Tour. Manag. 2015, 50, 159–171. [Google Scholar] [CrossRef]
- Do Valle, P.O.; Correia, A.; Rebelo, E. Determinants of tourism return behavior. Tour. Hosp. Res. 2008, 8, 205–219. [Google Scholar] [CrossRef]
- Seok Lee, W.S.; Lee, J.K.; Moon, J. Influential attributes for the selection of luxury camping: A mixed-logit method. J. Hosp. Tour. Manag. 2019, 40, 88–93. [Google Scholar] [CrossRef]
- León, C.J.; de León, J.; Araña, J.E.; González, M.M. Tourists’ preferences for congestion, residents’ welfare and the ecosystems in a national park. Ecol. Econ. 2015, 118, 21–29. [Google Scholar] [CrossRef]
- McFadde, D. Conditional Logit Analysis of Qualitative Choice Behavior; Academic Press: Salt Lake City, UT, USA, 1974. [Google Scholar]
- Ben-Akiva, M.; Lerman, S.R. Discrete Choice Analysis: Theory and Application to Travel Demand; MIT Press: Cambridge, UK, 1985. [Google Scholar]
- Anciaes, P.; Metcalfe, P.; Heywood, C.; Sheldon, R. The impact of fare complexity on rail demand. Transp. Res. A Pol. 2019, 120, 224–238. [Google Scholar] [CrossRef]
- Wang, C.; Wang, D.; Zhu, W.; Song, S. Research progress of discrete choice models. Prog. Geogr. 2015, 34, 1275–1287. [Google Scholar]
- Horowitz, J. Reconsidering the multinomial probit model. Transp. Res. B Methodol. 1991, 25, 433–438. [Google Scholar] [CrossRef]
- Train, K.E. Discrete Choice: Methods with Simulation; Cambridge University Press: Cambridge, UK, 2009. [Google Scholar]
- Guan, H. Disaggregate Model- A Tool of Traffic Behavior Analysis; China Communications Press: Beijing, China, 2004. [Google Scholar]
- Louviere, J.J.; Hensher, D.A.; Swait, J.D.; Adamowicz, W. Swait Stated Choice Methods: Analysis and Applications; Cambridge University Press: Cambridge, UK, 2000. [Google Scholar]
- Qin, H.; Gao, J.; Zhang, G.; Chen, Y.; Wu, S. Nested logit model formation to analyze airport parking behavior based on stated preference survey studies. J. Air Transp. Manag. 2017, 58, 164–175. [Google Scholar] [CrossRef]
- Bonnel, P.; Nir, M.L. The quality of survey data: Telephone versus face-to-face interviews. Transportation 1998, 25, 147–167. [Google Scholar] [CrossRef]
- Szolnoki, G.; Hoffmann, D. Online, face-to-face and telephone surveys—Comparing different sampling methods in wine consumer research. Wine Econ. Policy 2013, 2, 57–66. [Google Scholar] [CrossRef] [Green Version]
- Liu, M. Data collection mode differences between national face-to-face and web surveys on gender inequality and discrimination questions. Women Stud. Int. Forum 2017, 60, 11–16. [Google Scholar] [CrossRef]
- Shelby, B.; Vaske, J.J.; Heberlein, T.A. Comparative analysis of crowding in multiple locations: Results from fifteen years of research. Leis. Sci. 1989, 11, 269–291. [Google Scholar] [CrossRef]
- Wu, X. Research on Subjective and Objective Crowding Perception in Tourist Spots. Master’s Thesis, Beijing University of Technology, Beijing, China, 2017. [Google Scholar]
- Manning, R.; Lawson, S.; Newman, P.; Laven, D.; Valliere, W. Methodological issues in measuring crowding-related norms in outdoor recreation. Leis. Sci. 2002, 24, 339–348. [Google Scholar] [CrossRef]
- QQcom. Big Data Report on Beijing Cultural and Tourism Consumption. Available online: https://new.qq.com/omn/20190617/20190617A0NNN500 (accessed on 17 June 2019).
- Grigoryev, L. AnyLogic 7 in Three Days System Modeling and Simulation—Using AnyLogic 7; Tsinghua University Press: Beijing, China, 2017; pp. 125–126. [Google Scholar]
- Li, N. A Computer simulation model for visitors’ recreational behaviors at tourism attractions: A case study of the Summer Palace. Tour. Sci. 2013, 27, 42–51. [Google Scholar] [CrossRef]


| Attribute | Category | Quantity | Proportion | Analysis of Beijing Tourists |
|---|---|---|---|---|
| Gender | Male | 100 | 49.5% | 51.19% |
| Female | 102 | 50.5% | 48.81% | |
| Age | <20 | 2 | 1.0% | 6.9% |
| 20–29 | 126 | 62.4% | 21.3% | |
| 30–39 | 57 | 28.2% | 39.0% | |
| >39 | 17 | 8.4% | 32.8% | |
| Education level | High school and below | 20 | 9.9% | |
| Undergraduate college, Junior college | 120 | 59.4% | ||
| Master | 57 | 28.2% | ||
| Doctor | 5 | 2.5% | ||
| Number of visits | 1 time | 98 | 48.5% | |
| 2–3 times | 68 | 33.7% | ||
| 4–5 times | 17 | 8.4% | ||
| ≥6 times | 19 | 9.4% |
| Variable Name | Classify | Dummy Variable | ||
|---|---|---|---|---|
| Education Level (Abbr. Edu) | Edu 1: Undergraduate, junior college | 1 | 0 | |
| Edu 2: Master, Doctor | 0 | 1 | ||
| Edu 3: High School and below | 0 | 0 | ||
| Number of visits (Abbr. Num) | Num 1: 1 time | 1 | 0 | 0 |
| Num 2: 2–3 times | 0 | 1 | 0 | |
| Num 3: 4–5 times | 0 | 0 | 1 | |
| Num 4: ≥6 times | 0 | 0 | 0 | |
| The current situation’s tour guide mode: recommended tour route (Abbr. CTGM) | Yes | 1 | ||
| No | 0 | |||
| The desired tour guide mode: optionally visit (Abbr. DTGM) | Yes | 1 | ||
| No | 0 | |||
| The tourist congestion perception degree of the current tourist spot (Abbr. Congestion degree) | Congestion degree 1: 1, 2 | 1 | 0 | 0 |
| Congestion degree 2: 4 | 0 | 1 | 0 | |
| Congestion degree 3: 5 | 0 | 0 | 1 | |
| Congestion degree 4: 3 | 0 | 0 | 0 | |
| Concern 1: the congestion duration of core tourist spots | Yes | 1 | ||
| No | 0 | |||
| Concern 2: the distance between core and recommended periphery tourist spots | Yes | 1 | ||
| No | 0 | |||
| Concern 3: the tour route recommendation under congestion conditions | Yes | 1 | ||
| No | 0 | |||
| Concern 4: the ornamental value of each tourist spot | Yes | 1 | ||
| No | 0 | |||
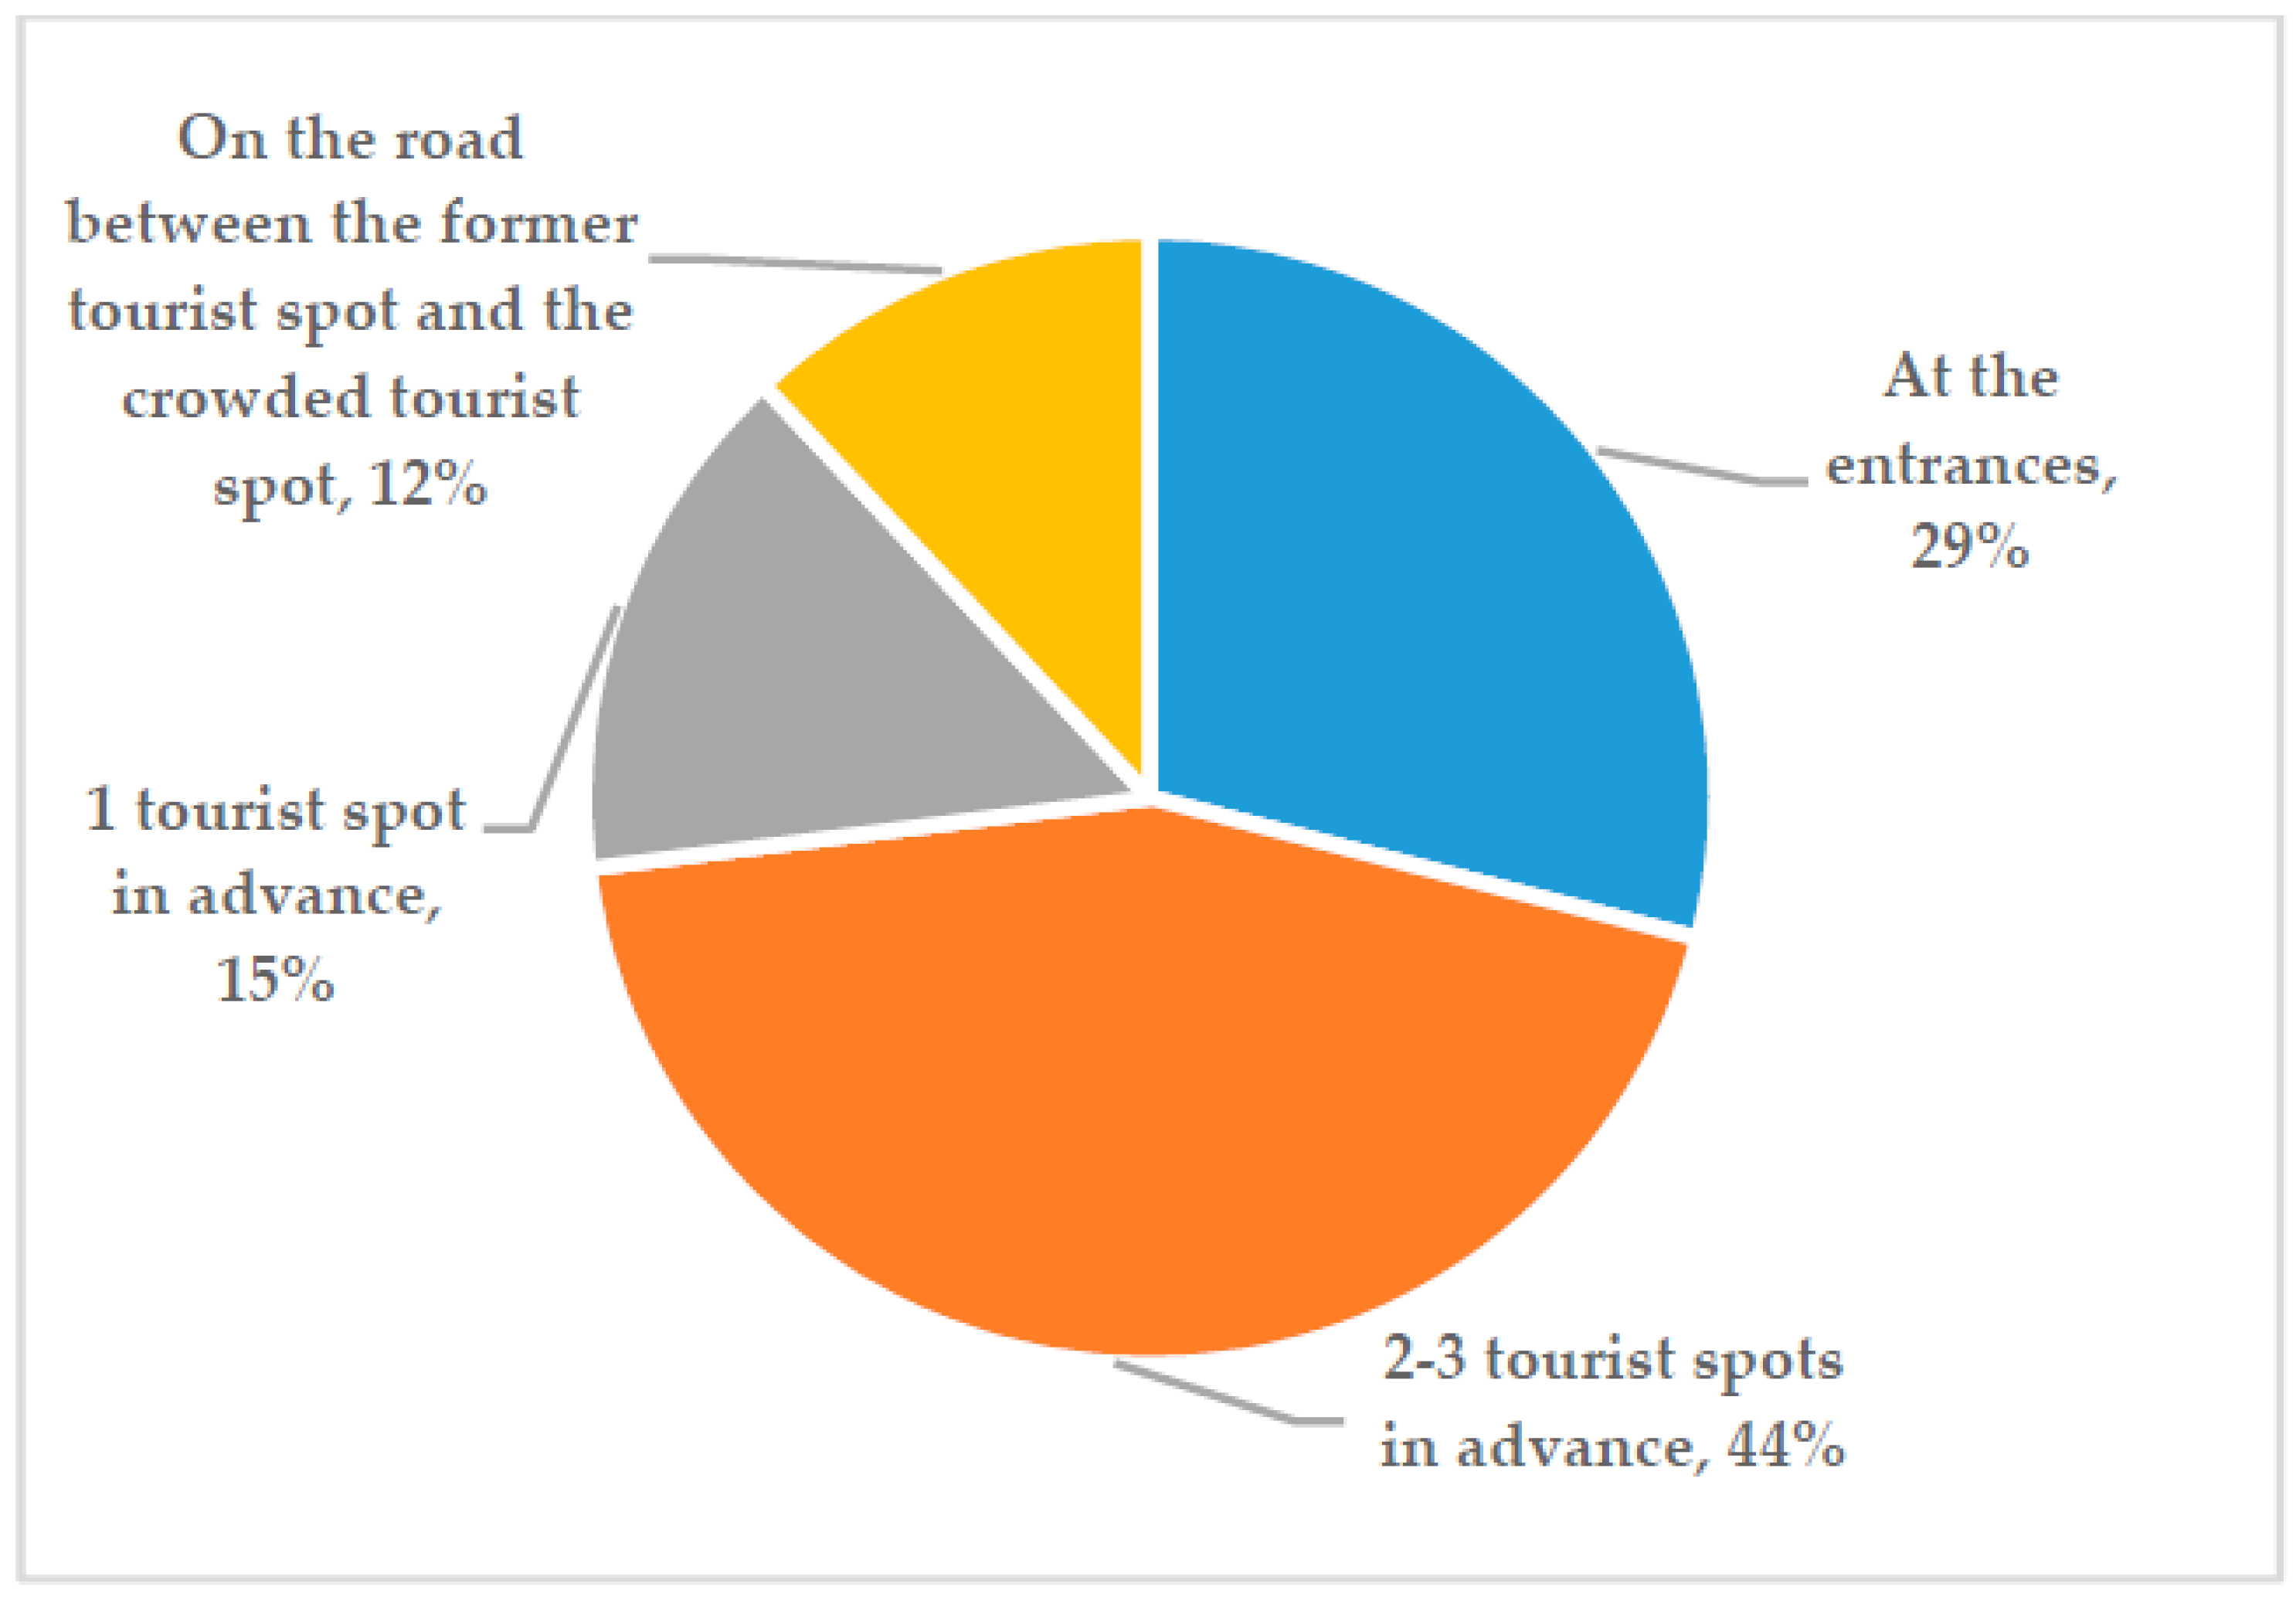
| The desired location of information release (Abbr. Location) | Location 1: Entrance, 1 tourist spot in advance | 1 | 0 | |
| Location 2: The road between the previous spot and the crowded spot | 0 | 1 | ||
| Location 3: 2–3 tourist spots in advance | 0 | 0 | ||
| The desired form of information release: the tour route recommendation under congestion conditions (Abbr. Form) | Yes | 1 | ||
| No | 0 | |||
| Coefficient | Explanatory Variable | Estimated Value | Std. Err. | t-Test Value | |
|---|---|---|---|---|---|
| The inherent dummy | ASCI | −1.664 | 0.920 | −1.809 * | |
| The inherent dummy | ASCI | 2.212 | 0.535 | 4.132 *** | |
| Congestion degree 1 | 0.825 | 0.444 | 1.858 * | ||
| Congestion degree 2 | 0.499 | 0.453 | 1.104 | ||
| Congestion degree 3 | 0.946 | 0.384 | 2.460 ** | ||
| Age | 0.059 | 0.0269 | 2.198 ** | ||
| Edu 1 | 1.606 | 0.441 | 3.637 *** | ||
| Edu 2 | 0.772 | 0.435 | 1.774 * | ||
| Num 1 | 0.554 | 0.416 | 1.332 | ||
| Num 2 | 0.489 | 0.376 | 1.300 | ||
| Num 3 | 1.220 | 0.602 | 2.026 ** | ||
| CTGM | −1.293 | 0.533 | −2.427 ** | ||
| DTGM | −0.924 | 0.459 | −2.016 ** | ||
| Concern 1 | 0.656 | 0.364 | 1.802 * | ||
| Concern 2 | −1.345 | 0.425 | −3.168 *** | ||
| Concern 3 | 0.713 | 0.369 | 1.932 * | ||
| Concern 4 | −0.846 | 0.390 | −2.167 ** | ||
| Location 1 | 0.429 | 0.332 | 1.292 | ||
| Location 2 | 0.878 | 0.507 | 1.731 * | ||
| Form | −0.783 | 0.369 | −2.125 ** | ||
| N = 202; = −221.920; = −176.819; = 90.201; = 0.203 | |||||
| Tourist Spot | Continue to Visit without Shortening Their Residence Time | Continue to Visit, Shorten the Residence Time | Leave the Current Tourist Spot Immediately |
|---|---|---|---|
| A | 16% | 72% | 12% |
| B | 53% | 11% | 37% |
| C | 58% | 29% | 13% |
| D | 16% | 26% | 58% |
| E | 45% | 47% | 8% |
| F | 18% | 61% | 21% |
| G1,G2 | 22% | 47% | 31% |
| Tourist Spot | Survey Samples of Tourist Spots’ Residence Time (Unit: Minute) | |
|---|---|---|
| The Individual Tourists | The Group Tourists | |
| A | 5–12 | 5–10 |
| B | 15–25 | 15–25 |
| C | 15–25 | 15–25 |
| D | 5–12 | 3–12 |
| E | 5–12 | 3–12 |
| F | 5–15 | 5–11 |
| G1 | 5–12 | 5–12 |
| G2 | 5–20 | 5–20 |
| Tourists Type | Tourism Speed Range |
|---|---|
| The individual tourists | 0.82–1.38 |
| The group tourists | 1.32–1.44 |
| Time Period | Origin | Destination | Individual Tourists Transfer Proportion | Group Tourists Transfer Proportion |
|---|---|---|---|---|
| 10:00–11:00 | A | B | 0.05 | 0.00 |
| C | 0.06 | 0.00 | ||
| D | 0.13 | 0.37 | ||
| the middle passage | 0.06 | 0.05 | ||
| the north passage | 0.05 | 0.05 | ||
| the south passage | 0.35 | 0.00 | ||
| M | 0.30 | 0.53 |
| Time Period | Origin | The Tourist Flow Volume Entering the Simulation Environment (Unit: Person) | |
|---|---|---|---|
| The Individual Tourists | The Group Tourists | ||
| 10:00–11:00 | M | 1729 | 757 |
| C | 731 | 0 | |
| J | 1173 | 1113 | |
| K | 917 | 0 | |
| L | 1097 | 894 | |
| Tourist Spot | Residence Time after Reducing 10% | Residence Time after Reducing 20% | ||
|---|---|---|---|---|
| Individual Tourists’ Residence Time | Group Tourists’ Residence Time | Individual Tourists’ Residence Time | Group Tourists’ Residence Time | |
| A | 5–10 min | 5–9 min | 5–9 min | 5–7 min |
| D | 5–10 min | 3–11 min | 5–9 min | 3–9 min |
| F | 5–13 min | 5–9 min | 5–11 min | 5–8 min |
© 2020 by the authors. Licensee MDPI, Basel, Switzerland. This article is an open access article distributed under the terms and conditions of the Creative Commons Attribution (CC BY) license (http://creativecommons.org/licenses/by/4.0/).
Share and Cite
Yang, G.; Han, Y.; Gong, H.; Zhang, T. Spatial-Temporal Response Patterns of Tourist Flow under Real-Time Tourist Flow Diversion Scheme. Sustainability 2020, 12, 3478. https://doi.org/10.3390/su12083478
Yang G, Han Y, Gong H, Zhang T. Spatial-Temporal Response Patterns of Tourist Flow under Real-Time Tourist Flow Diversion Scheme. Sustainability. 2020; 12(8):3478. https://doi.org/10.3390/su12083478
Chicago/Turabian StyleYang, Guang, Yan Han, Hao Gong, and Tiantian Zhang. 2020. "Spatial-Temporal Response Patterns of Tourist Flow under Real-Time Tourist Flow Diversion Scheme" Sustainability 12, no. 8: 3478. https://doi.org/10.3390/su12083478