Article

Effect of Decarbonisation Policies and Climate Change on Environmental Impacts due to Heating and Cooling in a Single-Family House

by
Daniel González-Prieto
1,
Yolanda Fernández-Nava
2,
Elena Marañón
2 and
Maria Manuela Prieto
1,*
1
Energy Department, University of Oviedo, Campus of Gijón, 33204 Gijón, Spain
2
Chemical and Environmental Engineering Department, University of Oviedo, Campus of Gijón, 33204 Gijón, Spain
*
Author to whom correspondence should be addressed.
Sustainability 2020, 12(9), 3529; https://doi.org/10.3390/su12093529
Submission received: 27 March 2020 / Revised: 15 April 2020 / Accepted: 23 April 2020 / Published: 26 April 2020
(This article belongs to the Section Energy Sustainability)

Abstract

:
Climate change is associated with global warming. This paper discusses the environmental impacts of the decarbonisation plan proposed by the Spanish Government, comparing the current situation with those foreseen for 2020 and 2030. Furthermore, climate change will vary the thermal demands of buildings. The paper thus investigates the heating and cooling demands of a type of single-family house located in eight Spanish cities with very different climates and altitude. The combined effects of the decarbonisation plan and climate change are analysed based on the environmental impacts caused by the electricity required to meet thermal demands. Both effects led to a reduction of the damage in the categories Human Health (59–68%), Climate Change (57–67%) and Resources (54–65%). However, the damage to Ecosystem Quality will increase (5–28%) as a result of the greater impact on this damage category from the energy production scenario for 2030, although thermal requirements in households will decrease.

1. Introduction

Climate change associated with global warming and decreasing fossil fuel reserves has led to the need to increase the use of renewable sources and to stricter environmental regulations.
The energy policy framework in Spain is highly conditioned by the European Union (EU), which is affected by the global context. The Framework Convention on Climate Change [1], internationally known as the Paris Agreement, held in 2015, resulted in the most ambitious response to date to the effects of climate change. The EU ratified the Agreement in 2016, thus establishing the starting point for energy policies in the scenario of climate change in the near horizon.
The three key legislative pieces of the “Clean energy for all Europeans” package [2] came into force on 24 December 2018 with the aim of reducing greenhouse gas emissions, increasing the proportion of renewable energy in the system and improving energy efficiency in the EU by 2030: (i) Directive 2018/2002/EU on energy efficiency [3,4], mainly related with the increase in the efficiency of electricity generation and use, sets the objective of improving energy efficiency by 32.5% by 2030; (ii) Directive (EU) 2018/2001 for the promotion and use of renewable energy [5] sets a mandatory objective for the EU to increase the renewable energy contribution to at least 32% of the total final energy consumption by 2030; (iii) and Regulation (EU) 2018/1999 on the Governance of the Energy and Action Union for Climate [6] defines the design of the electricity market.
To this should be added the Communication by the European Commission, COM/2018/773 [7], which constitutes its roadmap towards a systematic decarbonisation of the economy by 2050. Regarding Spain, the policy of decarbonisation was proposed in the National Integrated Energy and Climate Plan [8] (Spanish Ministry of Ecological Transition, 2019), which proposes scenarios for the evolution of electricity production and energy sources from now until 2030.
Several studies have addressed future scenarios of electricity production, both for EU countries and for non-EU countries, analysing a number of environmental impacts: Portugal [9]; Spain [10]; Turkey [11]; Germany [12]; Japan [13]; and, employing a more local approach, at the city level, the USA [14].

Energy Demand and Sustainability for Space Conditioning in a Context of Energy Decarbonisation

In the European Union, buildings represent 40% of the final energy consumption, 36% of CO2 emissions, 30% of the consumption of raw materials and 12% of water consumption, and they produce 30% of the waste destined to landfill [15]. The need to reduce energy consumption due to the use of buildings (operational energy) has led to special directives for the achievement of nearly zero energy buildings in the EU in 2020 [4,16,17].
The transposition of the directives that affect buildings in Spain was carried out through the Spanish Technical Building Code (STBC) [18] and subsequent modifications [19,20,21].
Operational energy comprises the building’s energy requirements during its useful life, from commissioning to demolition (not including maintenance or renovations). It includes the energy used for space heating and cooling, appliances, domestic hot water and electricity use for lighting, fans and pumps. Previous regulations focus to a great extent on reducing energy demand for the thermal conditioning of buildings (heating and cooling), and these demands are greatly affected both by the design (geometry, materials and orientation) of the building and by climate data; therefore, these aspects will form an important part of this paper.
The climate is currently undergoing major changes. Variations in the climate affect the dataset underlying the tools to calculate building demand.
For the environmental and sustainability assessments of buildings, methodologies based on the life cycle analysis (LCA) are being increasingly used; hence, the impacts from the extraction of material resources to the demolition of buildings are duly considered. Once the building has been constructed, energy consumption (operational energy) resulting from the use of the building becomes very important.
Currently, Spanish and European standards have been approved, such as those referring to the evaluation of the environmental performance of buildings [22] and the standard that regulates the environmental declaration of the product for construction [23]. The environmental regulation focuses in detail on stages that consider the production of the elements or components for the building: extraction of raw materials, transportation to the factory and manufacturing; once the building has been constructed, the stage of use of the building, that includes maintenance, renovation and energy consumption (operational energy); and, finally, the stages of deconstruction and reuse of parts.
Although LCA was first applied to energy use during the life cycle of buildings by Adalberth in 1997 [24], LCA studies have not been extensively applied to the building industry until more recently [25,26,27,28].
Due to the large amount of data required to perform an LCA, it is advisable to use a software application that makes the study much more efficient. SimaPro and Gabi software are some of the most widely used applications in studies of this kind [29,30,31,32], although there are also specific building life cycle assessment tools [33]. As for the impact assessment methodologies used in the different LCA studies applied to buildings, these are varied and depend on the objective and scope of the study. However, the method employed must be consistent with International Standard Organization (ISO) recommendations for impact assessment methods [34,35].
The scope of LCA studies in buildings is also variable and can be applied to the entire life cycle of the building [36,37], to some stages [38], or focus solely on the manufacturing of construction materials [32]. The energy and annual operational CO2 emissions of early decisions regarding the design of buildings in a scenario of climate change is considered for a residential building in Turkey [39]. Other studies refer to the energy demand variation until 2050 in renovated buildings in a district in Portugal [40] and to the impact of climate change on related CO2 emissions [41]. The calculation of the LCA in different types of residential buildings, both passive houses and traditional constructions, is studied using SimaPro and the Impact 2002+ method [31]. The impact of the rehabilitation stage has also been analysed in different contributions to the literature [28], and the extension of life and duration, comparing new and renovated buildings, have also been addressed [42].
Bearing in mind the foreseeable changes in the Spanish energy mix aimed at contributing to the energy decarbonisation of Europe, as well as present-day and future climate changes and the major impact of buildings as energy consumers, mainly due to their thermal conditioning, this study was carried out in order to know the impact that these changes will have on a typical single-family house with high thermal performance.
This paper analyses: (1) the environmental impacts of the decarbonisation policy in the National Integrated Energy and Climate Plan for Spain (NIECP), focusing more specifically on electricity generation; (2) the impacts of the proposed electricity generation on the energy used for the thermal conditioning of a single-family reference house. This house is designed with a high energy performance envelope and has been sited in different locations and climates in Spain. Moreover, the conditioning demands are calculated taking into account climate evolution models with a 2020 and 2030 horizon, which is as far as the NIECP currently covers.

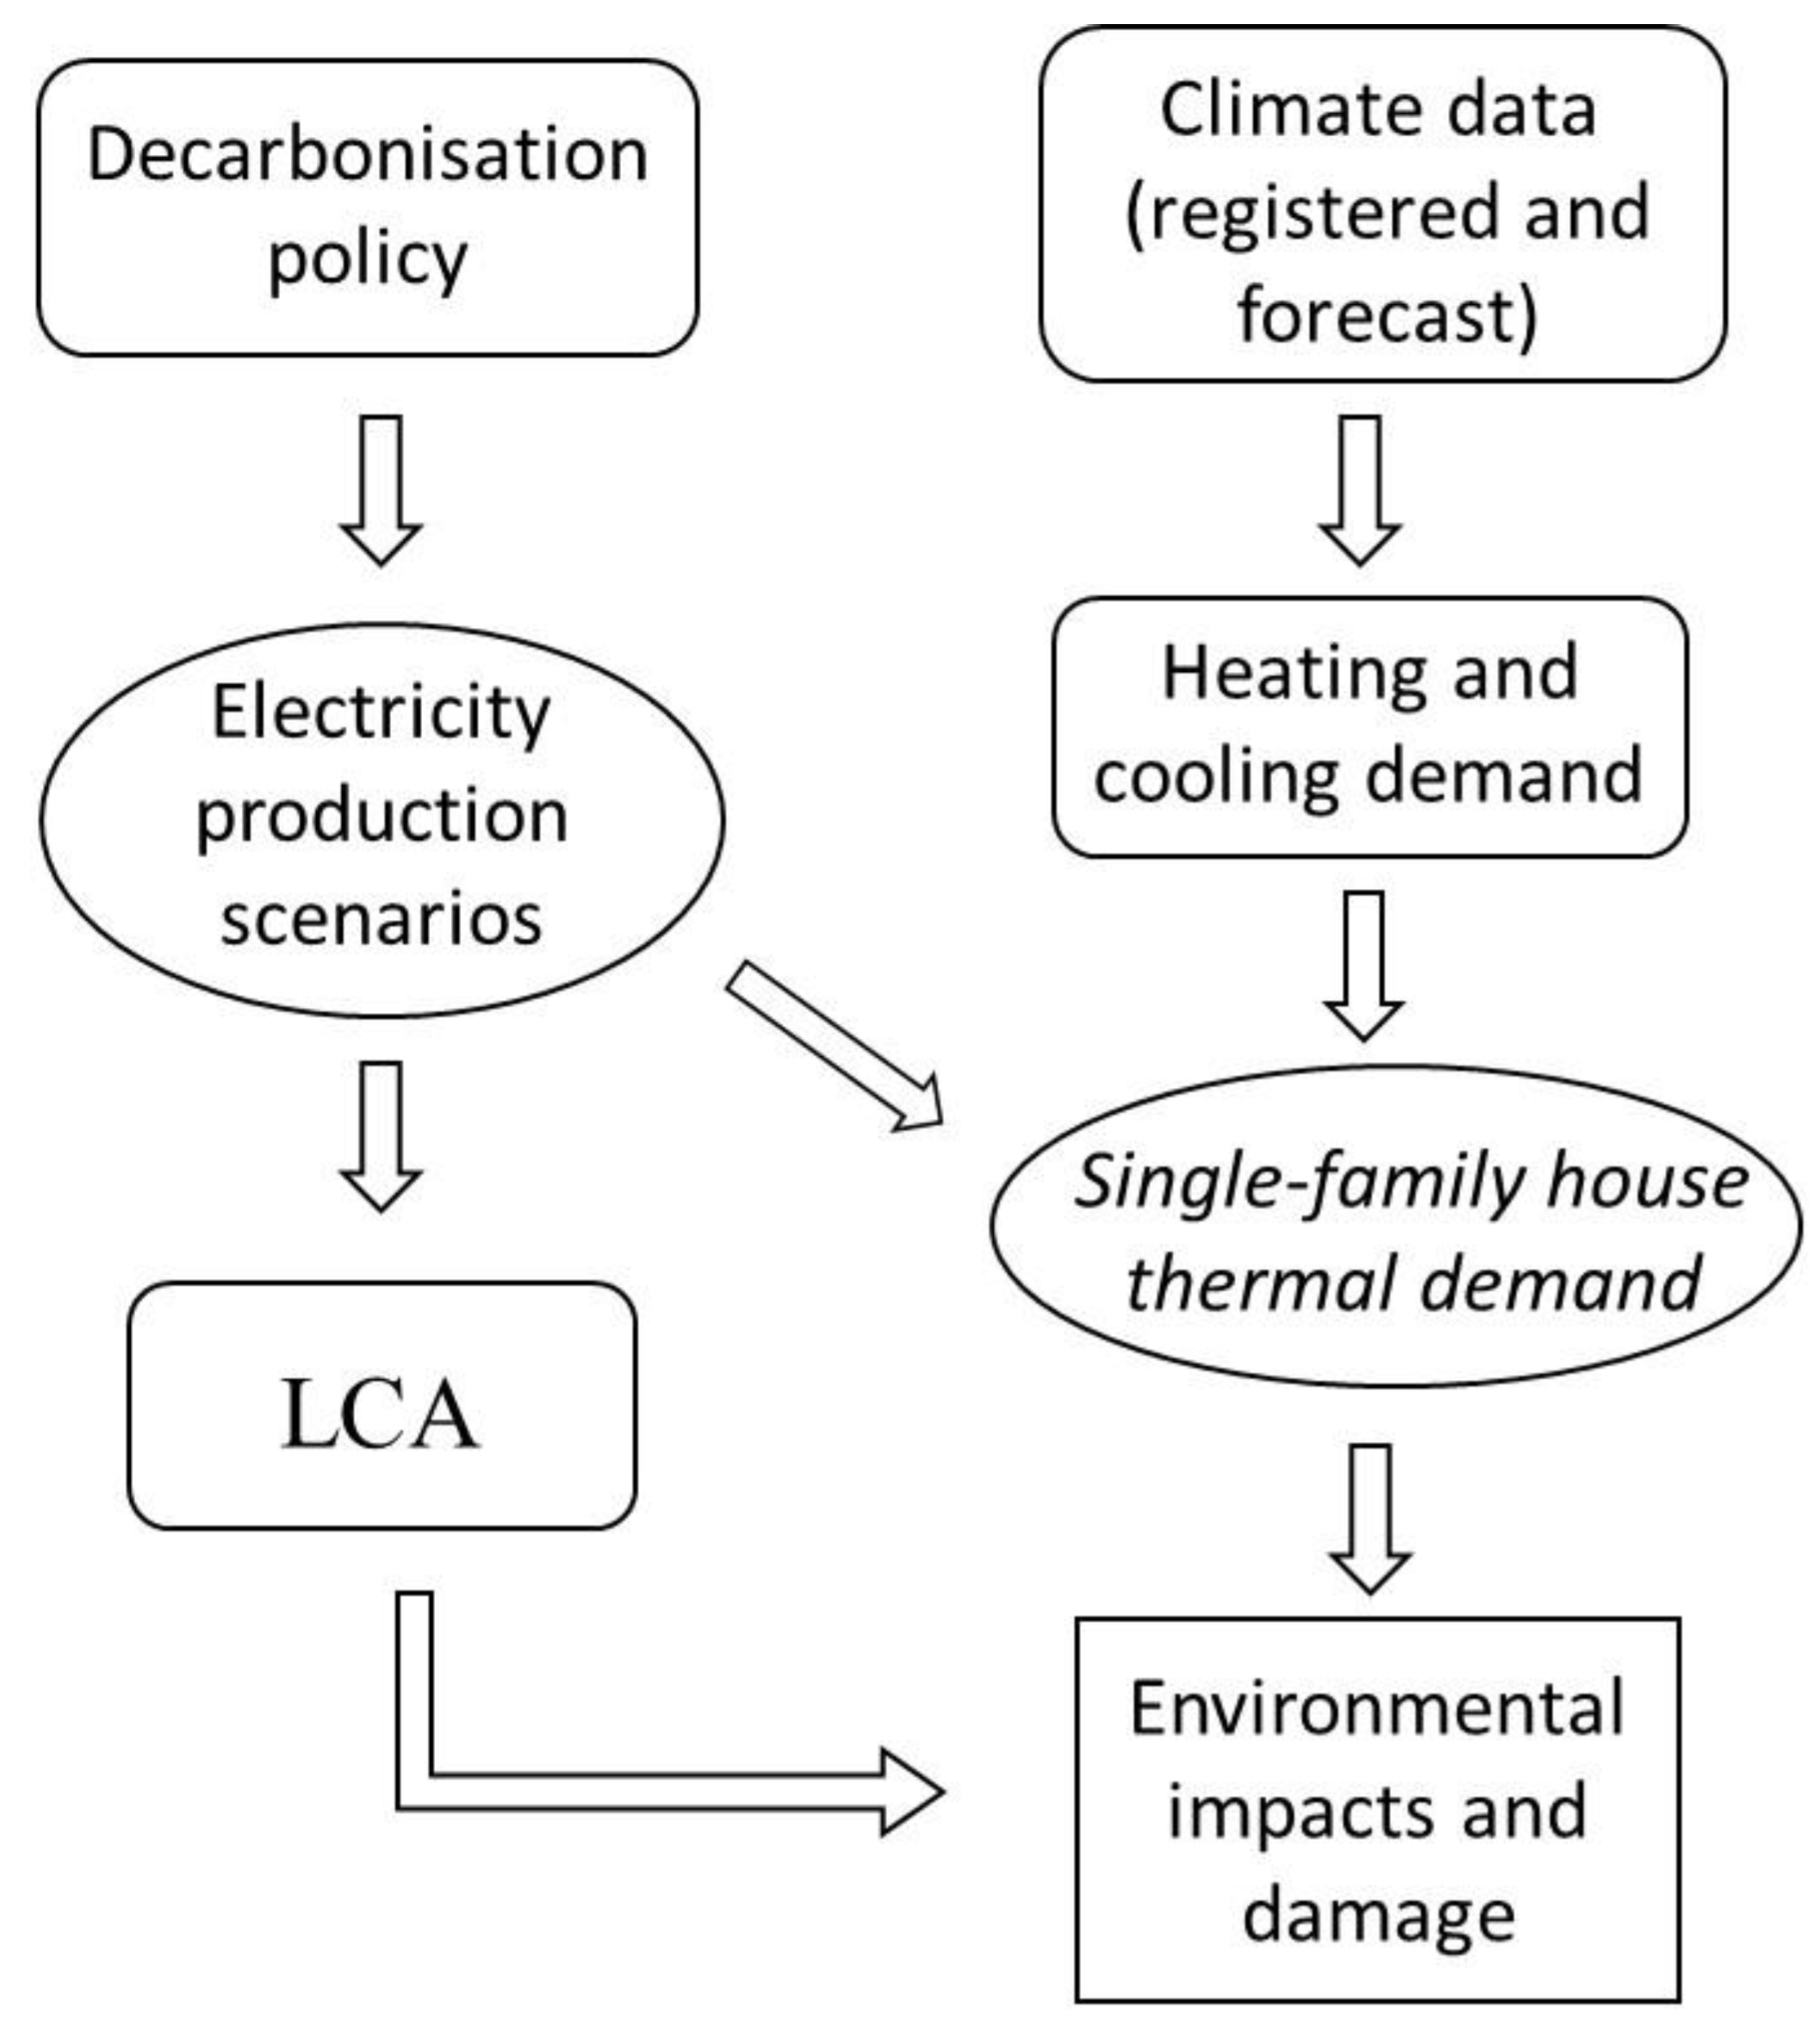
2. Materials and Methods

The impacts of current electricity production available for 2018 as well as those of future electricity production are studied. Two scenarios for electricity generation in Spain are proposed for the future (2020 and 2030) based on EU guidelines regarding decarbonisation policies. Eight different weather locations in Spain were selected, calculating the heating and cooling demands for the same building at the different locations. The weather data considered were obtained from Meteonorm database version 7 [43]. For 2010, these data are still in use in current demand calculation programmes, while for 2020 and 2030 the forecasted climate data were used. The climate data for the future were implemented in software tools officially approved by the Spanish authorities for calculating the thermal demand (heating and cooling) of the buildings for each location and year of calculation. Finally, the way in which the decarbonisation proposal concerning electricity generation will affect the impacts that occur in the building because of the thermal energy demand, which were calculated following the method implemented in SimaPro Impact 2002+ software (PRè Consultants, Amersfoort, The Netherlands) is studied. It was considered that the thermal demand will be supplied using electricity. A scheme with the sequence of the steps followed in this research is shown in Figure 1.

2.1. Proposal for Future Scenarios of Electricity Production

The evolution of the Spanish electrical energy mix proposed in the NIECP [8] reflects the government’s intentions to contribute to decarbonisation in terms of electricity production and the primary energy sources to be used. These data for the years 2020 and 2030 have been adapted to define the structure of the primary energy sources used in this study. The data for 2018 were obtained from those compiled by the Spanish grid operator (Red Eléctrica de España, REE) [44] and were adapted to have the same primary energy structure as that considered for the data for 2020 and 2030. The data in REE were also compared with those collected for the same year for Spain by the International Energy Agency [45] to ensure that the difference between sources is not significant. Using these data and the aforementioned NIECP, Table 1 shows the evolution of the energy generated.

2.2. Single-Family House

2.2.1. Building Geometry

At present, single-family housing is increasing significantly in Spain, representing around 35% of homes. However, it still does not reach the average value in the EU-28, where it represents around 59% of housing (35% detached and 24% semi-detached) [46]. Figure 2 shows the reference single-family house with the glazed openings facing South and North and the locations for the house made with lightweight concrete panels of expanded clay for the entire envelope and all the inner walls. The typology chosen for the reference building is a traditional one-storey house with three bedrooms that fulfils consumer demands, considering 1.3 children per couple [47]. The house is oriented North-South, the envelope has a high energy performance and the heating and cooling demands are very low. The one-storey house has a net floor area of 98 m2 and is planned to be inhabited by three occupants. The house consists of a living room/kitchen, two bathrooms, three bedrooms, a corridor and a facilities room (Figure 2a). The map of Spain in Figure 2b shows the climate zones according to their level of irradiation [20] and the locations of the eight Spanish cities representing the studied scenarios: Oviedo, Bilbao, Valladolid, Madrid, Zaragoza, Barcelona, Valencia and Seville. These locations are plotted on the irradiation map for Spain, obtained from the STBC, which classifies Spain in five zones according to their level of solar irradiation.

2.2.2. Materials and Properties

Table 2 shows the materials and thicknesses used for the exterior walls, floor and roof, as well as the thermal conductance values obtained. The characteristics of the envelope elements and the properties of the building materials are also detailed. The properties were taken from the Building Elements Catalogue recommended by the Spanish Technical Building Code (STBC) [20]. For the exterior walls, floor and roof, the thickness of the lightweight concrete is 140 mm; the partitions are made of the same concrete, but are 80 mm thick. The thickness of the Extruded Polystyrene (XPS) insulation is 140 mm in the walls and floor, and 200 mm in the roof. Argon-filled triple glazing is used, with a central-glass U-value (Ug) of 0.56 W/(m²·K) and a solar factor (g) of 0.51. The glazing frames are made of aluminium with thermal bridge breaking and a frame U-value (Uf) of 0.83 W/(m²·K), absorptivity = 0.4 and infiltration class = 4. The overall U-value of the opaque building elements is 0.164 W/(m²·K) and the average U-value of all windows is 0.80 W/(m²·K).

2.2.3. Operational Conditions

The building operational conditions are given in Table 3: profiles of occupancy, lighting and other equipment, set point of heating and cooling, as well as the ventilation flow rates defined in the STBC adding infiltrations.

2.3. Climate Data

The climate and altitude corresponding to the cities considered in this study are: Oviedo (Oceanic, 339 m); Bilbao (Oceanic, 39 m); Valladolid (Continental, 735 m); Madrid (Continental, 582 m); Zaragoza (Continental/Mediterranean, 258 m); Barcelona (Mediterranean, 6 m); Valencia (Mediterranean, 62 m); and Seville (Mediterranean/Subtropical, 31 m).
The climate datasets used in this study were obtained using the Meteonorm software, which allowed us to forecast the global weather climate. The software was applied under Intergovernmental Panel on Climate Change (IPCC) scenario B1, to obtain the data corresponding to 2010 and the predicted data for 2020 and 2030 for each of the eight locations. The radiation model was the one proposed by default [48]. All data were estimated on an hourly basis. The hourly data were exported to a spreadsheet and processed to obtain the average monthly data. This software package is also used extensively in the scientific literature, and in all the papers that use the standard Passive House [49].
To illustrate the climate diversity of Spain, Figure 3 shows average monthly values of dry temperature and global horizontal irradiation, obtained for 2020 at the locations studied.

2.4. Calculation of the Thermal Demand

The heating and cooling demand of houses at all the locations for the years under study was calculated using a software programme officially approved in Spain [50] that applies the STBC with a dynamic base time procedure described in ISO 52016-1:2017 [51]. The calculation performs a dynamic simulation on a time basis following an equivalent resistance-capacitance model. CYPETHERM HE PLUS software version 2019 [52], which uses the calculation engine from Energy Plus (through hourly-based weather data files, city-year.epw, obtained from Meteonorm) and allows the inputting of customised climatic datasets, was also used. Using this software, it was possible to implement data for 2010, 2020 and 2030 from the Meteonorm software.
The heating and cooling demands are considered as fully electric. However, if we consider the use of a heat pump (HP) and, assuming that the average efficiency in Spain for HP in winter is approximately 2.75 and in summer 2.25, this will lead to a reduction in electricity consumption of 56% in summer and 64% in winter.

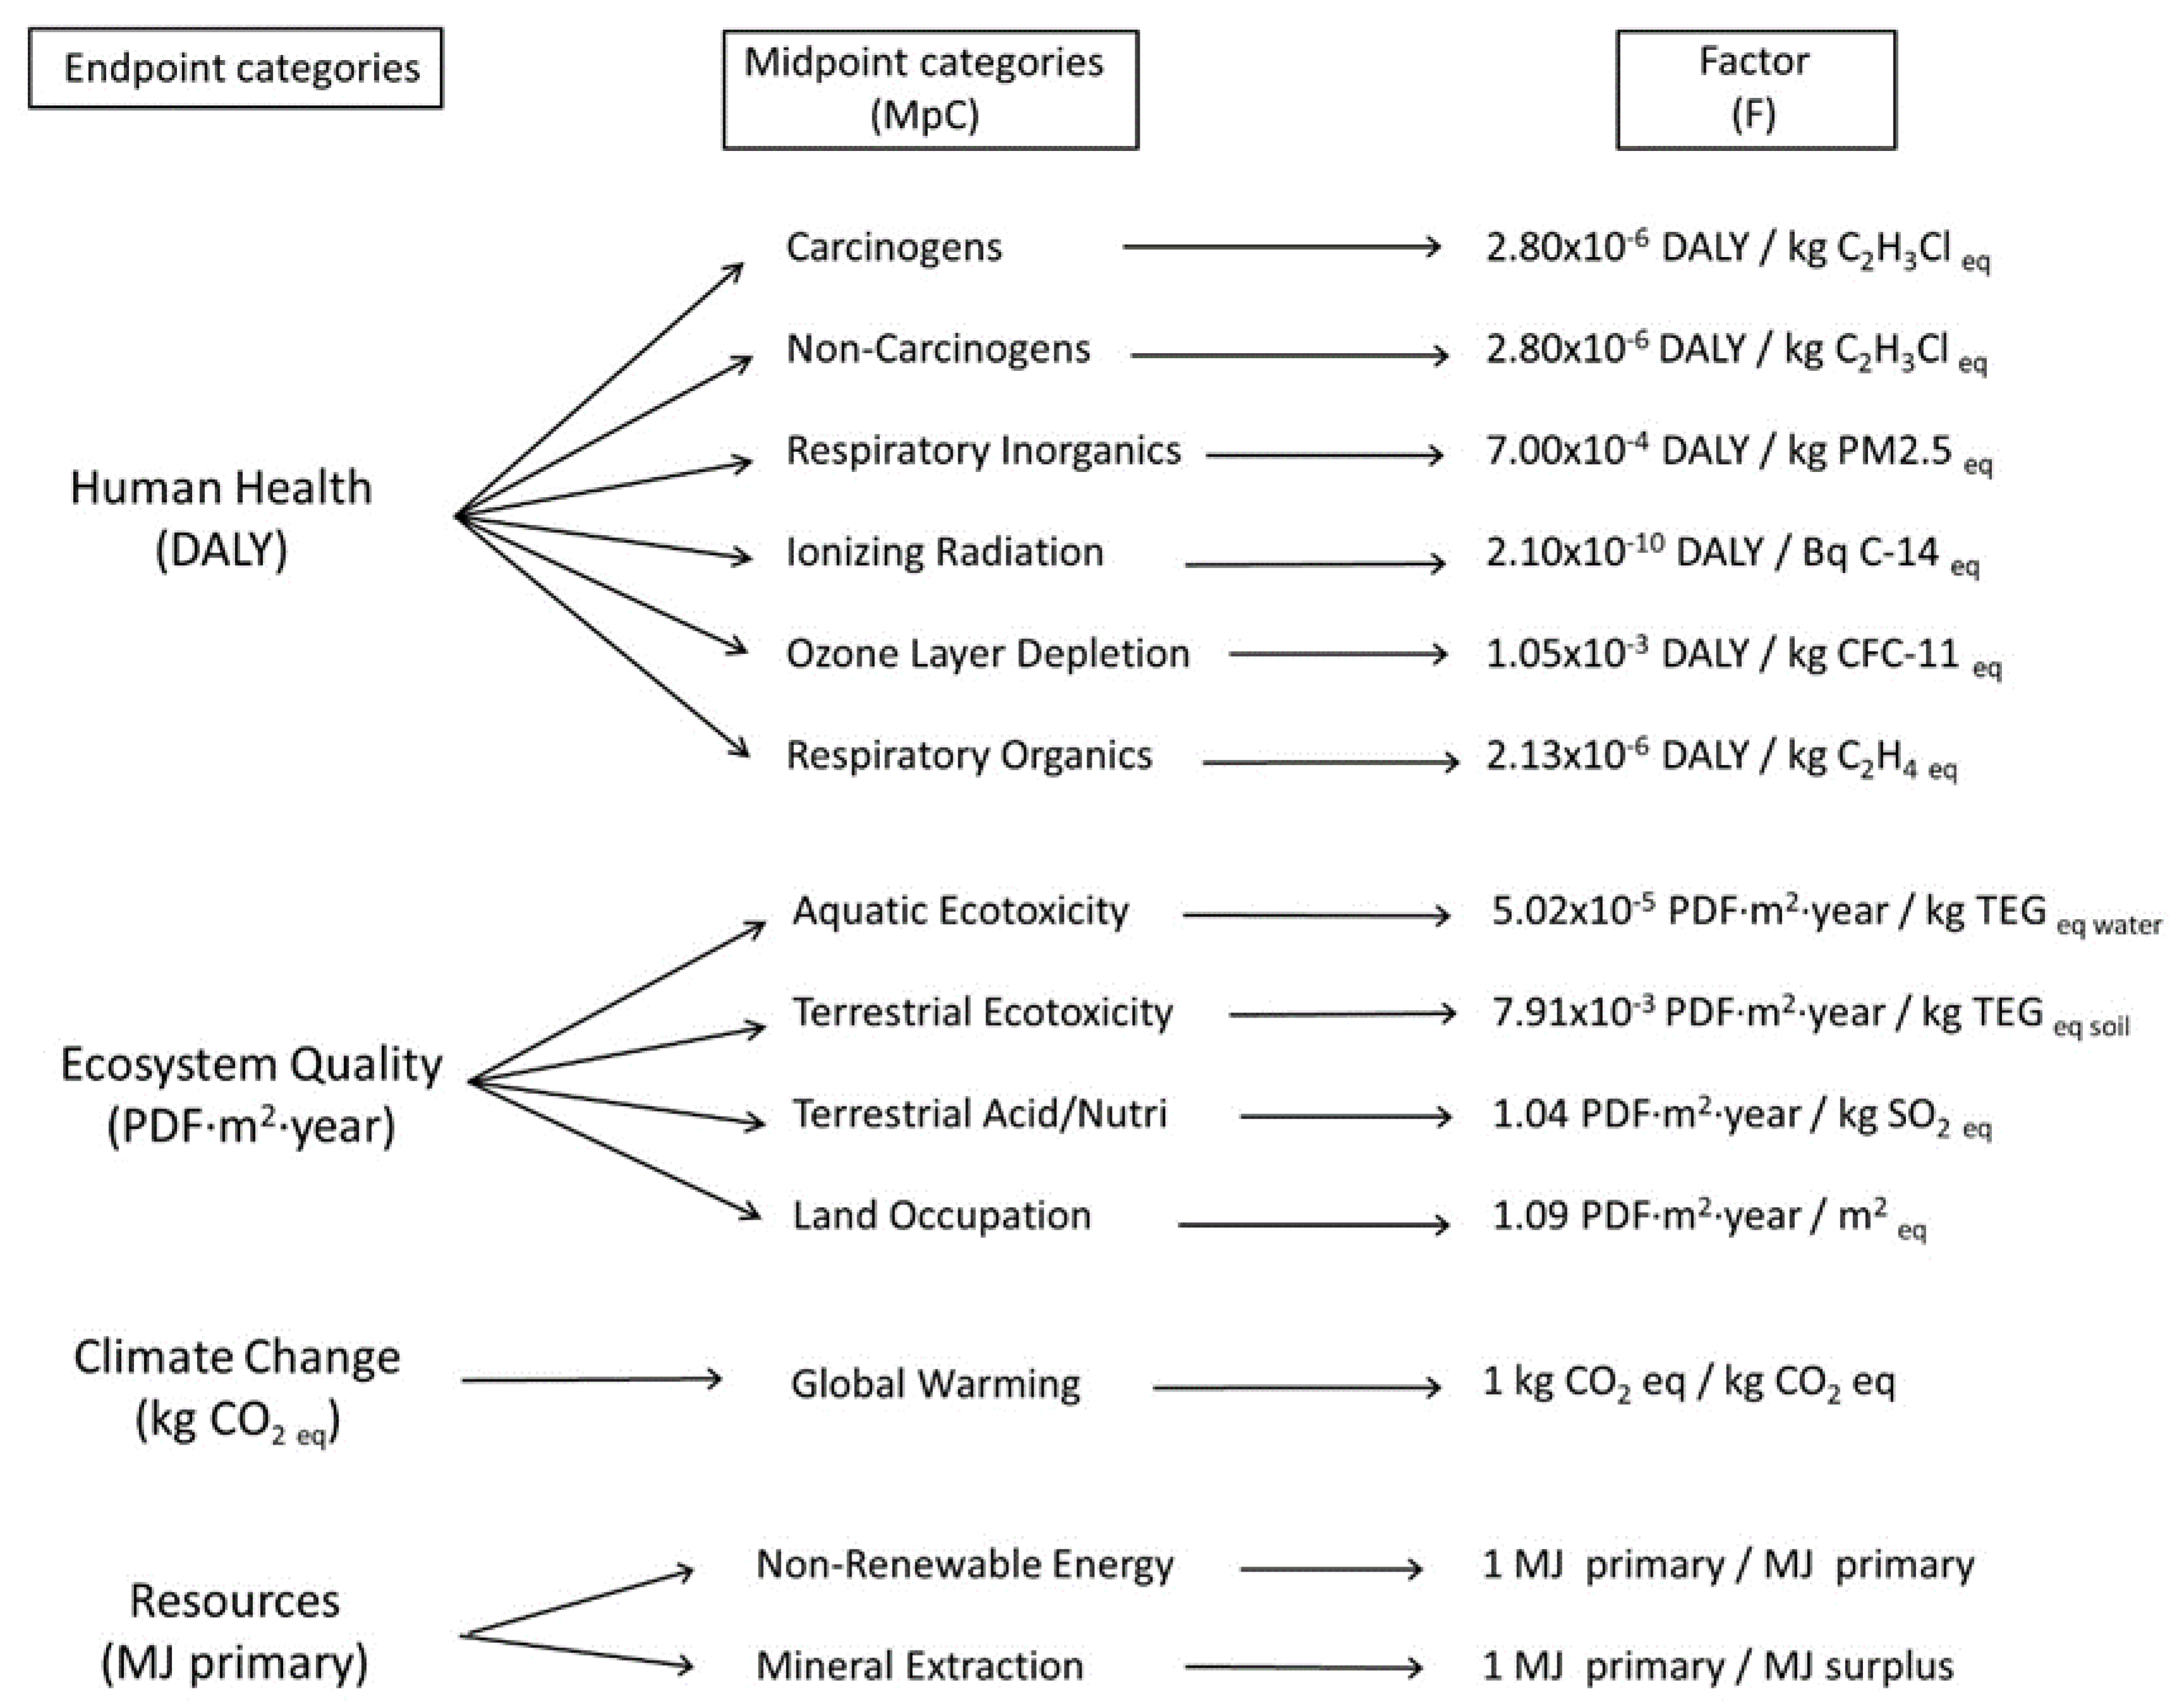
2.5. Life Cycle Analysis

The LCA methodology was based on the ISO 14040 standards [34,35]. The objective of the LCA was to analyse the environmental impacts of the electricity production scenarios proposed in the NIECP for the following time horizons: 2018, 2020 and 2030. The results of the study were used to calculate and compare the environmental impacts associated with the use of electrical energy for the thermal conditioning of the reference single-family house, based on its location in areas with different climates, for the same time horizons. The functional unit used was the total kWh of consumed electric energy in a year in Spain. For the software and data quality, SimaPro version 8.3.0 was used to carry out the LCA, along with its associated database (Professional). Regarding the inventory analysis, the Ecoinvent v3.3 (2016) database was used to obtain the environmental loads associated with energy production and with high, medium and low voltage energy consumption in Spain. All stages, from raw material extraction until dismantling, have been considered.
The energy mix was updated with the contribution of each of the types of energy production, according to the scenarios proposed in the NIECP for the 2018, 2020 and 2030 time horizons (Table 1). The distances over which the electricity was distributed were also updated, taking into account the subsequent losses in the network.
For the LCA, impact categories were selected in order to evaluate the environmental impacts (midpoint categories), as well as the damage caused (endpoint categories). The chosen assessment method was IMPACT 2002+, version 2.14 [53], which is a combination of four methods: IMPACT 2002 [54], Ecoindicator 99, CML [30] and IPCC. The approach defines midpoint impact categories that can be combined into four endpoint damage categories: Human Health, Ecosystem Quality, Resources and Climate Change. The Human Health damage category includes impact categories that contribute to human health damages: Carcinogenic and Non-Carcinogenic effects, Respiratory effects (Inorganics and Organics), Ionising Radiation and Ozone Layer Depletion. It is expressed in DALYs (Disability-Adjusted Life Years). The Ecosystem Quality damage category takes into account the Aquatic Ecotoxicity, Terrestrial Ecotoxicity, Terrestrial Acidification/Nutrification and Land Occupation. It is expressed as PDF⋅m2⋅year (Potentially Disappeared Fraction over a certain area and during a certain time). The Climate Change damage category only includes the mid-point scores for Global Warming and is expressed as kg CO2 equivalent. The Resource Depletion category includes the midpoint impact categories for Non-Renewable Energy and Mineral Extraction and measures the amount of energy extracted or needed to extract the resources. It is expressed as MJ.
Figure 4 lists the categories included in the IMPACT 2002+ method, as well as the factors used to transform the midpoint impact categories into the endpoint damage categories and units.
To analyse the respective contribution of each damage or impact to the overall considered category, a normalisation of the obtained data was performed by dividing the corresponding values by their respective normalisation factor. The IMPACT 2002+ assessment method uses the total impact of all the substances in each specific category per person per year for Western Europe as the normalisation factor.

3. Results and Discussion

3.1. Effect of Decarbonisation Policies on the Impacts Associated with Electricity Production

In 2018, according to the data of the International Energy Agency (IEA) [45], non-renewable energy in the Organisation for Economic Co-operation and Development (OECD) for the European Union electricity production represents 63%, while renewable energy represents 37%. In Spain, these figures have a similar percentage—60% and 40%, respectively. In general, the most important renewable sources are wind and hydroelectric power. Currently, the contribution of solar energy is not very high, but it is expected to increase substantially in the near future [55]. For the present study, electricity generation figures were obtained using 2018 data from REE and the future values proposed by the Spanish government (NIECP), previously shown in Table 1. The values are: 260,974 GWh (2018), 277,763 GWh (2020) and 349,316 GWh (2030). The figure for this last year represents an increase of 34% with respect to the 2018 data. The final electricity demand values, considering transmission losses and the electricity grid in Spain, are: 243,577 GWh (2018), 259,701 GWh (2020) and 331,338 GWh (2030). As for the evolution of the different types of non-renewable energies, an appreciable decrease is expected in nuclear power and a moderate decrease in energy from mineral oils. Furthermore, a substantial decrease in energy from coal is proposed, reaching zero in 2030, while, in parallel, a very significant increase in wind and solar energy is proposed. The percentage of generation using non-renewable sources decreases from 60.8% in 2018 to 22.5% in 2030, whereas the contribution of renewable energies increases from 39.2% in 2018 to 77.5% in 2030.
With regard to the distribution of renewable primary energy, likewise comparing 2018 and 2030, it is observed that: (i) the percentage of wind energy decreases slightly (from 48% to 44%), although the amount of energy produced increases until reaching a figure more than double that of 2018; (ii) hydroelectricity hardly varies in amount, although its percentage decreases from 35% to 14%; and (iii) the amount of solar energy increases more than sevenfold, and the percentage increases from 12% to 35%. As to non-renewable sources: (i) the percentage of nuclear power generation decreases moderately (from 34% to 32%), although the amount of this type of energy decreases more than a half compared to 2018; (ii) the contribution of natural gas increases significantly (from 37% to 61%), although the amount of this type of energy is expected to decrease in 2030; (iii) the contribution of mineral oils in electricity generation is expected to increase slightly (from 4% to 7%), although the amount of this type of energy will decrease in 2030.
Possible scenarios taking into account the European Commission Directives on emissions of atmospheric pollutants were proposed and studied in García-Gusano [10] and in Lechón [56], using the TIMES-Spain power model. TIMES-Spain is a technoeconomic energy optimisation software that implements the TIMES family of models developed by the International Energy Agency (IEA, Paris, France) in the Energy Technology Systems Analysis Programme (ETSAP) (http./iea-etsap.org/). Although both studies report similar trends, they show some differences with respect to the NIECP plan presented by Spain. There is a growth in the gross electricity generation, which is justified in Lechón [56] by considering the trends towards an increase in population and the gross domestic product of Spain. The reference scenario discussed is known as Business as Usual (BaU). Among others, the BaU scenario includes subsidies for investments in renewable technologies and commitments in force related to Directive 28/2009/EC [57] on the promotion of the use of energy from renewable sources, Directive 2009/29/EC [58] to improve and extend the greenhouse gas emissions allowance trading scheme of the Community and Directive 2001/81/EC [59] on national emission ceilings for certain atmospheric pollutants. Table 4 shows the estimations for the mix of gross electricity generation for the NIECP scenario, used in this study, and for the BaU scenario.
The contribution of renewable energies is higher in the NIECP scenario (44% and 77.5% by 2020 and 2030, respectively) than in the BaU scenario (35.6% and 58.7% by 2020 and 2030, respectively). Natural gas will have a smaller contribution to the mix in the NIECP scenario, even if decreasing from 2020 to 2030, as opposed to the BaU scenario, which presents an increase in this period of time. Coal will still be used in 2020 in the NIECP scenario, but there will be no contribution of coal by 2030. The contribution of nuclear power will decrease by 2020, but it will still be used in 2030 according to the NIECP scenario, whereas there will be no contribution according to the BaU scenario. As for the behaviour of renewable energies, the use of solar powers will rise significantly by 2030, the figures being much higher in the NIECP scenario.
In the present study, the NIECP scenarios were implemented in SimaPro to calculate the impact and damage associated with the different time horizons. The results of the life cycle impact assessment for the three studied horizons are shown in Table 5 and Figure 5. Table 5 summarises the values of the selected damage and impact categories, and Figure 5 shows the normalised values of those categories. The normalisation is carried out with respect to the total impact of all the substances in each specific category per person per year for Western Europe.
In view of the results (Figure 5a), it may be concluded that the categories most affected by the electricity production scenarios are Human Health, Resource Consumption and Climate Change. The damage categories in 2020 undergo only a slight variation with respect to 2018. The Human Health and Climate Change damage categories decrease around 4%, and Resources Consumption decreases 1.6%, whereas the damage to Ecosystem Quality experiences an increase of 14.7%. The increase in this damage category is much higher in 2030 (70%), but the damage to the other three categories decreases significantly compared to the 2018 values. The effects observed on each of these damage categories are discussed below, through an individual analysis of the impact categories that contribute to each of the damage categories.
In the following discussion, the substances and processes that contribute to the different impact and damage categories can be seen in the Supplementary Materials.

3.1.1. Human Health

It can be seen (Figure 5b) that the effect on Human Health is mainly due to the effect of the Respiratory Inorganics impact category and, to a lesser extent, to the Carcinogenic and Non-Carcinogenic impacts. As regards the impact of Respiratory Inorganics, and taking the energy production scenario of 2018 as reference, a decrease of 4% was observed in this impact category in 2020 and of up to 45% in the 2030 scenario. According to the employed methodology, the emission to the air of fine particulate matter (particle diameter < 2.5 microns), sulphur dioxide and nitrogen oxides is mainly responsible for the effect on this impact category. These substances are associated with the use of coal as an energy source in the generation of electricity; hence, the elimination of coal in the 2030 scenario could explain the observed decrease in this category.
In the case of Non-Carcinogens, there is a significant increase (68%) in the contribution of the proposed scenario for 2030 with respect to the 2018 scenario, whereas the increase for 2020 is much lower (9.5%). The substances that have the greatest effect on this category are the arsenic emitted to the air, water and soil, dioxins emitted to the air and zinc emitted to the soil. These substances are associated with biomass combustion processes (including waste combustion). As can be seen in Table 1, the generation of electricity from waste is foreseen to increase considerably in 2030, from 4431 GWh in 2018 to 17,596 GWh. This increase may justify the behaviour observed in this impact category.
As regards the effect on the Carcinogens impact category, this is not very significant, with slight decreases in the contribution of the proposed scenarios for 2020 (9%) and 2030 (1.7%) compared to that of 2018. The substances with the greatest contribution to this impact category are aromatic hydrocarbons emitted into the air, which are associated with various processes, such as the production of natural gas at high pressure or the use of biomass and waste for electricity production, amongst others. Therefore, it is difficult to associate the expected decreases with the variation in the processes for the proposed scenarios.
The effect of the electricity generation scenario on this damage category was studied by García-Gusano [10]. Values of 3.11 × 10⁻⁷ DALY/kWh and 3.07 × 10⁻⁷ DALY/kWh were obtained for the BaU scenario proposed in 2020 and 2030, respectively. In our study, the value obtained in 2020 is similar (2.98 × 10⁻⁷ DALY/kWh), but the value for 2030 (1.35 × 10⁻⁷ DALY/kWh) is much lower. The difference could be attributed to the different contribution of coal and natural gas in both the BaU and NIECP electricity generation scenarios (Table 4). Even though coal is not present in the BaU scenario in 2020, the high value obtained in the Human Health damage category may be explained by the greater contribution of natural gas in this scenario compared to the NIECP scenario used in our study. Concerning 2030, even though coal is not present in either scenario, the contribution of natural gas is higher in the BaU scenario. This fact could explain the higher value of the Human Health damage category obtained by García-Gusano [10].

3.1.2. Ecosystem Quality

It can be seen in Figure 5a that there is a significant increase (70%) in damage to Ecosystems Quality in 2030. The Terrestrial Ecotoxicity impact category presents the greatest contribution to this damage category, followed by Land Occupation and Terrestrial Acidification/Nutrification (Figure 5b).
As regards Terrestrial Ecotoxicity, an increase of 61% is observed in 2030 (Table 5). Copper, aluminium, chromium and zinc emitted to the soil are the substances with the greatest influence on this impact category. On the other hand, the process with the greatest contribution to this impact category in 2030 appears to be the treatment by landfarming of wood and ash mixtures, which could be associated with the use of biomass and waste in electricity production. Energy sources of this type are foreseen to increase up to 17,596 GWh in 2030 (Table 1).
The production of photovoltaic panels is the process with the greatest contribution to the Land Occupation impact category. An increase of 232% in 2030 with respect to 2018 can be observed in this impact category (Table 5). This fact is in keeping with the variation in solar photovoltaic energy, which is foreseen to increase from 7759 GWh in 2018 to 70,491 GWh in 2030.
The Terrestrial Acidification/Nutrification impact category does not change in 2020 but a decrease of 44% can be observed for 2030 (Table 5). Nitrogen oxides, sulphur dioxide and ammonia emitted to the air are the substances with the greatest contribution to this impact category. These substances are mainly associated with the use of solid fossil fuels in energy production. The use of coal as an energy source decreases in 2020 with respect to 2018, and no coal will be used in 2030 for electricity production, in line with the observed trend in the Terrestrial Acidification/Nutrification impact category.

3.1.3. Climate Change

Carbon dioxide is the substance with the greatest contribution to the Climate Change damage category, followed by methane and, to a lesser extent, dinitrogen monoxide. Carbon dioxide and methane are mainly associated with the use of coal and natural gas (both in combined cycle and conventional power plants) in electricity production. The Climate Change category decreases 4% in 2020 and 43% in 2030 with respect to 2018 due to the elimination of coal and the reduction in oil and gas as energy sources.
Comparing the values of our research for this damage category with those obtained using the BaU scenario [10], significant variations are observed, mainly in 2020. An impact of around 0.19 kg CO2/kWh was obtained for the aforementioned scenario, which is lower than the value obtained in our study (0.29 kg CO2/kWh). This could be attributed to the fact that, in the electricity generation scenario proposed in our study, coal will still be used in 2020, while it will not in the BaU scenario. For the year 2030, the differences are smaller (0.18 kg CO2/kWh in the BaU scenario compared to 0.14 kg CO2/kWh in our study). This difference could be attributed to the greater contribution of oil, gas and natural gas in the BaU scenario.

3.1.4. Resources Consumption

Resources Consumption increases slightly (1.6%) in 2020 with respect to 2018, but is seen to decrease 39% in 2030 (Table 5). This reduction is mainly due to the decrease in Non-Renewable Energy, as this impact category is the one presenting the greatest contribution to the damage in Resources Consumption. Uranium, natural gas, coal and oil are the resources that mainly affect this impact category, and the use of these types of energy sources is seen to decrease very significantly in 2030.

3.2. Heating and Cooling Demands

The data for the eight selected locations represent a wide spectrum of climatic conditions. As can be seen in Figure 3, the lowest value for the average monthly temperature in the winter period (from October to May) was found for Valladolid (2.34 °C in December) and the highest value for Seville (20.75 °C in May). In the summer period (from June to September), the lowest value was found for Oviedo (15.35 °C in June) and the highest value for Seville (28.38 °C in September). Concerning the levels of the monthly global solar irradiation on a horizontal plane, a wide spectrum of values can also be observed. In winter, the lower values correspond to Bilbao (3.77 MJ/m2 in December) and Oviedo (4.34 MJ/m2 in December), while the highest value corresponds to Seville (24.99 MJ/m2 in May). As regards summer, the lowest monthly global horizontal irradiation value corresponds to Oviedo (13.16 MJ/m2 in September), which is followed by Bilbao (13.20 MJ/m2 in September); while the highest value is found for Seville (26.92 MJ/m2 in June).
Figure 6 shows a comparison of the heating demands (from October to May), and Figure 7 shows a comparison of the cooling demands (from June to September) corresponding to the years 2018, 2020 and 2030 for all the locations under study. The heating demand in all places was less than 22 kWh/m2 per year, and this value was obtained for Valladolid in 2018. However, some of the buildings at the locations under study have low demand, such as Barcelona, in all three years under analysis. With respect to cooling demand, this remains below 18 kWh/m2 per year, the value obtained for Barcelona in 2030, while some of the buildings have zero cooling demand, such as Oviedo, in the three years analysed.
With regards to heating demand, in 2020, compared to 2018, there is generally a reduction. The largest decrease is 48%, which occurs in Valencia, which has a Mediterranean climate, although this location has low heating demand values. The average decrease in cities with an oceanic/continental climate (Oviedo, Bilbao, Valladolid, Madrid and Zaragoza), which have a higher heating demand, ranging from 4% to 21%. The exception to the decreases is observed in Seville, which has a Mediterranean/subtropical climate, where the demand for heating increases 132%. However, as heating demand values are very low, the increase is not significant from the point of view of energy consumption. The trend is similar in 2030, although the values vary. In Valencia, the decrease is 57%; in the cities with an oceanic/continental climate, the decrease ranges from 10% to 24%, while in Seville demand increases 73%. In values, the most affected demand is that of Valladolid, where, in addition to presenting the highest demand, the percentage decrease is the second highest (22%).
Regarding the demand for cooling, this increases at all locations, except for Bilbao, which has very low demands, and Seville, which presents relatively high demand values, although in this latter case the variation is small. This trend is consistent with the general increase in temperature caused by climate change. Of the locations studied, the greatest change occurs in Valladolid, where the demand for cooling increases almost 197% in 2020 and more than 310% in 2030, and the demands are also substantial. In other places, increases in 2030 are observed in Madrid, 22%; Zaragoza, 47%; and Valencia, 27%.
The total demand (heating and cooling) generally decreases in 2030 with respect to 2018, with the percentage decreases depending on the location. The most significant variations occur in Oviedo, Bilbao and Valladolid, with 21%, 16% and 15%, respectively, while at the remaining locations the percentage decrease is less than 7%. However, there is a slight increase of 3% in the total demand for Barcelona, due to the increase in cooling demand.
It can be seen that the values of thermal demand are largely dependent on the climate of the cities under study and, in this respect, Spain has a significant climatic variation. These results are consistent with those reported by Karimpour [60] for single-family homes in different geographical locations with a high level of insulation and similar net floor areas to those in this study, such as Auckland (New Zealand), which presents values of 19 and 32 kWh/m2 per year, and Hamar (Norway), with values of 63 kWh/m2.
As for the behaviour of the thermal demand in buildings, taking climate change in future horizons into consideration, the results are consistent with the findings of other authors. The variation in thermal demand in future horizons and under a Mediterranean climate was studied by Gercek [39] in a residential block of buildings in Izmir (Turkey). Although the type of construction is different to that considered in this study, the trends are in agreement: the demand for heating is predicted to decrease in 2020 (13.6%) and 2050 (26.7%) with respect to the current data; however, the demand for cooling will increase by 2020 (23.2%) and 2050 (49.5%). Andric [40] studied the evolution of demand according to different time horizons at the district level in Lisbon (Portugal), also under a Mediterranean climate. Different renovation scenarios were proposed for buildings, in high-rise flats and single-family one-storey houses, also considering different shading levels. In agreement with the present paper, the thermal heating demand is foreseen to decrease within the range of 22.3–52.4% in 2050 compared to 2010, depending on the building and renovation scenario studied.
The variations in heating and cooling demands were analysed in southern Spain for a theoretical reference single-family house in Suárez [61], built in 2006 in accordance with Spanish regulations. Calculations were performed for the current scenario (climate data in software tools valid for 2018) and for the predicted scenario in 2050. Different passive conditioning strategies (envelope modification, solar gain protection and night-time natural ventilation) and two building orientations were studied. The results showed that demand values depend very much on the strategy employed, with a moderate decrease in heating demand and a potential twofold increase in cooling demand when comparing the current scenario and that of 2050. Therefore, these findings are also in agreement with those of this study.

3.3. Impacts Associated with the Operational Energy for Heating and Cooling

The estimated values for the damage categories (in terms of m2 of housing and year at different locations in Spain) are shown in Figure 8, Figure 9, Figure 10 and Figure 11. Both the decarbonisation process proposed for Spain and the climate change that will occur at the different locations have been taken into account. Figure 8 presents the damage to Human Health, with calculated values and percentage of variation. It can be seen that the damage decreases in 2020 compared to 2018 at all locations. The changes in 2030 are very significant, the decrease in this damage category ranging between 59% and 68%.
Regarding the damage to Ecosystem Quality (Figure 9), this category decreases in some locations but increases in others in 2020, the reductions being mainly at the locations in northern Spain: Oviedo, Bilbao and Valladolid. In 2030, this damage increases in all cases except for Oviedo, where it decreases slightly (1%), a finding that may be associated to a relatively higher decrease in total thermal demand than at other locations. It can also be seen that the increase in this damage category is substantial for the locations in the centre of Spain: Madrid, 23%; and Zaragoza, 18%; in the Mediterranean area: Barcelona, 28%; and Valencia, 25%; and in southern Spain: Seville, 16%. The increases in damage are lower than those obtained by applying the proposed energy policy, as the thermal demand for buildings generally decreases.
The impact on Climate Change (Figure 10) is seen to decrease at all locations and in both time scenarios (2020 and 2030). In 2020, the reduction ranges from 12% to 28% and in 2030 from 57% to 67% due to the effects of decarbonisation in Spain (coal will no longer be consumed and the use of renewable energies will have increased considerably).
Finally, regarding the impact on Resources (Figure 11), the trend is similar to that of Climate Change, in the sense that the impact decreases at all locations in 2020 and 2030. In 2020, the largest reduction occurs in Oviedo (24%). This city also presented the largest reduction in the other damage categories. In 2030, the reductions range between 54% and 65%, with the maximum reductions also occurring in Oviedo.
The impact of buildings in future horizons is greatly dependent on electricity generation policies and the use of renewable energy at a district level or in each building, as well as on the specific climate and other factors. The great majority of studies on operational energy deal with future global warming impact (CO2 emissions), though few address primary energy consumption, Karimpour [60] being an example. However, the aforementioned study does not include future horizon calculations.
Concerning CO2 emissions in future horizons under the change of weather variables, Andric [40] reports that the annual CO2 emissions from heating could decrease from 8% to 34% in 2050 (compared to 2010, depending on the weather scenario and heating system considered), the tendency being in line with the results of the present paper. In contrast, the results obtained by Gercek [39] indicated a 37% rise in total annual CO2 emissions when comparing recent values with those expected for 2050. In their study, the authors admit to a certain degree of uncertainty due to a lack of factors for Turkey, which convert the energy consumption to CO2 emissions. In the present study, for Spain, the effect of changing the electricity generation mix in the future was obtained by using the National Integrated Energy and Climate Plan and performing an LCA calculation in SimaPro to assess the impacts.

4. Conclusions

The present study addresses the environmental impacts, using the LCA methodology, of the electricity consumption to supply the heating and cooling demands of a reference single-family house. Eight different locations for the house were studied to consider the climatic differences and future climate change. Electricity consumption from the national mix planned for the years 2020 and 2030 by Spain in its NIECP was used to meet heating and cooling demands.
Regarding the evolution of the environmental impact and damage due to electricity generation, it is observed that the damages on Human Health, Climate Change and Resources Consumption decrease in 2030 by 45%, 43% and 39%, respectively. This is mainly due to the elimination of coal as an energy source and the decrease in the use of nuclear power. However, there will foreseeably be a 70% increase in the damage to Ecosystem Quality, although this damage category will be less affected than the others. This variation can be attributed to the increase in the use of biomass and waste in electricity generation and, to a lesser extent, to an increased use of solar photovoltaic energy.
As for the evolution of the heating and cooling demands of the reference house, heating demand will foreseeably decrease by an average of 18% in 2030 in the cities with the highest demand, namely those with an oceanic and continental climate (Oviedo, Bilbao, Valladolid and Madrid). The demand for cooling is expected to increase in general, being greater at locations with a continental climate (Valladolid, Madrid and Zaragoza), with increases ranging between 22% and 45%. The total demand for heating and cooling in 2030 will generally decrease and will be higher at those locations with an oceanic and continental climate (21% to 15%).
The evolution of the damage categories due to heating and cooling when applying the Energy and Climate Plan and the variation in energy demand due to climate change are forecasted as follows: the damage to Human Health will decrease at all locations (from 59% to 68%), as will the damage to Climate Change (from 57% to 67%) and to Resources (from 54% to 65%), as the total demands for heating and cooling will decrease. Nevertheless, the damage to Ecosystem Quality will increase, because although energy requirements will decrease, the energy production scenario for 2030 will have a greater impact on this damage category. The expected increases will be between 5% and 28%, being higher in Spain’s central, Mediterranean and southern areas.
A foreseeable future line of study would include a more in-depth calculation of the impacts for buildings under future climate and energy source scenarios, covering the stages of manufacturing, replacement, use, disposal and recycling from cradle to grave.

Supplementary Materials

The following are available online at https://www.mdpi.com/2071-1050/12/9/3529/s1, Table S1: Processes contribution to Respiratory Inorganics (kg PM2.5 eq) impact category of 2018, 2020 and 2030 electricity generation scenario (Method IMPACT 2002+ V2.14; Cut-off: 1%), Table S2: Processes contribution to Non-Carcinogens (kg C2H3Cl eq) impact category of 2018, 2020 and 2030 electricity generation scenario (Method IMPACT 2002+ V2.14; Cut-off: 1%), Table S3: Processes contribution to Carcinogens (kg C2H3Cl eq) impact category of 2018, 2020 and 2030 electricity generation scenario (Method IMPACT 2002+ V2.14; Cut-off: 0.5%), Table S4: Processes contribution to Terrestrial Ecotoxicity (kg TEG soil) impact category of 2018, 2020 and 2030 electricity generation scenario (Method IMPACT 2002+ V2.14; Cut-off: 0.5%), Table S5: Processes contribution to Land occupation (m2org.arable) impact category of 2018, 2020 and 2030 electricity generation scenario (Method IMPACT 2002+ V2.14; Cut-off: 0.25%), Table S6: Processes contribution to Terrestrial Acidification/Nutrification (kg SO2 eq) impact category of 2018, 2020 and 2030 electricity generation scenario (Method IMPACT 2002+ V2.14; Cut-off: 0.85%), Table S7: Processes contribution to Global Warming (kg CO2 eq) impact category of 2018, 2020 and 2030 electricity generation scenario (Method IMPACT 2002+ V2.14; Cut-off: 0.8%), Table S8: Processes contribution to Non-renewable energy (MJ primary) impact category of 2018, 2020 and 2030 electricity generation scenario (Method IMPACT 2002+ V2.14; Cut-off: 1%), Figure S1: Substances contribution to Respiratory Inorganics impact category of 2018, 2020 and 2030 electricity generation scenario (Method IMPACT 2002+ V2.14), Figure S2: Substances contribution to Non-Carcinogens impact category of 2018, 2020 and 2030 electricity generation scenario (Method IMPACT 2002+ V2.14), Figure S3: Substances contribution to Carcinogens impact category of 2018, 2020 and 2030 electricity generation scenario (Method IMPACT 2002+ V2.14), Figure S4: Substances contribution to Terrestrial Ecotoxicity impact category of 2018, 2020 and 2030 electricity generation scenario (Method IMPACT 2002+ V2.14), Figure S5: Substances contribution to Acidification/Nutrification impact category of 2018, 2020 and 2030 electricity generation scenario (Method IMPACT 2002+ V2.14); Figure S6: Substances contribution to Global warming impact category of 2018, 2020 and 2030 electricity generation scenario (Method IMPACT 2002+ V2.14); Figure S7: Substances contribution to Non-renewable energy impact category of 2018, 2020 and 2030 electricity generation scenario (Method IMPACT 2002+ V2.14).

Author Contributions

Conceptualization, D.G.-P., Y.F.-N. and M.M.P.; methodology, D.G.-P., Y.F.-N., E.M. and M.M.P.; software, D.G.-P., Y.F.-N. and M.M.P.; validation, D.G.-P., Y.F.-N., E.M. and M.M.P.; formal analysis: M.M.P. and E.M.; investigation: D.G.-P.; M.M.P., Y.F.-N. and E.M.; resources: D.G.-P., Y.F.-N., M.M.P. and E.M.; data curation, D.G.-P., Y.F.-N. and E.M.; writing—original draft preparation, D.G.-P., M.M.P. and Y.F.-N.; writing—review and editing, Y.F.-N., E.M. and M.M.P.; supervision, Y.F.-N., E.M. and M.M.P. All authors have read and agreed to the published version of the manuscript.

Funding

This research received no external funding.

Acknowledgments

The authors wish to express their gratitude to the University Institute of Industrial Technology of Asturias (IUTA), the Ph.D. programme in Energy and Processes Control, University of Oviedo, and Gijon City Council under project SV-19-GIJÓN-1-06, which are related with this research.

Conflicts of Interest

The authors declare no conflicts of interest.

References

  1. United Nations. Framework Convention on Climate Change. Conference of the Parties. 2015. Available online: https://assets.documentcloud.org/documents/2646274/Updated-l09r01.pdf (accessed on 4 February 2020).
  2. European Union. Official Journal of the European Union, L 328. 21 December 2018. Available online: https://eur-lex.europa.eu/legal-content/EN/TXT/?uri=OJ:L:2018:328:TOC (accessed on 12 February 2020).
  3. Directive (EU) 2018/2002 of the European Parliament and of the Council of 11 December 2018 Amending Directive 2012/27/EU on Energy Efficiency. Official Journal of the European Union L328/210. 2018. Available online: https://eur-lex.europa.eu/legal-content/EN/TXT/?uri=uriserv%3AOJ.L_.2018.328.01.0210.01.ENG (accessed on 31 January 2020).
  4. Directive 2012/27/EU of the European Parliament and of the Council of 25 October 2012 on Energy Efficiency, Amending Directives 2009/125/EC and 2010/30/EU and Repealing Directives 2004/8/EC and 2006/32/EC. Official Journal of the European Union L315/1. 2012. Available online: https://eur-lex.europa.eu/legal-content/EN/TXT/PDF/?uri=CELEX:32012L0027&from=EN (accessed on 31 January 2020).
  5. Directive (EU) 2018/2001 of the European Parliament and of the Council of 11 December 2018 on the Promotion of the Use of Energy from Renewable Sources. Official Journal of the European Union 318/210. 2018. Available online: https://eur-lex.europa.eu/legal-content/EN/TXT/PDF/?uri=CELEX:32018L2001&from=EN (accessed on 3 February 2020).
  6. Regulation (EU) 2018/1999 of the European Parliament and of the Council of 11 December 2018 Governance of the Energy Union and Climate Action, Amending Regulations (EC) No 663/2009 and (EC) No 715/2009 of the European Parliament and of the Council, Directives 94/22/EC, 98/70/EC, 2009/31/EC, 2009/73/EC, 2010/31/EU, 2012/27/EU and 2013/30/EU of the European Parliament and of the Council, Council Directives 2009/119/EC and (EU) 2015/652 and repealing Regulation (EU) No 525/2013 of the European Parliament and of the Council. 2018. Available online: http://data.europa.eu/eli/reg/2018/1999/oj (accessed on 3 February 2020).
  7. Communication from the Commission to the European Parliament, the European Council, the Council, the European Economic and Social Committee, the Committee of the Regions and the European Investment Bank. A Clean Planet for All—A European Strategic Long-Term Vision for a Prosperous, Modern, Competitive and Climate Neutral Economy (COM (2018) 773 Final). 2018. Available online: https://eur-lex.europa.eu/legal-content/EN/ALL/?uri=CELEX%3A52018DC0773 (accessed on 4 February 2020).
  8. Spanish Ministry of Ecological Transition. National Integrated Energy and Climate Plan 2021–2030. 2019. Available online: https://www.miteco.gob.es/images/es/pnieccompleto_tcm30-508410.pdf (accessed on 3 March 2020). (In Spanish).
  9. Fortes, P.; Simoes, S.; Gouveia, J.P.; Seixas, J. Electricity, the silver bullet for the deep decarbonisation of the energy system? Cost-effectiveness analysis for Portugal. Appl. Energy 2019, 237, 292–303. [Google Scholar] [CrossRef]
  10. García-Gusano, D.; Garraín, D.; Dufour, J. Prospective life cycle assessment of the Spanish electricity production. Renew. Sustain. Energy Rev. 2017, 75, 21–34. [Google Scholar] [CrossRef]
  11. Atilgan, B.; Azapagic, A. Assessing the Environmental Sustainability of Electricity Generation in Turkey on a Life Cycle Basis. Energies 2016, 9, 31. [Google Scholar] [CrossRef] [Green Version]
  12. Ruhnau, O.; Bannik, S.; Otten, S.; Praktiknjo, A.; Robinius, M. Direct or indirect electrification? A review of heat generation and road transport decarbonisation scenarios for Germany 2050. Energy 2019, 166, 989–999. [Google Scholar] [CrossRef] [Green Version]
  13. Kato, E.; Kurosawa, A. Evaluation of Japanese energy system toward 2050 with TIMES-Japan – deep decarbonization pathways. Energy Procedia 2019, 158, 4141–4146. [Google Scholar] [CrossRef]
  14. Deetjen, T.A.; Conger, J.P.; Leibowicz, B.D.; Webber, M.E. Review of climate action plans in 29 major U.S. cities: Comparing current policies to research recommendations. Sustain. Cities Soc. 2018, 41, 711–727. [Google Scholar] [CrossRef]
  15. European Union. European Commission Directorate-General for Energy, Section Topics–Energy Efficiency–Buildings. 2017. Available online: https://ec.europa.eu/energy/en/topics/energy-efficiency/buildings (accessed on 15 February 2020).
  16. Directive 2002/91/EC of the European Parliament and of the Council of 16 December 2002 on the Energy Performance of Buildings. Official Journal of the European Communities L1. 2003. Available online: https://eur-lex.europa.eu/LexUriServ/LexUriServ.do?uri=OJ:L:2003:001:0065:0071:EN:PDF (accessed on 5 February 2020).
  17. Directive 2010/31/EU of the European Parliament and of the Council of 19 May 2010 on the Energy Performance of Buildings (Recast). Official Journal of the European Union L153/13. 2010. Available online: https://eur-lex.europa.eu/LexUriServ/LexUriServ.do?uri=OJ:L:2010:153:0013:0035:EN:PDF (accessed on 6 February 2020).
  18. Spanish Ministry of Housing. Spanish Technical Building Code. Basic Document on Energy Savings DB-HE. Royal Legislative Decree 314 of 17 March 2006. Available online: http://www.codigotecnico.org (accessed on 12 January 2020). (In Spanish).
  19. Spanish Ministry of Housing. Order VIV/984/2009, of 15 April, Amending Certain Basic Documents of the Spanish Technical Building Code Approved by the Royal Legislative Decree 314 of 17 March. Madrid. Spanish Ministry of Industry and Housing 2006 and the Royal Legislative Decree 1371 of 19 October 2007. 2009. Available online: http://www.codigotecnico.org (accessed on 12 January 2020). (In Spanish).
  20. Spanish Ministry of Infrastructure. Order FOM 1635 of 10 September 2013, for Which the Basic Document on Energy Savings DB-HE on the Spanish Technical Building Code is Updated. 2013. Available online: http://www.codigotecnico.org (accessed on 12 January 2020). (In Spanish).
  21. Spanish Ministry of Infrastructure. Order FOM 588 of 15 June 2017, Amending the Basic Document on Energy Savings DB-HE and the Basic Document on Healthy Conditions DB-HS “Salubridad” in the Spanish Technical Building Code Approved by Royal Legislative Decree 314 of 17 March 2006. 2017. Available online: http://www.codigotecnico.org (accessed on 12 January 2020). (In Spanish).
  22. EN 15978:2011. Sustainability of Construction Works—Assessment of Environmental Performance of Buildings—Calculation Method; European Committee for Standardization (CEN): Brussels, Belgium; Available online: https://standards.globalspec.com/std/1406797/EN%2015978 (accessed on 6 March 2020).
  23. EN 15804:2012 + A1:2013. Sustainability of Construction Works—Environmental Product Declarations—Core Rules for the Product Category of Construction Products; European Committee for Standardization (CEN): Brussels, Belgium; Available online: https://standards.cen.eu/dyn/www/f?p=204:110:0::::FSP_PROJECT,FSP_ORG_ID:40703,481830&cs=1B0F862919A7304F13AE6688330BBA2FF (accessed on 6 March 2020).
  24. Adalberth, K. Energy use during the life cycle of buildings: A method. Build. Environ. 1997, 32, 317–320. [Google Scholar] [CrossRef]
  25. Khasreen, M.M.; Banfill, P.; Menzies, G.F. Life-Cycle Assessment and the Environmental Impact of Buildings: A Review. Sustainability 2009, 1, 674–701. [Google Scholar] [CrossRef]
  26. Buyle, M.; Braet, J.; Audenaert, A. Life cycle assessment in the construction sector: A review. Renew. Sustain. Energy Rev. 2013, 26, 379–388. [Google Scholar] [CrossRef]
  27. Rashid, A.F.A.; Yusoff, S. A review of life cycle assessment method for building industry. Renew. Sustain. Energy Rev. 2015, 45, 244–248. [Google Scholar] [CrossRef] [Green Version]
  28. Vilches, A.; Garcia-Martinez, A.; Sanchez-Montañes, B. Life cycle assessment (LCA) of building refurbishment: A literature review. Energy Build. 2017, 135, 286–301. [Google Scholar] [CrossRef]
  29. Goedkoop, M.; Spriensma, R. The Eco-Indicator 99: A Damage Oriented Method for Life Cycle Impact Assessment. Methodology Annex, 3rd ed.; PRé; Consultants B.V.: Amersfoort, NL, USA, 2001; Available online: https://www.pre-sustainability.com/download/EI99_annexe_v3.pdf (accessed on 10 October 2019).
  30. Guinee, J.B.; Gorree, M.; Heijungs, R.; Huppes, G.; Koning, A.; Wegener-Sleeswijk, A.; Suh, S.; UdodeHaes, H.; Brujin, H.; Duin, R.; et al. Handbook on Life Cycle Assessment; Operational Guide to the ISO Standards: Dordrecht, Holland, 2002. [Google Scholar]
  31. Lewandowska, A.; Noskowiak, A.; Pajchrowski, G. Comparative life cycle assessment of passive and traditional residential buildings’ use with a special focus on energy-related aspects. Energy Build. 2013, 67, 635–646. [Google Scholar] [CrossRef]
  32. Szamosi, Z.; Bodnár, I.; Szepesi, G.L.; Rosas-Casals, M.; Berényi, L. Improved environmental impact in the architecture industry: LCA analysis of an alternative masonry element. Renew. Energy 2020, 147, 1718–1727. [Google Scholar] [CrossRef]
  33. Bribian, I.Z.; Uson, J.A.A.; Scarpellini, S. Life cycle assessment in buildings: State-of-the-art and simplified LCA methodology as a complement for building certification. Build. Environ. 2009, 44, 2510–2520. [Google Scholar] [CrossRef]
  34. ISO. ISO 14040, Environmental Management—Life Cycle Assessment—Principles and Framework; ISO: Geneva, Switzerland, 2006. [Google Scholar]
  35. ISO. ISO 14044, Environmental Management—Life Cycle Assessment—Requirements and Guidelines; ISO: Geneva, Switzerland, 2006. [Google Scholar]
  36. Zhang, Y.; Yan, D.; Hu, S.; Guo, S. Modelling of energy consumption and carbon emission from the building construction sector in China, a process-based LCA approach. Energy Policy 2019, 134, 110949. [Google Scholar] [CrossRef]
  37. Buyle, M.; Braet, J.; Audenaert, A. Life Cycle Assessment of an Apartment Building: Comparison of an Attributional and Consequential Approach. Energy Procedia 2014, 62, 132–140. [Google Scholar] [CrossRef] [Green Version]
  38. Schlegl, F.; Gantner, J.; Traunspurger, R.; Albrecht, S.; Leistner, P. LCA of buildings in Germany: Proposal for a future benchmark based on existing databases. Energy Build. 2019, 194, 342–350. [Google Scholar] [CrossRef]
  39. Gercek, M.; Arsan, Z.D. Energy and environmental performance based decision support process for early design stages of residential buildings under climate change. Sustain. Cities Soc. 2019, 48, 101580. [Google Scholar] [CrossRef]
  40. Andric, I.; Gomes, N.; Pina, A.; Ferrao, P.; Fournier, J.; Lacarrière, B.; Le Corre, O. Modeling the long-term effect of climate change on building heat demand: Case study on a district level. Energy Build. 2016, 126, 77–93. [Google Scholar] [CrossRef]
  41. Andric, I.; Silva, C.S.; Pina, A.; Ferrão, P.; Fournier, J.; Lacarrière, B.; Le Corre, B. The impact of climate change and building renovation on heating related CO2 emissions on a neighborhood level. In Proceedings of the International Conference CISBAT 2015 Future Buildings and Districts Sustainability from Nano to Urban Scale, Lausanne, Switzerland, 9–11 September 2015; pp. 621–626. Available online: https://doi.org/10.5075/epfl-cisbat2015-621-626 (accessed on 10 February 2020).
  42. Palacios-Munoz, B.; Peuportier, B.; Gracia, L.; López-Mesa, B. Sustainability assessment of refurbishment vs. new constructions by means of LCA and durability-based estimations of buildings lifespans: A new approach. Build. Environ. 2019, 160, 106–203. [Google Scholar] [CrossRef]
  43. Meteonorm Handbook, Parts I, II and III; Meteotest: Bern, Switzerland, 2016; Available online: http://www.meteotest.ch (accessed on 10 July 2019).
  44. Spanish Grid Operator. 2019. Available online: https://www.ree.es/es/estadisticas-del-sistema-electrico-espanol/series-estadisticas/series-estadisticas-nacionales (accessed on 18 May 2019).
  45. International Energy Agency. The IEA’s Monthly Electricity Statistics. 2019. Available online: https://www.iea.org/statistics/monthly/#electricity (accessed on 18 May 2019).
  46. Berndgen-Kaiser, A.; Fox-Kämper, R.; Wiechert, M. Post-war Single-Family Houses in Europe under Pressure? A Demographic and Economic Framework for the Future Market of Elder Single-Family Housing Neighbourhoods. J. Urban Res. 2016. Available online: http://journals.openedition.org/articulo/3021 (accessed on 6 March 2020).
  47. González Prieto, D.; Prieto González, M.M. Impact of socio-economic aspects on the typologies of industrialized housing: Use of lightweight concrete in Asturias. In Proceedings of the 9th European Conference on Energy Efficiency and Sustainability in Architecture and Planning/2nd International Congress on Advanced Construction, Bilbao, Spain, 10–12 September 2018; Available online: https://www.uik.eus/es/9o-congreso-europeo-sobre-eficiencia-energetica-y-sostenibilidad-en-arquitectura-y-urbanismo-eesap-9 (accessed on 4 February 2020).
  48. Perez, R.; Ineichen, P.; Maxwell, E.; Seals, R.; Zelenka, A. Dynamic models for hourly global-to-direct irradiance conversion. In Proceedings of the Solar World Congress Biennial Congress of the International Solar Energy Society, Denver, CO, USA, 19–23 August 1991; Volume 1. Part II. [Google Scholar]
  49. PHPP Passive House Planning Package; Version 9; Passive House Institute: Darmstadt, Germany, 2015.
  50. CYPECAD MEP; Version 2019; CYPE Ingenieros, S.A.: Alicante, Spain, 2019.
  51. ISO. ISO 52016-1. Energy Performance of Buildings—Energy Needs for Heating and Cooling, Internal Temperatures and Sensible and Latent Heat Loads—Part 1: Calculation Procedures; ISO: Geneva, Switzerland, 2017. [Google Scholar]
  52. CYPETHERM HE PLUS; Version 2019; CYPE Ingenieros, S.A.: Alicante, Spain, 2019.
  53. Jolliet, O.; Margni, M.; Charles, R.; Humbert, S.; Payet, J.; Rebitzer, G.; Rosenbaum, R. IMPACT 2002+: A New Life Cycle Impact Assessment Methodology; Swiss Federal Institute of Technology Lausanne (EPFL): Lausanne, Switzerland, 2003. [Google Scholar]
  54. Pennington, D.W.; Margni, M.; Ammann, C.; Jolliet, O. Multimedia Fate and Human Intake Modeling: Spatial versus Nonspatial Insights for Chemical Emissions in Western Europe. Environ. Sci. Technol. 2005, 39, 1119–1128. [Google Scholar] [CrossRef] [PubMed]
  55. International Renewable Energy Agency (IRENA). Renewable Energy Prospects for the European Union; European Commission: Brussels, Belgium, 2018. [Google Scholar]
  56. Lechón, Y.; De La Rua, C.; Cabal, H. Impacts of Decarbonisation on the Water-Energy-Land (WEL) Nexus: A Case Study of the Spanish Electricity Sector. Energies 2018, 11, 1203. [Google Scholar] [CrossRef] [Green Version]
  57. Directive 2009/28/EC of the European Parliament and of the Council of 23 April 2009 on the Promotion of the Use of Energy from Renewable Sources and Amending and Subsequently Repealing Directives 2001/77/EC and 2003/30/EC. Official Journal of the European Union 140/16. 2009. Available online: https://eur-lex.europa.eu/legal-content/EN/TXT/PDF/?uri=CELEX:32009L0028 (accessed on 7 February 2020).
  58. Directive 2009/29/EC amending Directive 2003/87/EC so as to Improve and Extend the Greenhouse Gas Emission Allowance Trading Scheme of the Community. Official Journal of the European Union L 140/63. 2009. Available online: https://eur-lex.europa.eu/legal-content/EN/TXT/?uri=celex%3A32009L0029 (accessed on 7 February 2020).
  59. Directive 2001/81/EC on National Emission Ceilings for Certain Atmospheric Pollutants. Official Journal of the European Union L 309. 2001. Available online: https://eur-lex.europa.eu/LexUriServ/LexUriServ.do?uri=OJ:L:2001:309:0022:0030:EN:PDF (accessed on 17 February 2020).
  60. Karimpour, M.; Belusko, M.; Xing, K.; Bruno, F. Minimising the life cycle energy of buildings: Review and analysis. Build. Environ. 2014, 73, 106–114. [Google Scholar] [CrossRef]
  61. Suarez, R.; Escandón, R.; López-Pérez, R.; Leon-Rodriguez, A.L.; Klein, T.; Silvester, S. Impact of Climate Change: Environmental Assessment of Passive Solutions in a Single-Family Home in Southern Spain. Sustainability 2018, 10, 2914. [Google Scholar] [CrossRef] [Green Version]
Figure 1. Scheme of the steps followed in this study.
Sustainability 12 03529 g001
Figure 2. House constraints: (a) views of the single-family house with the glazed openings facing South and North and (b) climate zones in Spain according to their level of irradiation [20] and locations of the studied cities.
Sustainability 12 03529 g002
Figure 3. Average montly values for (a) global horizontal irradiation and (b) dry temperature for 2020.
Sustainability 12 03529 g003
Figure 4. Overall schema of the IMPACT 2002+ framework, linking the impact categories to damage categories.
Sustainability 12 03529 g004
Figure 5. Contribution of each power generation scenarios to the damage (a) and impact (b) categories (normalised values).
Sustainability 12 03529 g005
Figure 6. Heating demands (values and percentage variation).
Sustainability 12 03529 g006
Figure 7. Cooling demands (values and percentage variation).
Sustainability 12 03529 g007
Figure 8. Damage category: Human Health (values and percentage variation).
Sustainability 12 03529 g008
Figure 9. Damage category: Ecosystem Quality (values and percentage variation).
Sustainability 12 03529 g009
Figure 10. Damage category: Climate Change (values and percentage variation).
Sustainability 12 03529 g010
Figure 11. Damage category: Resources (values and percentage variation).
Sustainability 12 03529 g011
Table 1. Gross electricity generation (GWh) in 2018 and the proposal for 2020 and 2030 according to the target scenario in Spain [8].
2018%2020%2030%
RenewablesHydroHydropower34,1063328,2882328,35110
Pumped-storage200924594411,9604
WindHydro-wind2400000
Wind49,5704860,67050119,52044
SolarSolar photovoltaic7759816,3041370,49126
Solar thermal442445608523,1709
OthersOthers renewables (1)00003010
Renewable waste (2)443146823617,5966
Total Renewables102,324100122,287100271,389100
Non-RenewablesNuclearNuclear53,1983458,0393724,95232
CoalCoal37,2742333,1602100
OilOil + Gas6683410,141750717
Natural gasCombined cycle30,0441929,2911932,72542
Cogeneration (3)29,0161824,8451615,17919
OthersNon-renewable waste243520000
Total Non-Renewables158,650100155,47610077,927100
Total Renewables + Non-Renewables260,974277,763349,316
(1) Geothermal and marine energies; (2) Renewable cogeneration, biomass, waste cogeneration and municipal waste; (3) Gas and oil products (no coal).
Table 2. Characteristics of the envelope elements and properties of the building materials.
Building ElementMaterialThicknessConductivity
(m)(W/m K)
External wall
(with internal lining)
Plaster0.0130.250
Mineral wool0.0470.035
Lightweight concrete0.1400.680
XPS0.1400.034
Coat of cement0.0180.459
Total0.358
Floor slabWood0.0200.130
Conductive cement mortar0.0402.000
XPS with acoustic protection0.0400.034
Lightweight concrete0.1400.680
XPS0.1400.034
Cement mortar0.0501.050
Concrete slab0.2002.100
Total0.630
RoofLightweight concrete0.1400.680
XPS0.2000.034
Oriented strand board (OSB)0.0240.120
Air layer0.0600.180
Slate0.0182.200
Total0.442
Horizontal
partition
Plaster0.0130.250
Mineral wool0.0400.035
Total0.053
Vertical
partition
Gypsum plaster0.0150.540
Lightweight concrete0.0800.680
Expanded polystyrene0.0800.035
Total0.175
External wall
(without internal
lining)
Lightweight concrete0.1400.680
XPS0.1400.034
Coat of cement0.0180.459
Total0.298
Table 3. Internal contributions due to persons, lighting and other equipment, set point of heating and cooling, ventilation and infiltration rates.
Schedule1 h–7 h8 h9 h–15 h16 h–18 h19 h20 h–23 h24 h
Persons (W/m2)
- Working day (sensible)2.150.540.541.081.081.082.15
- Working day (latent)1.360.340.340.680.680.681.36
- Holiday (sensible)2.152.152.152.152.152.152.15
- Holiday (latent)1.361.361.361.361.361.361.36
Lighting (W/m2)2.21.321.321.322.24.44.4
Other equipment (W/m2)2.21.321.321.322.24.44.4
Heating set point (°C)17202020202017
Cooling set point (°C)27252525252527
Ventilation + infiltration
rate (/h) (1)
- Winter1.4681.4681.4681.4681.4681.4681.468
- Summer441.4681.4681.4681.4681.468
(1) Minimum air renewals required by STBC regarding the Basic Document on Health (DB HS 3).
Table 4. Comparison scenarios: mix of gross electricity generation (%).
Energy Sources20202030
NIECPBaU 1NIECPBaU 1
Hydro11.813.411.511.8
Wind21.816.034.232.4
Solar PV5.92.620.22.1
Solar Thermal2.01.56.68.8
Other Renewables2.52.15.03.6
Nuclear20.924.97.10.0
Coal11.90.00.00.0
Oil + Gas3.78.51.55.1
Natural Gas (power and heat and power)19.530.913.736.2
1: García-Gusano [10].
Table 5. Summary of the damages and impacts associated to each power generation scenario.
Damage Categories (Endpoint Categories)
CategoriesUnit201820202030
Human HealthDALY8.65 × 10+048.28 × 10+044.73 × 10+04
Ecosystem QualityPDF·m2·year2.31 × 10+102.65 × 10+103.92 × 10+10
Climate Changekg CO2 eq8.46 × 10+108.11 × 10+104.81 × 10+10
ResourcesMJ primary1.87 × 10+121.90 × 10+121.14 × 10+12
Impact Categories (Midpoint Categories)
CategoriesUnit201820202030
Carcinogenskg C2H3Cl eq1.63 × 10+091.48 × 10+091.60 × 10+09
Non-Carcinogenskg C2H3Cl eq1.03 × 10+091.13 × 10+091.73 × 10+09
Respiratory Inorganicskg PM2.5 eq1.12 × 10+081.06 × 10+080.53 × 10+08
Ionising RadiationBq C-14 eq4.58 × 10+125.02 × 10+122.49 × 10+12
Ozone Layer Depletionkg CFC-11 eq1.36 × 10+041.46 × 10+041.22 × 10+04
Respiratory Organicskg C2H4 eq1.37 × 10+071.23 × 10+071.53 × 10+07
Aquatic Ecotoxicitykg TEG water7.70 × 10+128.56 × 10+1210.8 × 10+12
Terrestrial Ecotoxicitykg TEG soil2.36 × 10+122.67 × 10+123.81 × 10+12
Terrestrial Acid/Nutrikg SO2 eq1.67 × 10+091.67 × 10+090.94 × 10+09
Land Occupationm2org.arable2.09 × 10+092.89 × 10+096.93 × 10+09
Aquatic Acidificationkg SO2 eq5.78 × 10+085.60 × 10+082.62 × 10+08
Aquatic Eutrophicationkg PO4 P-lim1.73 × 10+071.78 × 10+071.78 × 10+07
Global Warming Potentialkg CO2 eq8.46 × 10+108.11 × 10+104.81 × 10+10
Non-Renewable EnergyMJ primary1.87 × 10+121.89 × 10+121.14 × 10+12
Mineral ExtractionMJ surplus4.50 × 10+094.90 × 10+097.14 × 10+09

