2. Preliminary Review
Nowadays, the overall goal of all the stakeholders, visionaries, and policymakers aim towards a sustainable future. The most commonly used definition of sustainability is [
11]: “ meeting the needs of the present without compromising the ability of future generations to meet their own needs”. Taking this approach creates a balance in the economy, environment, and society. From a broader point of view, [
12] the future depends on the available natural resources, built infrastructure (such as the large energy generation stations), technological development, environment, economy, and society. This future vision is controlled by the strategic actions that are derived from an estimation of the current situation, technological foresight and demand forecast, and are defined for a future that is intended to be attained. Of course, the process of the development and realisation of the future is only a partly controllable, stochastic process [
13]. Therefore, the strategic actions must be redefined regularly, based on the actual realised state of development. The indicators in
Table 1 control progress in such a development process. The indicators list some examples that can be applied when managing future sustainable developments of the railway systems in developing countries.
The railway system, along with other transportation systems, are major deterministic elements of future developments. Therefore, their development involves objects of strategic management. Unfortunately, strategic management describes simplified methods for creating the mission, objectives, strategies, tactics, and actions. They are applicable when the time horizon is relatively short, and the environment, including the economy, societies, technologies, and financing are relatively stable, and only change predictably.
In the case of planning railway system developments, the time horizon must be increased to a minimum of 20–30 years, during which the different elements determining the future might change considerably, even radically and/or in unpredictable ways.
According to our preliminary studies, the major characteristics defining future systems are demand, accessibility, and affordability. Herein, the authors of this paper use simple definitions of these terms. Demand is the needs of customers (people/societies or companies/economy) for a given product or service, where the customers are willing to pay for it. Accessibility means the given product or service is available to use and is accessible. Here, it means that the customer can reach and use the railway system. Finally, the products or services are affordable, if the price of the service and fees are acceptable by the customers.
It can be understood that demand is increasing with a growing population or economy. Accessibility depends on infrastructural development and required investments. Affordability is a function of the total cost of operation and the income of customers. Accessibility and affordability can be supported by technological development, enabling more efficient, greener, safer and available products or services.
The legal framework plays a vital role in the development of future systems. For example, demand depends not only on the growth of population, but also on the education and health level, available jobs, and migration. Accessibility may receive support from the common budget or other government income from the taxation system. Affordability depends not only on technological development, i.e., operational cost reduction, but also on the budgets of people who intend to travel. However, such a so-called travel budget also depends on the taxation systems.
All these features might be summarized in a complex task, as shown in
Figure 3.
The methodology developed and applied contains tools for estimating and handling these aspects shown in
Figure 3. For this purpose, the so-called drivers are applied. Drivers are indicators that show the actual state of the realization of the plans or development and can be used to estimate the required future aspects. As it is known, GDP is a commonly used indicator for defining the state of the economy. Of course, other indicators such as globalization, the volume of exports, imports, etc., can also be used. Society can be characterized by the population, population density, wages, personal incomes, etc. Financing means the total GDP and the amount of funds usable for developments, etc. Technology is an interesting area. At first, it can be characterized by the number of production units. On the other hand, it is important to include efficiency, the cost of production, cost of operation, total costs including externalities and the impact on the environment, etc.
As it had been underlined already, the legal framework is included in the overall system of strategic management. Governments, under pressure from stakeholders, may (must) define the legal status, and through it, the future development of the economy, society, technology, and future systems. For example, through the taxation system, the profitability of companies, the net income of people and the availability of required financial support for a common purpose can be controlled. On the other hand, using tax revenue to support the growth of the population, support the education and health systems, develop infrastructure, support the use of emerging technologies (like electric cars, energy-saving, etc.) may have priority during budget redistribution.
A general methodology was developed. It was constructed in a bottom-up way, and it is open at the top to include additional unique methods to consider further aspects influencing the future sustainable development of transport systems; here specifically, the railway transport.
As can be understood, the foundation of all modern states and societies is the system of law. Generally speaking, “law is one of several techniques people use to prevent or resolve conflicts” [
14]. One of the oldest codified systems of law was engraved in stone in old Babylon. The Code of Hammurabi, after King Hammurabi (reign 1792–1750 B.C.), described more than 300 laws to create a balance between people, first economic units and power actors (king) [
15]. It was dealing with homicide, assault, divorce, debt, adoption, tradesman’s fees, agricultural practices, and even disputes regarding the brewing of beer. Here, the agricultural practices called for particular attention due to the development and introduction of irrigation water management, and therefore, the requirements for procedural regulation had also appeared. The regulation ensures a balance between water users.
The modern legal framework has the same objectives. However, such a system of law has to be developed, which makes a balance between the interests of the economy, society, sustainability, and the future generations’ interests. Of course, all the laws must be harmonized, considering technological development. Generally, it is challenging to predict how technology will transform society, economy, and government. Nevertheless, as Australian Information Commissioner John McMillan defined [
16]: “We can, however, be guided by the dramatic administrative justice changes that have occurred over the past forty years, which point to the inevitability of further change in a digital age.”
The legal framework plays a major part in the development of an environment supporting innovation while also taking into account sustainability [
17,
18]. Therefore, such an approach has a crucial role, especially in developing countries [
19,
20]. Developing countries have started to develop their codes supporting their interest in the last 10–25 years. Developing countries have initiated extensive legislation process, including the protection of their resources. For example, Kenya tries to solve the conflicts around oil revenue allocation by improving stakeholder responsibility [
21].
There is no unique formal model of the legislation process. Policymakers may choose the best practice from descriptions of the legal framework available, even on the internet, and adapt it to the actual environment and strategic goals defined.
According to
Figure 4, legislation is a basis for the railway system’s strategic development. The practice of regulation was analysed, including the operation and developments of different high level, intermediate and developing countries with the aim of finding examples for developing countries. Most of the African countries can follow the practice of intermediate countries in railway developments.
For instance, in Hungary, the first law article (1836XXV) dealing with railway development was accepted by the Hungarian Diet (parliament) in 1836 [
22]. This act had at least three important provisions: (i) it allows the expropriation of required lands, (ii) it prescribed that everybody is liable for paying for the service, and (iii) it gave a series of tax debits to support the railway system development companies. The first railway line in Hungary was opened in 1846.
In 1848, Earl Istvan Szechenyi defined a plan for railway developments and underlined the role of railway systems in the economy and the operation of the country, supporting market expansion and warfare.
The first railways were developed with the use of private capital, while since the beginning, the state participation in railway development has been in the order of today. Since 1867, the state had conceptually developed and established the Hungarian Royal State Railways. In 1910, the total length of the Hungarian railway was more than 20 thousand kilometres. After the First World War, the country lost nearly two thirds of the railways, and the new border of the country has cut the railway systems at 49 points. Due to this, the Hungarian railways became a centralised system with the capital in the centre. However, the railway developments have not stopped. In 1932, practically all the railways were operated under a state company. Between 1932–1947, the only system in the world, the Budapest–Hegyeshalom line was electrified with industrial frequency. The locomotive industry of Hungary has worked at a world recognised level [
23].
After the Second World War, the Hungarian railway system had two different faces. More than 20 percent of the lines were electrified, while another 20 percent were closed [
24]. After joining the European Union in 2004, the EU railway policy and standards were also applied in Hungary [
25,
26]. In the last decade, intensive developments have started.
The practice in Hungary in market competitive developments of the road and railways system may show good ways for African countries, and especially for Kenya. It is most interesting how the country has not followed the forced privatisation started in the middle of 1980s in European countries, trying to keep the independence of the Hungarian railway. This has made its development process for the last decade fully harmonised and its regulations in accordance with EU requirements, especially in the field of authorisation.
The sustainable future should be based on the society, economy, and technological development. Societies and economies of developing countries are in a transition that can be characterized by the indicators. In developing countries for the last 20–40 years, the population has been increasing rapidly. According to the World Bank Data [
27], for example, the population of Angola, Congo, Kenya, or Nigeria has doubled in the 25 years after 1990. In the same period, the percentage of people enrolling in secondary education has increased by 1.8–2.5 times. All the developing countries try to increase the position of the middle class. In Kenya, the income share held by the middle class increased from 10.7% in the year 1992 up to 13.4% in 2005.
The developing countries’ economies intensely depend on world progress, but their GDP growth (annual percentage) is 3–10 times greater (in absolute value) (
Figure 5).
Technological development support in developing countries is at a rather low level. Countries of the Sub-Saharan Africa region have research and development expenditure as a part of GDP, much less than the developed or fast-growing countries, like China (
Figure 6). Specifically, most of the African countries spend less than 0.5% of GDP on research and development.
The future developments depend on the available financing, including the state or public and private sources, as well as the public-private partnerships. The available financing supports are defined in the legal framework, even in the case of sourcing from the state budget. There are four levels of funding that can be distinguished: (i) international actions, (ii) state (government/European Commission) decisions based on codes, (iii) sources provided by state and private companies, organisations, foundations, and (iv) unsolicited gifts. Actions and legislation manage finances. Actions might be defined on international or national levels. Nowadays, some actions are developed and coordinated on the highest international level by the United Nations, like the Financing for Development Program. The report on progress evaluation [
28] defines exactly the challenges of the program: “The 2030 Agenda for Sustainable Development, the Paris Agreement on climate change and the Addis Ababa Action Agenda on Financing for Development lay out an ambitious set of commitments to create a more inclusive global economy that will provide opportunities for all people and ensure a healthier planet for future generations”.
Between the public, national, and private strategic planning, the difference is indicated by the size of the concerned set of stakeholders. The public and national plans must be harmonized with the leaders of the economic and societal communities. Therefore, the national plans usually are developed by special committees or institutions on behalf of governments. Therefore, all the methods of formalized models of strategic management (summarised by [
29]) can be applied, but all the plans need to be adapted to the given economy and society, and the goals defined by the vision of state [
30] or international bodies [
31].
3. Applied Methodology
The forecast, foresight, business models and business plans all support the development of the strategy for achieving the goals of visions. Principally, the vision—the required set of actions resulting in the predefined vision—can be converted into a roadmap [
32].
Foresight [
13,
33] is the knowledge, or sound judgment, into a future event that may or may not occur. This is an act of looking forward. It provides general input for technology policy. As most developing countries, especially in Sub-Saharan Africa, spend limited amounts on research and development, they could potentially use the results of available technology foresight [
7,
34].
Forecast is a prediction of the future based on estimation. It uses methods from simple trend analysis to the complex models dealing with an extensive series of drivers, i.e., indicators (see
Table 1) having a determining influence on the forecasting of products or services.
While there are a considerable amount of forecast methods available, the real problems, such as demand forecast in a given mode of travel, require more studies and the adaption of methodologies [
35,
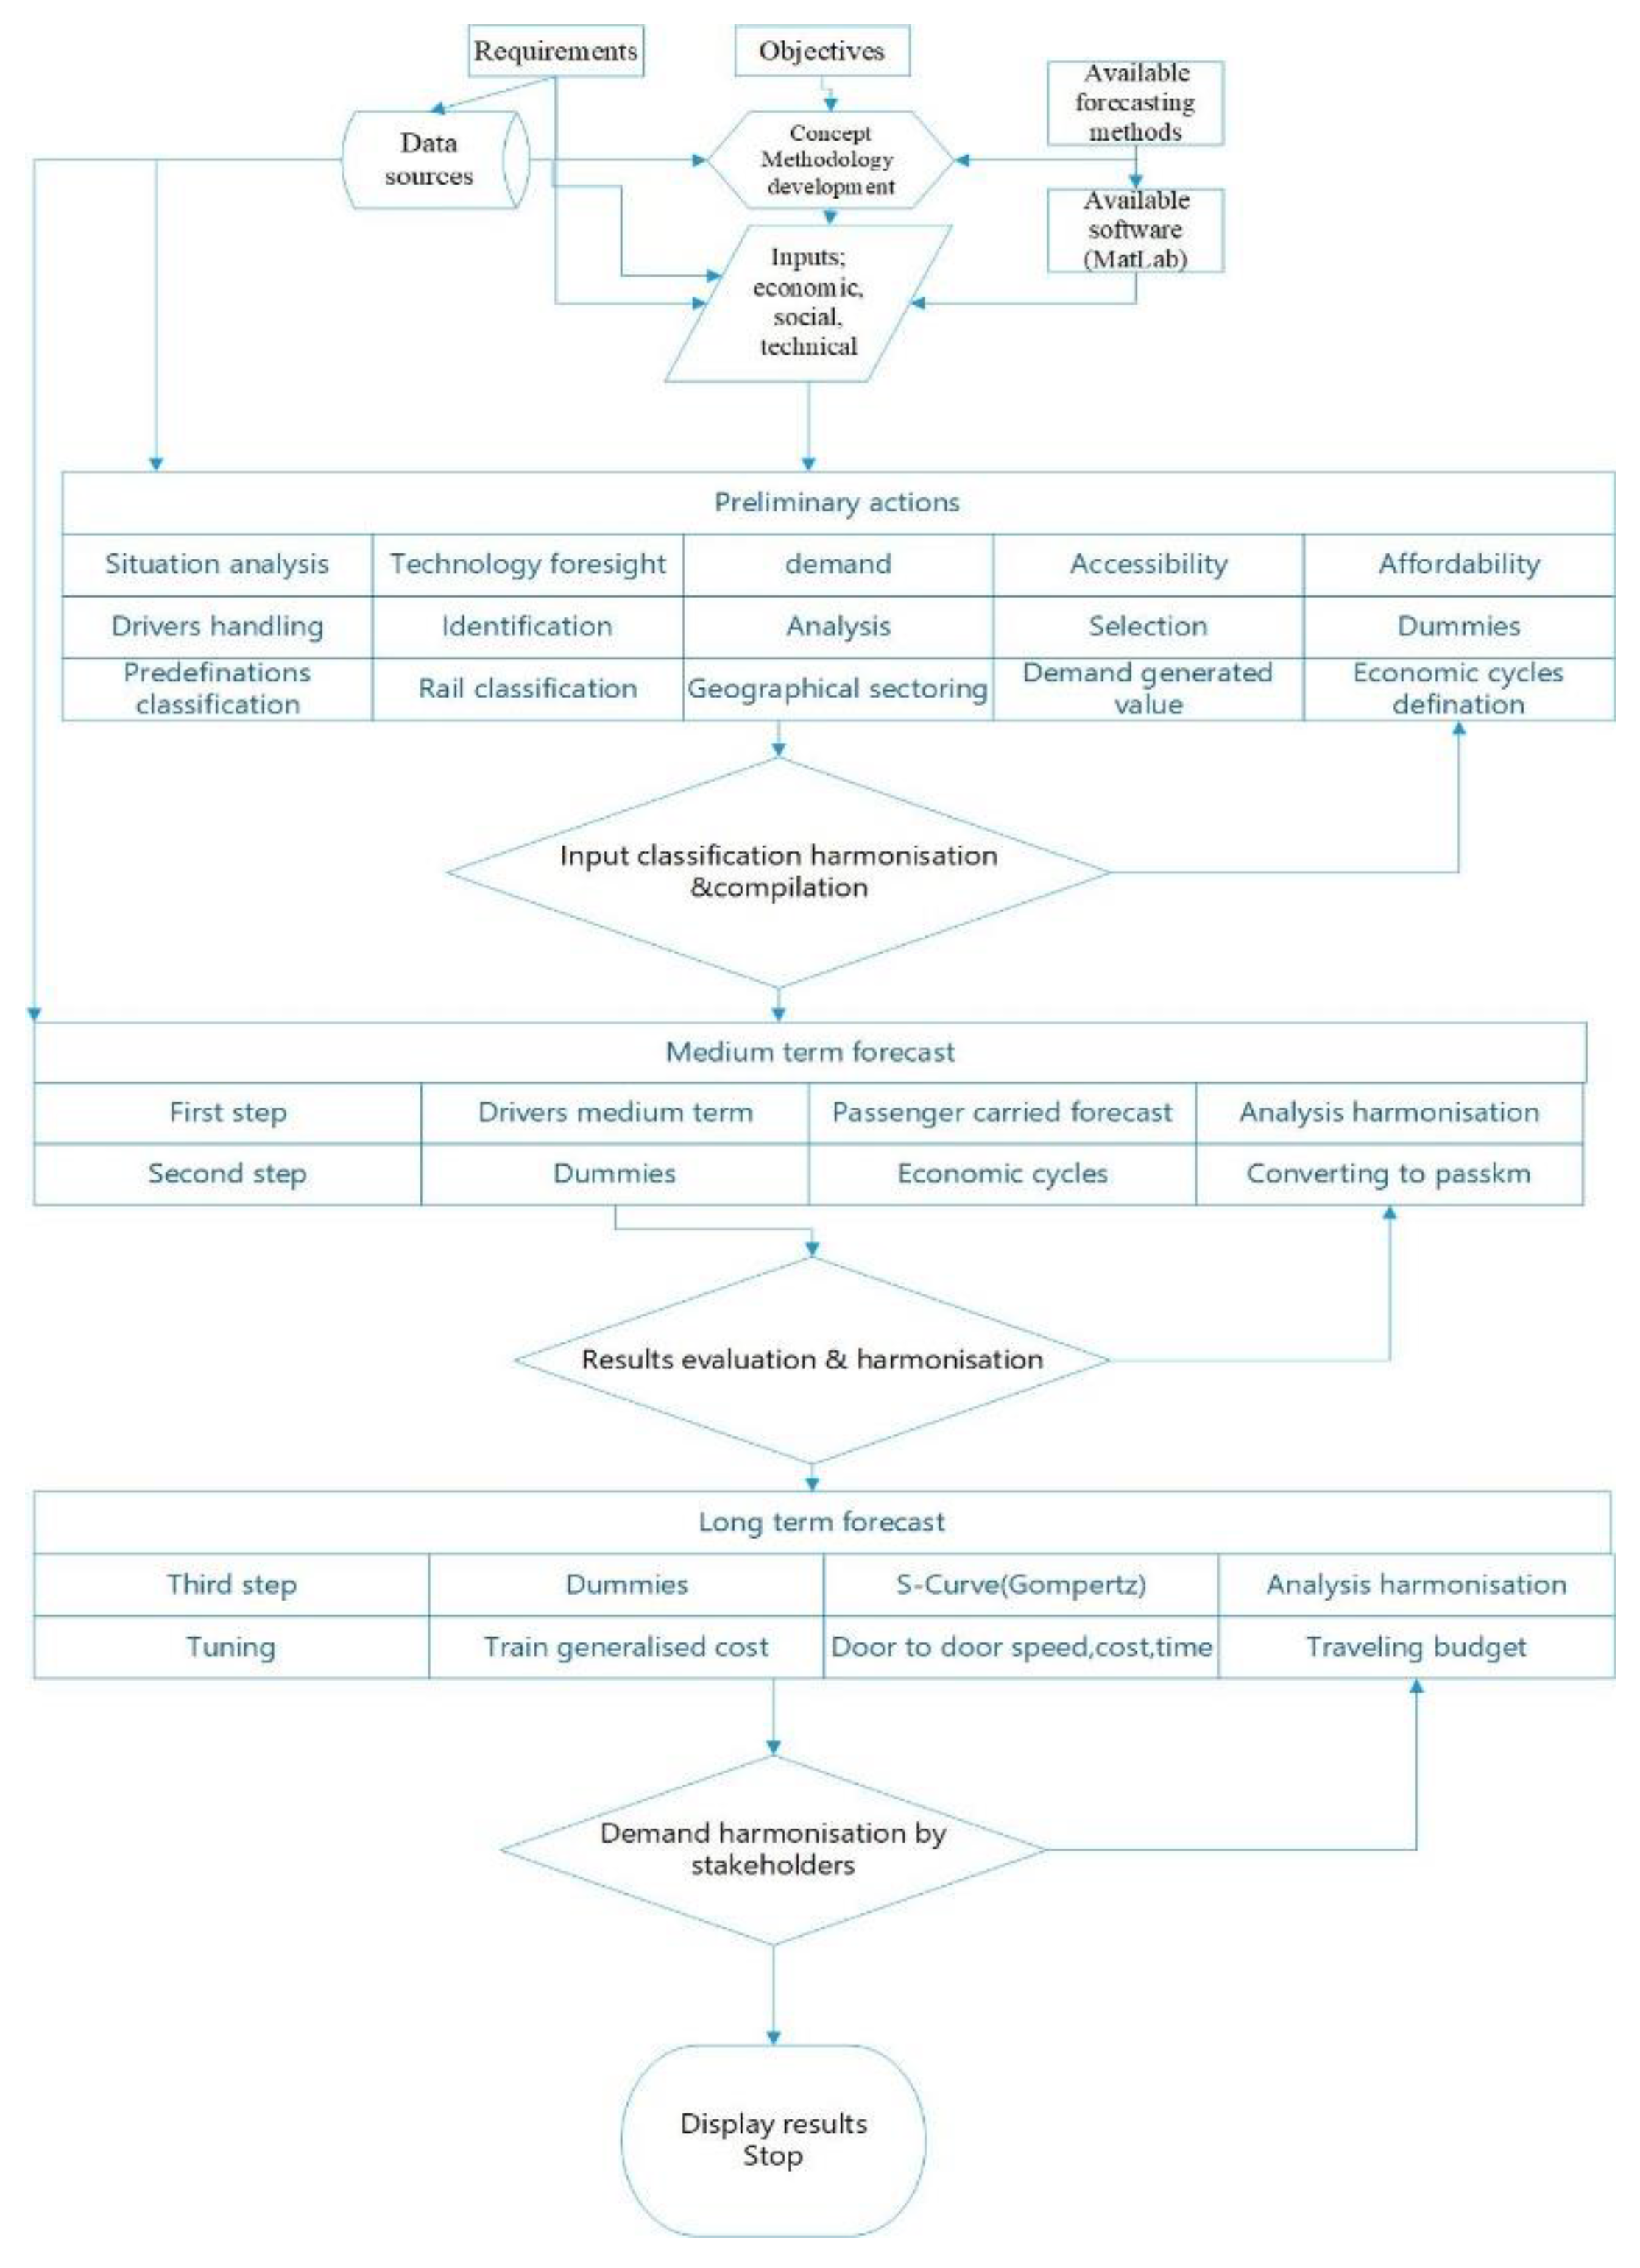
36]. The reason for this is the lack of required historical data, missing (or even false) data in statistics, therefore, real drivers might be different depending on the real economic condition, societal structure and culture, supporting laws, etc. The time horizon, for which the forecast is planned, also has a significant effect on accuracy. In particular, the long-range predictions may have unexpected, understandable errors. Therefore, the philosophy of a methodology developed for forecasting the demand in railway developments is recommended (
Figure 7).
The forecast methodology described in
Figure 7. Has four major sections:
Concept development—the definition of objectives, requirements, analysis of available forecasting software, input data, selection of drivers.
Preliminary actions—input classification, harmonisation and completion based on situational analysis, the study of the available foresight, investigation and estimation of demand, accessibility and affordability,
Medium-term forecast—drivers forecast, the definition of the dummies, the study of the economic cycle effects, results analysis.
Long-term forecast—using dummies from vision papers, strategic plans, “S”-curve (Gompertz model), study changes and the influence of changes in user requirements (like door-to-door speed, or value of time).
Herein, harmonization of inputs means that the missing data that can be estimated using the trends found in historical data of the regions having analogical economic and societal performance. The second, long term forecast uses the “S”-curve model because practice shows that using available historical data may not forecast the correct results, and the methods applied in the first short term forecast cannot be accepted. Herein, the term “cannot be accepted” means, for example, that the education level in the population after 2035 will be reduced in case of using the available software for forecasting this indicator. In the case of the short-term forecast, the classic management methods can be readily applied.
However, future technology allows for the development of radically new and even unconventional solutions. The IDEA-E Hungarian national project [
37] deals with the development of such radically new, disruptive technologies. Developing and implementing radically new, unconventional solutions require the so-called “out of the box thinking” [
38]. According to the Association of American Railroad’s opinion [
39], future rail transport will use hundreds of sensors built into the tracks, and vehicles and that will allow the automated inspections of tracks, advance fuel/energy management, the so-called positive train control. All of these will improve the system’s efficiency. In the case of such highly automated systems, the role of operators shifted from active monitoring and control to passive monitoring, which might even be controlled from considerable distances. Therefore, new elements appear, such as monitoring the mental condition of operators [
40,
41]. The fully autonomous train and railway transport require relevant codes to define the responsibility for risk detection and elimination [
42].
It seems that future technologies will have improved efficiency, safety and will reduce the environmental impact of future transport systems. The investigation of these technological effects requires the development of general approaches at the system level and specific methods on the sub-system, vehicle level. Taking into account the technological advancements, effortless adaptability of future systems and constrained electrical generation in developing countries in addition to the demand forecast on major corridors in Nairobi Kenya, i.e., inbound person trips in peak one hour by matatu (A Swahili term referring to a minibus) and the bus on 2030 (the do nothing case), proved the necessity to plan for strategies. These strategies include the train-tram hybrid that would enable the recovery of energy through regenerative braking (whereby during train braking, kinetic energy dissipated is recovered) and timely maintenance. The Hipot device has been proposed to improve the overall efficiency of the rail system, lowering the specific energy consumption, especially in electro-mechanical components of the system.
From the selection chart, each urban transportation system has a covering range of transportation capacity see
Figure 8. If the future demand forecast is close to the maximum capacity of the system, that system should not be selected providing a margin of the capacity. When forecasting passengers per hour per direction (PPHPD) [
43] as part of the planned corridor which exceeds 16,000 (see
Figure 9) in the future, bus rapid transport (BRT) cannot be recommended.
The projected future population of Nairobi is expected to exceed 10 million, therefore, the viability train-tram in hybrid adoption was explored by adapting the European studies checklist [
44].
Table 2 demonstrating the dot morphological matrix.
Replacing the diesel commuter trains serving short, urban routes with electric trams significantly helps to reduce energy consumption, and consequently, emission levels in terms of Well-to-wheels (WTT) and Tank-to-wheels (TTW).
The definitions of energy consumption and emissions following EN 16258 standards:
Well-to-tank (WTT) (energy processes): Recording energy consumption and all indirect emissions from fuel provision from the well to the vehicle tank. Energy consumption includes losses during the production of the energy sources, e.g., in high-voltage lines.
Tank-to-wheels (TTW) (vehicle processes): Recording all direct emissions from vehicle operation. Consumption here refers to final energy consumption.
Well-to-wheels (WTW) (vehicle and energy processes): The sum of well-to-tank and tank-to-wheels, i.e., direct and indirect emissions. Consumption here refers to primary energy consumption, which, besides the end energy consumption, includes all losses from the upstream chain.
Since Kenya does not have adequate power to run electrified rail in the whole country yet, the possibility of having train-tram with mixed operations on heavy rail tracks would give the country maximum benefit utilizing available resources.
To demonstrate the importance of engineering and scientific studies, the system element might be shown by the development of an automated Hipot device that performs the voltage insulation test [
45]. In this test, the machine is stressed far beyond what it would typically encounter during nominal use. The insulation of electrical devices deteriorates with age due to the contamination of winding, internal partial discharges, loosening of bars in the slots or overhangs, overvoltage, etc. These all lead to increased iron (I
2R) losses. The proposed device helps to track the health of the motors’ insulation, thereby reducing the I
2R losses and promoting overall rail system efficiency.
Voltage dividers generate low-level signals at 0–10 V proportional to the value of the output voltage regulator (0–300 V). The signal from the voltage divider is fed to op-amp, and the other input signal is from a digital-analogue converter. The output from the op-amp is (V
vd −Vd
ac) K
op-amp, where K
op-amp is the gain of op-amp equal to 100 (see
Figure 10).
Pulse wave generators form Vwave (t), and this voltage, is compared to the difference (Vvd −Vdac) Kop-amp. At the beginning of each period T, switch S1 is closed and when Vwave (t) reaches the value Vvd−Vdac, the comparator is triggered, and switch S1 opens.
In the beginning, when the voltage at the output of the regulator is not large, the signal of the voltage divider is small, the difference Vvd −Vdac is large, and the power key is open almost the entire period. As the output voltage increases, the difference (Vvd −Vdac) decreases, which leads to a decrease in the duration of the open state of the key. When Vdac is greater than Vvd, the voltage output of op-amp is −15 V, which is less than the minimum voltage of the pulse wave generator. Therefore, the pulses at the output of the comparator is absent, the switch S1 is kept closed all the time, and the output voltage ceases to increase.
The effect of load variation is simulated by connecting a low-resistance resistor, whose value is less than 100 times that of a permanently connected resistor simulating losses in the inverter at an idle mode. This sharp change in resistance simulates a sharp increase in the current of the inverter that occurs during a breakdown.
Figure 11 shows the oscillogram signal after connecting and disconnecting the load Rn = 100 Ohm at the output of the automatic regulator.
On the other hand, nowadays, good strategic plans try to take into account the effects of economic cycles on future development, on investments and demands.
Figure 12. shows the changes in the GDP yearly rate of the United Kingdom (UK) available for the last 700 years [
46]. In this figure, it might be difficult to understand the occurrence of the economic cycles, because they are composed from different cycles and they are combined with other effects as war cycles and epidemics.
After Schumpeter’s [
46] first classification, nowadays, five business cycles are defined: (1) 3–7 years Kitchin inventory, (2) 7–11 years Juglar fixed investment, (3) 15–25 years Kuznets infrastructural investment, (4) 45–60 years Kondratieff long-wave, and (5) 70+ grand super-cycles.
After studying the GDP time series for different countries, several specific features are identified, influencing the investment and development processes.
Finally, the total life cycle cost and or total life cycle impact on the environment have taken place in strategic development. For example, today, most researchers are investigating the impacts of products or services on climate change, or more directly, on greenhouse gas emission. Therefore, governments are introducing laws to support the development, market introduction, and operation of electric vehicles, electric transportation methods.
A simplified and unique index evaluating the total impact has been introduced [
13,
47,
48,
49]. The index is defined as the total costs induced by all life cycle effects of the transportation system related to a unit of transport work (pass-km, or tonne-km).
where
TPI is the total performance index,
TOPI is the total operation performance index,
TIPI total impact performance index,
TLCC/
TOLCC/
TILCC are the total/total operational/total impact LCC (life cycle cost) and the
TLCW is the total life cycle work [
50,
51].
The TOPI defines the operational cost of a given vehicle or given transportation mode, and is well known and applied by owners, operators, service providers. It is widely used in rail transport for the evaluation of mixed fleets to determine optimized transportation chains. Principally, the TIPI deals with the externalities. It is the index that can be used in impact assessment.
The
TIPI summarises all the impacts:
where
i = 1, 2, …
n defines the different groups of impacts. According to the transportation systems,
i = safety and security, system peculiarities, environmental impacts, system support, use of resources.
The
TIPI for a group of impacts can be determined as the sum of the different effects:
where
j = 1, 2, …
m depicts the subgroups of impacts, while
k = 1, 2,…
l defines the transport means,
q = 1, 2, …,
r represents the types or groups of the given transport system,
v = 1, 2, …,
u identifies the different forms of consequences,
N is the number of sub-sub-group elements contributors to the impact, like the number of vehicles defined by
q,
p is the parameter of the given types or group of system elements causes the investigated effects,
I is the impact indicator of the given system element,
o the outcomes/consequences of impact defined by
I or caused by the events, situations associated with the
I indicator,
c is the conversion coefficient for calculating the (external) cost, and work done,
W during the investigated period defined by
p. This means that if p is the parameter of a function given in the form of an average annual unit, then
W should also be related to one year. For instance, if
N defines the number of vehicles and
p is the annual average running of the vehicles, then the
W equals
p.
4. Results and Discussions
The shortly outlined methodologies were applied to the investigation of the possible future development of railway transport in Kenya. There following major results were found and formulated.
A series of tools were developed to support the policymakers of developing countries with a rail system stagnant for an extended period. The tool allows for the determination of more explicit effects of technological development on future strategic management. This methodology defines, develops and introduces the (i) general description (“Tetris”) of the strategic plan development; (ii) forecasting methodology for demand prediction; (iii) harmonization of the estimated economic cycles with strategic planning; (iv) total impact estimation and (v) harmonization of the legal framework and financing with strategic plans.
Applying the forecasting methodology (see
Figure 7), after sensitivity analysis of indicators, the major drivers defining the future demand in railway travel in developing countries were identified. These are: (i) Societal and cultural indicators represented by the total population, education level, and GINI index; (ii) economic indicators represented by changes in GDP; (iii) technological indicators represented by the volume of passenger-km and tons of goods-km transported and electric power consumed, Kwh per capita. It was found that the sensitivity of indicators in developing countries are different from developed countries. For example, the use of the enrolment of secondary education to show productivity instead of the percentage of education government expenditure as applied for developed countries to estimate research and development. While the GINI index is used for developed countries to estimate traveling money budgets analysing the competition between air and rail, the developing countries adopt the electric power consumed per capita indicator to evaluate readiness in technological advancements in the sector.
There are interesting features of the railway system operating in Kenya. The density of railways (km/1000 km2), business intensity, i.e., labour productivity as GDP per railway employment and length of the railways (km), are 20–50 times lower than the same indicators in developed countries. Kenya Railway has a single track and passes through the areas of high population and business activity, and its performance has declined due to a lack of investment by the government in the period 1977–2015. The market shares of rail transport reduced to approximately 2% of total freight, giving way to the dominance of road freight.
Figure 8 shows that the available historical input data results in a strength forecast situation. As can be seen, goods transported, and passenger carried dropped down nearly to zero. In such a situation, the use of dummies may change the figure. A dummy variable is an absence or presence (namely, it is 0 or 1) of some categorical effect that may change the trends or outcomes. Here, this particularly means the effects of developed and accepted railway modernization programs [
47,
48].
The forecast contains some effect of “art” (subjective factors of the forecasters). The developed and applied method has sensitivity to inadequate input data. There were huge series of simulations performed by the authors without possible identification of the problems caused by incorrect and/or incomplete data, hence the incorporation of relevant harmonization sections in the methodology.
Transport inputs are generally available in limited forms; this methodology has employed an analogy investigated by comparing the available historical series of indicators and the evaluation of the “demand size.’’ The demand generation value (Dgv), encompasses the following:
where are the coefficients defining the role of different factors at the regional-level rail trip,
is the Kronecker symbol defining the activity of the given factor (it is equal to 1 once the given factor characterises the regional developments and rail trips and zero if not),
the factors such as business, agriculture, industry, trade, science and technology, tourism, rail terminals (this last symbol equals to 1 once the region has medium or large size rail terminal(s)).
The drivers (such as GDP per capita, education etc.), are forecasted using the AR, that is, the autoregressive models and rail passenger forecasted using the non—linear ARX (autoregressive with exogenous terms), while the S-curve of innovation diffusion process is represented by the Gompertz curve.
Supporting people’s free movement (mobility) is represented by population, socio-economic determinants, which include the GDP per capita, electric power consumption per capita and demand-accessibility elements that may be related to freight and passenger volumes transported. Notably, despite Kenya having a high population and freight demand (tea, coffee, titanium ore, copper etc), the transport volumes data by rail are low and this may explain the Gompertz curve.
The harmonised estimation of demand for freight and passenger was made with the inclusion of dummies which, in this study, were identified as follows: (i) Standard railway gauge phase one implementation from Mombasa to Nairobi in the year 2018; (ii) Nairobi to Malaba with connectivity to Kisumu, Uganda and Rwanda (phase 2) opening to landlocked countries in the year 2021; (iii) the expansion of Nairobi Commuter Railway Services system that involves the upgrading of the commuter core system (existing commuter rail line) and construction of a railway line from Jomo Kenyatta International Airport (JKIA) to the Syokimau Railway Station in the year 2024.
Using Japan’s indicators, the forecast concept was validated as historical data compared with forecasted data. With regards to a sustainable transportation system, the impact analysis methodology developed was adapted to evaluate the TIPI environmental aspect of GHG emission factor depending on energy consumption following EN 16258 standards. During the adaptation of the methodology in the study, difficulties were identified in sourcing data that were directly-measured from the Kenya rail service, and thus, standard/default values were applied. This is not uncommon with transport-related data as they are sometimes unavailable or limited depending on the economy and society development, the related technology progress, and the accessibility and affordability.
By comparing a study published by Chester and Horvath [
52], our developed methodology agreed with their studies as there was a considerable difference between rail transport operated in different regions based on the source of energy consumed during a vehicle’s active operation (see
Figure 14,
Figure 15 and
Figure 16).
As seen in
Figure 17, the well-to-wheels (WTW) GHG emission factor, whereby the primary energy consumption and end energy consumption are accounted for, is relatively higher than expected to the tank-to-wheels (TTW) GHG emission factor, which only recorded all direct emissions from vehicle operation—end energy consumption.
The urban-diesel passenger train, well-to-wheels (WTW) GHG emission factor is relatively higher as expected than the tank-to-wheels (TTW), and the indices are much higher than those of the urban/diesel with biofuel proportions (
Figure 18).
The well-to-wheels (WTW) GHG emission factor that consists of direct and indirect emissions is much lower since the tank-to-wheels (TTW) GHG emission factor (direct emissions) is zero and the primary source of is renewable (
Figure 19). Kenya derives 87% of its total electricity from renewable sources; hydro and geothermal. Consequently, the adoption of electrically powered rail transport would lower the indirect emission factors by 81.8%.
5. Conclusions
Transport has a determining role in the economy and is in focus for strategic development, planning and actions, especially for a developing country. In countries of the Sub-Saharan Africa region, especially in Kenya, most railways are in bad condition and disrepair. The railway system requires exceptional support for its redevelopment. However, future developments are based on economical, societal and technological changes and depend on the vision and actions of the policymakers, strategic plans and actions and their harmonisation by legislation and financing support. It is a controllable stochastic process.
The effective functioning of the Kenyan rail system would play an exceptional role in creating the conditions for modernisation, the transition to an innovative path of development and sustainable growth of the nation and contribute to the creation of conditions for ensuring Kenya’s leadership in the regional economic system. However, not only the prospects for further socio-economic development depend on the state and performance of rail transport, but also the ability of a country to perform crucial functions such as ensuring the needs of citizens in transportation and creating conditions for equalising the social-economic development of the regions. Besides, the process of globalisation and change from traditional region economics relations propose the task for Kenya to rationally use the potential of its unique economic and geographical position.
This study adapted the technology identification, evaluation, and selection methodology to the Kenya Railways and demonstrated applicability at the micro and macro levels, specifically by investigating the development of a Hipot device and the introduction of hybrid tram-train into the systems. The developed automated Hipot device assists in tracking the motors’ insulation health, thereby reducing the I2R losses and promoting overall rail system efficiency and reliability. It is worth noting that in developing countries, these electro-mechanical components, such as motors, are imported and not manufactured locally, thus promoting/easing maintenance which provides considerable assistance. This paper investigated the effects of load change to demonstrate how to acquire 3 kV (high voltage testing) and how the circuit responds to breakdown. The evaluated train-tram suitability concept supports the rail sustainability and emission reduction and, at the same time, adapts to the constrained electrical production of the country. A morphological dot matrix was applied to illustrate the features available, which contributed to the train-tram hybrid being the ”most suitable system solution” for developing countries with respect to Kenya.
By analysing the interrelationship between the characteristics of railway transport and economic development and economic cycles, a gap between the developing and developed countries was identified and characterised. This gap has major effects on the economic cycles and the railway system development in developing countries, especially in Kenya.
A methodology for total life cycle evaluation (including cost, emission and safety) using a simplified unique total performance index (TPI), estimating the total impact which is given in the form of total costs induced by all life cycle effects of transportation system related to unit of transport work, passenger-km (pkm), or tonne-km (tkm), was developed and applied. The method used available data from data banks (statistical bureaus), data-mining, like railway track construction, and adapted simulated data from given regions, such as, the number and cost associated with fatalities. The impact analysis methodology developed was adapted to evaluate the TIPI environmental aspect of the GHG emission factor depending on energy consumption following EN 16258 standards for different type of passenger trains.
The forecasting methodology was developed and adapted to Kenya Railway systems to estimate the demand for future passengers’ travel and freight transportation. It deduced usability, and a possibility of bringing the performance and safety of transportation per the requirements of the population, economic level and the world standards based on the technological and technical development of railway transport.
The railway transport development can be affected significantly by the dynamics of prices in the fuel industry, electric power industry, lagging dynamics of technological advancements as well as a decline in the planned volume of a country’s investments. Regular monitoring and analysis of indicators, such as changes in GDP, dynamics of growth rates and population structure, changes in the structure and volume of transportation, changes in the structure rolling stock, changes in other modes of transport, depreciation of fixed assets of railway transport, the intensity of innovation and their level of use, etc., help develop a response mechanism and mitigation.
These series of tools can support the policy-makers of developing countries, making the effects of technological development on future strategic management more explicit and visible.


