1. Introduction
Dockless bikesharing programs in China have proven almost as problematic as they are popular. Unlike conventional bikesharing programs that require riders to pick up and return shared bikes at fixed docking stations, this new bikesharing programs are “dockless”, meaning that riders can return the bikes wherever they want. More importantly, they allow users to unlock a bike using their smartphones and the QR codes printed on the bikes. Dockless bikesharing programs swept over China and their convenience has made them gain considerable popularity among Chinese residents. A report shows that nearly seventy firms have in total put more than 16 million dockless shared bikes into service, and over 130 million users have registered for the service as of July 2017 [
1]. However, the convenience of dockless bikesharing has been accompanied by a wave of misbehavior: since riders can return bikes wherever they prefer, they park bikes haphazardly along streets, snarling traffic and cluttering sidewalks. The disorderly parked shared bikes seriously disrupt urban order. Especially in Chinese megacities, the disorderly parking along with the oversupply of dockless shared bikes also poses a great challenge to the limited urban space. Although dockless bikesharing has experienced an initial explosive growth and a subsequent industry reshuffle since emerging, the negative impacts associated with this new bikesharing remain. Today, amid growing traffic congestion and environmental concerns, bikesharing is on the agenda again for local governments. How to make the existing dockless bikesharing programs develop in a healthy and orderly manner is still an important issue for them.
To address the negative impacts associated with dockless bikesharing, local governments have started to require riders to return bikes to designated locations, or electronic-docking stations on the curb, while simultaneously limiting the number of dockless shared bikes throughout the city. It should be noted that although these docking stations are
electronic, they are not charging stations for electric shared bikes. They are referred to as geo-fenced areas, in that they use satellite positioning technology or Bluetooth technology to determine whether bikes are returned inside the designated areas and penalize riders when violations occur. The goal is to restore order in the cities and further facilitate the sustainable development of dockless bikesharing. For instance, the Beijing government has tested and deployed more than 1800 electronic-docking stations in pilot areas in February 2019 [
2]. There are also many stations in the planning and construction phases. Most of these electronic-docking stations in Beijing are virtual docking stations which are based on Beidou navigation satellite technology, a satellite positioning technology similar to GPS (e.g., shown as
Figure 1a), and only a very few of them are based on Bluetooth technology in which there are four Bluetooth devices on the ground and they are only deployed in the areas with less land and space (e.g., shown as
Figure 1b). Dockless shared bikes from eight operators in the service in Beijing can be parked in these electronic-docking stations [
2]. Promoting electronic-docking stations is also beneficial for operators to dispatch and maintain shared bikes. However, riders they are now forced to pick up and return their bikes at the dedicated locations, which tends to increase their access and egress times. This apparent drawback of electronic-docking stations may affect users’ choice behavior of dockless bikesharing and further may influence the development of this new bikesharing programs.
Table 1 summarizes the operation characteristics of the three kinds of bikesharing programs in Beijing: conventional bikesharing, dockless bikesharing and dockless bikesharing with electronic-docking stations.
This study probes the influence of electronic-docking stations on dockless bikesharing programs. Specifically, it aims to measure the residents’ preferences toward dockless bikesharing and electronic-docking stations. It also seeks to examine what service attributes riders are concerned more about. Knowing the preferences is helpful to local governments to understand how this new bikesharing system interacts with the other existing travel modes and understand how the introduction of electronic-docking stations affects residents’ use behavior of dockless bikesharing. This will further help them plan and deploy electronic-docking stations in a way that makes dockless bikesharing more convenient and orderly. In addition, answers to these questions are also beneficial for dockless bikesharing operators to enhance management and provide better service.
The majority of extant bikesharing studies on users’ travel behavior focus on conventional bikesharing programs and can be divided into two classes. The first class leverages operational or survey data to investigate spatial-temporal characteristics and influential factors. For example, Morency et al. [
3] proposed and illustrated indicators such as daily rates and spatial dispersion of stations visited to unveil the different behavior between regular members and occasional users in Montreal. Studies found that factors related to convenience are the major motivators for conventional bikesharing usage based on various programs in different countries [
4,
5,
6,
7]. Gebhart and Noland [
8] investigated the influence of weather conditions on conventional bikesharing usage in Washington, DC. Zhao et al. [
9] explored the differences of bikesharing trip chains between men and women, and between weekdays and weekends in Nanjing. The second class leverages survey data to make a comparison of “before and after” modal shift behavior by the changes of trip chains and probe influential factors of users’ travel behavior. For example, studies explored the impacts of conventional bikesharing programs on users’ modal shift behavior by investigating the changes of trip chains in China and North America [
10,
11,
12,
13]. Campbell et al. [
14] investigated how demographics, environmental conditions and trip distance influence residents’ behavior when switching to conventional bikesharing in Beijing. Studies usually use multinomial logit models, nested logit models, geospatial analysis and ordinal regression models to quantify the impacts. In addition, there are also studies probing the factors influencing cycling. For instance, Cervero et al. [
15] examined how the built environments influence cycling in Bogotá. These studies suggest that logit models are an effective way to evaluate users’ mode choice behavior in response to bikesharing by trip chains, and common influential factors can be considered including demographics, environmental conditions, weather conditions, trip characteristics, user perceptions and so on.
The existing research on dockless bikesharing-involved travel behavior mainly focuses on observing riders’ spatial-temporal characteristics. For instance, studies using operational data investigated riders’ spatial-temporal characteristics based on the specific dockless bikesharing programs in China [
16,
17]. Shen et al. [
18] collected GPS data and used spatial autoregressive models to examine the spatial-temporal patterns of bike usage based on a dockless bikesharing program in Singapore. They found that larger bike fleet size, easy access to public transportation, more supportive bicycle infrastructure, high land use mixtures and free-ride promotions are associated with higher usage of dockless shared bikes, while bad weather conditions negatively impact the usage. Yang et al. [
19] explored system dynamics of the operation process of a dockless bikesharing program in Beijing. Although there have been some studies referring to the interaction with other travel modes—for example, Luo et al. [
20] proposed multimodal connections between dockless bikesharing and ride-hailing and tested its feasibility in reducing user trip time and decreasing traffic congestion in New York—there exist no known studies examining riders’ choice behavior of dockless bikesharing. Besides, Shaheen and Cohen [
7] presented some curbspace management policies and practices in Seattle, Washington and Dallas, Texas for dockless bikesharing. They introduced Seattle’s dockless bikesharing parking policy that requires users to park shared bikes in designated parking zones or corrals, and Dallas’ ordinance that allows the city to establish parking zones for dockless shared bikes with paint and decals. The aims were also to address the disorderly parking issue. Although the aim and form of these curbspace management practices are similar to the electronic-docking stations we mentioned, research on riders’ preferences toward electronic-docking stations is still limited.
Much existing research on mode choice has shown that travel mode choice behavior can be investigated via trip chains or via stated preference experiments. The aforementioned literature on bikesharing shows that using trip chains, users’ mode choice behavior in response to bikesharing can be effectively evaluated. Many studies in response to other travel modes also have such a consensus, whether the datasets used are collected from a self-reported survey (e.g., conventional travel diary survey) or a passive survey (e.g., GPS/GIS-based survey). For example, Chen et al. [
21], estimating a two-equation simultaneous system, assessed the impact of density on mode choice decisions in home-based work tours in New York. Chen et al. [
22], using passive travel data collected in New York, developed GIS algorithms to detect travel modes automatically. Travel model choice research based on stated preference survey is also very common [
23,
24,
25,
26,
27]. For this research, which aims to understand the influence of electronic-docking stations on dockless bikesharing programs, a longitudinal study on trip chains would be more suitable to capture the changes in behaviors and attitudes before and after the implementation of electronic-docking stations. However, this was not feasible on account of the timeframe and financial budget of this research. Thus, we rely on a stated preference survey to investigate riders’ preferences toward bikesharing and electronic-docking stations. As there is a self-selection bias for any survey, we customize the respondents in the survey.
In their research, Chen et al. [
28] pointed out that three categories of factors including socio-demographics, alternative-related factors and the built environment have been consistently found important in nearly all types of travel behaviors. Studies show that individuals’ attitudes toward travel modes also play an important role in explaining travel behavior [
29,
30,
31,
32]. As noted above, studies also show that weather condition and trip distance all have important impacts on bikesharing or dockless bikesharing choice [
8,
14,
18]. In this research, as we seek to examine riders’ choice behavior of dockless bikesharing and the impact of electronic-docking stations on the choice behavior, we should make sure that there are substitution relationships between bikesharing and the other travel modes. Thus, we adopt their results and assume the trip distance, weather and built environment all suitable for cycling when we design the trip scenarios, and we also assume that individuals’ socioeconomic characteristics and attitudes can explain the choice behavior. Besides, we introduce bikesharing usage experiences and attitudes towards lifestyles to explain the choice behavior, which is very scarce in the literature.
We carried out a stated preference survey in Beijing, and developed a mixed logit and regression model to answer our research questions. This method is widely used in studies to investigate and elucidate individuals’ behavior heterogeneity [
33,
34,
35,
36]. Discrete choice models are the cornerstone model developed to predict travel mode choice behaviors. In this study, the mixed logit model and not the multinomial logit model is used for three reasons: (1) it relaxes the independence and identically distributed error structure of the multinomial logit model; (2) it relaxes the assumption of response homogeneity; and (3) with appropriate mixing distribution and choice variables it can approximate to any degree of accuracy [
37]. We set travel scenarios suitable for cycling and asked our respondents to choose their preferred travel mode from three options in each choice situation: (a) riding a dockless shared bike with “electronic-docking”, (b) riding a dockless shared bike without “electronic-docking”, and (c) choosing another travel mode. The attributes we considered in options (a) and (b) include the access time to find and unlock a bike, the rental fee and the egress time after locking the bike. Based on the survey data, we introduced alternative-specific constants into our mixed logit model to investigate riders’ preferences toward dockless bikesharing and electronic-docking stations. The mixed logit model is estimated using the Markov Chain Monte Carlo (MCMC)-based hierarchical Bayes approach and results show that there exists significant preference heterogeneity in riders’ choice behavior. The mixed logit model enables us to derive individual-level Value of Time (VOT) estimates and estimate regression models to uncover the sources of preference heterogeneity from riders’ socioeconomic characteristics, commute characteristics, bikesharing usage experiences and lifestyles.
This research is innovative in three aspects. First, it is the only known study investigating the impacts of electronic-docking stations on the mode choice behavior of dockless bikesharing. The behavioral insights obtained in the research can directly contribute to the literature of travel behavior dynamics. Second, we use bikesharing usage experiences and attitudes towards lifestyles, which are scarcely examined in the literature, to explain riders’ heterogeneous preferences, which is new to the literature. Third, the empirical results obtained in this study have potential implications in policy making and operation management, which will facilitate the sustainable development of dockless bikesharing programs.
The remainder of the paper is structured as follows.
Section 2 describes the design and data of the stated preference survey for this study.
Section 3 details the modeling method.
Section 4 presents our empirical results and discusses policy implications of the findings.
Section 5 summarizes this study and provides future research directions.
2. Survey and Data
We investigated riders’ preferences toward electronic-docking stations when they choose dockless bikesharing. A study based on operational data of one dockless bikesharing operator showed that in Beijing the durations of 52% of the rides are within 15 min and 82% of the rides are within 30 min [
16]. Another study based on the same operator found that in Wuhan the durations of 73% of the rides are within 15 min and 94% of the rides are within 30 min [
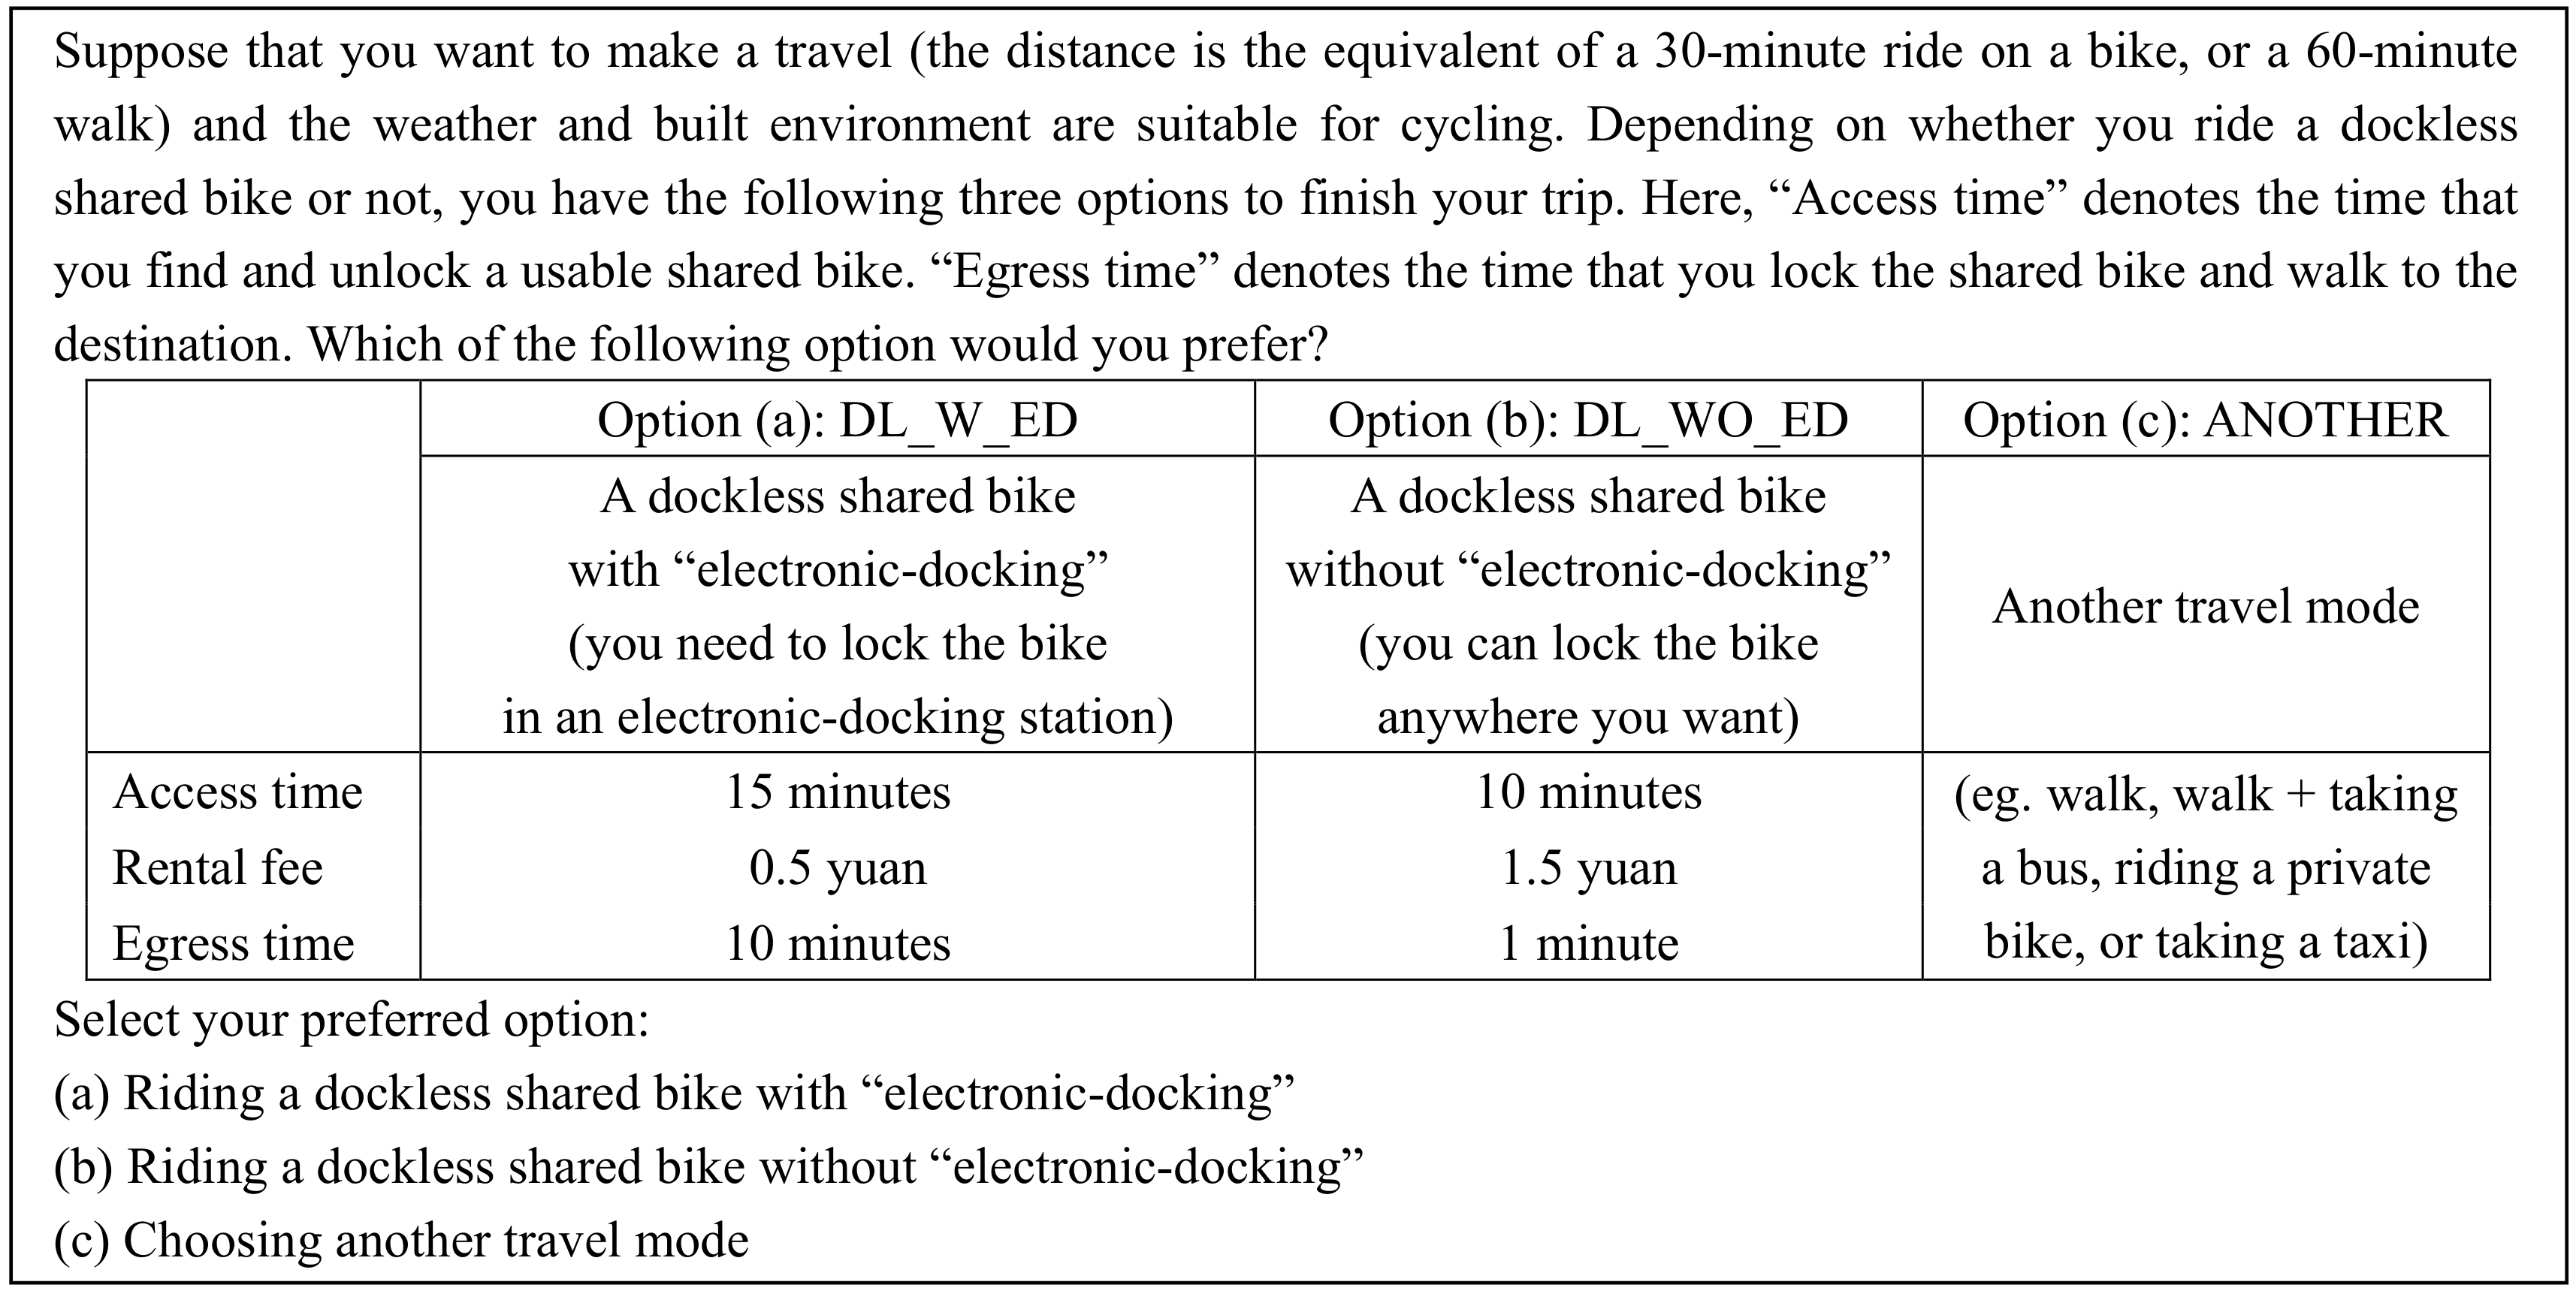
17]. This operator is one of the first to enter the market and had a high market share when conducting our survey. According to these studies, we set two travel scenarios: in Scenario 1, we supposed that the distance is the equivalent of a 15-min ride on a bike or a 30-min walk, and in Scenario 2, we supposed that the distance is the equivalent of a 30-min ride on a bike or a 60-min walk. We also supposed that the weather and built environment are suitable for cycling. Depending on whether residents ride the dockless shared bikes or not, they have the following three options to finish their trips in each scenario: riding a dockless shared bike with “electronic-docking” (DL_W_ED), riding a dockless shared bike without “electronic-docking” (DL_WO_ED), and choosing another travel mode (e.g., walk, walk + taking a bus, riding a private bike, or taking a taxi) (ANOTHER). The difference between DL_W_ED and DL_WO_ED is: DL_W_ED requires users to unlock and lock the bike at an electronic-docking station, while DL_WO_ED allows users to lock the bike anywhere they want. Guided by two online pilot surveys conducted in August 2017 with focus groups who have used dockless shared bikes, we finally chose the following three attributes to describe our travel modes: the access time to find and unlock a bike, the rental fee and the egress time after locking the bike.
The attributes and their levels used in our survey are presented in
Table 2. They are all specific to options (a) and (b). The attribute “Access time” measured in minute/minutes refers to the time it takes to find and unlock a usable shared bike. The attribute “Rental fee” denotes the price a user would pay to ride a shared bike. “Egress time”, measured in minute/minutes, refers to the time needed to lock the shared bike and walk to the destination. The rental fee is measured in yuan (yuan refers to Chinese yuan). When we administered the survey in 2017, 1 US dollar was worth about 6.54 Chinese yuan.
We design a labeled choice experiment for each scenario using the SAS macro proposed by Kuhfeld [
38]. In each labeled experiment, five 5-level attributes and one 2-level attribute would generate
hypothetical profiles. In order to avoid generating unrealistic and dominant alternatives, restrictions put on the design include: (1) DL_W_ED should not contain levels that are all greater than or equal to the levels for DL_WO_ED, or vice versa; (2) the rental fee and the sum of access time and egress time of DL_W_ED should not be all greater than or equal to these of DL_WO_ED, or vice versa; (3) the sum of access time and egress time should be less than 25 min in Scenario 1 and should be less than or equal to 30 min in Scenario 2; and (4) the egress time of DL_WO_ED should be less than or equal to that of DL_W_ED. We finally got 50 optimal profiles for each scenario. The D-efficiency of Scenario 1 is 84.9366 and that of Scenario 2 is 91.7848. We divided the 50 profiles of each scenario into ten blocks of five choice situations. Then the choice situations of two scenarios were combined together by the number of block, which forms each version of our questionnaire. That is, we had ten versions of the questionnaire in total and each version contained ten choice situations.
Figure 2 shows an example of a choice situation of Scenario 2. We conducted the survey in Chinese and randomly sent one version of our questionnaire to each respondent.
Our questionnaire contained four parts. Part 1 describes dockless bikesharing programs in China and the differences between the programs with and without electronic-docking stations. Part 2 asks screening questions on the respondent’s experiences of bike usage, including the questions about whether he/she can ride a bike, whether he/she has used a dockless shared bike/a dockless shared bike with “electronic-docking”/a conventional shared bike, and about the brands, frequency, duration time and cities of the usage of dockless shared bikes. Part 3 includes ten stated choice situations, that is, each scenario has five choice situations. Only this part has ten different versions. Part 4 contains questions on a rider’s socioeconomic characteristics, commute characteristics and bikesharing usage experiences. For example, questions asked include age, education, gender, monthly income, household size, vehicle ownership, commute status, cycling frequency, riding time of dockless shared bike and so on. We also asked some attitudinal questions on the service attributes of dockless shared bikes and on the lifestyles of a respondent, whose responses are measured with a 5-point Likert scale.
We carried out the final survey in September 2017 through a professional online survey company. Recall that in our design, we need each respondent to perform ten choice situations, each of which includes three options, and each attribute has a maximum of five levels. As a result, according to Orme [
39,
40], the minimum sample size can be calculated as
, and the preferred sample size needs to be
when we introduce interactions into models. Since the minimum order quantity per questionnaire is required to be 50, we then asked the company to collect 50 effective responses for each version of our questionnaire from the customized respondents who are at least 18 years old, reside in Beijing, can ride a bike and have used dockless shared bikes. Then individuals satisfying the former two characteristics in the respondent pool would randomly receive one version of our questionnaire. The screening questions “Can you ride a bike?” and ”Have you ever used a dockless shared bike”? in the questionnaire helped the survey company further screen out the respondents who are bike riders and riders of dockless shared bikes. Only the respondents who have passed the screening test needed to answer the remaining parts of the questionnaire. The respondent could not submit the answers until all questions have been answered. That is to say, the effective response rate of our survey was 100%. In total, we received 513 completed responses, which indicates that we obtained 5130 completed choice situations.
Table 3 presents the comparison of our sample and the census in Beijing and the profile of actual users of one operator. Comparing to the census, we found that our sample is younger and has better education than the census. For example, over 89% of the respondents in our sample were between 18 and 40 years old, while in the census only 58% of persons were in this age range. The percentage of persons who have an undergraduate degree or above was about 78% in our sample vs. 24% in the census. This is maybe due to the fact that younger and higher educated persons are usually familiar with internet-based surveys. The gender ratios in our sample and in the census were similar. The average monthly income of our respondents was nearly the same as the average monthly income of employed persons of 2017 in Beijing, only a bit lower. Note that average persons per household are 3.2 in our sample vs. 2.7 in the census. One possible reason is that we required respondents to report the number of family members living together, which includes persons with and without Beijing hukou, while only persons with Beijing hukou are reported in the census. Here, a person with Beijing hukou means that he or she is a registered resident in Beijing. In Chinese culture, when young couples have children, they always invite their parents to live together and look after their children. These parents living in Beijing do not always have Beijing hukou. The 2017 census reported that the ownership of private cars and motorcycles and powered bicycles per 100 urban households is 49.0 and 30.0, respectively. We noticed that those in our sample have slight differences. Besides, comparing to the profile of the users of the above-mentioned operator [
17], we found the same result that the main users of dockless shared bikes are between 20 and 40 years old. Note that we left a blank in the table when the data source is not available.
3. Modeling Method
We applied a two-step method to capture and explain riders’ preferences toward electronic-docking stations. That is, a mixed logit model was estimated first using the survey data to capture riders’ different preferences. Then regression models were estimated to explain riders’ preference heterogeneity. The method can be found in recent studies to explore the behavioral heterogeneity of respondents [
33,
35,
36]. We presented ten choice situations to each respondent, each of which contained three options. Except for the three attributes used in the choice experiment, we also introduced the two alternative-specific constants ASC
and ASC
into our mixed logit model, which denote riders’ preferences toward dockless bikesharing programs and electronic-docking stations, respectively. The utility depending on rider
n’s preferred option
j in choice situation
s can be written as:
where
is the vector of the attribute “Rental fee”;
is its coefficient vector, which is treated as fixed to make the calculation of VOT estimates easily; the vector
includes ASC
, ASC
, and the other two attributes in the choice experiment: “Access time” and “Egress time”;
is the vector of their random coefficients;
follows
i.i.d. Gumbel distribution and denotes the unobserved utility. We denote all of rider
n’s chosen options in the ten choice situations as
. Then his or her choice probability, conditional on
and
in all choice situations, is:
In our mixed logit model, we treat the coefficients of ASC
and ASC
as normally distributed. We assume the coefficients of “Access time” and “Egress time” to follow a log-normal distribution, and input negative values of these two attributes into our estimation procedure. That is,
is treated as normally or log-normally distributed in our model. Suppose that the density function of
is
, and its mean and variance are
and
, respectively. The unconditional choice probability can be specified as:
Our sample size is 513, so the likelihood function is:
Since often times the probability distribution functions for the coefficients do not have close forms, they need to be evaluated numerically through simulation. We used a MCMC-based hierarchical Bayes approach to estimate the parameters
and
, which offers two advantages over the maximum simulated likelihood (MSL) approach: (1) it does not require the maximization of the simulated likelihood function, which often fails to converge; and (2) it can attain consistency and efficiency under more relaxed conditions; for instance, it runs much faster when handling multivariate normal or log-normal coefficients [
41]. This approach assumes that
and
are independent, and the prior joint density function for them is
. Let
denote the choices of our sample, then the posterior distribution function of
and
satisfies:
To improve computational efficiency, the Gibbs sampler also treats
as a parameter and draws
,
,
and
from the joint posterior:
The detailed principle and procedure of the Gibbs sampler to simulate the mixed logit model can be found in Train [
41] and Yang et al. [
36]. The procedure iterates many times, and when it converges we can obtain the stationary distribution, that is, the joint posterior presented in Equation (
6). In this paper, we set the number of iterations to be 20,000 and the length of burn-in to be 10,000. After the burn-in, we evenly retained 1000 draws for
,
,
and
from its posterior. Then we can obtain their means and standard errors from the mean and standard deviation of these 1000 draws for each parameter. That is, for example, the mean of
for rider
n is:
where
is the value of the
r-th draw retained.
Based on Equation (
7), we can estimate the individual-specific value of time (VOT). Recall that, in our study, we have two time attributes: one is the “Access time” that denoted the time in which a rider finds and unlocks a usable shared bike, and the other is “Egress time” that denoted the time in which a rider locks the shared bike and walks to the destination. Therefore, we can derive two VOT estimates: VOT
denotes the extra rental fee a rider is willing to pay to save access time by one hour; and VOT
denotes the extra rental fee a rider is willing to pay to save egress time by one hour. Let
and
be the coefficients for the two time attributes in
, then rider
n’s VOT estimates are specified as:
From Equation (
7), we can also obtain rider
n’s coefficients of
and
, which enable us to build regression models to uncover preference variations across riders. We take individual-level
and
as dependent variables, and use rider
n’s characteristics and attitudes as independent variables, including socioeconomic characteristics, commute characteristics, bikesharing usage experiences and attitudes toward lifestyles. Therefore, the regression models can be expressed as:
where
k is specific to
and
;
denotes the intercept;
denotes the variables about rider
n’s characteristics and attitudes, and
is the vector of their coefficients; and
denotes the unobserved effects.
4. Results and Discussion
Before modeling riders’ preferences, we first present the descriptive statistics of riders’ attitudes toward service attributes of dockless bikesharing programs in
Section 4.1. Then a mixed logit model and regression models are developed to capture and elucidate riders’ preferences toward dockless bikesharing and electronic-docking stations. We also quantify riders’ VOTs of access and egress times. All estimation results are presented in
Section 4.2 and
Section 4.3. Finally, we discuss the policy implications of our findings from the perspectives of governments and operators in
Section 4.4.
4.1. Attitudes toward Service Attributes
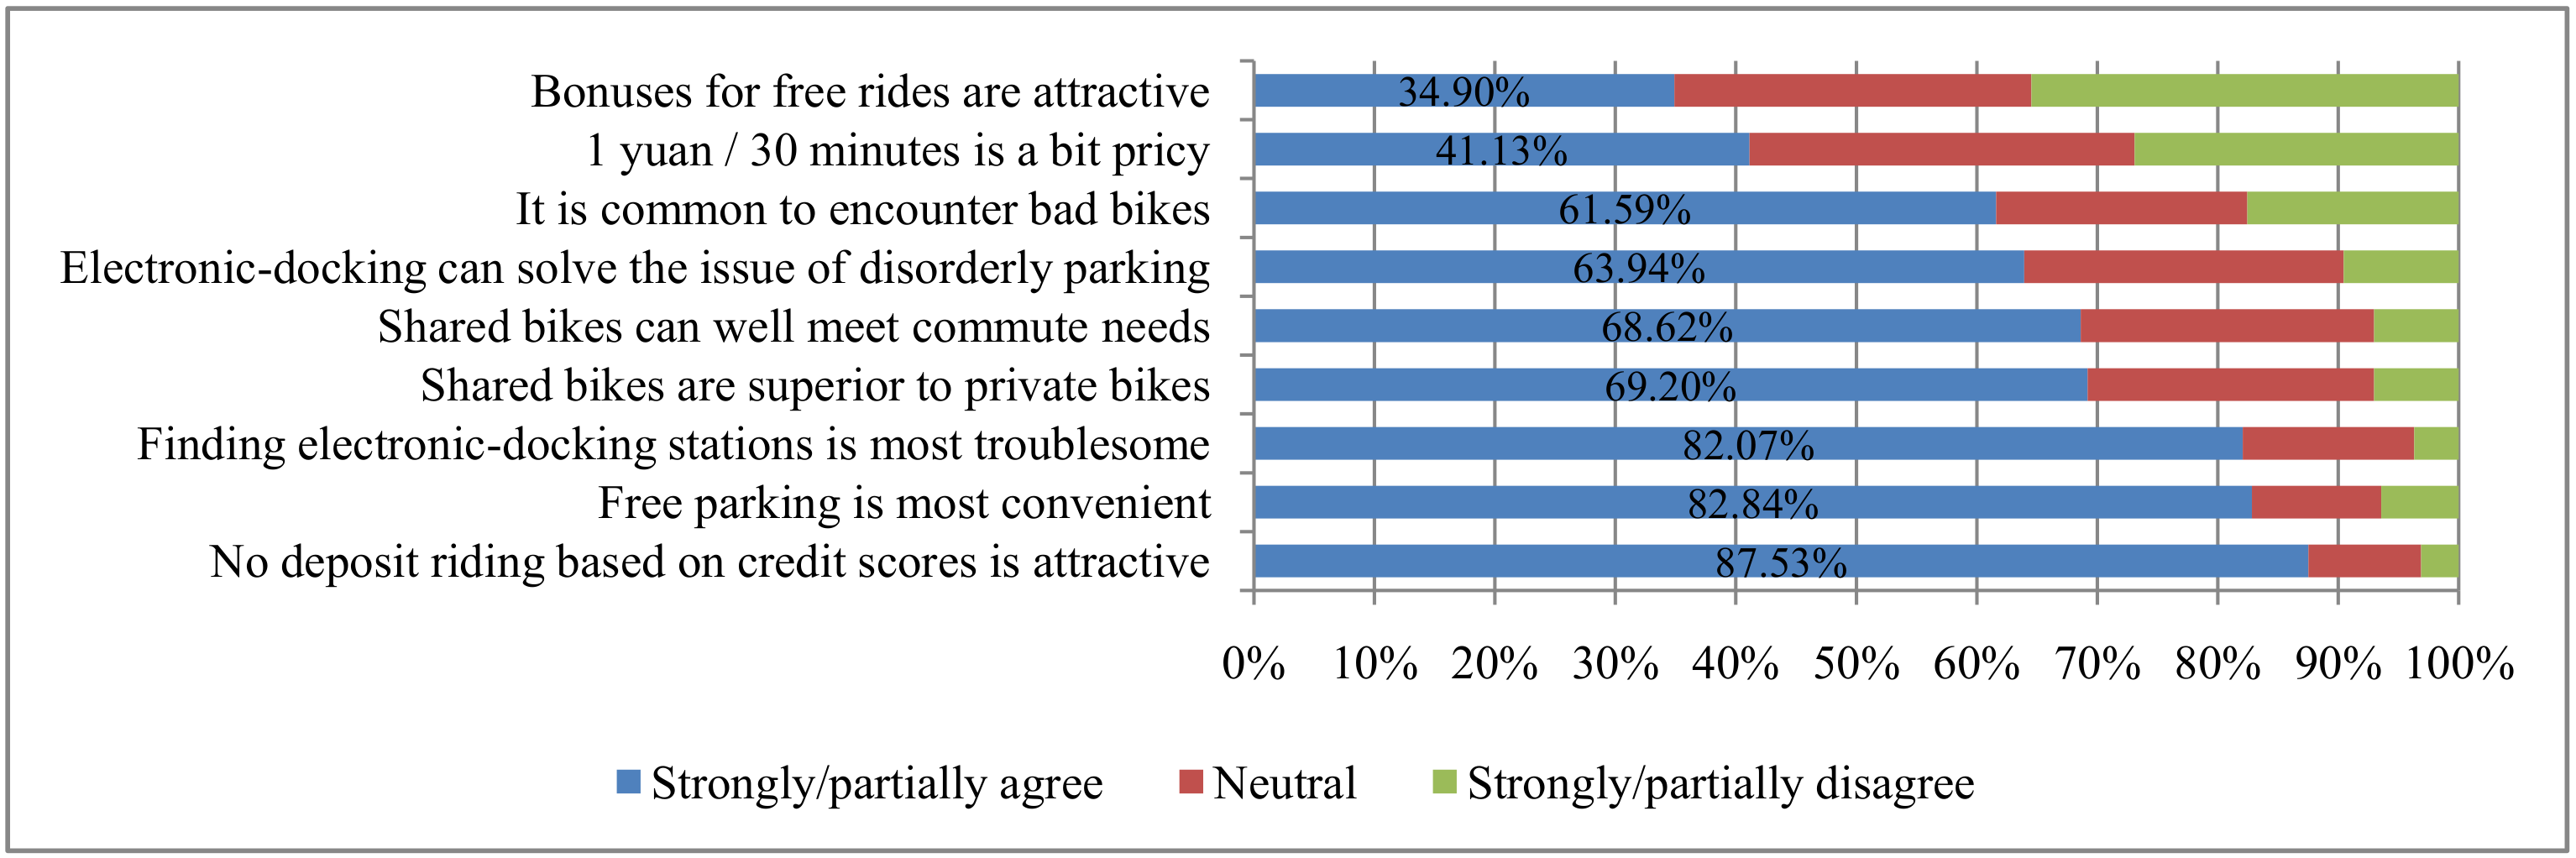
In our survey, we presented nine statements as indicators of riders’ attitudes toward service attributes of dockless bikesharing programs, each of which is measured on a 5-point Likert scale. The service attributes mainly include issues regarding parking, deposit, rental fee, the condition of shared bikes, and convenience and economy compared to private bikes. Riders’ ratings are meaningful.
Figure 3 shows that about 88% of respondents agreed that “No-deposit riding based on credit scores is attractive”, and over 82% of riders agreed that “Free parking is most convenient” and “Finding electronic-docking stations is most troublesome”, which suggest that riders pay more attention to the deposit and parking issues. The former finding implies that most riders have strong preference toward dockless bikesharing programs without deposit. Nowadays, more than one year after our survey was conducted, no-deposit riding based on ZHIMA credit scores tends to be a standard service provided by the existing operators of dockless bikesharing in China. The latter two findings imply that most riders favor the convenience of free parking but are also more sensitive to the density of electronic-docking stations if such a measure is implemented throughout the city. Besides, nearly 70% of riders confirmed the value of dockless shared bikes that can meet commute needs well and are superior to private bikes. It is worthy to note, that nearly 64% of riders agreed that “Electronic-docking can solve the issue of disorderly parking”, which seems to be a good sign for the promotion of electronic-docking stations. Over 61% of riders agreed that “It is common to encounter bad bikes”, which indicates that riders are also sensitive to the condition of shared bikes. The result reminds operators to strengthen the maintenance and repair of shared bikes. In addition, only 35% of riders agreed that “Bonuses for free rides are attractive” and only 41% of riders thought that “1 yuan/30 min is a bit pricy”, which implies that most riders are somewhat indifferent to the rental fee of 1–2 yuan for each ride. We summarize the above results as follows:
FINDING 1: Considering riders’ attitudes toward service attributes of dockless bikesharing programs, we find that most riders have a strong preference toward dockless bikesharing programs without deposit. They are sensitive to the density of electronic-docking stations and the condition of shared bikes, but somewhat indifferent to the rental fee of 1–2 yuan for each ride.
4.2. The Mixed Logit Model
We examined riders’ preferences toward dockless bikesharing and electronic-docking stations and investigated how electronic-docking stations influence riders’ choice behavior of this new bikesharing using the mixed logit model. The parameter estimates of our model are reported in
Table 4. Recall that our model contains fixed, normal random and log-normal random coefficients. For each normal random coefficient, we present its mean and standard deviation; and for each log-normal random coefficient, we present the mean and standard deviation of ln(coefficient). Results show that all parameters are significant at the 1% level and have expected signs. Among them, significant standard deviations suggest that strong preference heterogeneity exists in riders’ preferences toward dockless bikesharing programs and electronic-docking stations. A positive mean of
suggests that for a trip within a distance equivalent to a 30-min ride on a bike, riders in Beijing prefer riding a dockless shared bike to other travel modes such as walking, walking and taking a bus, riding a private bike or taking a taxi. A negative mean of
indicates that riders prefer dockless bikesharing programs without “electronic-docking” to ones with “electronic-docking” under the above-mentioned trip scenario. The calculated means of the coefficients for “Access time” and “Egress time” are −0.2219 and −0.1977, respectively. Negative means of coefficients for “Access time”, “Egress time” and “Rental fee” indicate that riders dislike a longer access time or egress time and a higher rental fee. We then simulated choice probabilities based on individual-specific coefficients with base values 5, 5 and 1 for these three variables, respectively.
Table 5 presents the predicted percentage changes of each option. Results show that the choice probability of riding a dockless shared bike drops by about 9.3% when access time increases by 5 min (equivalent to walking distance increases by 500 m), drops about 8.4% when egress time increases by 5 min and drops by about 4.4% when rental fee increases by 0.5 yuan. We conclude the above results as follows:
FINDING 2: For a travel within a distance equivalent to a 30 min ride on a bike, we find that riders prefer riding a dockless shared bike to other travel modes such as walking, walking and taking a bus, riding a private bike or taking a taxi. We also find that they prefer dockless bikesharing programs without ”electronic-docking” to ones with ”electronic-docking”. In addition, we find that the choice probability of riding a dockless shared bike drops by about 8%–9% when access or egress time increase by 5 min, and drops by about 4% when the rental fee increases by 0.5 yuan.
Individual-level coefficients for ASC and ASC enable us to get further information from our mixed logit model. Using them, we can calculate the following probabilities: and . The first probability suggests that in Beijing, about 99% of individuals prefer dockless shared bikes to other travel modes. The value is close to 100%, from a policy perspective, which implies that individuals in Beijing have a unanimous acceptance that dockless shared bikes can serve as a form of public transportation. Beijing is suitable to continue promoting dockless bikesharing programs. The second probability means that when launching electronic-docking stations, the fraction of individuals who prefer dockless shared bikes has declined to 88%. That is, “electronic-docking” reduces by about 12% () of individuals who prefer dockless shared bikes. The above results are concluded as follows:
FINDING 3: The fraction of riders interested in dockless bikesharing programs is close to 100%, which implies that from the government’s perspective, Beijing is suitable to continue to promote dockless bikesharing programs; while launching electronic-docking stations reduces this number to 88%.
Table 6 presents the definitions and estimates of individual-level VOT measures. As both access time and egress time are related to the density of electronic-docking stations, the VOT estimates can perhaps help operators determine the appropriate rental fee according to the distribution of these stations. For example, the mean of VOT
is 13.6788 yuan, indicating that riders are willing to pay about 13.7 yuan to save access time by one hour. That is to say, rental fees can be increased by 1.1 yuan if access time can be saved by 5 min. Similarly, rental fees can be increased by 1.0 yuan if egress time can be saved by 5 min. In 2017, the hourly wage rate of Beijing employed persons was 40.0 yuan (calculated according to the data from the 2018 Beijing Statistics Yearbook). Our estimate of VOT
is about
= 34% of the hourly wage rate, and similarly, the estimate of VOT
is about 31% of the hourly wage rate. Many urban transportation studies assume that “value of travel time for cars or buses” equals 40% of the hourly wage rate [
42]. Our results are less than the assumption, but for bikesharing they are reasonable. We then have the following conclusion:
FINDING 4: Riders are willing to pay about 12.2–13.7 yuan to shorten access or egress time by one hour, which is about 31–34% of the hourly wage rate of Beijing in 2017.
4.3. The Regression Models
In this section, we build regression models to elucidate the preference heterogeneity revealed in
Section 4.2. The independent variables finally used in our models are presented in
Table 7 and they can be classified into four groups. The first group relates to riders’ socioeconomic characteristics, including monthly income and age. Other socioeconomic variables such as education, gender, household size and vehicle ownership were eliminated from the final models, as we find that they have little bearing on both dependent variables through many modeling tests. The second group corresponds to riders’ commute characteristics, such as walk time to the nearest public transit stations, commonly used commute tools, commute time by the commonly used commute tool and cycling frequency before dockless bikesharing. Please note that each variable about commute time within 30 min by the commonly used commute tool is the interaction of the dummy of commute time within 30 min and the dummy of corresponding commute tool. The third group describes riders’ bikesharing usage experiences, which tell us whether they have used dockless shared bikes with “electronic-docking” or conventional shared bikes, whether they have used bikes from the three brand leaders in the Beijing dockless bikesharing market at the time when our survey was conducted, and the usual riding time of dockless shared bikes. The last group of variables is about riders’ attitudes toward their lifestyles, which tells us whether they often shop online, watch TV programs or engage in physical exercise. Note that we report the percentage of each variable in the sample, except for the variable “Walk time to stations”, for which its mean and standard deviation are reported.
Table 8 reports the estimation results of regression models for individual-level
and
. The
for each model is 0.1376 and 0.1180, respectively. This indicates that each model can separately reveal 13.76% and 11.80%, respectively, of riders’ corresponding preference variations. For the regression model of
, we found that age and income have no significant effect on their preferences toward dockless bikesharing, which aligns with the finding of previous research that user demographics do not strongly bear on bikesharing choice [
14]. In relation to riders’ commute characteristics, positive and significant “Walk time to stations” indicates that riders who live or work away from the nearest public transit stations are interested in dockless bikesharing programs, which shows that dockless bikesharing has great potential in resolving the last mile problem of urban transit. Studies show that distance from a conventional bikesharing station within 250 m is an important factor of bikesharing membership [
6,
43]. Dockless bikesharing operators can deploy dockless shared bikes within 250 m from the places of residence and work to induce more use from these riders. The interaction “Commute time 30-by bus or metro” is negative but not significant, which indicates that riders who go to work by bus or metro within 30 min seem not to prefer dockless bikesharing programs; while the significant and negative interaction of “Commute time 30-by car” suggests that subjects who drive to work within 30 min do not prefer this new bikesharing, which implies that dockless shared bikes cannot serve as substitutes for cars for these commuters. Besides, the coefficient of “Cycling frequency 1–6” is significant at the 1% level and has a positive sign, indicating that riders who always rode a bike 1–6 times a week before dockless bikesharing are most likely to choose dockless shared bikes to substitute their private bikes for their bike trips. A possible reason is that as weekly cycling frequency increases, the increased rental cost and inconvenience compared with private bikes may reduce riders’ choices of dockless shared bikes. With regard to bikesharing usage experiences, the negative value of “Dockless bikesharing with electronic-docking” indicates that experiences of electronic-docking stations may have a negative influence on riders’ preferences toward dockless bikesharing, although the result is not significant. While positive and significant “Conventional bikesharing” suggests riders who have used bikes of conventional bikesharing prefer this new bikesharing, which is consistent with our expectation. In addition, results show that “Dockless bikesharing brand leader 1” and “Dockless bikesharing brand leader 3” positively and significantly affect riders’ preferences toward dockless bikesharing, which also implies that riders had a better riding experience of these two brands when our survey was conducted. Finally, we find that riders’ attitudes toward lifestyle also have an effect on the preference. Riders who often watch TV programs or engage in physical exercise significantly prefer dockless bikesharing programs, suggesting that for operators advertising during TV programs or through video websites it is absolutely necessary to promote their programs. We conclude the above results as follows:
FINDING 5: Riders interested in dockless bikesharing programs include those who live or work away from public transit stations, those whose weekly cycling frequency was 1–6 times before dockless bikesharing, those who are users of conventional bikesharing, those who have good experiences with dockless bikesharing, those who often watch TV programs and those who often engage in physical exercise. Age and income have no significant effect on their preferences toward dockless bikesharing.
For the regression model of , the coefficient for “Age 18–26” is negative and significant at the 5% level, indicating that riders at the age of 18–26 years old care about the introduction of electronic-docking stations. One possible explanation is that riders in this age group do not have much patience to find electronic-docking stations. The coefficient for “Income high” is negative and significant at the 1% level, showing that riders with a monthly income greater than 8000 yuan are also concerned about the issue. This is probably because persons with high income are time-sensitive and do not want to spend much time finding electronic-docking stations and walk to the destination. In relation to riders’ commute characteristics, the positive and significant interaction “Commute time 30-by walk” suggests that riders who walk to work within 30 min are indifferent to the introduction of electronic-docking stations. The possible reason is that riders who often walk are insensitive to the access time and egress time of shared bikes; while the negative and significant interaction “Commute time 30-by bus or metro” implies that riders who go to work by bus or metro within 30 min care much about electronic-docking stations. This is likely due to the reason that they mostly expect dockless shared bikes to serve as a first-mile and last mile facilitator, which would be thought not as convenient as expected if the density of electronic-docking stations was not appropriate. Besides, the significant and positive “Cycling frequency 1–6” suggests that individuals whose weekly cycling frequency was 1–6 times before dockless bikesharing are much more likely to accept electronic-docking stations. After all, individuals riding a private bike also need to consider where to park, but they would lose patience to find electronic-docking stations as the weekly cycling frequency increases. Considering the effect of bikesharing usage experiences, positive and significant “Conventional bikesharing”, “Dockless bikesharing brand leader 1” and “Dockless bikesharing brand leader 2” indicate that riders who have used conventional shared bikes and riders who have used dockless shared bikes of brand leader 1 and brand leader 2 are all indifferent to the introduction of electronic-docking stations. The possible reason for the former result is that conventional bikesharing users still consider electronic-docking stations as more convenient than fixed docking stations, although both refer to the designated parking areas. The latter two results are due to the fact that these two brand leaders have tried such a measure to manage their bikes when our survey was conducted. The policy conducted in the actual market would enhance public acceptance of it. Besides, positive and significant “Riding time of dockless shared bikes 30+” means that riders who always ride dockless shared bikes 30 min and above also do not care about electronic-docking stations. A possible explanation is that they are insensitive to the access time and egress time of dockless shared bikes with “electronic-docking”. Finally, we find that the lifestyle “Often shops online” has a positive and significant bearing on riders’ preferences toward electronic-docking stations. The result suggests that operators can strengthen cooperation with high-traffic e-commerce platforms and payment platforms such as “JD.COM”, “Taobao.com”, “WeChat Pay” and “ALIPAY” to promote dockless bikesharing programs. We conclude the above results into the following finding:
FINDING 6: Riders indifferent to the introduction of electronic-docking stations include those who are above 26 years old, those with monthly income less than or equal to 8000 yuan, those who are users of conventional bikesharing and those who often shop online; in addition, those who walk to work within 30 min, those whose weekly cycling frequency was 1–6 times before dockless bikesharing, those who often ride a dockless shared bike 30 min and above and those who have prior experiences with electronic-docking are also indifferent to the introduction of electronic-docking stations.
4.4. Discussion
The findings explored in the study can reveal riders’ service requirements of dockless bikesharing and uncover riders’ preferences toward the new bikesharing and electronic-docking stations, which have different policy implications for governments and operators of dockless bikesharing programs. For governments, they have great implications for leading dockless bikesharing programs to develop in a healthy and orderly way. For operators, they are helpful to adjust operation strategy and improve service quality.
4.4.1. Implications from the Perspective Of Governments
Our research findings can help the Beijing government make sustainable efforts to promote electronic-docking stations to strengthen management of the existing dockless bikesharing programs. For example, FINDING 3 shows that riders in Beijing have unanimous preferences toward dockless bikesharing in our mentioned trip. Beijing is suitable to continue to promote the programs. However, FINDING 3 also shows that launching electronic-docking stations will reduce the fraction of riders interested in such programs by 12%. Additionally, the choice probability of riding a dockless shared bike will drop as access or egress times and rental fee increase (FINDING 2). More attention should be paid to make dockless bikesharing with electronic-docking stations be perceived as equivalent to dockless bikesharing without electronic-docking stations. A viable option for the government is to plan and deploy more electronic-docking stations, since, needless to say, operators would not agree on permanent price cuts. Besides, FINDING 1 shows that riders are sensitive to the density of electronic-docking stations, and FINDING 6 suggests that riders who have prior experiences with electronic-docking are more indifferent to the introduction of electronic-docking stations. These two findings perhaps also can result in this option. The Beijing government needs to continue to promote electronic-docking stations, so as to address the disorderly parking issue of dockless bikesharing and simultaneously improve public acceptance of this policy.
Our study can also serve as a reference for other cities to guide and standardize the development of dockless bikesharing. No matter for the cities that have experienced the similar negative impacts associated with dockless bikesharing as Beijing has, or for the cities where dockless bikesharing programs is planned, governments need to test electronic-docking stations to regulate riders’ present or future parking behavior of dockless shared bikes. However, for the latter cities, residents may feel that there is no difference between dockless bikesharing programs and the conventional ones if electronic-docking stations are enforced from the very beginning. However, we find that conventional bikesharing users are indifferent to the introduction of electronic-docking stations (FINDING 6), which implies that they still consider electronic-docking stations more convenient than fixed docking stations of conventional bikesharing. Thus, electronic-docking stations or at least designated parking areas are worth a try to guide this new bikesharing to develop in a healthy and orderly way at the very beginning in the latter cities.
4.4.2. Implications from the Perspective of Operators
Our findings can help operators adjust their operation strategy. For instance, FINDING 1 indicates that most riders have a strong preference toward bikesharing programs without deposit. Although a new draft regulation issued by the Ministry of Transport of the People’s Republic of China also recommends that operators not collect deposits [
44], and no-deposit riding tends to be a new popularity since our survey was conducted, the deposit waiver is still up for debate. For cities like Beijing, where the market of dockless bikesharing has been saturated, a deposit waiver could hardly bring strong user growth, while for the newly entered cities, it can indeed increase market share to a certain extent. However, there is no doubt that a deposit waiver will increase management costs for operators, which will then result in the rise of rental fees of dockless bikesharing. Thus, operators need to determine when, where and how long to waive the deposit when they decide to use this strategy. In addition, FINDING 1 shows that riders are somewhat indifferent to the rental fee of 1–2 yuan for each ride. If operators in Beijing decide to adjust their price strategy, the VOT estimates in FINDING 4 can perhaps help them determine the appropriate rental fee according to the distribution of electronic-docking stations. That is, the rental fee can be increased by 0.20 yuan as access or egress time is saved by 1 min.
Our results are beneficial for operators to improve service quality. For example, FINDING 1 shows that riders are sensitive to the condition of shared bikes, which reminds operators to raise the maintenance level of shared bikes. We also find that riders who have good riding experiences are more interested in dockless bikesharing (FINDING 5). Providing comfortable bikes is vital for operators’ survival and development.
Our findings can also be used to conduct targeted promotion. For instance, we find that individuals who live or work away from public transit stations prefer dockless shared bikes (FINDING 5). Operators can deploy dockless shared bikes near their residence or workplaces to induce more use from these persons. In addition, we find that riders who often watch TV programs are interested in dockelss bikesharing (FINDING 5) and riders who often shop online are indifferent to the introduction of electronic-docking stations (FINDING 6). Targeted marketing campaigns can thus be carried out. Operators can advertise during TV programs or through video websites to promote dockless bikesharing programs. They can also strengthen cooperation with high-traffic e-commerce platforms and payment platforms such as “JD.COM”, “Taobao.com”, “WeChat Pay” and “ALIPAY” to develop joint promotion strategies.
5. Conclusions and Future Research Directions
In this study, we explored the influence of electronic-docking stations on dockless bikesharing programs, which have been launched by governments to address the disorderly parking issue of dockless shared bikes. Based on a stated preference survey carried out in Beijing, we built a mixed logit model and regression models to investigate and elucidate riders’ heterogeneous preferences toward dockless bikesharing programs and electronic-docking stations. The mixed logit model was estimated using the MCMC-based hierarchical Bayes procedure, which enables us to quantify riders’ values of access time and egress time. We found that: (1) riders have a strong preference toward dockless bikesharing programs without deposit. They are sensitive to the density of electronic-docking stations and the condition of shared bikes, but somewhat indifferent to the rental fee of 1–2 yuan for each ride; (2) the choice probability of riding a dockless shared bike drops by about 8–9% when access or egress time increase by 5 min, and drops by about 4% when the rental fee increases by 0.5 yuan; (3) the fraction of riders interested in dockless bikesharing programs is close to 100%, while launching electronic-docking stations reduces this number to 88%; (4) riders are willing to pay about 12.2–13.7 yuan to shorten access or egress time by one hour; (5) riders interested in dockless bikesharing programs include those who live or work away from public transit stations, those who are users of conventional bikesharing, those who have good experiences with dockless bikesharing, those who often watch TV programs and those who often engage in physical exercise; and (6) riders indifferent to the introduction of electronic-docking stations include those who are above 26 years old, those with a monthly income of less than or equal to 8000 yuan, those who are users of conventional bikesharing, those who often shop online, those who walk to work within 30 min, those whose weekly cycling frequency was 1–6 times before dockless bikesharing, those who often ride a dockless shared bike for 30 min or above and those who have prior experiences with electronic-docking.
These empirical results not only have potential implications for policy-making and operation management, but also have some contributions to the literature. The behavioral insights from these results directly contribute to the literature of travel behavior dynamics. For instance, many urban transportation studies assume that the ”value of travel time for cars or buses” equals 40% of the hourly wage rate [
42]. Although the results that we quantified of riders’ values of access and egress times are less than the assumption, for bikesharing they are reasonable. In addition, we find that to a certain extent, bikesharing usage experiences and attitudes towards lifestyles can explain riders’ heterogeneous preferences, which is new to the literature.
Since the research is conducted only based on survey data collected from Beijing, whether the findings in our research are generalizable to other cities in China or abroad is an open question. We believe they can be generalized, as discussed in
Section 4.4, although not everywhere. Thus, it would be interesting to conduct similar research in other cities to test if this is the case. This study can inform researchers of what to explore and perhaps enable improvements in future studies. As noted in the paper, researchers can also take a longitudinal approach. It would also be interesting to focus on how to determine the appropriate density for electronic-docking stations. Electronic-docking stations can also raise equity and public rights-of-way concerns. How to maximize the social and environmental benefits of electronic-docking stations is also an interesting issue.


