Article

Encouraging Organic Food Consumption through Visualization of Personal Shopping Data

1
Department of Sustainable Development, Environmental Sciences and Engineering, KTH Royal Institute of Technology, SE-100 44 Stockholm, Sweden
2
Department of Computer Science and Media Technology, Linnaeus University, SE-351 95 Växjö, Sweden
3
School of Engineering Science, University of Skövde, SE-541 28 Skövde, Sweden
*
Author to whom correspondence should be addressed.
Sustainability 2020, 12(9), 3599; https://doi.org/10.3390/su12093599
Submission received: 28 March 2020 / Revised: 22 April 2020 / Accepted: 23 April 2020 / Published: 29 April 2020
(This article belongs to the Section Social Ecology and Sustainability)

Abstract

:
Although food retailers have embraced organic certified food products as a way to reduce their environmental loading, organic sales only make up a small proportion of total sales worldwide. Most consumers have positive attitudes towards organic food, but attitudes are not reflected in behaviour. This article addresses consumers’ attitude–behaviour gap regarding their purchase of organic food and reports on how visualization of personal shopping data may encourage them to buy more organic food. Through the design of the visualization tool, the EcoPanel, and through an empirical study of its use, we provide evidence on the potential of the tool to promote sustainable food shopping practices. Of 65 users that tested the EcoPanel for five months, in-depth interviews were made with nine of these. The test users increased their purchase of organic food by 23%. The informants used the EcoPanel to reflect on their shopping behaviour and to increase their organic shopping. We conclude that the visualization of food purchases stimulates critical reflection and the formation of new food shopping practices. This implies that food retailers may increase sales of organic food through using a visualization tool available for their customers. In this way, these retailers may decrease their environmental impact.

1. Introduction

The global food system is in dear need of a transition to sustainable production and consumption practices. Our present food system holds far-reaching problems, from the degradation of ecosystems and contribution to climate change, to fragility of farmer livelihoods and persistence of hunger and diet-related diseases [1]. Organic agriculture emerged as a grassroots movement during the last century as a reaction to environmentally degrading and socially unjust food systems [2]. Since then, it has developed into production and processing practices based on standards and certification, embraced by policy-makers as one way to introduce environmentally benign production methods [3]. While critics question that organic agriculture is always more sustainable than conventional farming, e.g., [4], and while other scholars argue that organic agriculture is developing into being only a slightly modified version of conventional farming [5], there is ample evidence that organic agriculture delivers in terms of, e.g., increased on-farm biodiversity [6], mitigation of and adaption to climate change [7], improved soil fertility [8], and reduced exposure to pesticides [9]. Since approximately 80% of environmental loading or climate impact in the food system happens in the production phase [10], and since organic agriculture is a specific method that can be traced and labelled, food retailers have embraced organic certified food products as a way to reduce their own environmental loading [11]. However, although the number of organic products sold is increasing, organic sales only make up 9.6% of total sales in Sweden [12]. Nevertheless, this is high compared to most other countries. Only Denmark has a higher proportion of organic sales [12]. The grocery chain analyzed in this paper pioneered organic sales in supermarkets in Sweden and has the highest percentage of organic sales (10%), and holds 18% of the retail market value [12].
Most consumers have positive attitudes towards organic food, but attitudes are not always reflected in behaviour [13,14]. In an accompanied shopping interview study of 10 young consumers with positive attitudes towards organic food, the researchers observed that, although high price of organic products was a main obstacle, this was only temporary. The informants argued that they would postpone organic purchases to a later stage in life when they presumably would have more money to spend [14]. This article addresses consumers’ attitude–behaviour gap regarding their purchase of organic food. Our study explores the role of feedback in the form of visualization of personal shopping data for overcoming the gap. Our focus is on the formation of sustainable food shopping practices and how a visualization of food purchases may elicit reflection and possible behaviour change among consumers. Before we describe our research study and discuss its results, we summarize some relevant work on practices involving the purchase of organic food, and on visualizations to promote sustainable practices.

1.1. Forming Practices Involving Purchase of Organic Food

Practices are generally conceived as “embodied, materially mediated arrays of human activity centrally organized around shared practical understanding” [15]. Applying a social practice theory framework helps us to understand how different dimensions in society contribute to both the stability of practices and the emergence of new practices. Using this framework also guides us in identifying and locating where changes are needed to facilitate the formation of sustainable consumption practices and for these to become normalized. Theorists usually refer to 3–5 dimensions in conceptualizing practice entities. For instance, Shove and colleagues [16] use a framework consisting of materials (e.g., things, technologies, infrastructures, and stuff of which objects are made), competences (e.g., skills, know-how and techniques), and meanings (e.g., symbolic meanings, ideas and aspirations). Sahakian and Wilhite [17] challenge social practice theory in that it so far has emphasized the theoretical and analytical aspects. In order to generate change and transitions to a more sustainable society, though, there is also a need to address the practical implications of the framework. Actual changes occur when more than one dimension provides an opening—when “agency is distributed across people, things and social contexts” [17] (p. 25). Also, the difficulty in changing habits depends on how deeply rooted the habits are in relation to these three dimensions. In the present article, we address the formation of sustainable food practices in targeting mainly the dimensions of competences and materials.
The purpose is to study how visualization of personal shopping data may elicit reflection among consumers and, thus, potentially play a role in the formation of sustainable food shopping practices. The article describes the use of visualization as an intervention in people’s food shopping, and as an approach to encourage their purchase of organic food. The major value of the article lies in its twofold focus of both visualizing shopping data made available for customers of a leading grocery chain, and the study of how these data were used for reflecting over organic shopping behaviour.

1.2. Motives for Buying Organic Food

Several factors contribute to consumers’ motivation to buy organic food. There is a large body of literature concerned with trying to pinpoint the reasons why consumers choose organic food. A recent review of factors affecting the change in consumer behaviour towards organic food concludes that health-conscious consumers show a growing preference for organic food over the conventionally grown food [18]. In fact, their review shows that health consciousness has been considered the best predictor of consumer attitude and behaviour towards organic food. Environmental concern is found to be another motivating factor. Other reviews have come to similar conclusions, e.g., [19]. Food safety issues and animal welfare were also prominent themes. The two most important deterrents from buying organics are high prices and lack of products to buy [14,19,20]. Other deterrents are scepticism of certification, insufficient marketing, cosmetic defects, and satisfaction with conventional food choices [19]. Welsch and Kühling [21] found that consumers are more likely to buy organic food if people they compare themselves with also do this, illustrating the importance of social norms and the dimension of social context for the purchase of organic food. This finding is consistent with other results on social communication of other people’s behaviour for encouraging pro-environmental behaviour [22].
In terms of actual organic shopping behaviour, fewer studies are available. In an Australian study, familiarity with organic products was the only variable found to have a significant relationship with organic purchase behaviour, while health consciousness, quality and perceived norms influenced purchase intentions [23]. In a qualitative study, Hjelmar [24] interviewed 16 Danish consumers in depth about their actual food purchasing behaviour. He divided organic consumers into two groups: the convenience shoppers and the reflexive shoppers. Important for the convenience shoppers were pragmatic issues such as availability of organic products in local supermarkets and that the price difference between organic and conventional foods was not too big. Reflexive practices, on the other hand were prevalent among shoppers that were more ethically and politically minded (e.g., health, environment, animal welfare, and taste).
Thus, awareness of environmental, ethical, and health issues in combination with reflection seem to be factors which motivate consumers to buy organic food. However, how can favorable conditions be provided to encourage this type of behaviour, and how can digital media play a role in this? In fact, interactive technologies already exist which may promote more sustainable food consumption [25]. For instance, the technology may be used for tracking the origins of foods. Consumers may find this important and it may also be crucial for organic farmers. Leading grocery chains nowadays use digital media to communicate with their customers regarding, for example, special offers and recipes and personal information such as bonus points and shopping lists. These existing communication platforms could advantageously be used for communicating information regarding environmental implications of shopping behaviour. The food retailers may, thus, offer a platform where customers may become aware of and reflect over their own purchases.

1.3. Visualizations to Promote Sustainable Practices

Visualizing data to consumers in different settings has been shown to provide feedback on consumers’ behaviour. For instance, there is a vast area of research on visualizing electricity use in order to reduce people’s electricity consumption. The ease of measurement, e.g., of electricity use, has been integrated into digital media in different forms of feedback with the aim of visualizing for users what is otherwise hidden and to encourage a decrease in electricity use [26,27,28,29,30,31]. Even though a great deal of visualizations to encourage sustainable practices have focused on electricity, there is also a growing interest in the area of sustainable food [25,32,33]. In [34], we list examples of some digital attempts to visualise information regarding food-related behaviour. These include the use of technology for visualizing food-miles [35], and helping users to reflect on food waste [36,37,38]. Also, a recent systematic literature review analysed digital behaviour change interventions related to sustainable food consumption, including visual interventions promoting organic food shopping [39]. The review concluded that the included studies had major quality issues when evaluated from a behavior change perspective and that there was a lack of evidence regarding whether the digital behavior change interventions examined worked or not. Other studies on interaction design for promoting organic grocery consumption have directed attention towards the reflective need in grocery shopping [33,40,41]. The design prototype “The Food Planner” focused on the planning phase and the choice of different meals [42]. Finally, the Nutriflect system used tracking of food consumption to encourage reflection on the nutritional content of food [43].
The study presented here draws on the above research. Moreover, it takes the research further by visualizing real consumer data, based on informants’ actual purchases from an existing grocery chain. The visualisation of the shopping data is, thus, personalized in a design aimed towards reflection and increase of the purchase of organic products. The design intervenes with consumers’ food shopping and our study evaluates the results of this intervention.

2. Methods

The methods consisted of designing a prototype visualizing real shopping data and interviewing potential consumers using this prototype. In the first phase, the web-based prototype “The EcoPanel” (EP) was designed and developed. In a second phase—the user study—we monitored change in consumption for 65 test users over five months; we carried out a survey on food consumption practices among test users; and we interviewed nine test users. The purpose of the user study was to observe how the EP’s visualization of the test users’ purchase of organic food affected their motivation to buy these products as well as their actual purchases of these products. The 65 users were recruited from the internal communication channels of the food retailer. This means that all the testers were either working at or connected with the company, and that it was a self-selected group that mostly was interested already in the topic. Note that the monitoring and the survey are not in focus in the current article, but described in [34]. Results from the survey and monitoring of use are also presented in [34].
The development of the EP and the user study were carried out in collaboration with one of the leading grocery chains in Sweden, in the future referred to as “The Store.” The Store supported the process by providing real shopping data from individual households, which they collected via customer membership cards. The collected data indicate the actual products bought, their cost, and whether they were labelled as organic or not. As the Store registered customers’ shopping data, this data could also be fed back to them. A second type of data collected to inform us about food consumption practices was survey data from the test users. Interviews were made with nine of these to deepen the emerging image of food practices even further. The purpose of the interviews was not to strive for a generalization of results, but to describe how users of the EP reason from the feedback on their purchases. These interviews are in focus for the present article, and the monitoring of shopping, as well as the survey, are used as background.
Table 1 provides an overview of the research methodology, and the following sections describe details of phases of the research method—the design process of the EP, the final EP, and the user study.

2.1. Design of the EcoPanel

The design process of EP is described in detail in [34], and a summary is given below. The process was iterative through loops based on ideas, tests, and revisions. The target users for the EP are customers of The Store. The design process was carried out along the five phases in Table 2.

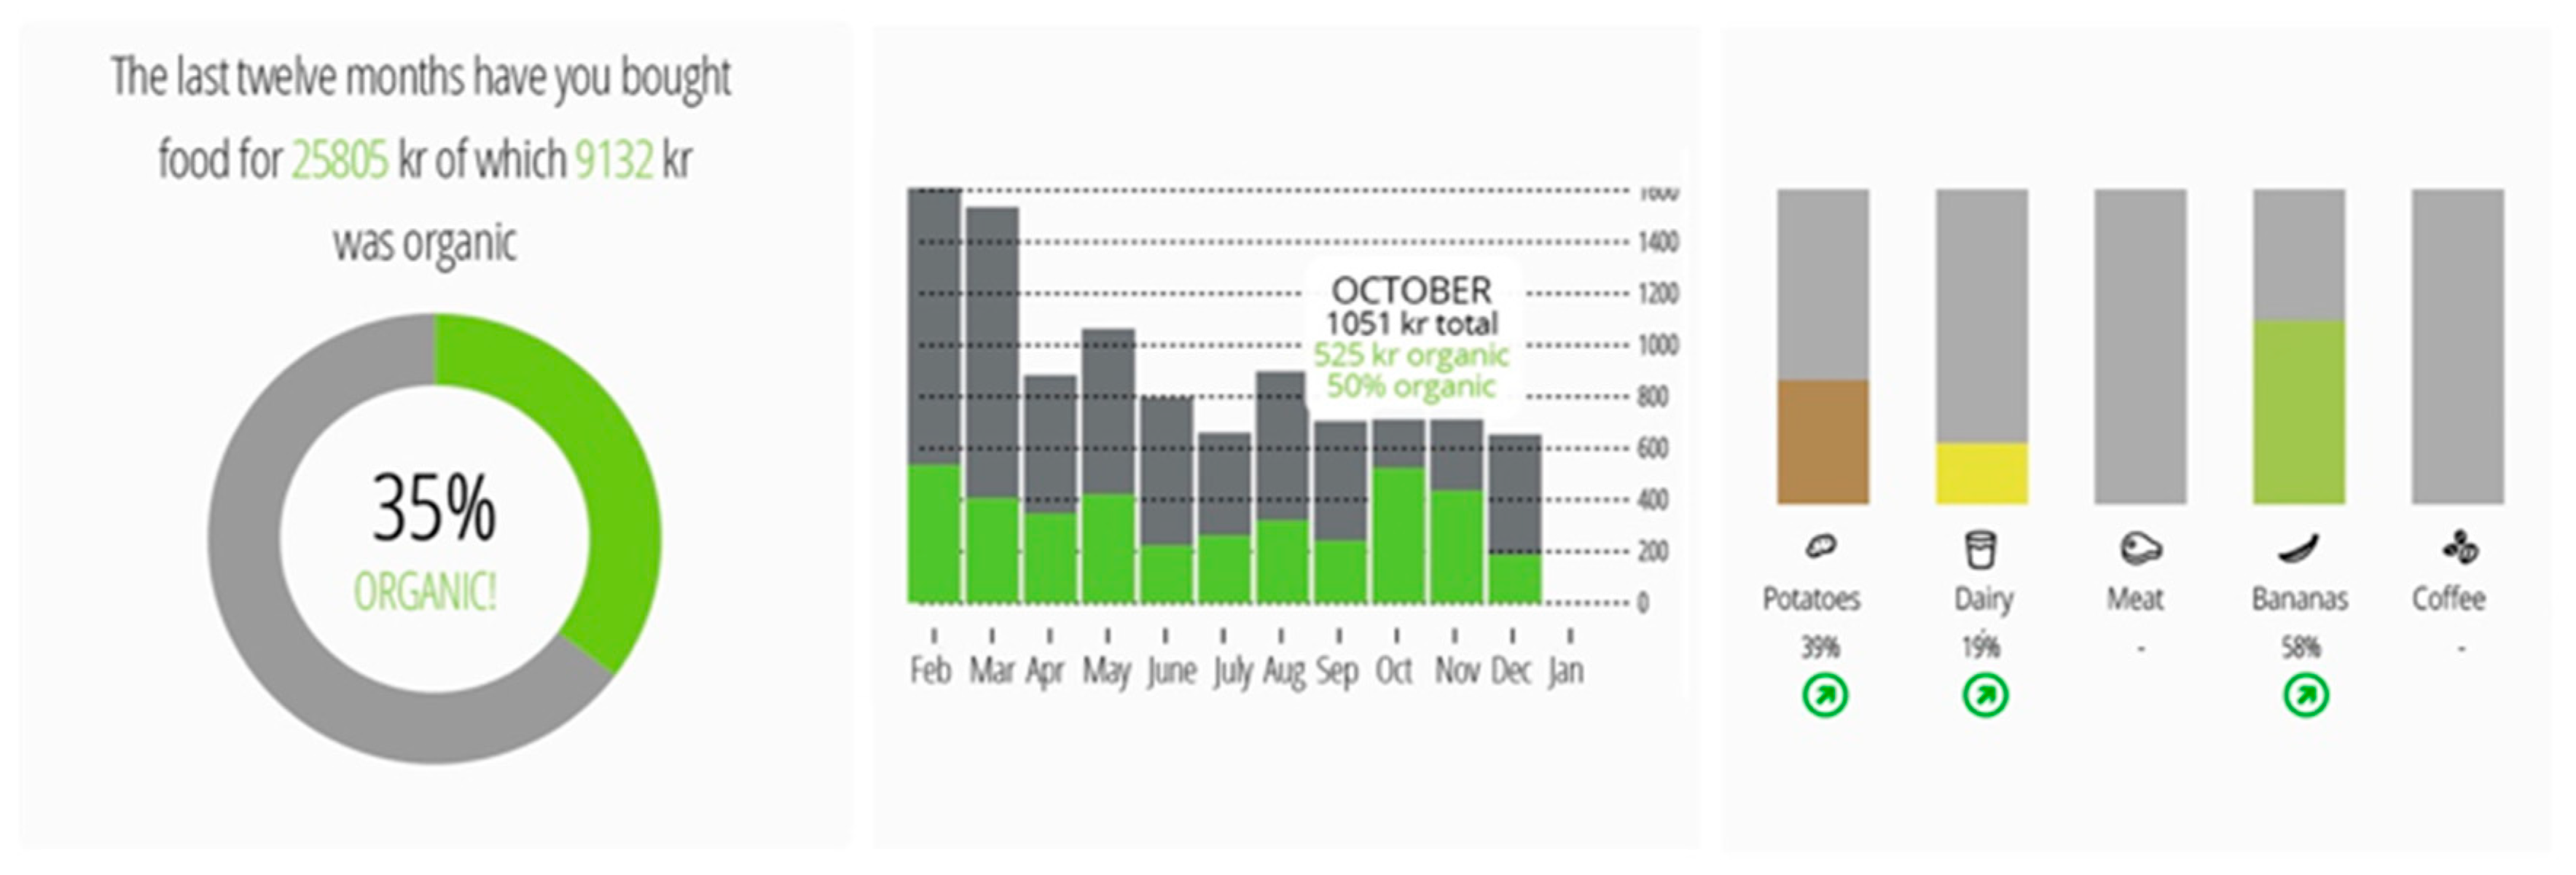
2.2. The EcoPanel—The Final Prototype

The EP prototype is a functional web application. It was available online and users could log in using their membership ID of The Store. EP visualizes the user’s purchases at The Store during the last twelve months based on the purchases registered using their membership card. As mentioned above, this data is at a product level and includes for each item: date, product, category, price, and whether the product has an organic certification or not. The data updated automatically every day, and new purchases were normally shown the day after the actual transaction. The prototype is a single-page “dashboard” presenting information about the purchases and the share of organic calculated by money spent. For more details, see [34,44]. The different parts of the visualization are:
  • A total view presenting the total amount spent and the organic percentage during the last twelve months
  • A monthly view presenting month-by-month information with two alternative views: in absolute money spent, or in relative organic percentage (Figure 1).
  • A category view that visualizes the purchases of the latest month divided by category: meat, fish, dairy and eggs, fruit and vegetables, pantry items, snacks and candy, bread and cereals, and frozen food. The categories are visualized using a “donut chart” with the size of the chart representing the amount spent and the percentage of organic food as a sector of the chart with higher opacity. The user can navigate between different months and see detailed information of all the products in a given category. (Figure 2)
  • A challenge showing five specific products or categories (potatoes, bananas and grapes, meat, dairy, coffee) that are especially important to change to organic. The visualization presents the user’s performance (percentage of organic purchases in those categories) and the user’s current trend (Figure 3).
The visualization also contains information about the benefits of buying organic food, and links to explore more on the topic of organic food.
The final prototype was launched to test users in March 2015. These were 65 employees at The Store, who responded to invitations to test the EP prototype. The sample of test users is, thus, limited to users who are positive to participation. The test lasted for five months. In a previous article [34], we describe the method of and results from the survey given to the test users. Also, test users’ food shopping behaviour were monitored throughout the test period and compared to a reference group. Results showed that the average percentage of organic purchases increased by 23% during the test period, compared to a 6% increase in the reference group. Details of method and results are described in [34]. The main focus in the current article is on the interviews carried out with nine of the test users.

2.3. Interviews with EcoPanel Users

The aim of interviewing a selected part of the test group was to gain a deeper understanding of and their reflections on information from the EP. Questions were structured in an interview guide, focusing on three different themes: backgrounds and practices related to food shopping, views of organic food, and reactions and thoughts of the EP. In order to encourage informants’ reflective expressions, questions were open. Follow-up questions were posed when needed for a fuller understanding of informants’ answers. This interview methodology followed a general methodology for conducting qualitative interviews, e.g., proposed by [45].

2.3.1. Informants

From the 65 users that logged in to test the prototype, we sent e-mail invitations to ten individuals based in the Stockholm area to a face-to-face interview. Nine of these agreed to the interview. Our contact at The Store supported the recruitment process through her knowledge of the organization and helped to pick out individuals with different types of roles within The Store. Moreover, we strived for an even distribution in gender, age, interest in organic food, and size of households. Table 3 gives an overview of the informants.
The nine informants were 30–59 years old, evenly distributed within the span. One of them lived in a single household; otherwise they all lived in households consisting of couples with or without children (see Table 3). For two (I-4, I-6), a high school exam was the highest education; the rest had college or university degrees. All informants stated a high level of food interest. They gave a 4 or 5 to the statement “I am very interested in food.” Being interested in food may provide a favourable condition for reflecting over food choices. Five informants regarded themselves as eating according to their values, giving a 4 to the statement “I only eat food corresponding to my values.” Two informants did not consider themselves to eat according to their values, which we interpret as illustrating the gap between attitude and behaviour [14]. Eight of the nine informants were employed at The Store, and one (I-9) was in other ways linked to The Store. Regarding how much organic food the informants consumed, everyone but one (I-5) purchased far above the national retail average of 5% for 2014 [12]. Four of the informants were located in the middle span (6%–20%) and five in the higher span (21%–100%). Thus, compared to the national average, the informants rank quite high on their purchase of organic food. All informants were experienced computer users.

2.3.2. Procedure of Interviews

The interviews were conducted in March 2015 at the workplace of each informant. There were two interviewers at each interview; a main interviewer who conducted the interview and one support interviewer, whose main task was to listen and come up with additional questions if necessary. Each interview took 1–1.5 hours and was recorded with the informant’s consent. Written information was given on how the research results were going to be used, guaranteeing confidentiality. Both researchers and informants signed the document. Informants brought their own laptop to be able to log on to the EP during the interview. A timeslot was dedicated to a combined observation and interview, where the informants were asked to show how they used the EP and how they reflected on it. The recorded interviews were transcribed manually by a firm specializing in this service. Then, they were analysed manually by two of the researchers, according to Kvale’s interview analysis "concentration," "categorization," and "interpretation" [45]. After reading through all the transcribed material, the research team defined ten central categories that had emerged during the interviews to be the most prominent. For each category, we read through the material and gathered the relevant material related to it.

3. Results

The following sections present results from interviews with nine EP users. The two central categories emerging from the interviews were relation to food and to the EP; and reflections on shopping in relation to feedback from the EP. The latter category is divided into further subcategories, described below. To supplement interpretations of informants’ reflections, we also used data from the survey (Table 3) when applicable. This information included “eating according to one’s values.”

3.1. Relation to Food and to the EcoPanel

Eight out of the nine informants had a positive attitude towards organic food, and one informant had a neutral attitude (I-5). This meant that most informants associated organic food with quality and believed it to benefit the environment, health, and animal welfare in various ways. As one informant reasoned:
I associate organic with quality.... it’s produced under better circumstances, it’s better for me and the kids from a health perspective and better for the environment, and for the animals ... but, the biggest driver is probably toxins, to avoid getting poisons in ourselves, I think. (I-2)
The eight positive informants wished to have a larger share of organically produced food in their grocery bag, but considered assortment and price the main reasons preventing them from realizing their ambitions. This was also in line with responses to the survey given to all test users.
There was a consensus among informants that the EP in general gave valuable knowledge about the households’ shopping patterns. Eight of the informants (I-1, I-2, I-3, I-4, I-6, I-7, I-8, I-9) had the ambition to buy organic food and stated that the ecoshares visualized through EP provided valuable information. It was generally found motivating to be able to get feedback on the organic purchases. On the question, if the EP would motivate them to buy more organic food, one (I-3) said that the EP stimulated the household’s organic ambitions. Another informant (I-7) was encouraged by the design of EP to increase the proportion of organic food purchases. A third person (I-1) thought it was motivating to be able to spot a certain product category. Also, to be able to see the development over the past year was found motivating. One of the informants (I-2) said it was inspiring to see the diagrams and how they change with the amount of groceries bought. Another (I-3) called it “a funny hunt” to track the progression over time:
Now we really try to get as much organic as possible, when it is not only a receipt that you throw away, but now you can track it for several months. It’s a funny hunt… The EcoPanel becomes an incentive (I-3).

3.2. Reflections on Shopping in Relation to Feedback from the EP

In addition to providing a pleasant overall experience for the informants and allowing them to follow up on their own food shopping over time, the EP served as an instrument for them to reflect over their own shopping behaviour, and in a sense, assess their performance. The next sections analyze examples of informants’ reflections directly related to the feedback from EP. The analysis is intended to suggest which role feedback from the EP played for the informants’ reflections. As informants’ quotations were analyzed, they were grouped into the following categories:
(1)
Evaluations of households’ organic shopping performance in relation to feedback;
(2)
Questioning of one’s own motives;
(3)
Further examination in terms of activities and details of shopping.

3.2.1. Evaluation of Households’ Organic Shopping Performance in Relation to Feedback

Interview statements where informants evaluated their shopping performance according to the feedback from the EP clearly expressed how informants strived towards the goal of buying more organic food. They used expressions, such as “improve,” “unhappy with myself,” and to “be better than them,” which illustrated that there was a direction of their interpretation of the feedback from the EP. Two types of evaluations of performance in relation to feedback were identified: One in relation to informants’ own goal and the other in relation to general norms. Either they compared their performance to their own previous performance, or expressed a wish to compare it to a norm. While reading the feedback of their performance, some informants also offered an explanation as to why their proportion of organic food was not higher, e.g.,:
…I could improve for ’fruit and greens’ I think…because there I thought I would have been higher than 35% for instance. So—I like this (the feedback)—just because you may see very clearly where you’re good and where you’re not…because it’s usually a habit and it might be that you’re used to dairy and egg. There I pick organic. Fish is a bit harder… (I-8)
… I didn’t have that much dairy… Yes, then maybe I’ll go two steps to take the organic milk instead of the conventional. Or ask them [the staff] to move them so that organic milk is in front of the conventional (I-1)
…I’m really unhappy with myself…Interesting (reading on the EP)…there’s a lot of organic in dairy. This is really where I could improve (I-6)
The above quotations illustrate how the feedback from the EP showed informants that their purchase of organic food did not live up to their expectations. The first one (I-8) also illustrates how the division of feedback into different grocery categories (Figure 2) supported the discovery that there was a supply of organic food in other categories than those that the informant was already used to (in this case fish).
Other types of evaluations of shopping performance expressed a need of comparing not only to one’s own expectations, but also to a group value. Quotations from I-7 and I-3 show reflections over how EP could be improved by allowing users to compare to a target value and compare their own performance to this. I-7 would have liked an average to compare with, and I-3 would have liked to compare to other customers in the shop:
…I thought I would be a bit higher than 1… closer to 10, but this felt good. If the average would stand next to this, it would be really good. So that you would be able to compare (to it) and feel that you’re a bit better. (I-7)
…to see how the group in the store did their shopping. To be able to compare myself to others…like (a daily newspaper) does: ‘this week only 4% got this question right’…I need to check whether I’m better than them. (I-3)
The above quotations confirm that the need to compare with some relevant value may stimulate shoppers to increase their purchase of organic food. This finding is compatible with research on social comparisons for increasing pro-environmental behaviour, e.g., norm-based feedback on other people’s behaviour [22].

3.2.2. Questioning One’s Own Motives

Some informants’ went beyond an evaluation of their own performance in relation to expectations, as they seemed to question their own motives for their purchases. Informant I-2 reflected on the relative concept of “expensive”:
…I spoke to a colleague…and, for instance fish, I think I had zero and there she had pretty high, so then I had to think: ‘why don’t I buy organic fish? Well, I experience it as very expensive’. And that’s really strange, what you experience as expensive—there’s no logic to it… you have some kind of image of ‘this is how much it should cost’. Then, you may spend a lot more money on something else, which in proportion certainly is more expensive. (I-2)
Apparently, the EP feedback made her realize she usually did not buy organic fish because she found it too expensive compared to nonorganic fish. This led her to ask herself in what respect she thought it was too expensive. As it was not a matter of how much she could afford or not, she would probably decide to buy the organic fish after all. The feedback from EP, and the reflections which it triggered, made her realize that she could eat more according to her values. This quotation also corresponds with her low assessment of eating according to her own values (see Table 3). Similarly, informant I-1 reflected around his underlying reasons for not buying organic:
Yes, it’s an eye-opener… why don’t I actually buy more? When this is a category where there’s so much of organic and where I think the products are good and price worthy (I-1)
The quotation from I-1 expresses an awareness of the potential for acting according to his values—to decrease the attitude–behaviour gap. This informant had previously given a low value to the survey question of eating according to one’s values (see Table 3).

3.2.3. Further Examination in Terms of Activities and Details of Shopping

So far, quotations from informants have shown how they used information from EP as input into evaluating their own shopping behaviour and motives. Some informants also used the feedback to examine the EP feedback even further. One informant did this by trying to recall the concrete context of the shopping, another by expressing that she wanted to know what to do to increase her share of organic food:
The most important is after all, for oneself to look at how much organic it was…and then it may be a bit amusing to wonder ‘what did we do that month?’… no fish apparently (reading from EP) (I-3)
Increase them I think… (In response to how she thinks EP influences the way people buy organic food) … especially concerning those five products (referring to module advising users to change to five specific products for best impact on the environment) (I-7)
Informant I-7 pointed to the importance of actionable data—that people need to get feedback on their actions in combination with advice on how to act to change things.
The examples of reflections from users of EP presented above illustrate how the feedback on their own shopping met their own goals, values, and expectations. As can be seen from these examples, the evaluation of their own performance could end with them being content with their performance or with the conclusion that they could do better. However, the evaluation could also result in informants wanting to learn more or looking for ways to improve their performance. Here, the actionable feedback provided by the “Five products challenge” was useful. As feedback is always interpreted in terms of something else, it is interesting to note that informants had expectations, goals, or ambitions, which they evaluated against the information they received from the EP. In this way, the EP provided information which consumers could use to change their shopping behaviour.
For one of the informants (I-2), the motivation was grounded in being able to support the organic development from a broader perspective. It made her feel like a clever and well-informed citizen. Since she believed that “organic” had high status in society, it motivated her to see the organic columns growing in the EP. She believed that if she would actively use the EP as a recurring tool, it could boost her ethics. This is supported by the survey response that I-2 considered that she was “eating according to values” (see Table 3). She expressed it in this way:
For it’s a small inner struggle between convenience, wallet and doing the right thing ... I get to wrestle a bit with myself in the shop, you have to have this little better self on the shoulder and say to yourself, I have the economy, not everybody has. Despite the higher price, I must think it’s worth prioritizing it. I believe that the EP can support as "a better self on the shoulder "... It would strengthen my line in the store, I think it would get me to increase my organic purchases more. (I-2)

4. Discussion

One major conclusion from our study is that the EP motivated informants to increase the proportion of their organic shopping. Test users in general increased their share of organic food when they were able to see it visualized. The average percentage of organic purchases increased by 23% during the test period, compared to a 6% increase in the reference group [34]. Another major conclusion is that the EP served as a tool for reflection for the informants in the study. The feedback from the EP stimulated informants to reflect in different ways: by evaluating their household’s performance in shopping organic; by questioning their own motives; and by further examining the link between the visualization of their shopping to activities and details of shopping. Differentiating reflections in this way provides empirical illustrations to the definition of critical reflection formulated by [46], p. 50, as “Bringing unconscious aspects of experience to conscious awareness, thereby making them available for conscious choice.” Following this definition, the reflections articulated by our informants and elicited by the feedback from the EP would support decision-making.
Figure 4 presents an attempt to summarize how the reasoning and interaction process lead up to a decision. It provides a model of informants’ reasoning around the feedback provided by the EP. As feedback is always interpreted in terms of something else, it is interesting to note that informants had expectations, goals, or ambitions, which they evaluated against the information they received from the EP. The model starts off with the actual act of shopping. The next step is reading and interpreting the feedback on the EP regarding the groceries bought. Depending on how this feedback is interpreted, the EP user may choose at least one of two next steps. One step would be to evaluate their own performance in relation to the feedback. Examples of this step were shown in quotations reflecting a dissatisfaction with their own performance and the potential for improvement.
An alternative step to respond to the feedback from the EP would be to search deeper into the information given, such as accessing details on the purchases made by clicking on the “+” in the product category view in Figure 2. This might also be to explore more on the topic of organic food. Having evaluated one’s performance by interpreting the feedback from the EP, our informants exhibited at least three alternative types of reasoning: they either compared their performance to their expectations or goals; or they questioned their own motives for making the choice they made; or they expressed a wish for a possibility to compare themselves with others. In the current shape of the EP, this possibility does not exist, but the response is an indication of a characteristic to be included in a revision of the design. The lower boxes in the flow chart in Figure 4 contain an alteration of the shopping act. The new information of the EP may, thus, change the proportion of organic products included in the individual shopping basket.
The reflections brought forward through the interviews would, according to [24], be significant for shoppers that are more ethically and politically minded than convenience shoppers.

Implications for Food Shopping Practices

The proposition that practices constitute individual actions and create social structures is at the core of the social practice theory framework. This is a key in understanding how the empirical data collected in our study relate to the formation of food shopping practices. The individual actions as shown through the shopping data and indirectly through quotations from informants are instances and reproductions of practices. In designing EP, we nurtured a goal that it would play a role in bringing forward the weave of food shopping practices with a focus on organic food.
In scrutinizing how the elements of the dimensions interact, we find that the EP mediates between dimensions of a social practice theory framework, such as the stuff dimension and the skills dimension [16], by providing shopping data. Users may interpret these according to their own ambitions, knowledge, and values. Results from the interviews indicate that, through seeing their own shopping data mirrored by EP, the informants became aware of how their food shopping activities align with their ambitions, expectations, and perceived norms for shopping organic products; how their food shopping activities vary over time; and, how their food shopping expresses a form of lifestyle, in the type and amount of food products they buy over certain time periods.
The design of EP is not neutral. On the contrary, EP was intentionally designed to communicate values and emotions linked to organic food. The EP communicates that organic food is positive for the environment. It indirectly rewards shopping organic products by showing how the exchange of certain products may have a positive impact on the environment, thus facilitating for users how to increase their proportion of organic products in their shopping. The information provided for users to learn more about organic food also supports a positive association between organic food and the environment.
The emergence of the new practices including more organic products supports the idea that, for new practices to be formed, openings in more than one dimension in the social practice theory framework are required [17]. The social practice framework is useful for analyzing food consumption practices and to generate input to where change may be stimulated. New practices are formed when they are preceded by changes in at least two of the pillars of practices [17]. The EP primarily targeted the pillar of body/skills (e.g., knowledge, reflection, beliefs). However, in expecting practice change to occur through awareness alone, we would overestimate “the agency of ideology over practice histories” [17]. Although people may be considered “carriers of practices” [47], the material world and social contexts are also heavily involved in the shaping of practices. Food-shopping practices are, for instance, partly formed by the availability of food on the market, the price, supply, and the packaging of food. Yet, food-shopping practices also rest upon material characteristics of shops—their spatial layout, size, etc. The design of EP and the subsequent user study were intended to make the complex pattern of food shopping practices transparent also by addressing the social context in which these practices occur.

5. Conclusions

The study presented here has shown how an online visualization of personal shopping data may intervene with food shopping practices to form new and more sustainable ones. The visualization of food purchases in the EP, placing organic products in the spotlight for each food category, stimulates critical reflection and the formation of new practices. Although the study focused on three specific phases of shopping—planning, the act of shopping, and what happens after—the design intervention in the shopping practice may be applied to other phases, e.g., the shoppers’ journeys to and from the store. Moreover, the food shopping practice is closely linked to other practices also eligible for explorations through design interventions. One such practice is the eating practice, which so far has shown to be quite resilient to many forms of external pressure [48]. Other related practices are cooking and handling of food waste, which have both received attention regarding visualization to motivate sustainable practices [49,50]. A fruitful direction for future research may be to broaden the perspective to explore how different practices combine into sustainable consumption patterns and how visualization and design may play a role in this combination.

Author Contributions

Conceptualization: C.K., J.L.Z. and U.B.; design EcoPanel: J.L.Z.; methodology, formal analysis, investigation, writing—original draft preparation: all authors; writing—review and editing: C.K. and R.M. All authors have read and agreed to the published version of the manuscript.

Funding

This research was funded by Vinnova through a grant to the Centre for Sustainable Communications—CESC—at KTH, Royal Institute of Technology.

Acknowledgments

The authors would like to thank test users, informants, and experts from the food chain where the study was carried out.

Conflicts of Interest

The authors declare no conflict of interest.

References

  1. IPES-Food. From Uniformity to Diversity: A Paradigm Shift from Industrial Agriculture to Diversified Agroecological Systems; 2016. Available online: www.ipes-food.org (accessed on 27 April 2020).
  2. Goldberger, J.R. Conventionalization, civic engagement, and the sustainability of organic agriculture. J. Rural Stud. 2011, 27, 288–296. [Google Scholar] [CrossRef]
  3. Fouilleux, E.; Loconto, A. Voluntary standards, certification and accreditation in the global organic agriculture field: A tripartite model of techno-politics. Agric. Human Values 2017, 34, 1–14. [Google Scholar] [CrossRef]
  4. Rigby, D.; Cáceres, D. Organic farming and the sustainability of agricultural systems. Agric. Syst. 2001, 68, 21–40. [Google Scholar] [CrossRef]
  5. Darnhofer, I.; Lindenthal, T.; Bartel-Kratochvil, R.; Zollitsch, W. Conventionalization of organic farming practices: From structural criteria towards an assessment based on organic principles—A review. Agron. Sustain. Dev. 2010, 30, 67–81. [Google Scholar] [CrossRef] [Green Version]
  6. Bengtsson, J.; Ahnström, J.; Weibull, A. The effects of organic agriculture on biodiversity and abundance: A meta-analysis. J. Appl. Ecol. 2005, 42, 261–269. [Google Scholar] [CrossRef]
  7. Scialabba, N.E.H.; Müller-Lindenlauf, M. Organic agriculture and climate change. Renew. Agric. Food Syst. 2010, 25, 158–169. [Google Scholar] [CrossRef] [Green Version]
  8. Sanders, J.; Heß, J. Leistungen des Ökologischen Landbaus für Umwelt und Gesellschaft; Thünen Report 65. Braunschweig, Germany. 2019. Johann Heinrich von Thünen-Institut. Available online: www.thuenen.de (accessed on 27 April 2020).
  9. Mie, A.; Wivstad, M. Organic Food–Food Quality and Potential Health Effects. A Review of Current Knowledge, and A Discussion of Uncertainties; SLU, EPOK- Centre for Organic Food & Farming: Uppsala, Sweden, 2015. [Google Scholar]
  10. Angervall, T.; Sonesson, U.; Ziegler, F.; Cederberg, C. Mat och klimat En sammanfattning om matens klimatpåverkan i ett livscykelperspektiv; SIK-rapport, No 776; Institutet för Livsmedel och Bioteknik (SIK): Gothenburg, Sweden, 2008. [Google Scholar]
  11. Tjärnemo, H.; Södahl, L. Swedish food retailers promoting climate smarter food choices-Trapped between visions and reality? J. Retail. Consum. Serv. 2015, 24, 130–139. [Google Scholar] [CrossRef]
  12. Ekoweb. Ekologisk livsmedelsmarknad. Rapport om den ekologiska branschen sammanställd av Ekoweb.nu. Ekoweb, Lidköping, 2019. Available online: www.ekoweb.nu (accessed on 27 April 2020).
  13. Vermeir, I.; Verbeke, W. Sustainable food consumption: Exploring the consumer attitude-behaviour gap. Ghent Univ. WP 2004, 4, 268. [Google Scholar]
  14. Aschemann-Witzel, J.; Niebuhr Aagaard, E.M. Elaborating on the attitude-behaviour gap regarding organic products: Young Danish consumers and in-store food choice. Int. J. Consum. Stud. 2014, 38, 550–558. [Google Scholar] [CrossRef]
  15. Schatzki, T. Introduction: Practice Theory. In The Practice Turn in Contemporary Theory; Schatzki, T., Knorr Cetina, K., von Savigny, E., Eds.; Routledge: London, UK, 2001; p. 256. [Google Scholar]
  16. Shove, E.; Pantzar, M.; Watson, M. The Dynamics of Social Practice: Everyday Life and How it Changes; Sage: London, UK, 2012. [Google Scholar]
  17. Sahakian, M.; Wilhite, H. Making practice theory practicable: Towards more sustainable forms of consumption. J. Consum. Cult. 2014, 14, 25–44. [Google Scholar] [CrossRef]
  18. Rana, J.; Paul, J. Consumer behavior and purchase intention for organic food: A review and research agenda. J. Retail. Consum. Serv. 2017, 38, 157–165. [Google Scholar] [CrossRef]
  19. Hughner, R.S.; McDonagh, P.; Prothero, A.; Shultz II, C.; Stanton, J. Who are organic food consumers? A compilation and review of why people purchase organic food. J. Consum. Behav. 2007, 6, 94–110. [Google Scholar] [CrossRef]
  20. Shafie, F.A.; Rennie, D. Consumer Perceptions Towards Organic Food. Procedia-Soc. Behav. Sci. 2012, 49, 360–367. [Google Scholar] [CrossRef] [Green Version]
  21. Welsch, H.; Kühling, J. Determinants of pro-environmental consumption: The role of reference groups and routine behavior. Ecol. Econ. 2009, 69, 166–176. [Google Scholar] [CrossRef]
  22. Bergquist, M.; Nilsson, A.; Ejelöv, E. Contest-based and norm-based interventions: (How) do they differ in attitudes, norms, and behaviors? Sustainability 2019, 11, 425. [Google Scholar] [CrossRef] [Green Version]
  23. Smith, S.; Paladino, A. Eating clean and green? Investigating consumer motivations towards the purchase of organic food. Australas. Mark. J. 2010, 18, 93–104. [Google Scholar] [CrossRef]
  24. Hjelmar, U. Consumers’ purchase of organic food products. A matter of convenience and reflexive practices. Appetite 2011, 56, 336–344. [Google Scholar] [CrossRef]
  25. Blevis, E.; Morse, S.C. Food, Dude. Interactions 2009, 16, 58–62. [Google Scholar] [CrossRef]
  26. Gustafsson, A.; Gyllenswärd, M. The Power-Aware Cord: Energy Awareness through Ambient Information Display. In Proceedings of the CHI’05 extended abstracts on Human factors in computing systems, Portland, Oregon, 2–7 April 2005; ACM Press: New York, NY, USA, 2005; pp. 1423–1426. [Google Scholar]
  27. Spagnolli, A.; Corradi, N.; Gamberini, L.; Hoggan, E.; Jacucci, G.; Katzeff, C.; Broms, L.; Jonsson, L. Eco-feedback on the go: Motivating energy awareness. Computer (Long. Beach. Calif) 2011, 44, 38–45. [Google Scholar] [CrossRef]
  28. Broms, L.; Katzeff, C.; Bång, M.; Nyblom, Å.; Hjelm, S.I.; Ehrnberger, K. Coffee maker patterns and the design of energy feedback artefacts. In Proceedings of the DIS 2010-Proceedings of the 8th ACM Conference on Designing Interactive Systems, Aarhus, Denmark, 16–20 August 2010. [Google Scholar]
  29. Jönsson, L.; Broms, L.; Katzeff, C. Watt-Lite; energy statistics made tangible. In Proceedings of the DIS 2010—Proceedings of the 8th ACM Conference on Designing Interactive Systems, Aarhus, Denmark, 16–20 August 2010. [Google Scholar]
  30. Katzeff, C.; Nyblom, Å.; Tunheden, S.; Torstensson, C. User-centred design and evaluation of EnergyCoach-an interactive energy service for households. Behav. Inf. Technol. 2012, 31, 305–324. [Google Scholar] [CrossRef]
  31. Katzeff, C.; Broms, L.; Jönsson, L.; Westholm, U.; Räsänen, M. Exploring Sustainable Practices in Workplace Settings through Visualizing Electricity Consumption. ACM Trans. Comput. Interact. 2013, 20, 1–22. [Google Scholar] [CrossRef]
  32. Hirsch, T.; Blevis, E.; Parikh, T.; Sengers, P.; Beckwith, R. Making food, producing sustainability. In Proceedings of the CHI’10 Extended abstracts on Human Factors in Computing Systems, Atlanta, GA, USA, 10–15 April 2010; pp. 3147–3150. [Google Scholar]
  33. Clear, A.K.; Friday, A.; Rouncefield, M.; Chamberlain, A. Supporting Sustainable Food Shopping. IEEE Pervasive Comput. 2015, 14, 28–36. [Google Scholar] [CrossRef] [Green Version]
  34. Zapico, J.L.; Katzeff, C.; Bohné, U.; Milestad, R. Eco-feedback visualization for closing the gap of organic food consumption. In Proceedings of the 9th Conference of Human-Computer Interaction, Gothenburg, Sweden, 23–27 October 2016; pp. 1–9. [Google Scholar]
  35. Kalnitkaitè, V.; Rogers, Y.; Bird, J.; Nicolas, V.; Bachour, K.; Payne, S.; Todd, P.M.; Schöning, J.; Krüger, A.; Stefan, K. How to nudge in situ: Designing Lambent Devices to Deliver Salient Information in Supermarkets. In Proceedings of the UbiComp’2011; ACM: Beijing, China, 2011. [Google Scholar]
  36. Thieme, A.; Comber, R.; Miebach, J.; Weeden, J.; Krämer, N.; Lawson, S.; Olivier, P. ’We’ve Bin Watching You’-Designing for Reflection and Social Persuasion to Promote Sustainable Lifestyles. In Proceedings of the SIGCHI Conference on Human Factors in Computing Systems—CHI’12, Austin, TX, USA, 5–10 May 2012; pp. 2337–2346. [Google Scholar]
  37. Farr-wharton, G.; Choi, J.H.-J.; Foth, M. Food Talks Back: Exploring the Role of Mobile Applications in Reducing Domestic Food Wastage. In Proceedings of the 26th Australian computer-human interaction conference on designing futures: The future of design, Sydney, Australia, 2–5 December 2014; pp. 352–361. [Google Scholar]
  38. Comber, R.; Thieme, A.; Rafiev, A.; Taylor, N.; Krämer, N.; Olivier, P. LNCS 8118—BinCam: Designing for Engagement with Facebook for Behavior Change. In IFIP Conference on Human-Computer Interaction; Springer: Berlin/Heidelberg, Germany, 2013; Volume 8118. [Google Scholar]
  39. Hedin, B.; Katzeff, C.; Eriksson, E.; Pargman, D. A Systematic review of digital behaviour change interventions for more sustainable food consumption. Sustainability 2019, 11, 2638. [Google Scholar] [CrossRef] [Green Version]
  40. Choi, J.; Comber, R.; Linehan, C. Food for thought: Designing for critical reflection on food practices. Interactions 2013, 793–794. [Google Scholar] [CrossRef]
  41. Tholander, J.; Jacobsson, M. Ecofriends. Interactions 2013, 20, 58. [Google Scholar] [CrossRef]
  42. De Jong, A.; Kuijer, L.; Rydell, T. Balancing food values: Making sustainable choices in cooking practices. Nordes 2013, 1. [Google Scholar]
  43. Reitberger, W.; Spreicer, W.; Fitzpatrick, G. Situated and mobile displays for reflection on shopping and nutritional choices. Pers. Ubiquitous Comput. 2014, 18, 1721–1735. [Google Scholar] [CrossRef]
  44. Bohne, U.; Zapico, J.L.; Katzeff, C. The EcoPanel: Designing for reflection on greener grocery shopping practices. Proc. Enviroinfo ICT Sustain. 2015, 22, 221–228. [Google Scholar]
  45. Kvale, S. Den Kvalitativa Forskningsintervjun; Studentlitteratur: Lund, Sweden, 1997. [Google Scholar]
  46. Sengers, P.; Boehner, K.; David, S.; Kaye, J. “Jofish” Reflective Design. In Proceedings of the 4th Decennial Conference on Critical Computing: Between Sense and Sensibility, Aarhus, Denmark, 20–24 August 2005; pp. 49–58. [Google Scholar]
  47. Reckwitz, A. Toward a Theory of Social Practices: A Development in Culturalist Theorizing. Eur. J. Soc. Theory 2002, 5, 243–263. [Google Scholar] [CrossRef]
  48. Cheng, S.L.; Olsen, W.; Southerton, D.; Warde, A. The changing practice of eating: Evidence from UK time diaries, 1975 and 20001. Br. J. Sociol. 2007, 58, 39–61. [Google Scholar] [CrossRef]
  49. Clear, A.K.; Comber, R.; Friday, A.; Ganglbauer, E.; Hazas, M.; Rogers, Y. Green food technology. In Proceedings of the Pervasive Ubiquitous Computing Adjunct publication—UbiComp’13, Zurich, Switzerland, 8–12 September 2013; pp. 553–558. [Google Scholar]
  50. Ganglbauer, E.; Fitzpatrick, G.; Güldenpfennig, F. Why and what did we throw out? Probing on Reflection through the Food Waste Diary. In Proceedings of the 33rd Annual ACM Conference on Human Factors in Computing Systems—CHI’15, Seoul, Korea, 18–23 April 2015; Volume 1, pp. 1105–1114. [Google Scholar]
Figure 1. Screenshots of EcoPanel (translated from Swedish): Total view (left), monthly view (middle) and challenge (right).
Sustainability 12 03599 g001
Figure 2. Screenshot of product category view for one month (translated from Swedish).
Sustainability 12 03599 g002
Figure 3. Screenshot of “five products challenge” (translated from Swedish).
Sustainability 12 03599 g003
Figure 4. Interpretation of feedback from EP in relation to goal.
Sustainability 12 03599 g004
Table 1. Overview of the research process. Focus for the current article is the interviews.
PhaseMethodOutcome
1 DesignDesign of EPThe prototype of the EcoPanel (EP), using real shopping data provided by The Store
2 User studyMonitoring change in consumption for 65 EP test usersData of percentage of organic food purchased for each user and for each month of the period of EP use (5 months) compared to a year prior to introduction of EP; and compared to a reference group not using EP
Survey given to all EP usersOverall image of motives driving the EP users’ food consumption
Interviews with 9 EP usersQualitative data on users’ backgrounds and practices related to food shopping, their views of organic food, and their reactions and thoughts of the EP
3 AnalysisAnalysis of user studyConclusions relating to the sustainable shopping practices
Table 2. Design process of EP.
Design phaseDescription
1. Design of conceptBased on information on food purchase specified on customer receipts
2. Design of paper prototypeBased on workshop within interdisciplinary project team (computer science, graphical and industrial design and Human-Computer Interaction (HCI) and with The Store
3. Focus groupDiscussions with selected potential users on their views on issues regarding food purchase practices
4. User evaluationPotential user groups evaluate paper prototypes. Evaluations are combined with individual interviews to further inform the design
5. Functional prototypesIterative process where prototypes are user-evaluated and revised
Table 3. Overview of the nine informants.
Informant IDGenderAgeNo. of Adults in HouseholdNo. of ChildrenLevel of EducationLevel of Food Interest (1–5) 1Eating according to Values (1–5) 1Percentage of Shopping at The Store 2
I-1M50–5920University42More than 75%
I-2F30–3922University52Almost 100%
I-3F40–4923University53Almost 100%
I-4F40–4922High school43More than 75%
I-5M40–4922University54More than 75%
I-6M50–5930High school54Almost 100%
I-7F30–3920University44Almost 100%
I-8F30–3910University44More than 75%
I-9M50–5922University4450–75%
Notes: 1 Informants were asked to estimate on a scale from 1 to 5 to what extent they agreed with statements, where 1 was not at all agreeing and 5 was completely agreeing. 2 Informants’ responses to survey question estimating how much of their food shopping they did at The Store.

