Impact of Development Zone Construction on Labor Share in China

1
Economics and Management School, Wuhan University, Wuhan 430072, China
2
Center for Economic Development Research and Center of Population, Resource & Environmental Economics Research, Wuhan University, Wuhan 430072, China
*
Author to whom correspondence should be addressed.
Sustainability 2020, 12(9), 3642; https://doi.org/10.3390/su12093642
Submission received: 15 April 2020
/
Revised: 29 April 2020
/
Accepted: 29 April 2020
/
Published: 1 May 2020
(This article belongs to the Section Economic and Business Aspects of Sustainability)
Abstract
:The decline in the share of labor income is associated with rising income inequality, which raises a series of economic and social problems. These problems seriously threaten the sustainability of economic development. To maintain sustainable economic development, China’s government has invested hundreds of billions of dollars to build economic development zones by attracting high-tech enterprises into the zones. In our paper, we aim to analyze whether the construction of economic development zones can effectively increase the share of labor income. We use PSM-DID (Propensity Score Matching Difference-in-Difference) to evaluate the impact of establishing economic development zones in China on the labor income share of enterprises in economic development zones in 2006. We found that the establishment and construction of economic development zones increased the share of labor income through the “agglomeration effect” and “policy effect”. Estimation of the level of heterogeneity among economic development zones shows that, compared with provincial economic development zones, the construction of national economic development zones has a greater effect on increasing the labor income share of enterprises in those zones. Economic development zones in the eastern, central, and western regions should also increase their share of labor income areas.
1. Introduction
Income inequality leads to a decline in demand, weakens long-term economic growth capacity, and widens the gap between the rich and the poor, resulting in social instability and unsustainable development [1]. However, unlike the Kaldor fact that the labor income share remains unchanged under an economically steady state, the universal fact is that nations around the world are facing varying degrees of labor income share declines, which has attracted the attention of scholars from various countries and areas of research [2,3]. In particular, China’s level of income inequality has grown throughout the 20th Century since the 1970s. At the end of that decade, China’s income inequality was almost identical with the most equal income distribution among the Nordic countries, but has subsequently developed to a level close to that of the United States [2]. During the income distribution process, the primary distribution (primary distribution refers to the first distribution in the income distribution process, which distributes income to capital and labor providers according to the amount of capital and labor invested in the production process, respectively) is basic distribution, while redistribution (redistribution refers to the process of adjusting income inequality by means of government tax and unemployment subsidy after the first distribution) is completed on the basis of primary distribution. In addition, in China, which is a developing country, wage-based income is the main source of income for most residents. At the same time, the inequality of labor income among residents is generally much lower than the inequality of capital income. Therefore, increasing the labor income share in primary distribution could effectively improve China’s income inequality and ensure sustainable development. The establishment and construction of development zones provide enterprises with good policy environments and infrastructures, as well as a lot of jobs in the area where the development zone is located. Can the establishment and construction of development zones affect the labor income share of enterprises in development zones? What is the mechanism of the above effects? Studying the above issues not only gives us a deeper understanding of the economic impact of the establishment and construction of development zones in economic operations but also helps us explore how to alleviate the downward trend of labor income shares. These are also the research goals of our paper.
The contributions of our article are the following. First, our article focuses on changes in labor income shares and analyzes the impact of the establishment and construction of economic development zones on labor income shares in the area, thereby enriching existing labor income share research. Secondly, our paper further studies the heterogeneous impact of the development zone construction on labor income share. Using the mediating effect model, we further study the mechanism of the development zone influencing the share of labor income. This paper is structured as follows. Section 2 provides an overview of the relevant literature about the development zone and the labor share, on the one hand, and background introduction, on the other hand. Section 3 provides theoretical analysis. Section 4 describes research strategies. Section 5 shows the main results. The results of the mediation effect test are discussed in Section 6. Finally, Section 7 concludes the paper.
2. Institutional Background and Literature Review
The economic development zone focused on in our paper was authorized by the state or the provincial government in China [4]. In the evaluation system used by Chinese officials whose main criterion is economic growth, being a host city for an economic development zone is preferable for city mayors who seek to compete for investments and foster local economic growth [5]. Although these economic development zones are approved by the state and provincial governments, most of them are implemented at the city level. Most of the enterprises in the economic development zone are large enterprises introduced by the local government and receive special attention from the local government.
Local governments attract enterprises to enter economic development zones through preferential policies. Compared with enterprises located outside an economic development zone, there are two advantages for enterprises located in such a zone [6]. First, they can enjoy a series of preferential policies, including tax deductions, preferential land purchase prices, and lower interest rates on bank loans. Secondly, since Chinese mayors increase their chances of a promotion by increasing local economic growth, they have strong incentives to pursue pro-growth strategies. These officials can use more local administrative means to ensure the smooth operation of enterprises in industrial areas, such as providing stable labor supplements to enterprises in economic development areas, which refers to providing subsidies to enterprises during the off-season in order to quickly increase their production capacity when orders increase. However, this may also create the risk that some city mayors are insufficiently smart or too aggressive and thus make the wrong decisions and over-invest in economic development zones [7]. In the study of the impact of government behavior on the labor market, a series of scholars studied the relationship between government-driven enterprise agglomeration and the local labor market. Cheng and Kwan found that the economic development zone’s policy preferences are an important factor in attracting FDI, and the quality of labor is not the main reason for attracting FDI [8]. Ham et al. found that government programs (State Enterprise Zones (ENTZs), Federal Empowerment Zones (EMPZs), and Federal Enterprise Community (ENTC) programs) have positive, statistically significant impacts on local labor markets in terms of the unemployment rate, the poverty rate, the fraction with wage and salary income, and employment [9]. Neumark and Kolko found that enterprise zones do not increase employment by using California’s data [10]. However, few scholars studied the impact of economic development zone construction on income distribution.
The share of income paid for labor has declined in tandem with the rising wealth inequality [1]. Labor share studies focus on explaining the decline in the labor income share. The income share factor reflects the contribution of the factors in production. Further, market forces cause labor income to be lower than its contribution to production. Dorn et al. [11] noted that industry monopolies have caused a decline in the US labor income share. When the labor market is incomplete, the bargaining power of labor affects the distribution of monopoly profits and eventually changes the distribution of income. Azmat et al. [12] examined the effect of privatization on the share of labor income and noted that privatization reduces the wage bargaining power of workers, which is an important factor for the decline in the share of labor income. Other studies [13] also evidence the decreasing levels of unionization and the weakened bargaining power of trade unions as factors causing the labor share to decline. Capital-biased technical changes also cause a decline in the share of labor income [14]. For example, artificial intelligence is a technological expansion of capital. Thus, in this case, the development of artificial intelligence is more likely to replace labor and reduce the share of labor income [15].
In the related research of urban development and the labor market, many scholars have focused on the relationship between housing wealth and the labor market. Han et al. found that urban housing prices have a great deterrent effect on labor supply [16]. Increasing female labor force participation would result in an increase in housing wealth [17]. In addition, scholars have also found an increase in homeowners’ housing wealth decreases female homeowners’ probability of participating labor force and increases their probability of becoming housewives [18]. However, there are still few documents that consider the issue of labor income distribution from the perspective of the establishment of development zones.
In summary, scholars have conducted a lot of innovative studies on the reasons for the decline in labor income shares. However, the existing literature seldom deals with the impact of the establishment and construction of economic development zones on the labor income share. Considering that the establishment and construction of economic development zones is an important feature of economic development and that the Chinese government often has a strong motivation and ability to intervene in economic operations, it is essential for China’s economic development zones to further analyze the relationship between the share of labor income. Compared with the above studies, our results underscore the important role of public policy in promoting economic equity. This study found that the establishment and construction of economic development zones have a positive impact on changes in the enterprise’s labor income share, that is, the establishment and construction of economic development zones have increased the labor income share of enterprises in development zones. These zones mainly increase the labor income share through the “agglomeration effect” and the “policy effect”. The “agglomeration effect” reduces the cost of hiring temporary employees. To facilitate production during peak periods, companies can recruit more temporary staff to ensure product supply. In this way, companies tend to invest more in labor for production, which ultimately improves the labor income share. The “policy effect” increases the bargaining power of labor in the economic development zone through the government’s technical training support for enterprise employees and the protection of the labor force in the economic development zone, thereby increasing the labor income share. The estimation of heterogeneity at the level of economic development zones shows that under the effects of stronger “agglomeration effects” and “policy effects”, compared with provincial economic development zones, the construction of national economic development zones has a bigger effect on the labor income share of enterprises in those zones.
3. Theoretical Framework
We think that the establishment of an economic development zone affects the labor income share through two mechanisms, the “agglomeration effect” and the “policy effect”. Changes in the labor income share come from the response of an enterprise’s own production decisions to changes in the external economic environment. For China’s economic development zone, the government uses its incentives mentioned above to guide the target company or industry to geographically concentrate. Enterprise agglomeration forms factor agglomeration, such as labor pools, to further strengthen enterprise agglomeration. The construction of economic development zones’ impact on corporate labor share is analyzed based on the “cluster effect” and “policy effect”. On the one hand, economic development zones within the corporate sector have yielded agglomeration of the “labor pool”, which reduces labor market friction and encourages companies to use labor factors of production, thus expanding the scale of employment. On the other hand, local governments use various administrative and legal means to provide employment support policies for economic development zone enterprises (e.g., recruitment subsidies, job fairs, job stabilization subsidies, and job skills training), as well as labor protection policies and various preferential tax policies. These policies improve the bargaining power of labor in the economic development zones and reduce the degree of the transfer of capital taxes, thereby increasing the share of labor income.
3.1. The “Agglomeration Effect” in Economic Development Zones
The establishment and construction of an economic development zone promote the industrial connection between the enterprises settled in it, which help the enterprises in the zone introduce advanced production technology and equipment, attract laborers, and create good conditions for the spatial concentration of relevant enterprises. First, the agglomeration of enterprise space not only promotes the concentration of target industries in the economic development zones but also promotes the concentration of enterprises or institutions in several related industries, such as employment agencies, in the economic development zone. Companies and employment agencies attract labor migrations into the economic development zone to provide employment and improve labor matching efficiency, ultimately producing the “labor pool” effect in Marshall’s industrial agglomeration theory. This “labor pool” can greatly facilitate the employment of labor and reduce the search costs (recruitment costs) paid by an enterprise in addition to wages. Such costs are mainly derived from incomplete information in the labor market and other factors caused by market distortion. Therefore, these costs can be considered labor wedges. Since a labor wedge represents the deviation between wages and the marginal product value of the labor force, a decline in the labor wedge can increase the income obtained by the labor product value of the labor production units. Thus, the labor income share of the enterprise is increased. In addition, with the development of economic development zones, the competition intensity between enterprises within an economic development zone also increases. Increased competition forces enterprises to compete for a highly skilled labor force, thus increasing the wages of skilled labor [19], which leads to an increased labor income share.
3.2. “Policy Effect” in Economic Development Zones
In order to attract enterprises to settle in a zone and support the target industry development, mayors create more favorable production conditions for companies in terms of infrastructure, improving the supply of factors, and regulating market order. On the one hand, mayors invest a large amount of money in improving the infrastructure and supporting facilities in economic development zones. On the other hand, governments at all levels also provide tax incentives, financial subsidies, convenience for recruitment, and land use preferences for enterprises settled in economic development zones. The above-mentioned preferential measures that aim at attracting enterprises to settle and cultivate target industries are typical “policy rents”.
The tax incentives for economic development zones mainly come from value-added tax (VAT) and corporate income tax incentives. Taxes are divided into capital tax, labor tax, and consumption tax according to the tax base. Corporate income tax is a tax on the operating profits of an enterprise and is a capital tax, while VAT covers both labor and capital. The capital tax has a factor substitution effect, which affects the labor income share. A capital tax rate increase encourages enterprises to invest more in labor for production, thus increasing the labor income share [20]. However, corporate income tax may reduce the labor share in the enterprise zone.
The impact of VAT concessions on the labor share mainly depends on the proportion of capital and labor commitment. When the capital supply is flexible, increasing the intensity of taxation may change the relative wage level (the ratio of wages to capital income gains). If the relative wage level decreases after taxation, there is a transfer of the capital tax burden, that is, the tax burden borne by the labor factor is actually greater than the tax burden borne by the capital factor, which ultimately leads to a decline in the share of labor income [21]. Yang Zhang [22] conducted a numerical simulation with a general equilibrium model and concluded that China’s capital does not fully bear the capital tax burden and that VAT preferences might increase the share of labor income.
In addition, the increasing labor shortage problem in China [23] is one of the most prominent structural contradictions. To alleviate the labor structural shortage problem, mayors have engaged in joint recruitment, employment subsidies, labor skills training, and other ways to guarantee the labor supply for enterprises in economic development zones. In addition, in recent years, governments at all levels have paid close attention to employment issues and implemented employment priority strategies, providing various types of public employment services, establishing various types of unemployment regulations and control systems, as well as employment service guidance agencies, and strengthening the protection of labor through labor inspections and labor contracts, along with other measures. An Economic Development Zone is a major meeting place for labor and provides jobs in the region. The implementation of relevant policies mainly focuses on economic development zones within the jurisdiction of the government at all levels established. Therefore, compared with enterprises outside the economic development zone, enterprises in the economic development zone receive more attention from the above policies. Such government measures can help improve the bargaining power of labor. At present, the literature has proven that improvements in the bargaining power of labor and capital help to increase the share of labor income [24]. In summary, various employment support and labor protection policies from the governments at all levels increase the labor income share of enterprises in the economic development zone.
Based on the above analysis, we determined that the establishment and construction of economic development zones help increase the share of labor income.
4. Empirical Research Design
The objective of tour paper’s empirical research is to evaluate the changes in the labor income share of enterprises entering an economic development zone relative to the enterprises outside the economic development zone after the establishment and construction of the zone. Directly comparing the labor income share of enterprises inside and outside the economic development zone may be affected by other policies implemented before and after the establishment and construction of the zone, in addition to the policies for the economic development zone itself, which affect evaluations of the policy effects of the zone. Using the double-difference method based on propensity score matching Difference-in-Difference (PSM-DID) can effectively exclude the impact of other policies on labor income share during the same period, which helps to solve the endogenous problem. The year with the largest number of Chinese economic development zones was 2006. In 2006, 572 economic development zones were established in China. Considering the availability of data for the explanatory variables in this paper, our article selects the establishment and construction of the economic development zones in 2006 as a quasi-natural experimental object for our empirical research.
4.1. Data Source and Sample Selection
The empirical research in this paper uses two sets of data: (1) Firm-level data for the period 2000–2013 taken from Annual Survey of Industrial Firms (ASIFs), which are the product of annual surveys conducted by the National Bureau of Statistics (NBS), and (2) the China economic development zone Audit Announcement Catalogue (2018 edition) (catalog provided by National Development and Reform Commission).
The database includes the financial data for all industrial enterprises with an annual main business income of more than five million yuan in China, thus providing a wealth of empirical research samples [25]. However, this database still features missing data, errors, and inconsistent indicators collected in different years. This database, for example, has missing depreciation indicators for 2008, missing wage payable indicators for 2009–2010, a lack of welfare and labor unemployment insurance costs indicators after 2010, and missing industrial added value indicators in 2004 and 2011–2013. To deal with the above problems, our study uses the 2004–2007 and 2011–2013 intertemporal panel data.
We use the China economic development zone Audit Announcement Catalogue (2018 edition) and the enterprise address information in the NBS database to identify the companies in development zones. Based on related research [26], the identification rules are as follows: If the word “development zone” appears in the address field of an enterprise in a database for a certain year, the enterprise in this year is identified as an enterprise in an economic development zone. Otherwise, the enterprise in this year is identified as an enterprise outside an economic development zone.
4.2. Research Strategies
Our paper focuses on the changes in the labor income share of enterprises in an economic development zone before and after the establishment of the zone. Direct comparisons between enterprises in economic development zones and non-economic development zones can be biased for the following reasons: Due to the need to cultivate specific industries, optimize industrial structures, and promote local economic development, mayors tend to prefer enterprises with specific characteristics when reviewing and introducing enterprises into economic development zones, that is, whether enterprises enter economic development zones subject to government influences. Secondly, due to different geographical conditions, policy conditions, and economic environments of the areas where different economic development zones are located, enterprises consider whether to enter economic development zones based on maximizing their own income. That is, whether the enterprise enters an economic development zone also be affected by its own operating characters. All of the above factors affect the randomness of enterprises entering an economic development zone and can cause selective bias. Finally, the difference between the labor income share of enterprises in economic development zones and those in non-economic development zones may not only come from the “policy processing effect” of enterprises entering economic development zones. In addition to the “policy processing effect”, the difference in labor income shares among enterprises may also come from other unobservable factors, along with the external economic situation and time. Based on the above problems, this paper uses double-difference based on propensity score matching (PSM-DID) to more accurately evaluate the impact of the establishment of economic development zones on the labor income share of enterprises. Specifically, our paper first uses the Propensity Score Matching (PSM) method to find non-economic development zone enterprises with similar characteristics to those in economic development zones to eliminate possible sample selectivity biases and then uses the double-difference method Difference-in-Difference (DID) to estimate the true effect of the establishment and construction of economic development zones on the labor income share of enterprises in such zones.
4.3. Econometric Models
As our paper examines the policy effects of the economic development zones established in 2006, the sample enterprises are divided into two groups: one group includes the enterprise that first entered the economic development zone in 2006 (group P), and the other group includes companies based on PSM matching that are always out of an economic development zone (group ). The use of PSM-DID in our paper is divided into two steps.
In the first step (PSM stage), we use the logit model to estimate the probability of the enterprise entering the development zone. We assume that the probability formula of an enterprise entering the development zone is:
where Pr is the probability of the enterprise entering the development zone, is the matching variable vector used to calculate the probability of the enterprise entering the development zone, is the cumulative distribution function. When using the PSM method to find the control group for the treatment group, we extract portions of the financial data for enterprises that entered a newly established economic development zone in 2006 (P), and the non-economic development zone enterprises (U) in 2005 are used as matching variables. Based on maximizing the R2 criterion, we selected the following marching variables: The age of the enterprise (the year of the sample minus the year of establishing the sample enterprise) and its quadratic term, age2, the scale of the enterprise (the income of the company’s main business with the natural logarithm), the capital density, ky (enterprise fixed assets/employees), profit margin (total profit/total assets), debt ratio (debt/total assets), and the use of dummy variables to control for provinces where the companies are located. In order to accurately estimate the probability of an enterprise entering a newly established economic development zone, a logit model is used.
Then, we use the logit model to estimate the probability of the enterprise entering the development zone according to the following equation:
Next, each treated (enter the development zone) firm is matched by four “identical” but non-treated (not enter the development zone) firms by k-nearest neighbors matching, which represents select four non-treated firms that have the closest probability with a treated firm (we select k = 4 reference with Abadie et al. (2004) which means choose four non-treated firms for a treated firm). The first step (PSM stage) of PSM-DID is over.
In the second step (DID), we use treated firms and matched non-treated firms obtained by the first step according to Equation (3) to estimate “policy processing effect”. “Policy processing effect” means the effectiveness of the policies assessed by DID. In our paper, “Policy processing effect” represents the impact of the establishment of the development zone on the share of labor income.
Our paper also constructs a binary dummy variable P = {0,1}. When the enterprise is an enterprise in an economic development zone, P is set to 1, otherwise, it is 0. At the same time, using the policy implementation year of 2006 as the boundary, the sample period can be divided into before and after the experimental period, and a binary dummy variable T = {0,1} can be constructed. After entering the experimental period, T is taken as 1. Before the experimental period, T is taken as value 0. The interaction term P × T is defined to describe the “policy processing effect” of an enterprise entering an economic development zone. When P × T is 1, the enterprise has been affected by the “policy processing effect”. When the P × T coefficient is positive, the establishment and construction of the economic development zone have indeed increased the labor income share. ls as the labor income share of enterprise i in period t are the outcome variables focused on in this paper. X is the control variable that affects the labor income share. The benchmark model is
The explained variable is the labor income share, ls. The data used in our article are micro-enterprise data. The calculation method is the method of income. We use “wages payable/(wages payable + operating profit + current year depreciation + interest + principal business taxes and surcharges + value-added tax + taxes in management expenses)” to represent lsit. When using the income method to calculate the labor income share, labor income should be calculated in accordance with “wages payable + welfare costs + labor unemployment insurance”. However, as mentioned in the data source section above, the ASIF database in 2008 lacked depreciation for the current year, as well as industrial value-added data after 2004 and 2011, welfare costs and labor unemployment insurance costs after 2008, and payables in the 2007–2010 salary data. Therefore, to ensure the timeliness and validity of the data, our paper uses the above indicators along with the intertemporal matching data from 2004–2007 and 2011–2013 for the empirical analysis. In addition, to test the robustness of labor, we use the data from 2001 to 2007 and variable ls1 (the formula is reported in Table 1). The explanatory variable is P × T, and its coefficient represents the impact of the establishment of an economic development zone on the labor income share of the enterprises in that zone. This paper selects five control variables: (1) The capital-output ratio (ky), (2) the operating characteristics of the enterprise, with the profit rate (profitrate), the debt ratio (debtrate), and the enterprise scale, and (3) monopoly power, expressed as markup (markup) (we reported the calculation method in Table 1).
5. Main Results
5.1. PSM Results
This paper first refers to the method of Heyman et al. [27] and uses PSM to match the treatment group and the control group. The feature variables of samples from the treatment group (enterprises in the development zone) and the control group (enterprises outside the development zone) in 2005 were used as the sample matching variables, and the data were randomly sorted. Next, the logit model was used to estimate the propensity score for the sample. Finally, this paper refers to the method of Abadie et al. [28] and uses the “k nearest neighbor matching” method for matching, where k = 4.
The matching procedure in this paper uses the algorithms provided by Abadie et al. (2004). In a first step, we calculate the probability of a firm entering the development zone using a number of observable characteristics. Then, each treated (enter the development zone) firm is matched by four “identical” but non-treated (not enter the development zone) firm by k-nearest neighbors matching, which represents select four non-treated firms that have the closest probability with a treated firm (we select k = 4 reference with Abadie et al. (2004), which means choosing four non-treated firms for a treated firm).
We can determine whether the PSM results are acceptable from the balanced hypothesis test. The test results are reported in Table 2. The balance hypothesis requires that given the probability that an enterprise will enter an economic development zone , whether the enterprise actually enters an economic development zone and its matching vector are independent of each other, that is,.
Whether the result after matching satisfies the balance hypothesis can be judged from two perspectives: The standard deviation change before and after matching, and the t-statistic change after matching. First, we discuss the absolute value of the standard deviation after matching. The smaller the absolute value of the standard deviation after matching, the better the effect after matching. When the absolute value of the standard deviation after matching is less than 20%, the match is valid.
Second, we use the t statistic for judgment. If the absolute value of the t statistic is small enough, there is no significant difference in the matching variables between the treatment group and the matched control group. Table 2 shows that the absolute values of the standard deviations of the post-matching treatment group and the control group are less than 5% relative to those before the match. Moreover, the p-values of the t statistics are all greater than 0.05. Thus, the matching result satisfies the sample balance assumption and can ensure that the matched control group effectively eliminates sample selection bias and ensures the reliability of the subsequent double-difference estimation results. The marginal effects of the propensity score model and plot of the distribution of the propensity score in the treated and control sample are reported in Appendix A.
5.2. Model Estimation and Result Analysis
Table 3 shows the descriptive statistics of the main variables after obtaining the control group through propensity score matching (PSM). Here, China’s labor income share is still relatively low overall. After obtaining a control group generated by propensity score matching (PSM), the double-difference method (DID) was used to test the policy effects of the establishment and construction of economic development zones. The results are shown in Table 4. Model 1 uses only control variables. and Model 2 uses a fixed-effect model based on Model 1. The fixed-effect model fixes both the company and the year. After comparing Models 1 and 2, the coefficients of the explanatory variables P × T appear to be significantly positive at a significance level of 5%, indicating that the establishment and construction of economic development zones help increase the labor income share of the enterprises in economic development zones.
5.3. Heterogeneity Estimation and Result Analysis
5.3.1. Heterogeneity Analysis of the Economic Development Zone Level
The quasi-natural experiment in this paper is based on the economic development zones that were newly established in 2006. In 2006, a total of 572 new economic development zones were established, including six national economic development zones, and the remainder were provincial economic development zones. National and provincial economic development zones enjoy different degrees of preferential policies, and the gap between these policies is large. The construction of economic development zones mainly relies on the policy dividends of economic development zones, but these policy dividends vary between different levels. The construction of economic development zones first depends on policy dividends to attract enterprises. With an increase in the number of settled enterprises, the agglomeration effect continues to increase. Due to the different policy dividends of different types of economic development zones, the ability of such zones to attract enterprises and accumulate agglomeration effects is also different. At the same time, the mayors, due to their concerns about the rapid economic development and stable operation of society in their respective jurisdictions, pay different levels of attention to enterprises, labor markets, and labor protection under different levels of economic development zones. Therefore, this paper analyzes the heterogeneity of economic development zone levels to clarify the impact of the level of an economic development zone on the share of labor income. Specifically, this paper divides economic development zones into national economic development zones and provincial economic development zones. According to the level of their economic development zones, the enterprises of the treatment group are divided into enterprises located in a national economic development zone and enterprises located in a provincial economic development zone. The estimation formula takes the following form:
is 1 when the enterprise is located in an established national economic development zone and is 0 in other cases. is 1 when the enterprise is located in the established provincial economic development zone and is 0 in other cases. Table 4 reports the estimation results based on the heterogeneity levels of the economic development zones. Models 3 and 4 report the estimated results using the ordinary least squares method and the fixed effect model without the control variable, respectively. This shows that estimation without controlling individual effects can lead to biased results. When using the fixed-effect model, is always significantly positive at a significance level of 5%, but when using ordinary least squares, is not significant.
According to the estimation results, the construction of national and provincial economic development zones can increase the labor income share of enterprises in those zones. In addition, comparing the and coefficients shows that the construction of national economic development zones increases the labor income share of enterprises in the zone to a greater degree than the construction of provincial economic development zones (In Model 4, the coefficient of is almost twice the size of ). The heterogeneity estimates for economic development zones indicate that the construction of national and provincial economic development zones can increase the labor income share of enterprises in the zone, but the impact of economic development zones on labor income shares changes with the economic development zone level. This occurs due to the different levels of economic development zones, and the intensity of their policy dividends also changes. National economic development zones have greater policy dividends, so their ability to attract enterprises is also stronger, which makes national economic development zones better than provincial economic development zones in terms of the number and quality of their constituent enterprises. Secondly, the government also invests more resources into the construction and maintenance of various infrastructures in economic development zones. Therefore, the agglomeration effect in national economic development zones is also stronger. Finally, because the political and social impacts of national economic development zones are greater than those of provincial economic development zones, national economic development zones receive more attention from their mayors. Based on the production and operations of the enterprises in the economic development zone and the stable operation of the local society, the government invests more resources in national economic development zones to build the labor market in that zone and strengthen its labor protections. To summarize, under the actions of stronger “agglomeration effects” and “policy effects”, the construction of national economic development zones has a stronger effect on increasing labor income shares than the construction of provincial economic development zones. Therefore, the impact of economic development zone construction on the labor income share is heterogeneous between economic development zones.
5.3.2. Regional Heterogeneity
There are obvious regional differences in China’s economic development. From the perspective of industrial development, there are many technology-intensive eastern enterprises, capital-intensive central enterprises, and labor-intensive western enterprises. The production characteristics of different types of enterprises are quite different. On the one hand, from the perspective of the quality of labor input in production, the human capital level of employees in technology-intensive enterprises, capital-intensive enterprises, and labor-intensive enterprises has decreased. The lower the human capital, the weaker the bargaining power of employees. On the other hand, from the perspective of the amount of labor input in the production process of enterprises, technology-intensive and capital-intensive enterprises have less labor input, and labor-intensive enterprises have more labor input. Therefore, from the perspective of the government, to maintain social stability and promote employment, more labor-intensive areas experience stronger government protection of their local labor force, thus strengthening the labor bargaining power of enterprise employees. In addition, the endowments of the eastern, central, and western regions are different. Compared to the central and eastern regions, the western region lacks capital and has a richer labor force. Therefore, it is possible that a “strong capital and weak labor” phenomenon may occur in this region, thus reducing the bargaining power of employees. Our article divides China into three major regions, eastern, central, and western, according to their states of economic development. Sub-sample regression was then conducted to examine the heterogeneity of the area where each economic development zone is located. Table 5 reports the estimated results of regional heterogeneity. From Table 5, it can be found that the coefficients of the eastern, central, and western variables are all significantly positive at a significance level of 5%, which indicates that the construction of the economic development zones in the eastern, central, and western regions has increased the labor income share of the enterprises in their economic development zones. Based on the results of the heterogeneous estimation, it can be concluded that the construction of economic development zones in different regions of the country can effectively improve income distribution and increase the labor income share, which has increased the labor income share of enterprises in the eastern, central, and western economic development zones by 2.54%, 0.98%, and 2.45%, respectively. The coefficient of heterogeneity estimation shows that the establishment of the development zone has a better effect on increasing the labor income share in the eastern and western regions. This is because most enterprises located in the western region are labor-intensive. Due to the local government’s emphasis on employment issues, the establishment of the development zone effectively reduce the friction of the labor market and improve the wage negotiation capacity of the local labor force. The eastern region with the most developed economy has a higher level of human capital, so the establishment of the development zone can more effectively improve the bargaining power of wages. The above reasons make the establishment of development zones in the eastern and western regions more effective in increasing the labor income share.
5.4. Robustness Test
5.4.1. Changing the Calculation and Estimation Method for the Labor Income Share
The empirical part above uses intertemporal panel data from 2001–2007 and 2011–2013. Limited by the availability of indicators, the “wage payable” for a given year was used to measure labor income. In order to ensure robustness, the data for 2001–2007 were used instead, and the calculation method for labor income was changed to “wages payable + welfare expenses + labor unemployment insurance”, and the changed labor income share (ls1) calculation method (we reported calculation method in Table 1). The empirical results are shown in Table 6. The results show that the P × T coefficient in the benchmark regression is still significantly positive at a significance level of 5%. For regression of the economic development zone level of heterogeneity, the CP × T and PP × T coefficients are still significantly positive at a significance level of 5%, and the construction of the national economic development zones has a more significant impact on increasing the labor income share. From the perspective of regional heterogeneity, the construction of economic development zones in the eastern, central, and western regions can increase the labor income share of enterprises in their respective zones. Thus, after replacing the indicators, the empirical results of the benchmark model and the heterogeneity estimation still show that the establishment and construction of economic development zones significantly increased the labor income share of the enterprises in economic development zones. Therefore, the core conclusions of our article are not affected by calculating the indicators. We also used quantile regression, and the regression results show that the conclusion of our paper has not changed (Results are reported in Appendix A). Because regional characteristics, such as lobbying ability, are usually related to the level of local economic development, we choose per capita GDP as a proxy variable for regional characteristics. Results are reported in Appendix A. The robustness of the conclusions of our paper has not changed. We made a histogram of propensity scores after matching (Results are reported in Appendix A). After matching, the probability distribution of the PS values of the two groups of samples is small, and there is a significant approaching trend, indicating that the matching process significantly corrects the deviation of the PS values of the two groups of samples, the matching effect is ideal, and common support hypothesis is verified. We also used the trimming rules to test the robustness of the model. We trimmed observations in the treated group with propensity scores larger than the maximum value of the propensity score in the non-treated group. The estimation result (results are reported in Appendix A) after using the trimming rule is consistent with not using.
5.4.2. Parallel Trend Test
Our paper uses a parallel trend test to test whether the model in our paper meets the common trend assumptions. In our article, if the labor income share between the control group (non-development zone enterprise) and the processing group (development zone enterprise) is different before the establishment of the development zone, the trend of the labor income share of the control group and the processing group should be consistent, which means that the difference in the labor income share between the control group and the treatment group is not caused by the establishment and construction of the development zone, so a parallel trend test is needed. In order to carry out this parallel trend test, our paper adds a series of dummy variables that characterize the year to evaluate the dynamic effects of the establishment of development zones based on Equation (4). We use the following equation as a test:
Since the establishment and construction of development zones is a continuous process, our article examines the dynamic effects of the first four periods of policy implementation compared to the third period after policy implementation (). Taking the year when the development zone was established (2006) as the base period (year = 0), Figure 1 depicts the values of to with a 95% confidence interval. The abscissa indicates the year from the establishment of the development zone, and the current indicates the year when the policy was implemented (i.e., 2006). Because the data after 2007 in our article are presented after intertemporal matching from 2011 to 2013, the horizontal axes after 1, after 2, and after 3 refer to , , and , which measure the dynamic effects of the development zone policies in 2007, 2011, and 2012, respectively. Figure 1 shows that before the establishment of the development zone, none of the coefficients were significantly different to 0 (the 95% confidence interval indicated by the dashed line contains a value of 0), and after the establishment of the development zone, the policies were significantly different from 0 at a 5% confidence level. This shows that the labor income share effect of the establishment and construction of development zones began to manifest after their establishment. In addition, we can view the result of the estimation following Equation (3) from Table 3. In Table 3, all of the coefficients of the explanatory variables P × T appear to be significantly positive at a significance level of 5%, indicating that the establishment and construction of economic development zones help increase the labor income share of the enterprises in economic development zones. Both methods indicate that the establishment of the development zone has increased the share of labor income. Therefore, the conclusions obtained by using the two methods in this paper are consistent.
In addition, the change in labor income share is affected by factors such as biased technological progress, profitability, and corporate monopoly capabilities. The above factors change continuously with the development of the enterprise. As panel data are used in this article, if these variables are not controlled, the estimation results are unstable. Hence, the common trend assumption plausible after controlling for X.
5.4.3. Plausibility of Identifying Assumptions
This article assumes that the establishment of the development zone has increased the labor income share of the enterprises in the development zone. In terms of policy interference, we can be sure that no other policies around 2006 interfere with the empirical results of this article. The theoretical analysis assumes that, compared with enterprises outside the development zone, the development zone policy has increased the labor income share of enterprises in the development zone through the “agglomeration effect” and “policy effect”. This assumption has also been proved in the analysis of the mediating effect. Agglomeration effects and policy effects can only affect enterprises located in development zones. Newly established development zones are often established in the suburbs of cities. For ease of management, the government does not allow other industrial enterprises to be established near the development zones. Labor loss in non-development zone enterprises is very weak. There is no existence of the phenomenon of a lot of worker transfer to enterprises in the development zone from firms in non-economic development zones in any area. Hence, the impact of labor mobility can be ignored. Therefore, SUTVA (stable unit treatment value assumption) can be satisfied.
6. Mechanism Test
For the theoretical analysis, our paper argues that the establishment and construction of economic development zones affect the share of labor income through two mechanisms: The “agglomeration effect” and the “policy effect”. The following section tests whether the establishment of an economic development zone affects the share of labor income through the above mechanisms.
6.1. Agglomeration Effect
The establishment of economic development zones first promotes the spatial agglomeration of enterprises. Based on the theoretical analysis, we argue that the “agglomeration effect” of enterprises mainly reduces labor market friction by generating labor pools, which promote enterprises to become more inclined to include labor in the production process. Enterprises located in the economic development zones are all industrial enterprises, and the production of industrial enterprises has the following characteristics. Due to the fluctuations in the production of industrial enterprises, such enterprises tend to rely on overtime and hiring temporary employees during peak periods of production. According to the theoretical analysis, it can be concluded that the “agglomeration effect” can effectively reduce the employment costs of temporary employees and facilitate the recruitment of more temporary employees during peak periods to ensure product supply. Therefore, the “agglomeration effect” can be reflected by the use of temporary employees in enterprises [26].
In addition, all full-time employees and temporary employees in an enterprise can receive wages, but welfare payments and labor unemployment insurance are only given to full-time employees, so the differences between the wages payable minus the sum of welfare costs and labor unemployment insurance costs can be used as a measure of the temporary employee index. Referring to the ideas of Li et al. [26], temporary employees (temp) is used as an intermediate variable to measure the “agglomeration effect”. The calculation method for this variable is as follows: ln (payable wages—welfare costs—labor unemployment insurance premiums). Then, we construct a mediation effect model to test the impact mechanism of the “agglomeration effect”. We use Equations (6) and (7) to test the mediation effect of temporary employees (temp) in economic development zones. Our mediation effect test Equations (6)–(9) are set with reference to Baron and Kenny [29]. In Equations (6) and (7), we first need to pay attention to in Equation (6). If is significantly positive, it means that the establishment of the development zone indeed increase the number of temporary employees of enterprises in the development zone. Then we need to pay attention to and in Equation (7). When is significantly positive, it means that an increase in number of temporary employees significantly increase labor share. When both and are significantly positive, it means that the increase in labor share is conducted through the number of temporary employees to labor share. The mediation effect test passed. In particular, if both and are significantly positive, part of the reason for the increase in labor share is the increase in number of temporary employees (there is a partial mediation effect). When is significant but is not significant, it means that the improvement of labor share is completely achieved by an increase in the number of temporary employees (there is a complete mediating effect). The analysis process of Equations (6) and (7) is consistent with (8) and (9).
The test results of the mediation effect are shown in Table 7. Based on Model 13, the coefficient of temp is significantly positive at a significance level of 5%, which indicates that the establishment and construction of an economic development zone can indeed create greater employment in the economic development zone. Temporary employees contribute to the formation of the “agglomeration effects” in economic development zones.
Model 14 shows that the coefficients of temp and P × T are significantly positive at a significance level of 5%. This reveals that the employment of more temporary employees can increase a company’s labor income share because hiring temporary employees is the quickest and lowest cost productivity adjustment method when companies face fluctuations in product demand. Although the wages of temporary workers are not very different from those of long-term employees, the cost of hiring temporary employees has biased companies, as more labor factors are included in production to cope with fluctuations in product demand, thus increasing the labor income share. Using Models 13 and 14, it can be argued that there is an intermediary effect of temporary employees in the establishment and construction of economic development zones. Therefore, the mechanism by which the “agglomeration effect” for the establishment and construction of economic development zones increases the share of labor income has been verified. According to the previous theoretical analysis, this “policy effect” can be reflected in the government’s subsidy policies and tax incentives for enterprises in the establishment and construction of economic development zones. Our article uses the data for the “subsidy income” of the enterprises in the database as an intermediate variable representing government subsidies as “policy effects”.
6.2. Policy Effect
According to the previous theoretical analysis, the “policy effect” can be reflected in the government’s subsidy policies and tax incentives for enterprises in the establishment and construction of economic development zones. Our paper uses the data for the “subsidy income” of the enterprises in the database as an intermediate variable representing government subsidies as “policy effects”. Since some companies included in the industrial enterprise data did not receive government subsidies, and because our article added enterprise scale to the control variable to control for the scale effect of the enterprises, the calculation method for government subsidy (sub) is set to “Ln (subsidy income) +1)”. Tax incentives are calculated as “taxable income/total profits”. Then, we construct a mediating effect model to verify the “policy effect”. We use Equations (8) and (9) to test the mediating effect of the government subsidy (sub):
The empirical results of Model 15 show that enterprises in economic development zones receive more government subsidies than enterprises outside economic development zones. In Model 16, the coefficients of sub and P × T are both significantly below 5%, which indicates that the increase in government subsidies has indeed increased the labor income share of enterprises. This occurs because the government’s recruitment and employment subsidies for enterprises have reduced the cost of employment for enterprises, making them more inclined to include labor in their production. At the same time, the government’s support for the skills training of enterprise employees and the protection of the labor force in the economic development zone have increased the bargaining power of labor in the economic development zone, thereby increasing the labor income share. Combining Models 15 and 16 shows that there is an intermediary effect of government subsidies on the establishment and construction of economic development zones (the reason why R2 of the estimation result of Model 15 is too low is that we need to ensure that the control variables are consistent with the second stage).
Tax incentives use the income tax burden as an intermediary variable to represent tax incentives in the “policy effect”. Our paper uses “incometax = income tax payable/operating profits” to represent the corporate income tax burden.
Only the income tax burden is selected as the intermediary variable because the data empirically analyzed in our paper are taken from the Chinese industrial enterprise databases for 2001–2007 and 2011–2013, which are also the periods when China’s VAT reform was gradually implemented. China’s value-added tax reform began in the Northeast region on 1 July 2004. Heilongjiang Province, Jilin Province, Liaoning Province, and Dalian City are engaged in equipment manufacturing, the petrochemical industry, metallurgy, and shipbuilding. Further, automotive VAT taxpayers in the manufacturing and agro-processing industries have begun reforming their VAT systems. Subsequently, military enterprises and some high-tech enterprises in the Northeast region were also included in the scope of the value-added tax reform. During this period, the deduction details also experienced several changes.
The VAT reform was carried out in different industries in different regions around 2006, which is the policy shock year selected for the establishment and construction of economic development zones in this paper.
Therefore, it is difficult to use an intermediary effect model to identify whether the VAT burdens of enterprises are affected by the establishment of development zones. Therefore, our paper uses the income tax burden as the mediating variable for tax preferences as a “policy effect”.
We use Equations (10) and (11) to test the intermediary effects. Since the collection of Chinese corporate income tax was also reformed in 2008, the main reform goal is to unify the statutory income tax rates of domestic and foreign-funded enterprises. In order to ensure robustness, this paper uses the 2001–2007 sample and the 2001–2007 (plus the inter-period) sample from 2011–2013 to perform a regression during the mediation effect test.
The result of mediation effect test shows in Table 8. Models 17 and 18 use samples from 2001–2007, and Models 19 and 20 use samples from 2001–2007 plus 2011–2013. The P × T coefficients in Models 17 and 19 are not significant at a significance level of 10%, which indicates that the establishment of economic development zones has not significantly reduced the income tax burden of enterprises in those zones. This may be due to the fact that income tax incentives are a common policy for local governments to attract investments. As a result, companies outside economic development zones may also enjoy tax benefits to varying degrees. Moreover, different local governments may provide taxation in the process of attracting investment. The range of preferences is also different, which ultimately prevents the establishment of a development zone from significantly affecting the income tax burden of the enterprises in that zone. The coefficients of corporate income tax in Models 18 and 20 are both significantly positive, indicating that an increase in the corporate income tax burden indeed prompt enterprises to use labor instead of capital and increase the labor income share. This result is in line with the conclusions of Qingwang and Bingyang [20]. In addition, the coefficients of P × T in Models 18 and 20 are still significantly positive, which also proves the conclusions of benchmark regression in this paper: The establishment and construction of economic development zones have increased the labor income share of enterprises in economic development zones.
7. Conclusions
Considering the serious damage of income inequality to sustainable development [30,31], this paper examines the impact of China’s establishment of economic development zones on China’s income distribution. Based on the typical fact that a large number of national and provincial economic development zones were newly established in 2006, this paper systematically evaluated the micro effects of the establishment of economic development zones on the enterprises. Moreover, we also expand the literature on labor income shares. Our paper used the establishment and construction of the economic development zone in 2006 as a quasi-natural experiment to evaluate its impact on the share of labor income. In order to deal with the selection bias and the endogenous problem of samples as much as possible, the double-difference based on sample tendency matching (PSM-DID) method was used to identify causality. The results show that, on the whole, the establishment and construction of economic development zones have a positive impact on the share of the labor income of enterprises, that is, the establishment and construction of economic development zones improve the share of the labor income of enterprises in those development zones. These developments mainly improve the share of labor income through the “agglomeration effect” and “policy effect”.
The policy implications of this article are as follows. We think that it is necessary to appropriately expand the policy objectives of the establishment and construction of development zones and increase the labor income share of enterprises through the establishment and construction of economic development zones. Local governments should strengthen employment support and protection for local labor. The “policy effect” test results in this article show that the government’s employment support and protection of labor force in the economic development zone can effectively increase the labor income share, but these actions should not be treated differently between enterprises in the economic development zone and enterprises outside the zone. The research in our paper is limited by the availability of data. The following limitations still exist: The data used is not up-to-date, and the measures of agglomeration effects are not straightforward. In future research, the economic impact of the development zone should be further extended to the framework of China’s urbanization construction.
Author Contributions
Writing—original draft, Z.L.; writing—review & editing, Y.Y. All authors have read and agreed to the published version of the manuscript.
Funding
This research was funded by the National Social Science Foundation of China (no.18AJL002) and the research base of humanities and social science in Chinese Ministry of Education (no. 14JJD790042).
Conflicts of Interest
The authors declare no conflict of interest.
Appendix A

Table A1.
Marginal effects of the propensity score model.
| Variables | Period after Development Zone Established | |||
|---|---|---|---|---|
| 1. | 2. | 3. | 4. | |
| ky | 0.0002 *** | 0.0001 *** | 0.0001 *** | 0.0004 *** |
| (0.0000) | (0.0000) | (0.0000) | (0.0000) | |
| profitrate | −1.6188 *** | −1.7466 *** | −1.8680 *** | −1.6467 *** |
| (0.1960) | (0.1275) | (0.1398) | (0.1980) | |
| debtrate | 0.0102 *** | 0.0113 *** | 0.0213 *** | 0.0289 *** |
| (0.0009) | (0.0008) | (0.0006) | (0.0012) | |
| scale | 0.1771 *** | 0.2530 *** | 0.2392 *** | 0.1535 *** |
| (0.0184) | (0.0192) | (0.0205) | (0.0180) | |
| age | −0.2312 *** | −0.3039 *** | −0.3787 *** | −0.2959 *** |
| (0.0130) | (0.0158) | (0.0220) | (0.0138) | |
| age2 | 0.0029 *** | 0.0038 *** | 0.0051 *** | 0.0037 *** |
| (0.0002) | (0.0003) | (0.0005) | (0.0003) | |
| Pseudo R2 | 0.1001 | 0.1605 | 0.2240 | 0.1449 |
| Observations | 23,261 | 20,269 | 19,876 | 19,823 |
Note: The values in parentheses are robust standard errors; *** indicate significance levels of 1%, respectively. Each Probit regression estimates the conditional probability to be enterprises in the development zone before the establishment of the development zone. We estimate separate regressions for each time period.
Figure A1.
Distribution of the propensity score.

Table A2.
Robustness test with regional features added.
| Variables | (1) | (2) | (3) | (4) |
|---|---|---|---|---|
| Model 1 | Model 2 | Model 3 | Model 4 | |
| 0.0023 ** | 0.0153 *** | 0.0114 *** | 0.0251 *** | |
| (0.0010) | (0.0010) | (0.0013) | (0.0012) | |
| Per capita GDP | −0.0003 *** | −0.0002 *** | −0.0001 *** | −0.0001 *** |
| (0.0000) | (0.0000) | (0.0000) | (0.0000) | |
| Control variable | No | Yes | No | Yes |
| Firm fixed effect | No | No | Yes | Yes |
| Year fixed effect | No | No | Yes | Yes |
| Observations | 185,835 | 185,544 | 185,835 | 185,544 |
| 0.0007 | 0.2198 | 0.0131 | 0.2125 |
Note: The values in parentheses are robust standard errors; *** and ** indicate significance levels of 1%and 5%, respectively. R2 reported by the fixed-effects model is R2 within the group.
Figure A2.
Histogram of the propensity score after matching.

Table A3.
Robustness checks of trimming rules.
| Variables | ls | ls |
|---|---|---|
| 0.0091 *** | 0.0213 ** | |
| (0.0042) | (0.0011) | |
| Control variable | Yes | Yes |
| Firm fixed effect | No | Yes |
| Year fixed effect | No | Yes |
| Observations | 173,849 | 173,849 |
| 0.1904 | 0.2303 |
Note: The values in parentheses are robust standard errors; *** and ** indicate significance levels of 1% and 5%, respectively. The R2 reported by the fixed-effects model is the R2 within the group.
Table A4.
Quantile Regressions Results toward the Impact of Development Zone Construction.
| Quantile | 0.2 | 0.4 | 0.6 | 0.8 |
|---|---|---|---|---|
| 0.001 *** | 0.012 *** | 0.019 *** | 0.01 *** | |
| 0.0011 | 0.0097 | 0.0012 | 0.00116 | |
| Control variable | Yes | Yes | Yes | Yes |
| Pseudo R2 | 0.15 | 0.24 | 0.31 | 0.21 |
Note: The values in parentheses are robust standard errors; *** indicate significance levels of 1%, respectively.
References
- Bom, P.; Goti, A. Public Capital and the Labor Income Share. Sustainability 2018, 10, 3895. [Google Scholar] [CrossRef] [Green Version]
- Piketty, T.; Yang, L.; Zucman, G. Capital Accumulation, Private Property, and Rising Inequality in China, 1978–2015. Am. Econ. Rev. 2019, 109, 2469–2496. [Google Scholar] [CrossRef] [Green Version]
- Karabarbounis, L.; Neiman, B. The Global Decline of the Labor Share. Q. J. Econ. 2013, 129, 61–103. [Google Scholar] [CrossRef] [Green Version]
- Wu, J.; Deng, Y.; Huang, J.; Morck, R.; Yeung, B.Y. Incentives and Outcomes: China’s Environmental Policy; Capitalism & Society: New York, NY, USA, 2014; Volume 9, pp. 1–41. [Google Scholar]
- Zheng, S.; Kahn, M.E.; Sun, W.; Luo, D. Incentives for China’s urban mayors to mitigate pollution externalities: The role of the central government and public environmentalism. Reg. Sci. Urban Econ. 2014, 47, 61–71. [Google Scholar] [CrossRef]
- Wang, J. The economic impact of Special Economic Zones: Evidence from Chinese municipalities. J. Dev. Econ. 2013, 101, 133–147. [Google Scholar] [CrossRef]
- Alder, S.; Shao, L.; Zilibotti, F. Economic reforms and industrial policy in a panel of Chinese cities. J. Econ. Growth 2016, 21, 305–349. [Google Scholar] [CrossRef]
- Cheng, L.; Kwan, Y.K. The location of foreign direct investment in Chinese regions: Further analysis of labor quality. In The Role of Foreign Direct Investment in East Asian Economic Development; University of Chicago Press: Chicago, IL, USA, 2000; pp. 213–238. [Google Scholar]
- Ham, J.C.; Swenson, C.; Song, H.; Imrohoroğlu, A. Government programs can improve local labor markets: Evidence from State Enterprise Zones, Federal Empowerment Zones and Federal Enterprise Community. J. Public Econ. 2011, 95, 779–797. [Google Scholar] [CrossRef]
- Neumark, D.; Kolko, J. Do enterprise zones create jobs? Evidence from California’s enterprise zone program. J. Urban Econ. 2010, 68, 1–19. [Google Scholar] [CrossRef]
- Dorn, D.; Katz, L.F.; Patterson, C.; Van Reenen, J. Concentrating on the Fall of the Labor Share. Am. Econ. Rev. 2017, 107, 180–185. [Google Scholar] [CrossRef] [Green Version]
- Azmat, G.; Manning, A.; Van Reenen, J. Privatization, Entry Regulation and the Decline of Labor’s Share of Gdp: A Cross-Country Analysis of the Network Industries; Centre for Economic Policy Research: London, UK, 2007. [Google Scholar]
- Fichtenbaum, R. The Impact of Unions on Labor’s Share of Income: A Time-Series Analysis. Rev. Polit. Econ. 2009, 21, 567–588. [Google Scholar] [CrossRef]
- Acemoglu, D. Directed Technical Change. Rev. Econ. Stud. 2002, 69, 781–809. [Google Scholar] [CrossRef] [Green Version]
- Acemoglu, D.; Restrepo, P. The Race between Man and Machine: Implications of Technology for Growth, Factor Shares, and Employment. Am. Econ. Rev. 2018, 108, 1488–1542. [Google Scholar] [CrossRef] [Green Version]
- Li, H.; Li, J.; Lu, Y.; Xie, H. Housing wealth and labor supply: Evidence from a regression discontinuity design. J. Public Econ. 2020, 183, 104139. [Google Scholar] [CrossRef]
- Salari, M.; Javid, R.J. How does female labor force participation impact on housing values? Res. Econ. 2019, 73, 129–137. [Google Scholar] [CrossRef]
- Fu, S.; Liao, Y.; Zhang, J. The effect of housing wealth on labor force participation: Evidence from China. J. Hous. Econ. 2016, 33, 59–69. [Google Scholar] [CrossRef] [Green Version]
- Aghion, P.; Akcigit, U.; Howitt, P. Lessons from Schumpeterian Growth Theory. Am. Econ. Rev. 2015, 105, 94–99. [Google Scholar] [CrossRef]
- Guo, Q.; Lü, B. On the Effects of Factor Income Distribution on the Residents’ Income Distribution. Soc. Sci. China 2012, 12, 46–62. [Google Scholar]
- Zhao, Q.; Zhang, J. The Evolution and the Driving Mechanism of Labor Share in China. J. Financ. Econ. 2013, 12, 44–56. [Google Scholar]
- Yang, Z. The Incidence of the Enterprise Income Tax in China. J. Quan. Tech. Econ. 2008, 4, 131–141. [Google Scholar]
- Wang, C.; Mao, X. An Analysis of Labor Shortage in Chinese Private Enterprises under the Era of Post-Crisis. Econ. Theory Bus. Manag. 2010, 4, 74–79. [Google Scholar] [CrossRef]
- Kim, S. Labor heterogeneity, wage bargaining, and agglomeration economies. J. Urban Econ. 1990, 28, 160–177. [Google Scholar] [CrossRef]
- Brandt, L.; Van Biesebroeck, J.; Zhang, Y. Creative accounting or creative destruction? Firm-level productivity growth in Chinese manufacturing. J. Dev. Econ. 2012, 97, 339–351. [Google Scholar] [CrossRef] [Green Version]
- Li, B.; Wu, L. Development Zone and Firms’ Growth: Research on Heterogeneity and Mechanism. China Ind. Econ. 2018, 4, 79–97. [Google Scholar] [CrossRef]
- Heyman, F.; Sjöholm, F.; Tingvall, P.G. Is there really a foreign ownership wage premium? Evidence from matched employer–employee data. J. Int. Econ. 2007, 73, 355–376. [Google Scholar] [CrossRef] [Green Version]
- Abadie, A.; Drukker, D.; Herr, J.L.; Imbens, G.W. Implementing Matching Estimators for Average Treatment Effects in Stata. Stata J. Promot. Commun. Stat. Stata 2004, 4, 290–311. [Google Scholar] [CrossRef] [Green Version]
- Baron, R.M.; Kenny, D.A. The moderator–mediator variable distinction in social psychological research: Conceptual, strategic, and statistical considerations. J. Personal. Soc. Psychol. 1986, 51, 1173. Available online: http://www.public.asu.edu/~davidpm/classes/psy536/Baron.pdf (accessed on 11 March 2020). [CrossRef]
- Socol, C.; Marinas, M.; Socol, A.G.; Armeanu, D. Ştefan Fiscal Adjustment Programs versus Socially Sustainable Competitiveness in EU Countries. Sustainability 2018, 10, 3390. [Google Scholar] [CrossRef] [Green Version]
- Tirado, A.A.; Morales, M.R.; Lobato-Calleros, O. Additional indicators to promote social sustainability within government programs: Equity and efficiency. Sustainability 2015, 7, 9251–9267. [Google Scholar] [CrossRef] [Green Version]
Figure 1.
Parallel trend test.
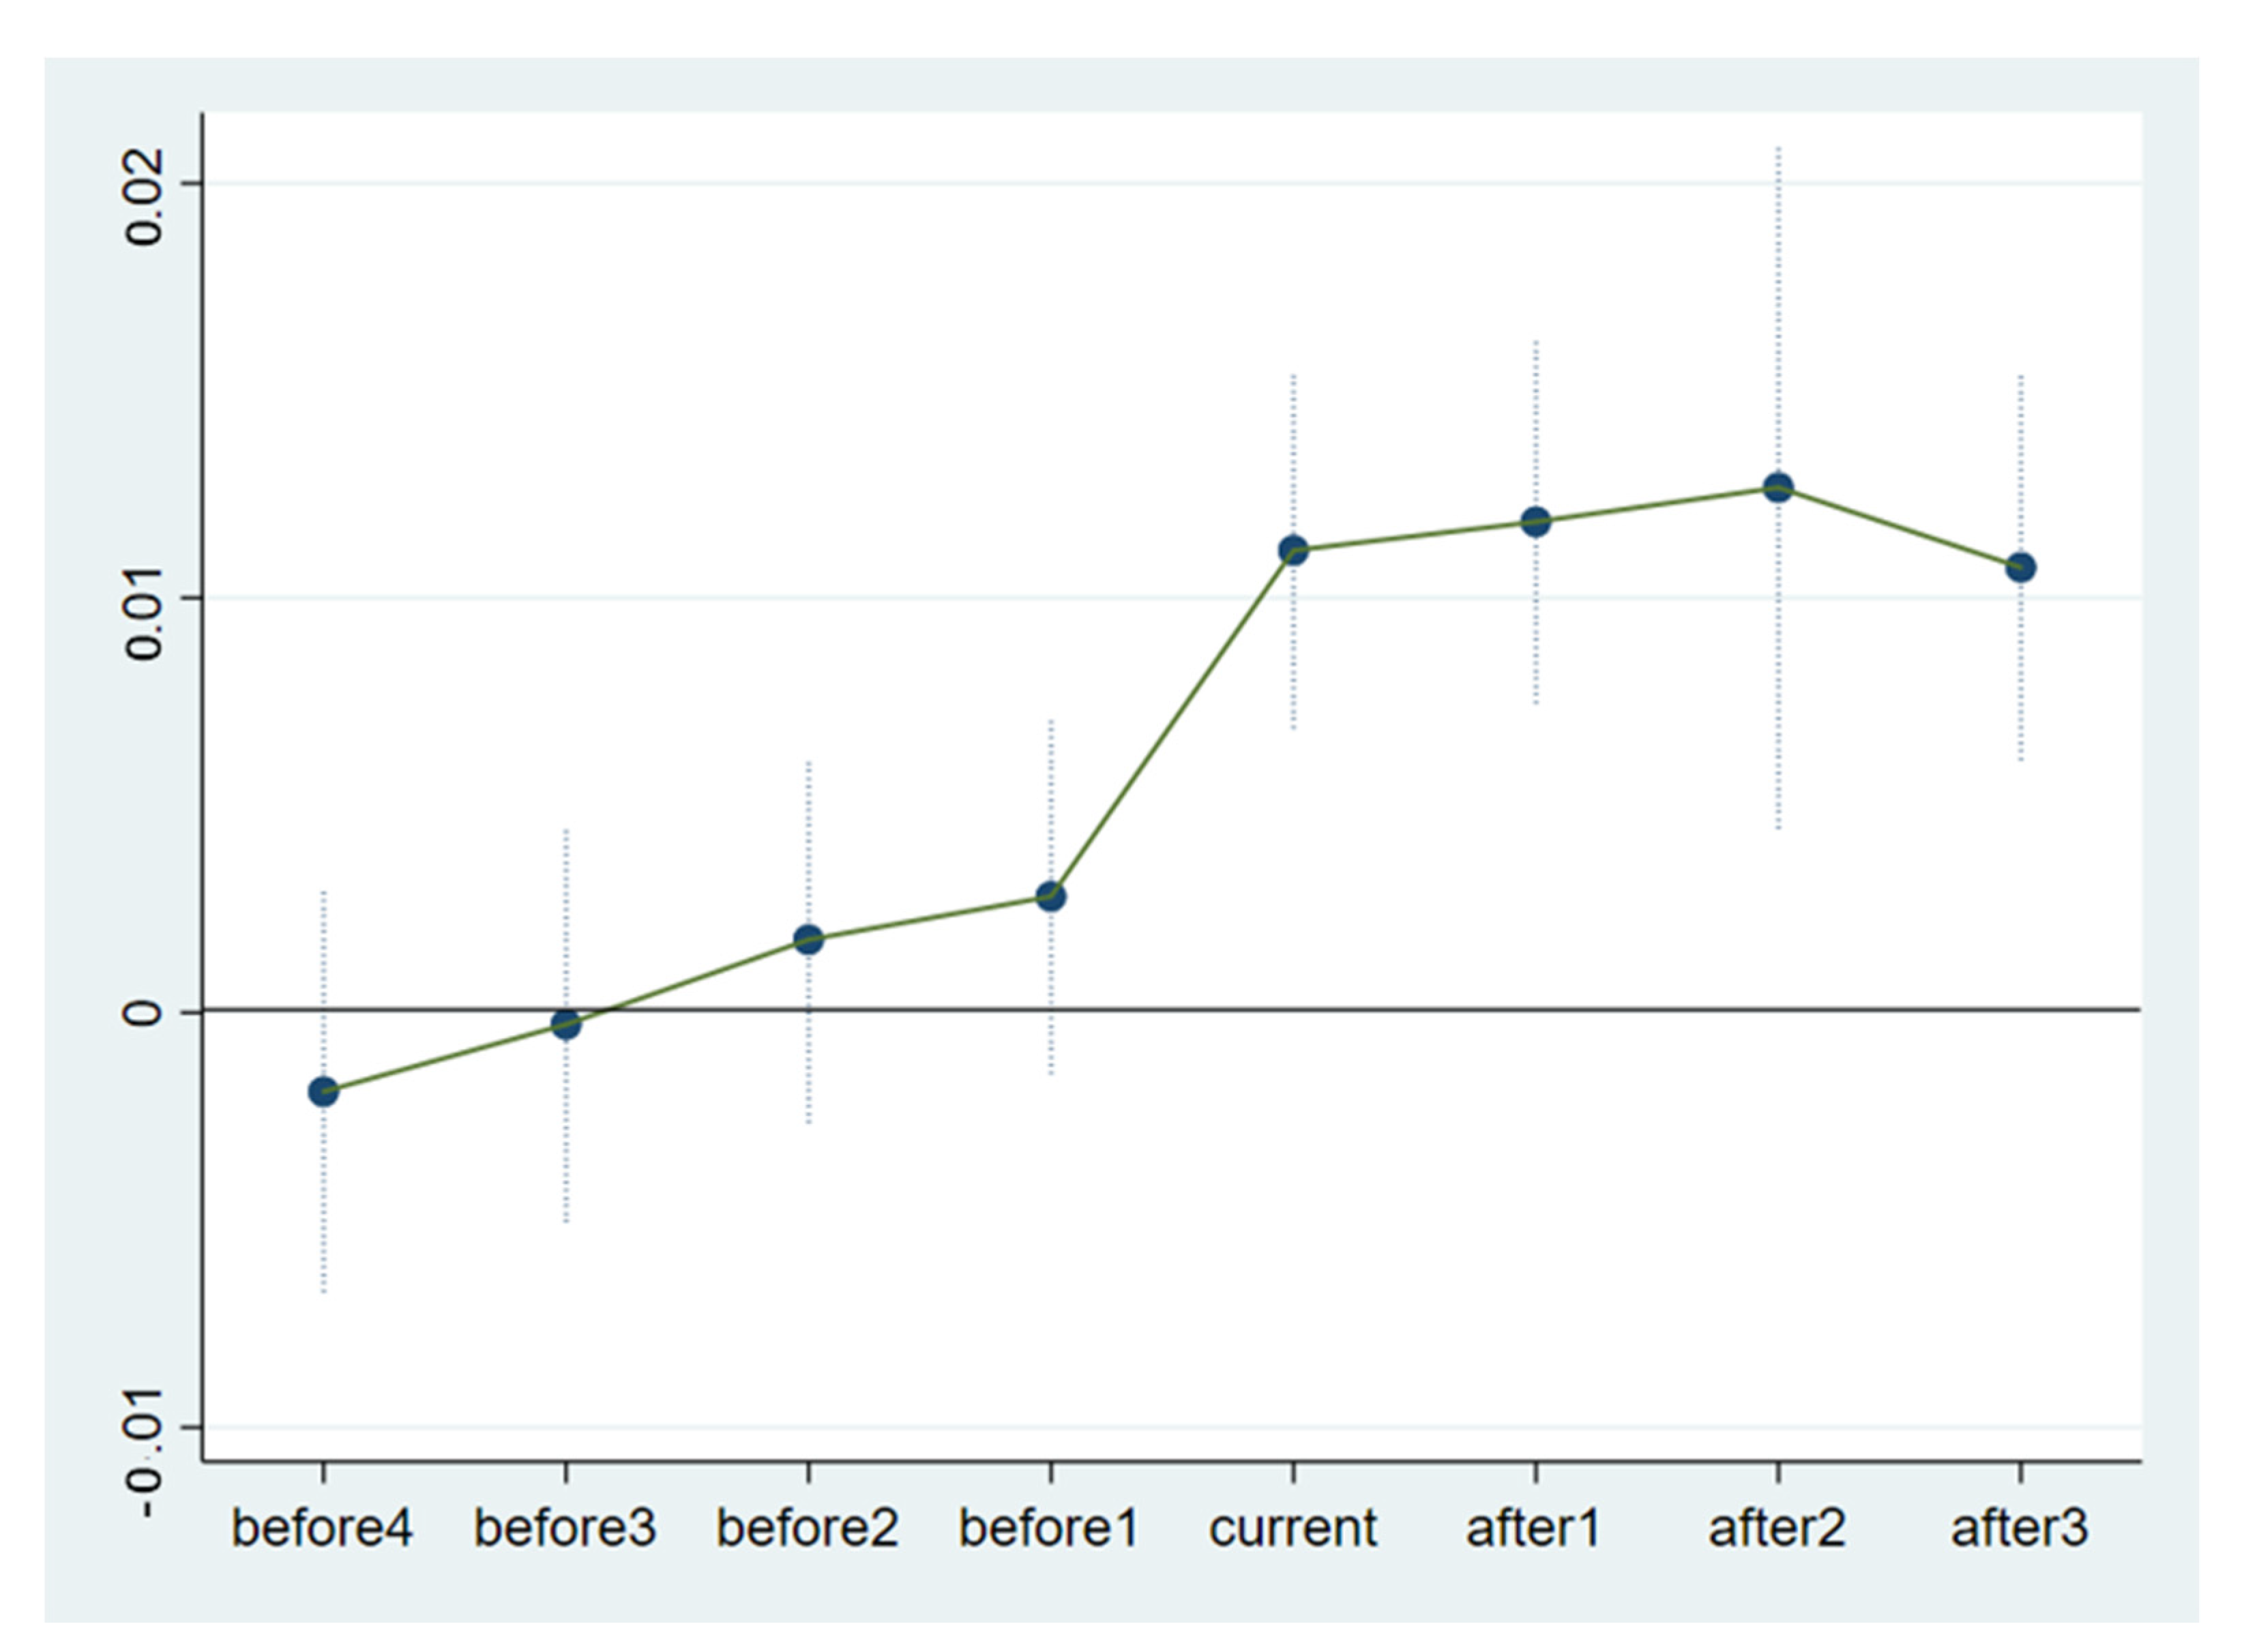
Table 1.
Variable description.
| Variables | Economic Meaning | Calculation Method |
|---|---|---|
| ky | the capital-output ratio | total fixed assets/value-added |
| profitrate | the profit rate | profit/income |
| debtrate | the debt ratio | debt/rotal fixed assets |
| scale | the enterprise scale | log(total fixed assets) |
| markup | the monopoly power | (main business income, main business cost)/(main business income) |
| ls | the labor share | wages payable/(wages payable + operating profit + current year depreciation + interest + principal business taxes and surcharges + value added tax + taxes in management expenses) |
| ls1 | the labor share(used for robustness testing) | (payable wages + welfare expenses + labor unemployment insurance)/(payable wages+ welfare expenses + labor unemployment insurance + operating profit + Current depreciation + interest + principal business taxes and surcharges + value-added tax + taxes in management expenses) |
Table 2.
Propensity score matching balance test results.
| Variables | Mean | Standardized Differences (%) | Reduced Standardized Differences (%) | T Statistic | t Test p > |t| | ||
|---|---|---|---|---|---|---|---|
| Treatment Group | Control Group | ||||||
| ky | Before | 116.48 | 111.91 | 2.6 | 90.4 | 2.62 | 0.009 |
| After | 116.37 | 116.81 | −0.2 | −0.17 | 0.863 | ||
| profitrate | Before | 0.08643 | 0.11402 | −20.4 | 98.8 | −17.8 | 0.000 |
| After | 0.08643 | 0.08612 | 0.2 | 0.22 | 0.828 | ||
| debtrate | Before | 0.5272 | 0.53333 | −2.5 | 75.0 | −2.48 | 0.013 |
| After | 0.52719 | 0.52566 | 0.6 | 0.47 | 0.640 | ||
| scale | Before | 10.317 | 10.274 | 3.5 | 67.7 | 3.46 | 0.001 |
| After | 10.316 | 10.303 | 1.1 | 0.83 | 0.404 | ||
| age | Before | 6.43 | 9.4565 | −37.3 | 98.6 | −30.76 | 0.000 |
| After | 6.4306 | 6.474 | −0.5 | −0.57 | 0.571 | ||
| age2 | Before | 69.328 | 192.95 | −23.4 | 93.0 | −17.77 | 0.000 |
| After | 69.334 | 78.005 | −1.6 | −0.66 | 0.511 | ||
Table 3.
Descriptive statistics.
| Variables Names | Variables | Observations | Mean | Standard Deviation | Minimum Value | Maximum Value |
|---|---|---|---|---|---|---|
| Labor income share | ls | 185,835 | 0.3666 | 0.1483 | 0.091 | 0.694995 |
| policy processing effect | 185,835 | 0.1275 | 0.3335 | 0 | 1 | |
| Markup | markup | 185,829 | 0.1513 | 0.1103 | −7.8 | 1 |
| Capital–output ratio | ky | 185,550 | 111.8710 | 157.2866 | 1.9 | 1040.655 |
| Profit margin | profitrate | 185,835 | 0.0889 | 0.1036 | 0.000071 | 0.5766641 |
| Debt ratio | debtrate | 185,835 | 0.5297 | 0.2384 | 0.023 | 0.9517607 |
| Enterprise size | scal | 185,829 | 10.4320 | 1.2453 | 8.5 | 14.16833 |
Table 4.
Benchmark model and level heterogeneity estimation results.
| Variables | (1) | (2) | (3) | (4) |
|---|---|---|---|---|
| Model 1 | Model 2 | Model 3 | Model 4 | |
| 0.0247 *** | 0.0109 *** | |||
| (0.0009) | (0.0012) | |||
| 0.0174 | 0.0406 *** | |||
| (0.0116) | (0.0138) | |||
| 0.0248 *** | 0.0108 *** | |||
| (0.0009) | (0.0012) | |||
| Control variable | Yes | Yes | Yes | Yes |
| Firm fixed effect | No | Yes | No | Yes |
| Year fixed effect | No | Yes | No | Yes |
| Observations | 185,544 | 185,544 | 185,544 | 185,544 |
| 0.2198 | 0.2125 | 0.2198 | 0.2125 |
Note: The values in parentheses are robust standard errors; *** indicate significance levels of 1%. R2 reported by the fixed-effects model is the R2 within the group.
Table 5.
Regional heterogeneity estimation results.
| Variables | (5) | (6) | (7) |
|---|---|---|---|
| Model 5 | Model 6 | Model 7 | |
| East | Central | West | |
| 0.0254 *** | 0.0098 ** | 0.0245 ** | |
| (0.0012) | (0.0045) | (0.0097) | |
| Control variable | Yes | Yes | Yes |
| Firm fixed effect | Yes | Yes | Yes |
| Year fixed effect | Yes | Yes | Yes |
| Observations | 167,925 | 13,682 | 3900 |
| 0.1714 | 0.1918 | 0.1719 |
Note: The values in parentheses are robust standard errors; *** and ** indicate significance levels of 1% and 5%, respectively. The R2 reported by the fixed-effects model is the R2 within the group.
Table 6.
Robustness test.
| Variables | (8) Model 8 ls1 | (9) Model 9 ls1 | (10) Model 10 ls1 East | (11) Model 11 ls1 Central | (12) Model 12 ls1 West |
|---|---|---|---|---|---|
| 0.0121 *** | 0.0122 *** | 0.0111 ** | 0.0237 ** | ||
| (0.0013) | (0.0013) | (0.0047) | (0.0100) | ||
| 0.0468 *** | |||||
| (0.0179) | |||||
| 0.0120 *** | |||||
| (0.0013) | |||||
| Control variable | Yes | Yes | Yes | Yes | Yes |
| Firm fixed effect | Yes | Yes | Yes | Yes | Yes |
| Year fixed effect | Yes | Yes | Yes | Yes | Yes |
| Observations | 160,800 | 160,800 | 145,258 | 12,069 | 3436 |
| 0.1954 | 0.1955 | 0.2021 | 0.1792 | 0.1373 |
Note: The values in parentheses are robust standard errors; *** and ** indicate significance levels of 1%, 5%, respectively. The R2 reported by the fixed-effects model is the R2 within the group.
Table 7.
Mediation effect test.
| Variables | (13) | (14) | (15) | (16) |
|---|---|---|---|---|
| Temp | ls | sub | ls | |
| sub | 0.0113 *** | |||
| (0.0012) | ||||
| temp | 0.1255 *** | |||
| (0.0013) | ||||
| 0.0499 *** | 0.0040 *** | 0.0724 *** | 0.0012 *** | |
| (0.0055) | (0.0010) | (0.0208) | (0.0002) | |
| Control variable | Yes | Yes | Yes | Yes |
| Firm fixed effect | Yes | Yes | Yes | Yes |
| Year fixed effect | Yes | Yes | Yes | Yes |
| Observations | 160,153 | 160,153 | 179,741 | 179,741 |
| 0.4768 | 0.4507 | 0.0225 | 0.2160 |
Note: The values in parentheses are robust standard errors; *** indicate significance levels of 1%. The R2 reported by the fixed-effects model is the R2 within the group.
Table 8.
Test of intermediary effects of income tax preferences.
| Variables | (17) Incometax | (18) ls | (19) Incometax | (20) ls |
|---|---|---|---|---|
| incometax | 0.0118 *** | 0.01800 *** | ||
| (0.0024) | (0.0023) | |||
| 0.0001 | 0.0102 *** | −0.0006 | 0.0108 *** | |
| (0.0016) | (0.0012) | (0.0016) | (0.0012) | |
| Control variable | Yes | Yes | Yes | Yes |
| Firm fixed effect | Yes | Yes | Yes | Yes |
| Year fixed effect | Yes | Yes | Yes | Yes |
| Observations | 157,619 | 157,619 | 180,404 | 180,404 |
| 0.0319 | 0.2045 | 0.0287 | 0.2159 |
Note: The values in parent eses are robust standard errors; *** indicate significance levels of 1%. The R2 reported by the fixed-effects model is the R2 within the group.
© 2020 by the authors. Licensee MDPI, Basel, Switzerland. This article is an open access article distributed under the terms and conditions of the Creative Commons Attribution (CC BY) license (http://creativecommons.org/licenses/by/4.0/).
Share and Cite
MDPI and ACS Style
Liu, Z.; Yang, Y. Impact of Development Zone Construction on Labor Share in China. Sustainability 2020, 12, 3642. https://doi.org/10.3390/su12093642
AMA Style
Liu Z, Yang Y. Impact of Development Zone Construction on Labor Share in China. Sustainability. 2020; 12(9):3642. https://doi.org/10.3390/su12093642
Chicago/Turabian StyleLiu, Ziyu, and Yanlin Yang. 2020. "Impact of Development Zone Construction on Labor Share in China" Sustainability 12, no. 9: 3642. https://doi.org/10.3390/su12093642
Note that from the first issue of 2016, this journal uses article numbers instead of page numbers. See further details here.