Article

Assessing Anthropogenic Dynamics in Megacities from the Characterization of Land Use/Land Cover Changes: The Bogotá Study Case

by
Claudia P. Romero
1,2,*,
Alicia García-Arias
1,
Celine Dondeynaz
3 and
Félix Francés
1
1
Research Institute of Water and Environmental Engineering, Universitat Politècnica de València, 46022 Valencia, Spain
2
Department Environmental Engineering, Universidad Santo Tomás, Bogotá 110321, Colombia
3
Research Executive Agency, B-1049 Brussels, Belgium
*
Author to whom correspondence should be addressed.
Sustainability 2020, 12(9), 3884; https://doi.org/10.3390/su12093884
Submission received: 3 April 2020 / Revised: 3 May 2020 / Accepted: 7 May 2020 / Published: 9 May 2020
(This article belongs to the Section Sustainable Urban and Rural Development)

Abstract

:
Usually, megacities expand without proper planning in a context of demographic growth and are increasingly dependent on the natural resources related to the occupied area. This is a major challenge for the sustainable management of these territories, justifying the need for a better knowledge of land use/land cover (LULC) distribution and characteristics to observe spatial anthropogenic dynamics. In this study, the Bogotá river basin and the Bogotá megacity were analyzed as a case study. The main objective of this work was to analyze the historical LULC dynamics from 1985 to 2014. Reliable forecasting scenarios were developed using the Land Change Modeler to support sustainable management and planning. Results show an expansion of the Bogotá megacity toward the Northeast and an increase of urban areas within the basin. These changes implied a loss of 58% of forest surface, a strategic ecosystem, from 1985 to 2014. This dynamic is expected to continue, with a 50% increase of urban areas between 2012 to 2050, thus the megacity and neighbor cities potentially become an “urban continuum”. A replacement of crop and pasture lands near the city is expected, even though Bogotá lands are among the best agricultural lands in the Andean region of Colombia.

1. Introduction

Currently the world population is 7700 million inhabitants, of which 54% live in cities. Projections show that world population will reach 9700 million by 2050 and 68% will live in urban centers. However, this urbanization process does not occur in the same way in every continent. North America and Latin America and the Caribbean are currently the most urbanized regions in the world, showing urban population percentages of 82% and 81%, respectively, followed by Europe with 74% and Asia with almost 50%. Africa is the continent with the largest rural population, as only 43% of its inhabitants live in urban areas [1,2].
Therefore, an important part of the world population is concentrated in megacities, defined as urban areas with more than 10 million inhabitants. Some examples include Tokyo (37 million), Delhi (29 million), and Shanghai (26 million). In Latin America, the largest megacities are Sao Paulo and Mexico City, with more than 20 million inhabitants in each. Buenos Aires, Rio de Janeiro, Lima. and Bogotá are projected as megacities under development. They are all characterized by the strong influence of their metropolitan area, which creates polycentric spatial growth dynamics with patterns associated with less defined networks and frontiers. As a result, small rural districts are included in a more complex metropolitan system. This behavior has been recently identified and requires further research [3,4].
Cities are economic welfare engines and sources of sustainable development [4]. However, population growth may accelerate urbanization processes and induce negative effects over the related environment, increasing natural resources demands [1]. Cities concentrate most of the industry and the energy use, being responsible for 78% of CO2 emissions, at a rate equal to 9319 million tons per year [5,6]. Land use change caused by building cities and meeting the demands of urban populations drives other types of environmental changes that induce different soil, water, and air pollution issues. Cities are one of climate change’s main contributors while being, at the same time, more vulnerable to its effects [4].
Food and Agriculture Organization of the Uniteed Nations estimates that agricultural production will have to increase by at least 60% to meet the 2050 world population’s food demands [7]. On a basin scale, competition between agricultural and urban uses represent major changes in land use/land cover (LULC), while also placing very high demands on water resources. All this justifies the difficulty for land managers, especially when managing change in catchment areas that host megacities under development, to face these big challenges and to manage limited resources while mitigating increasing natural risks [8,9,10].
Research into the distribution dynamics of LULC as a main driver of global environmental change has grown in recent years. Recent research [4,11,12] explored the impacts that expanding cities in both urban and peri urban areas would induce in catchments even if some cases, like Bogotá, are not part of the same administrative jurisdiction. Thus, conflicts in resource management arise. This situation becomes more relevant when the megacity depends on water supplies from nearby rivers. This situation often generates disputes and conflicts in water resources management. Quantifying and analyzing the interactions between biophysical, climate, and socio-economic factors both in space and time also supports the understanding of the changes between current land use and past land use. This is the basis to estimate future LULC distributions [13,14,15].
From an environmental perspective, Bogotá megacity has traditionally placed much pressure on the natural resources of its basin. Nowadays, Bogotá river is considered one of the most polluted rivers in Latin America [16]. The organization that officially manages the Bogotá river [17] states that this pressure will continue increasing environmental impacts and natural risks related to flooding, as some naturally flooded areas have recently been urbanized. This situation is even more critical, as the Bogotá urban area is interleaved with a complex fluvial network that crosses the city.
In addition to this human pressure, Bogotá river basin is expected to be affected by changes in climate patterns. Results of climate change regional models applied to the Bogotá river basin foresee a rainfall decrease and a temperature increase in the basin, with important effects on agricultural production, which could directly influence food security of the megacity [18]. Main hydroclimatic risks in this basin are expected to be frost, storms, flash floods, landslides, forest fires, and the atmospheric pollutants emissions caused by urban heat islands. However, there are still significant uncertainties in the simulations of future climate scenarios due to a lack of data information [18].
With the overall aim to support policy-makers facing the urban management challenge in an efficient manner, this study investigates the spatial LULC dynamics in the Bogotá river basin and, in particular, the influence of Bogotá megacity. In particular, this research will inform on the development of the Bogotá megacity with the estimation of the expansion of artificial areas over the natural and agricultural areas within the river basin. This new knowledge will feed the urban management tools, the so-called “Plan de Ordenamiento Territorial” (POT), and better support land management. Additionally, this could enhance natural resource management sources through the identification of spatial dynamics threatening natural and strategic ecosystems, such as forest and Páramos (scrublands related to wetlands).
This work includes first the analysis of historical LULC dynamics in the Bogotá river basin performed from 1985 to 2014. Land Change Modeler (LCM) is selected since it has already shown its good ability to model LULC changes in urban areas and megacities [3]. LCM is based on neuronal networks that define potential transitions of land categories and it considers potential explanatory variables [8,13,19,20,21] that support the understanding of LULC changes. Building on these results, the development of LULC forecasting scenarios is then performed at horizons 2030 and 2050. This paper presents in Section 2 an overview of the datasets and methodologies applied to the Bogotá river basin. The historical analysis of LUCL as well as results of forecasting scenarios are presented in Section 3, focusing on the expansion of urban areas and the influence on other land uses. Based on results obtained from the simulations, specific findings are highlighted since they can be useful for policy-making mid-long-term.

2. Materials and Methods

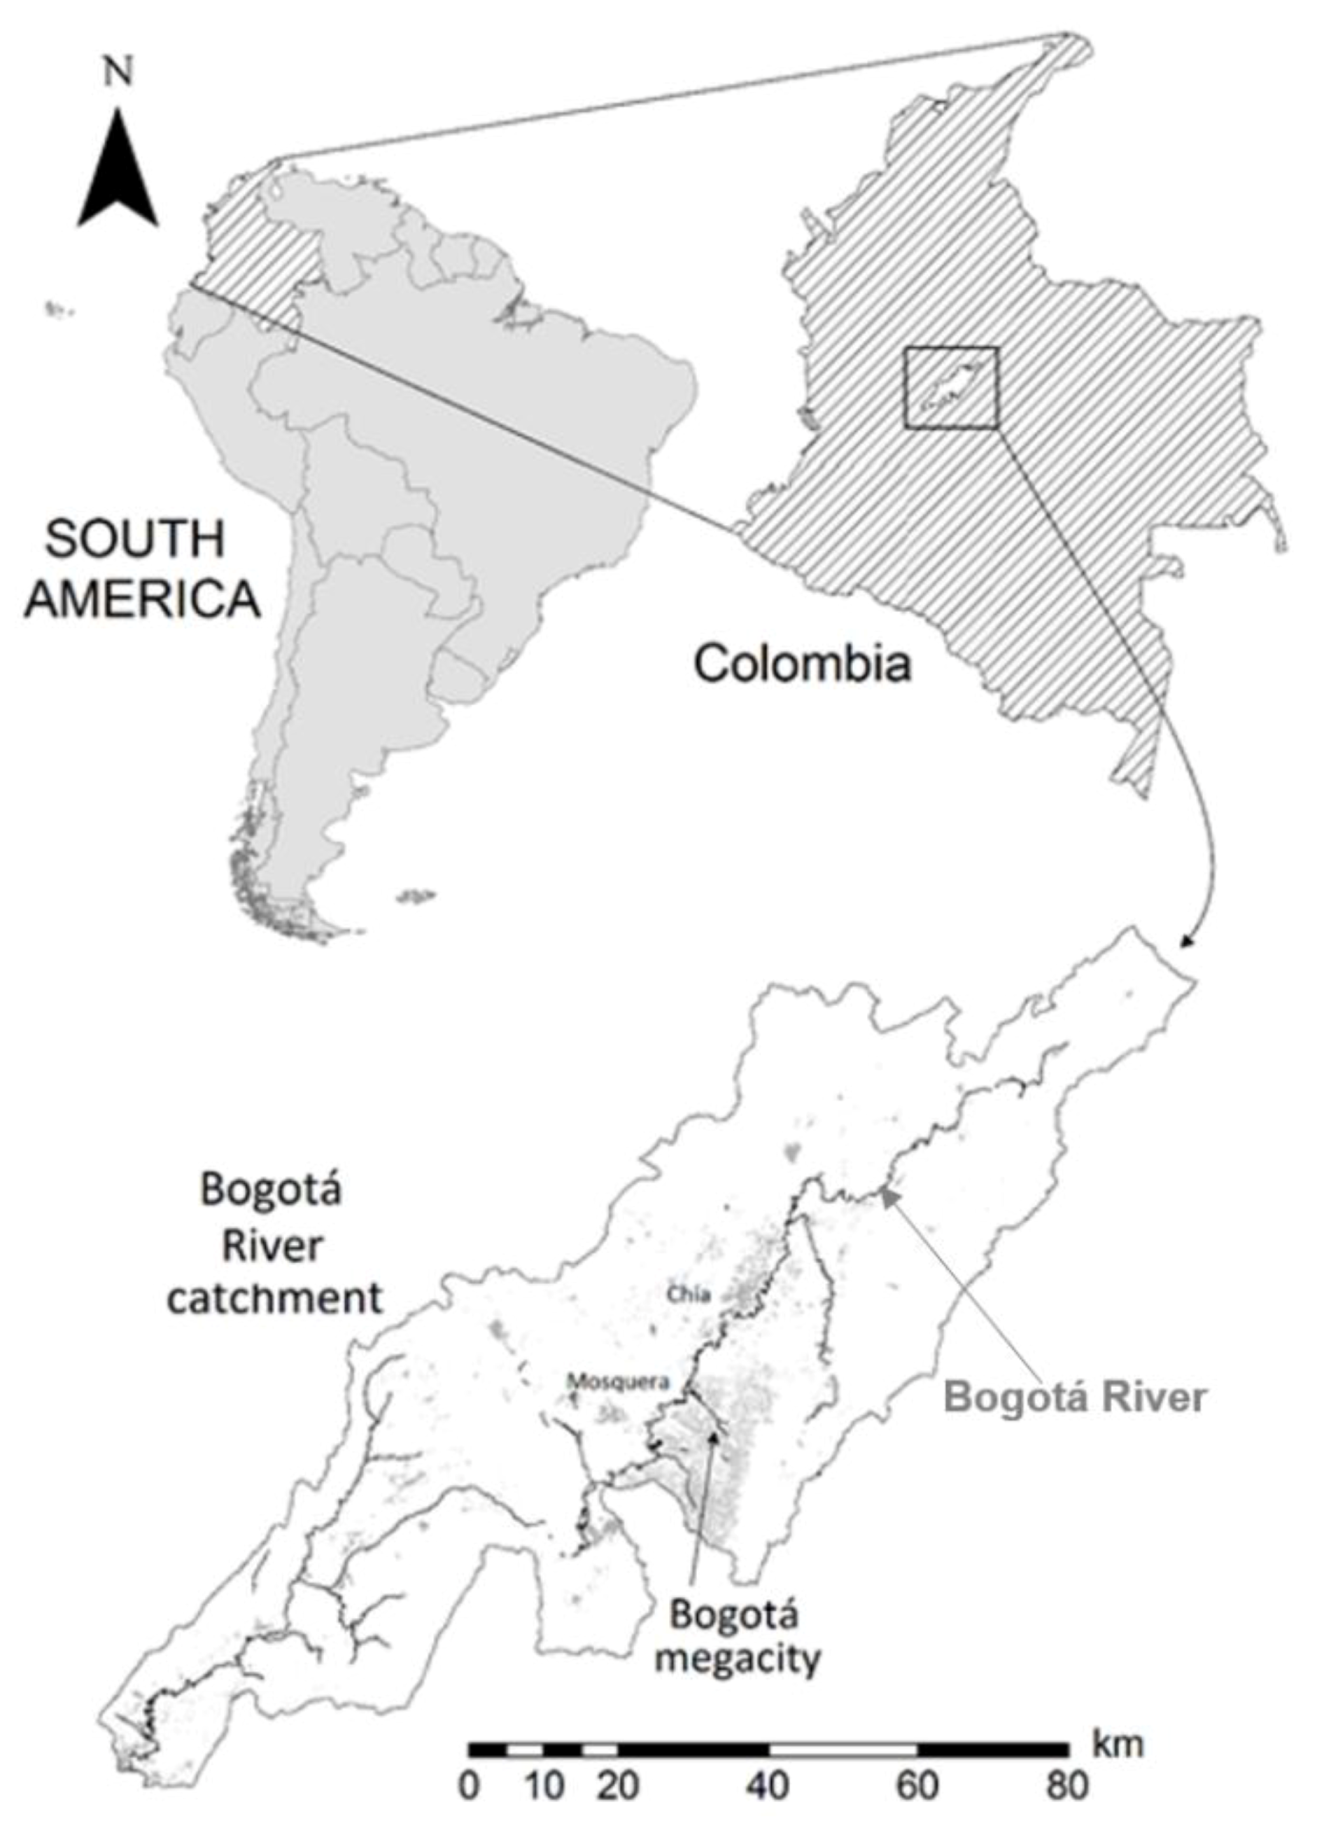
2.1. Study Area: The Bogotá River Basin

The Bogotá river basin is located in the province of Cundinamarca in central Colombia. Its main fluvial canal is the Bogotá river, a natural western limit of the megacity of Bogotá (Figure 1).
The Bogotá river has a basin area of 5472 km2 and is 270 km long. It flows in a SW direction from its source at 3400 m.a.s.l. to its confluence with the Magdalena River at 280 m.a.s.l. The Bogotá river basin can be divided into two different areas according to its topography and climate. The upstream and highest part of the basin includes the Bogotá savannah, whose draining area covers 4321 km2 and is characterized by relatively low temperatures. This upper part includes 15 main sub-basins, where reservoirs for urban water supply are located. Downstream, the Bogotá river crosses a small alluvial plain surrounded by folded mountains until the point at which it joins the Magdalena River.
The average annual precipitation increases from approximately 600 mm in the lower flat areas to 1600 mm in the highest parts of the alluvial plain. The spatial variation in the annual average temperature is also very high, changing from 10 °C in the upper zone to 26 °C in the lower basin area. This altitudinal temperature gradient is approximately 5 °C/1000 m, with very little seasonal variation [22].
The original basin vegetation is made up mainly of high Andean humid forests, dense scrublands, vegetation of meadows, and Páramos [23]. This natural vegetation has been gradually replaced with potato and maize crops, which were part of the main diet eaten by the first native settlers in the region [24]. During the 16th century colonization, this vegetation replacement process underwent major changes caused by (i) towns’ and cities’ development and (ii) wetlands being dried to extend croplands to enable new farming and livestock breeding or tree planting (both of native or foreign species) [24].
Two important types of natural covers exist in the basin’s environmental balance:
(i) the Páramos ecosystem, which has a crucial role in water storage and controlling water flows across the catchment [25]. The Páramos ecosystem (included in category 3.2 in the LULC analysis shown below) is rare and exists in the Andean countries. Colombia is the country with the largest Páramos area, representing around 50% of the total area in the world [26]. However, this ecosystem is highly impacted by human actions, such as the pressure of pastoral and agricultural activities that threaten these wetlands [27];
(ii) forests as ecological corridors that act as a natural barrier against urban growth, among which the Bogotá Protective Forest nature reserve and the Van Der Hammen nature reserve stand out. These natural covers are currently the center of debate about the city’s new territorial planning, owing to their strategic location for Bogotá’s urban development [28]. Main causes of the degradation of these ecosystems are those related to farm losses, livestock uses, and mining activities [23,29,30].
Bogotá is considered one of the main developing megacities of Latin America. In 2018 its population reached 7.3 million inhabitants within its strict municipal perimeter [31]. Furthermore, another 1.45 million inhabitants that live within its metropolitan area should be added to the population of the city. Bogotá local authorities [32] expect an increasing trend, with a population reaching more than 11 million inhabitants by 2050, from which around 2.8 million will live at the periphery of the metropolitan area.
The city of Bogotá accounts for more than 20% of the population of Colombia. Bogotá is the capital city of the country and its main center of economic development. This status has led to important migratory processes towards the city. These processes are mainly due to social issues associated with internal displacements caused by the social and armed conflicts that were important during the 1990s to the first decade of the 21st century. This situation has developed continuous and dense urban areas that offer inhabitants both opportunities and risks. The limited availability of the urban land has led to an increase in housing prices that has consequently pushed the low-income inhabitants out to the city’s outskirts and promoted the development of nearby commuter towns [33]. During the 1980s and 1990s, the city’s growth expansion rate was 310 inh/year. Currently, this expansion has increased to over 870 inh/year [32].

2.2. Datasets

2.2.1. Historic LULC Maps

In this study four LULC maps of the Bogotá river basin (1985, 2005, 2012, and 2014) were collected from the Regional Water Authority (CAR). Data from the Urban Cadaster of Bogotá were also included on these maps to improve spatial resolution of urban areas. These maps are based on satellite images from Landsat7, Spot, and Rapideye from different dates. The maps were produced using supervised classification combined with visual interpretation of satellite images, and were originally all in vectorial format but using different classifications and scales.
The 1985 LULC map is based on simplified categories, namely: urban areas, areas with no vegetation, cropping areas (differentiating between crops and greenhouses areas), forest areas (including natural forests, forest cover, and forest plantations), heathland vegetation, pasturelands, and water bodies.
The 2012 and 2014 maps follow the CORINE Land Cover methodology, whose classification was adapted for Colombia [34] by completing missing information due to cloud cover with other sets of images from different sources and years. The classification of the different uses for agriculture purposes into categories 2.1 to 2.4 is consistent from 1985 to 2012. However, between 2012 and 2014, 29.2% of the area shifted from heterogeneous agriculture areas to pastures because of a reclassification made due to different image sources (see Section 2.4). Overall quantitative analysis on category 2 remains still valid and of interest for this study.
Therefore, the 2014 map was created on a scale of 1:10,000 using Rapiday images. For this map, 5% of the total area with no information was completed using 2010 Landsat satellite.

2.2.2. Complementary Datasets for the LCM Model

The LCM model requires additional information to include explanatory variables of the land use change, such as elevation, slope, or infrastructure network. The Digital Elevation Model (DEM) and the road network were obtained from the Regional Water Authority (CAR). Slope values were extracted from the DEM (with a 30 m resolution). Afterwards, these slope values were mapped and classified into three categories, considering 10% and 15% as thresholds. The vectorial information related to the road network and urban centers in Bogotá area was provided by the Urban Cadaster of Bogotá at scale 1:5000. This information was integrated into the layer of urban areas within the river basin through a cartographic generalization using ArcGIS.

2.3. Cartographic Standardization

Due to this inconsistency of classifications and scales, maps were rebuilt using common classifications and topological characteristics. The CORINE Land Cover legend adapted for Colombia was chosen for the standard classification of the available LUCL information as it was already used in the most recent maps (2012 and 2014). The data detail level for 1985 only allowed to reach level 2 of the CORINE legend. In addition, for the 2005, 2012, and 2014 maps, a generalization was made by taking one hectare as the minimum cartographic unit. The urban information from the Urban Cadaster of Bogotá was included on the maps with a lower resolution to fit the artificial areas as the main object of this study. The areas with no information due to cloud coverage were imputed using the images without clouds to the prior and closest possible date to the map date and through a manual and visual categorization of these specific areas.
Final maps considered 13 categories in the Bogotá basin. The category “artificial areas” (gathering CORINE categories 1.1, 1.2, 1.3, and 1.4) included all the areas occupied by human settlements and/or designated for human use. Artificial lands, which were modified by characteristic geometric distribution, correspond either to high- or low-density urban areas, rural settlements, and mixed infrastructures/amenities. “Agricultural areas” (gathering CORINE categories 2.1, 2.2, 2.3, and 2.4) mainly include pasturelands and areas with heterogeneous agricultural uses. “Permanent” or “semi-permanent crops” correspond in the Bogotá river basin to rice, sugar cane, coffee, potatoes, flowers (in greenhouses), and bananas production. The Andean forests in the upper river basin are formed by lush vegetation, including cloud forests (CORINE category 3.1) and high mountain lands with grasslands called Andean Páramos (included in category 3.2). CORINE category 4.1 includes inland wetlands and water surfaces, while inland water bodies (natural or artificial) and major watercourses are included in category 5.1 (Figure 2).

2.4. Land Change Modeler Application to Bogotá River Basin

The Land Change Modeler (LCM) includes MultiLayer Perceptron (MLP) neural networks algorithms to calculate transition potentials and spatio-temporal Markov chains to predict scenarios [35].
First, the analysis of the LULC dynamics was performed on historical maps in two stages: the first one analyzed the overall changes between 1985 and 2014 (the full period of study) and the second stage focused on the analysis of changes between 2005 and 2014 (the last decade of the studied period). This was done in particular to (i) analyze the expansion of the urban areas (being 3.7 times the 1985 surface in 2014) over the whole period and (ii) go deep into the analysis using the 2005–2014 period in the modeling to forecast LULC scenarios using the same methods to produce 2005 and 2014 maps (Section 2.2). High consistency of data was guaranteed, ensuring a better reliability of the results. Therefore, the final model was adjusted for the 2005–2012 period and the 2014 map was used as the target in the validation process.

2.4.1. LULC Model Performance

Once the model was calibrated, the validation process was done considering a pixel-to-pixel comparison of the map foreseen for 2014 with the observed LULC map for the same year. Overall, the prediction accuracy of the model was 73.8%. The potential transition area is equal to 28.6% of the total surface of the Bogotá river basin. In this area, the model correctly predicted (hits) 86% of pixels, with a maximum error (misses and false predictions) between agricultural uses and forest cover equal to only 3.7%. The misclassification between the agricultural and natural areas represented, respectively, 2.5% and 0.1% of the total transitional area. Finally, looking at the megacity, very few urban pixels were wrongly classified (0.5%), while 6.9% were missed, as shown in Figure 3.
Besides this, the prediction error was only applied to urban areas, using the transition matrix proposed by Pontius [36]. This analysis showed that 90% of the model errors were related to the quantity component, which corresponds to the absolute value of the differences between the areas calculated by the model as urban and the real urban areas. Only 10% of the model errors corresponded to the exchange component, defined as the differences between urban and non-urban categories, so these differences did not alter their size. No change error was detected.
The LMC model correctly reproduced 72.5% of the 2014 artificial areas. The best results were obtained for urban fabric category (216.4 km2) with 85.6% of hits and for the artificial category non-agricultural vegetated areas (162.7 km2) with 73% of hits. Conversely, the industrial, commercial, and transport units category, with an occupied surface area of 157 km2, obtained 66.6% of hits, and the mine, dump, and construction sites, with a total surface area of only 31.4 km2, obtained 56.6% of hits. Although the estimation of the last two categories was not adequate, they represent only 3.4% of the basin. It may be assumed that the model is better at predicting LULC for larger areas and more frequent land use. This effect has already been reported in previous studies [37].
Simulation was good for the pastures category, as the model predicted 91% of its actual surface area. Arable land represents 4% of the basin’s total surface area and the model only made a 20% prediction of the real surface. However, the model performed well for the categories of forests, scrubs, and open spaces, with a slight over estimation for forest (112%) and good estimation of scrublands and/or herbaceous vegetation associations (97%).
The model overestimated the category heterogeneous agricultural areas (1181.5 km2), with a value 2.4 times higher than the real area (485.9 km2). This is due to the significant decrease in this land use between 2012 and 2014. The category heterogeneous agricultural areas decreased its area from 36% in 2005 to 27% in 2012 and only 9% in 2014. This fast decrease caused difficulties for the LULC prediction model.
Additionally, it has been noted that heterogeneous agricultural areas were mostly replaced by pastures, whose area doubled between 2005 (22.6%) and 2014 (44.8%). Several facts may explain this evolution:
(1) Small surface areas with pasturelands may have been classified as heterogeneous agricultural areas category in 1985 to 2012 maps. According to level 2 of the CORINE Land Cover legend, this category includes mosaics of pasturelands and crops. In the 2014 map, made at a more accurate scale, these small pasturelands have been detected and reclassified in the category pastures;
(2) Socioeconomic factors may also have conditioned this loss inside the basin. It must be taken into account that the farmlands located in Bogotá Savannah have been overvalued due to pressure from the megacity, which requires building land to expand, a phenomenon that includes the nearby towns of its metropolitan area [32];
(3) Another reason for this land use change could be the problems faced by local farmers to sell their products (e.g., cereals production), partly due to lack of competitiveness with the farm products imported into the country as a result of the free trade treaties signed in the last decade [38].
Therefore, the model underestimated some categories, predicting 86% of urban areas, 73% artificial/non-agricultural vegetated areas, and 91% of pastureland. The model performed very well predicting 97.4% of scrub and/or herbaceous vegetation areas and 102% of open spaces with few vegetation. The forest category was slightly overestimated, with a prediction of 112% (Table 1).

2.4.2. Development of Dedicated Sub-Models for LULC Transitions towards Artificial Areas

The results shown above were also the basis to identify the main potential areas in transition towards urban use. Two sub-models were developed to model the transitions from agricultural to urban areas (agri_urb) or from non-agricultural vegetated areas to urban areas (green_urb). These models included potential causes and variables that might have driven these LULC changes.
These two sub-models were calibrated in the potential transition stage using the multi-layer perceptron (MLP) model. This neural networks-based algorithm took samples from the 2005 and 2012 maps for the areas submitted to the transitions selected in both sub-models. Transitions were grouped into two equal-sized samples: the first one was used for training and the second one for testing, with a stopping criterium of 10,000 iterations. The model performance was assessed using the Root Mean Square Error (RMS) as an accuracy measure.
Once the calibration of the combined model was performed, validation was done by applying a Markov chain method comparing the potential changes in LULC calculated for 2014 based on the 2005–2012 period to the observed map of 2014.
The green-urb and agri-urb sub-models considered a common set of key explanatory variables. Following [20], these variables were elevation, slope (as a categorical variable classified into three categories, with 10% and 15% slopes taken as thresholds), and distance to roads and to town centers (using the natural logarithm of the Euclidean distance) were considered as potential drivers (Section 2.2.2). The MLP model was applied to simulate the main potential transitions towards urban land use that took place between 2005 and 2012.
The green-urb submodel focused on areas where land cover transitions from non-agricultural vegetated areas (category 1.4) to urban fabrics (category 1.1) occurred. The most influential driver was elevation, with a skill measure of 0.82 for transition from category 1.4 to category 1.1 and of 0.90 for category 1.4 use persistence. The model’s total skill measure reached 0.86 (Table 2).
The agri-urb submodel applied to areas classified in agricultural land use, such as permanent crops (category 2.2), pastures (category 2.3), or heterogeneous agricultural areas (category 2.4) which were converted into urban fabric (category 1.1), industrial, commercial, and transport (category 1.2) in 2012. The drivers included in this analysis were (i) slope and (ii) distance to city centers and roads. The model’s total skill measure reached 0.50 (Table 2).

3. Results and Discussion

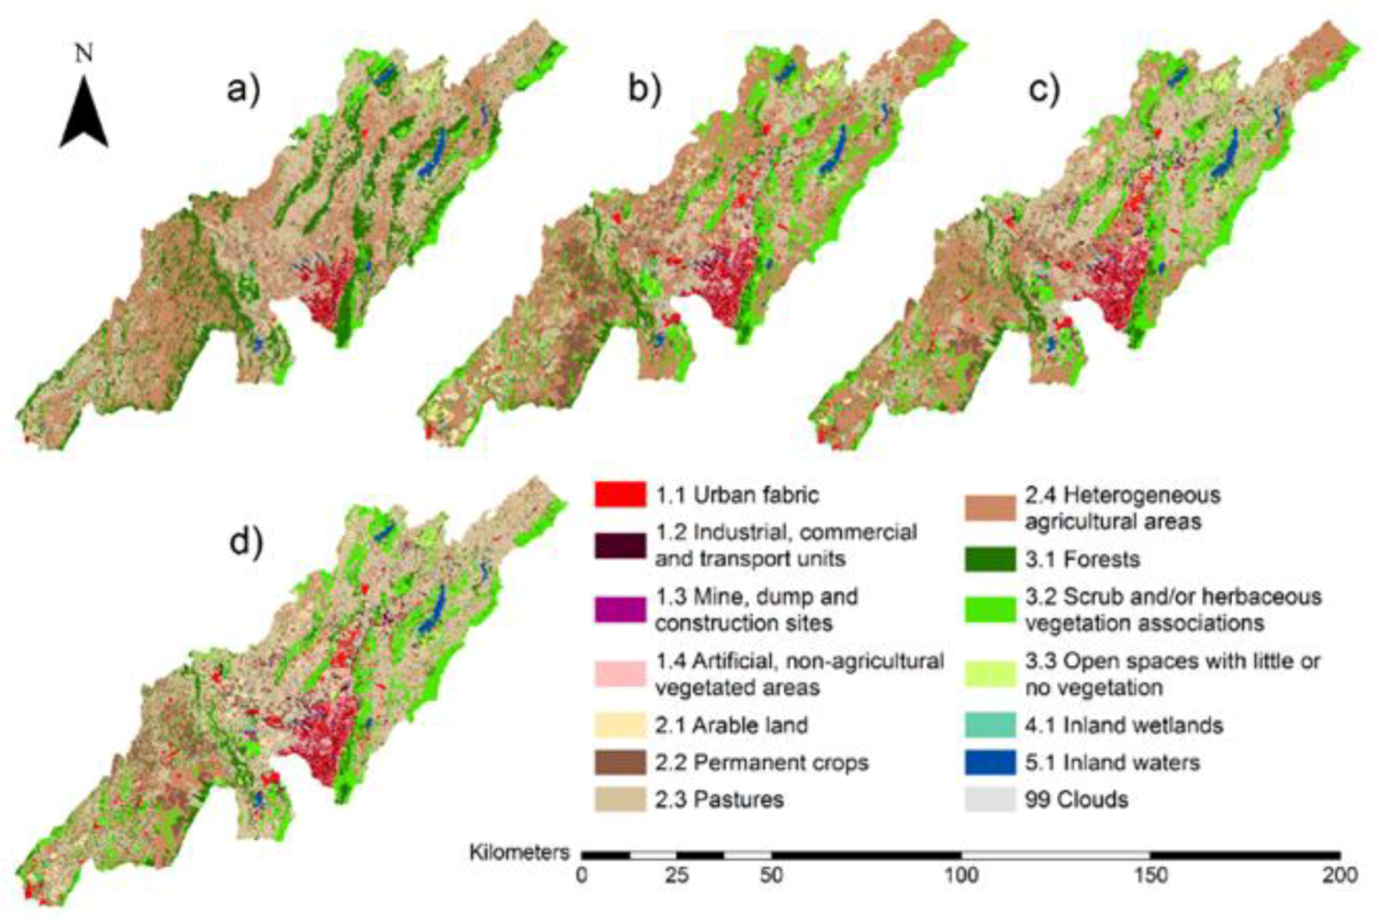
3.1. Analyzing the Historical LULC Dynamics Since 1985

The historical analysis of the Bogotá river basin is the first step to the estimation of near future perspectives. This basin has historically been strongly affected by anthropogenic disturbances, first due to crop and livestock activities and, increasingly in the last decades, due to urban growth and its spreading.

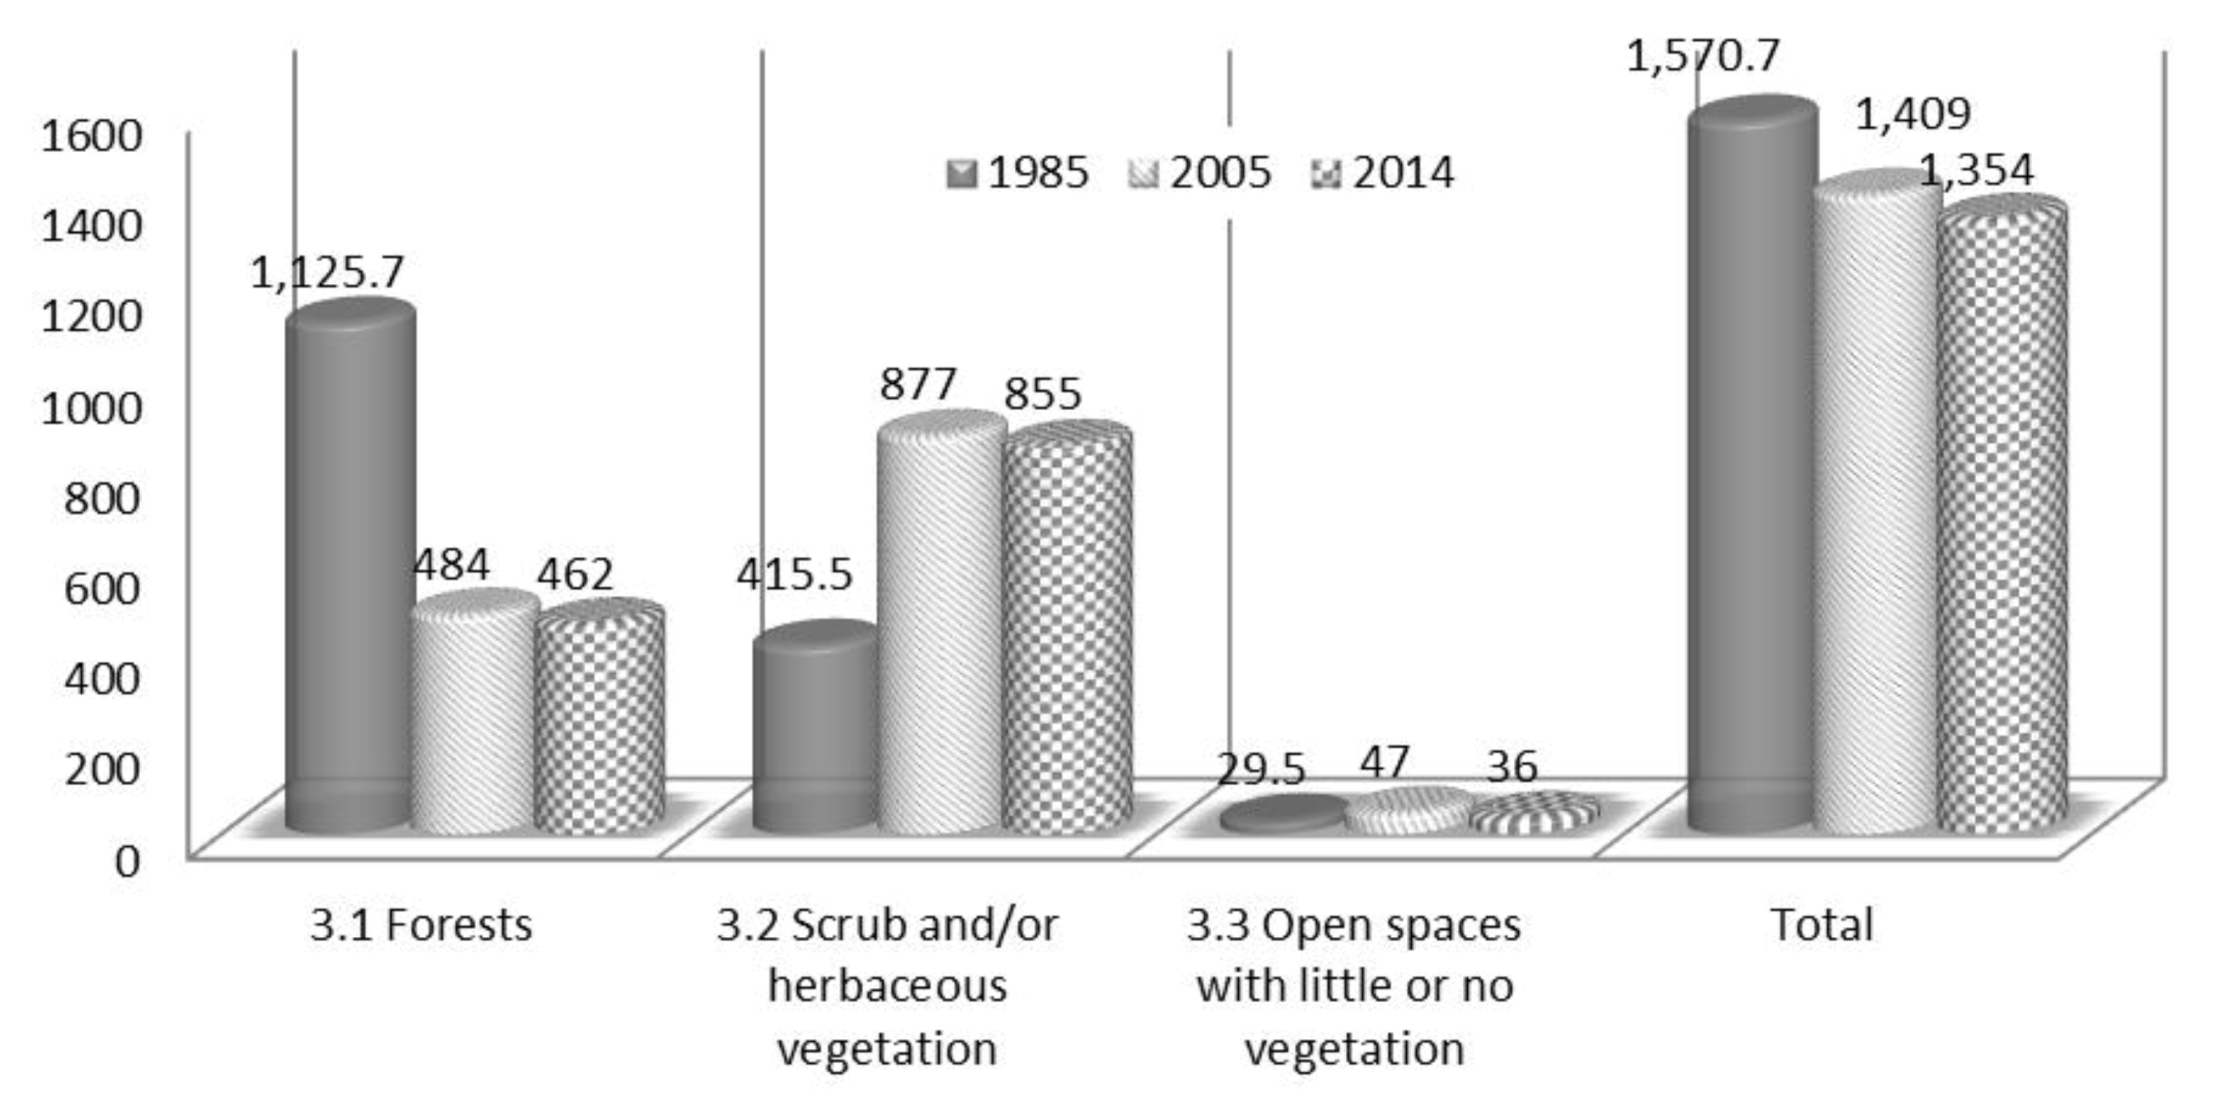
3.1.1. Analysis of Forest Degradation and Fragmentation Dynamics

Fragmentation is defined as when the habitat availability and the area available to native species of the original ecosystems are limited to smaller, often disconnected patches within a matrix of other new habitats [39,40]. The habitat degradation implies both loss of quality and structural changes, which may be caused by human activities such as clearance, selective logging, cattle grazing, and fires. However, degradation may occur both in fragmented and continuous habitats. A relationship between fragmentation and degradation has previously been documented; fires, selective logging, and cattle have been found more frequently in smaller fragments [41].
Currently only 31% of the initial area covered by natural Colombian Andean forests remain, as farming and industrial extractive activities have degraded this natural ecosystem or simply taken its place. Andean forest is considered among the most threatened ecosystems in Colombia [42]. This historical process of fragmentation has led to its altitudinal and latitudinal isolation. The high-Andean cloud forest is mainly constituted by trees (up to 25 m) and shrubs (from genus Weinmania, Miconia, Ilex sp., Hesperomeles sp Clusia, Brunnellia sp, Befaria sp Drymis, and Oreopanax). The main characteristic of these areas is the high level of air humidity because of the hot air condensation in lower areas generating cloudiness. These cloud forests have the ability to catch this humidity, playing in this way a key role into the hydrological cycle regulation, levels of runoff, and wide water supply [4]. The setup of forest recovery policies allowed the introduction of non-native species and forests plantation (Pinus spp, Acacia melanoxylum, A. decurrens, and Eucalyptusspp.) [42].
In the Bogotá river basin, 402.67 km2 of forest (category 3.1) were degraded into secondary vegetation made up of scrublands and/or herbaceous plant associations (category 3.2). The area reallocated to farmland activities was also significant. A total area of 283.52 km2 changed from category 2.1 to 2.4, of which 14.4% was dedicated to permanent crops, 62.7% to pasturelands, 19.7% to heterogeneous farmland, and only 3% to arable land (Table 3).
During 1985–2005 period, the loss of large continuous areas covered with dense forests occurred in the upper basin, between 2500 to 3000 m of latitude (57% of the loss of dense forests) and in slopes that are often deforested for potato crops. Additionally, in the lower part of the river basin, the loss mainly occurred in smaller areas, promoting fragmentation (Figure 4).
Overall, the loss of natural forest has been very significant, as the forest was covering 20.5% of the basin’s total area in 1985 (1125.7 km2), but only 8.4% (462.4 km2) in 2014. This fragmentation is mainly due to the use of trees as wood-fuel and/or deforestation to allow potato crops or herds pasture. On 2005, a stabilization of the area of the dense forest was observed (category 3.1), as shown in Figure 5. However, a very limited forest recovery process occurred, in particular from 2005–2014 with 43.01 km2 changing from scrubland/herbaceous areas (category 3.2) to forests (category 3.1), as shown in Table 3. However, this positive evolution is far from compensating the important fragmentation of the forest due to either agriculture or urban anthropic pressure.

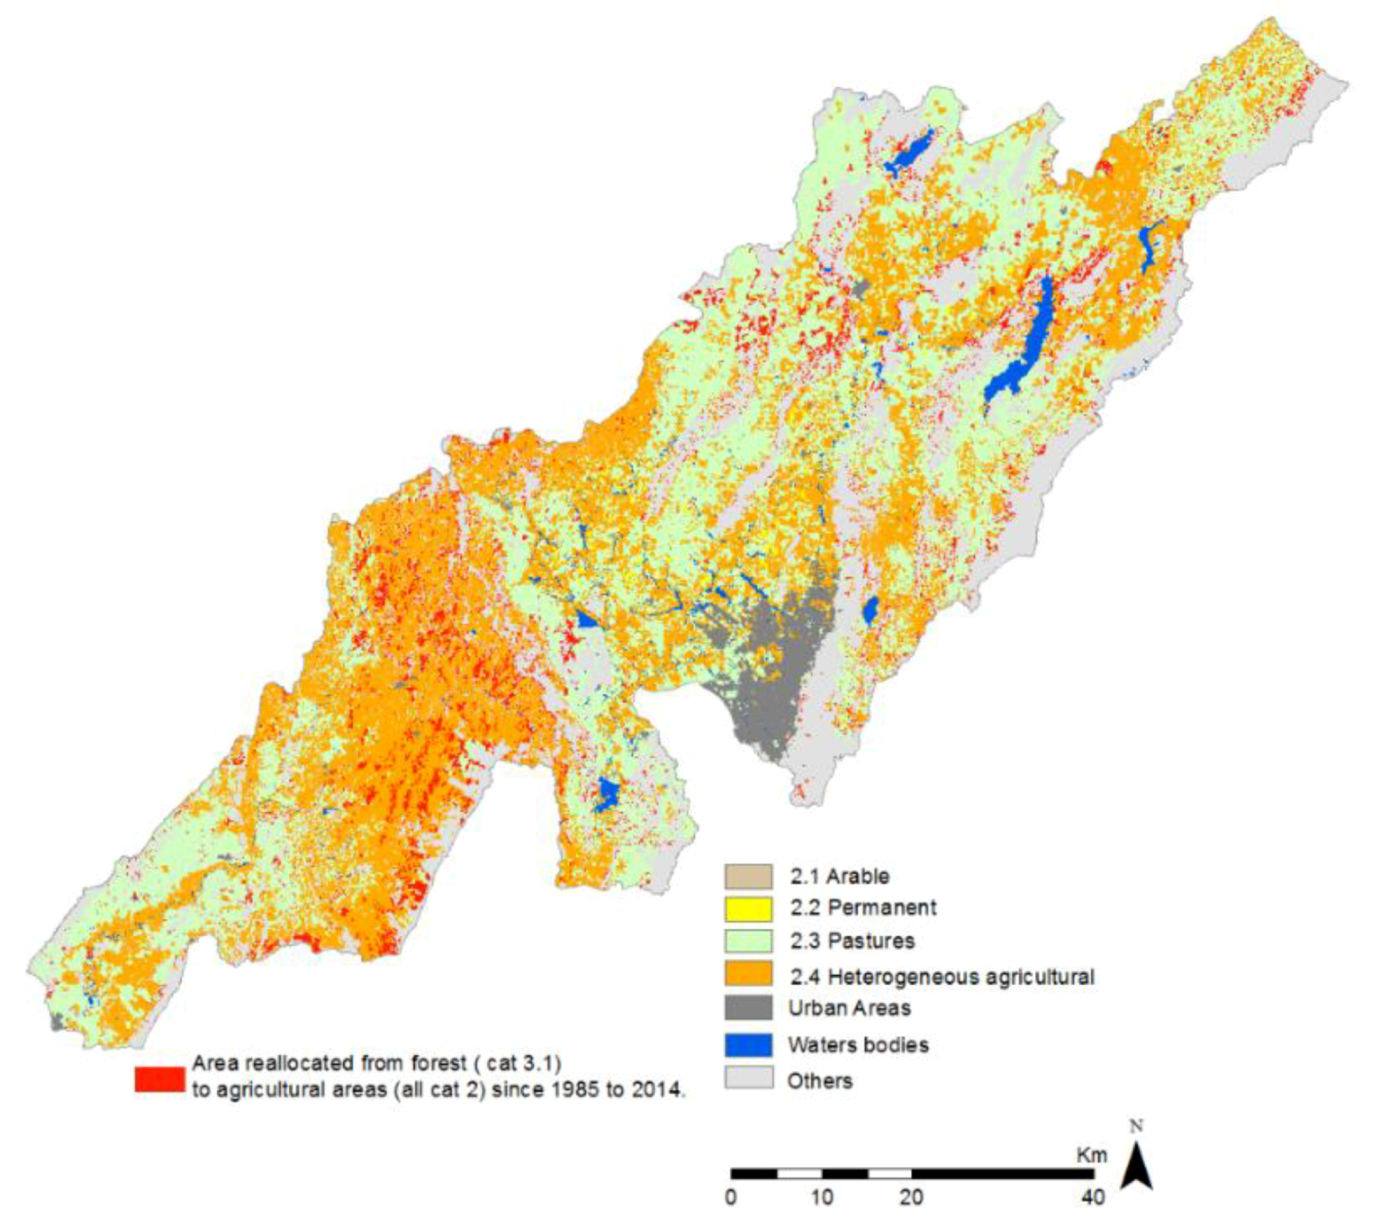
3.1.2. Agriculture Pressure (All Categories 2) on the Forest (Category 3.1)

In 1985, the surface area used for crops and livestock production was 3649 km2, corresponding to 66.7% of the basin’s total surface area. This surface was equally distributed between agricultural land (1811 km2) and pastures (1838 km2) (Table 3). Agricultural activities were located in the Southwest (Figure 6) and pasture areas spread across the entire surface of the basin. The soil quality in this river basin is good, and it is a key agricultural production area for Colombia [43].
Agricultural pressure in the forest area led to the reallocation of 177 km2 of pasture within the basin. During the period 2005–2014, this dynamic was only 22 km2, 90% of these losses occurred during the first twenty years, from 1985 to 2005.
A significant reallocation from heterogeneous farm uses to pasturelands has occurred since 2005, which represent 23.4% (1280 km2) of the basin’s total area. This land use changed mainly at the periphery of the city of Bogotá and was mainly the work of small farmers who gradually gained agricultural areas from the forest [30]. It can be reasonably assumed that this has been the first consequence of the population growth of the megacity of Bogotá. Additional agricultural areas are needed to respond to the needs of this growing urban population. This will more likely occur in rural areas of the basin, outside from the city, where lands are available and still accessible due to their reasonable price. Agricultural land closer to the city is located in parallel to nearby transport infrastructures and may be quickly converted into urban areas (housing, commercial, or other urban use). These double dynamics tend to imply a transition from natural and agricultural areas towards artificial areas.

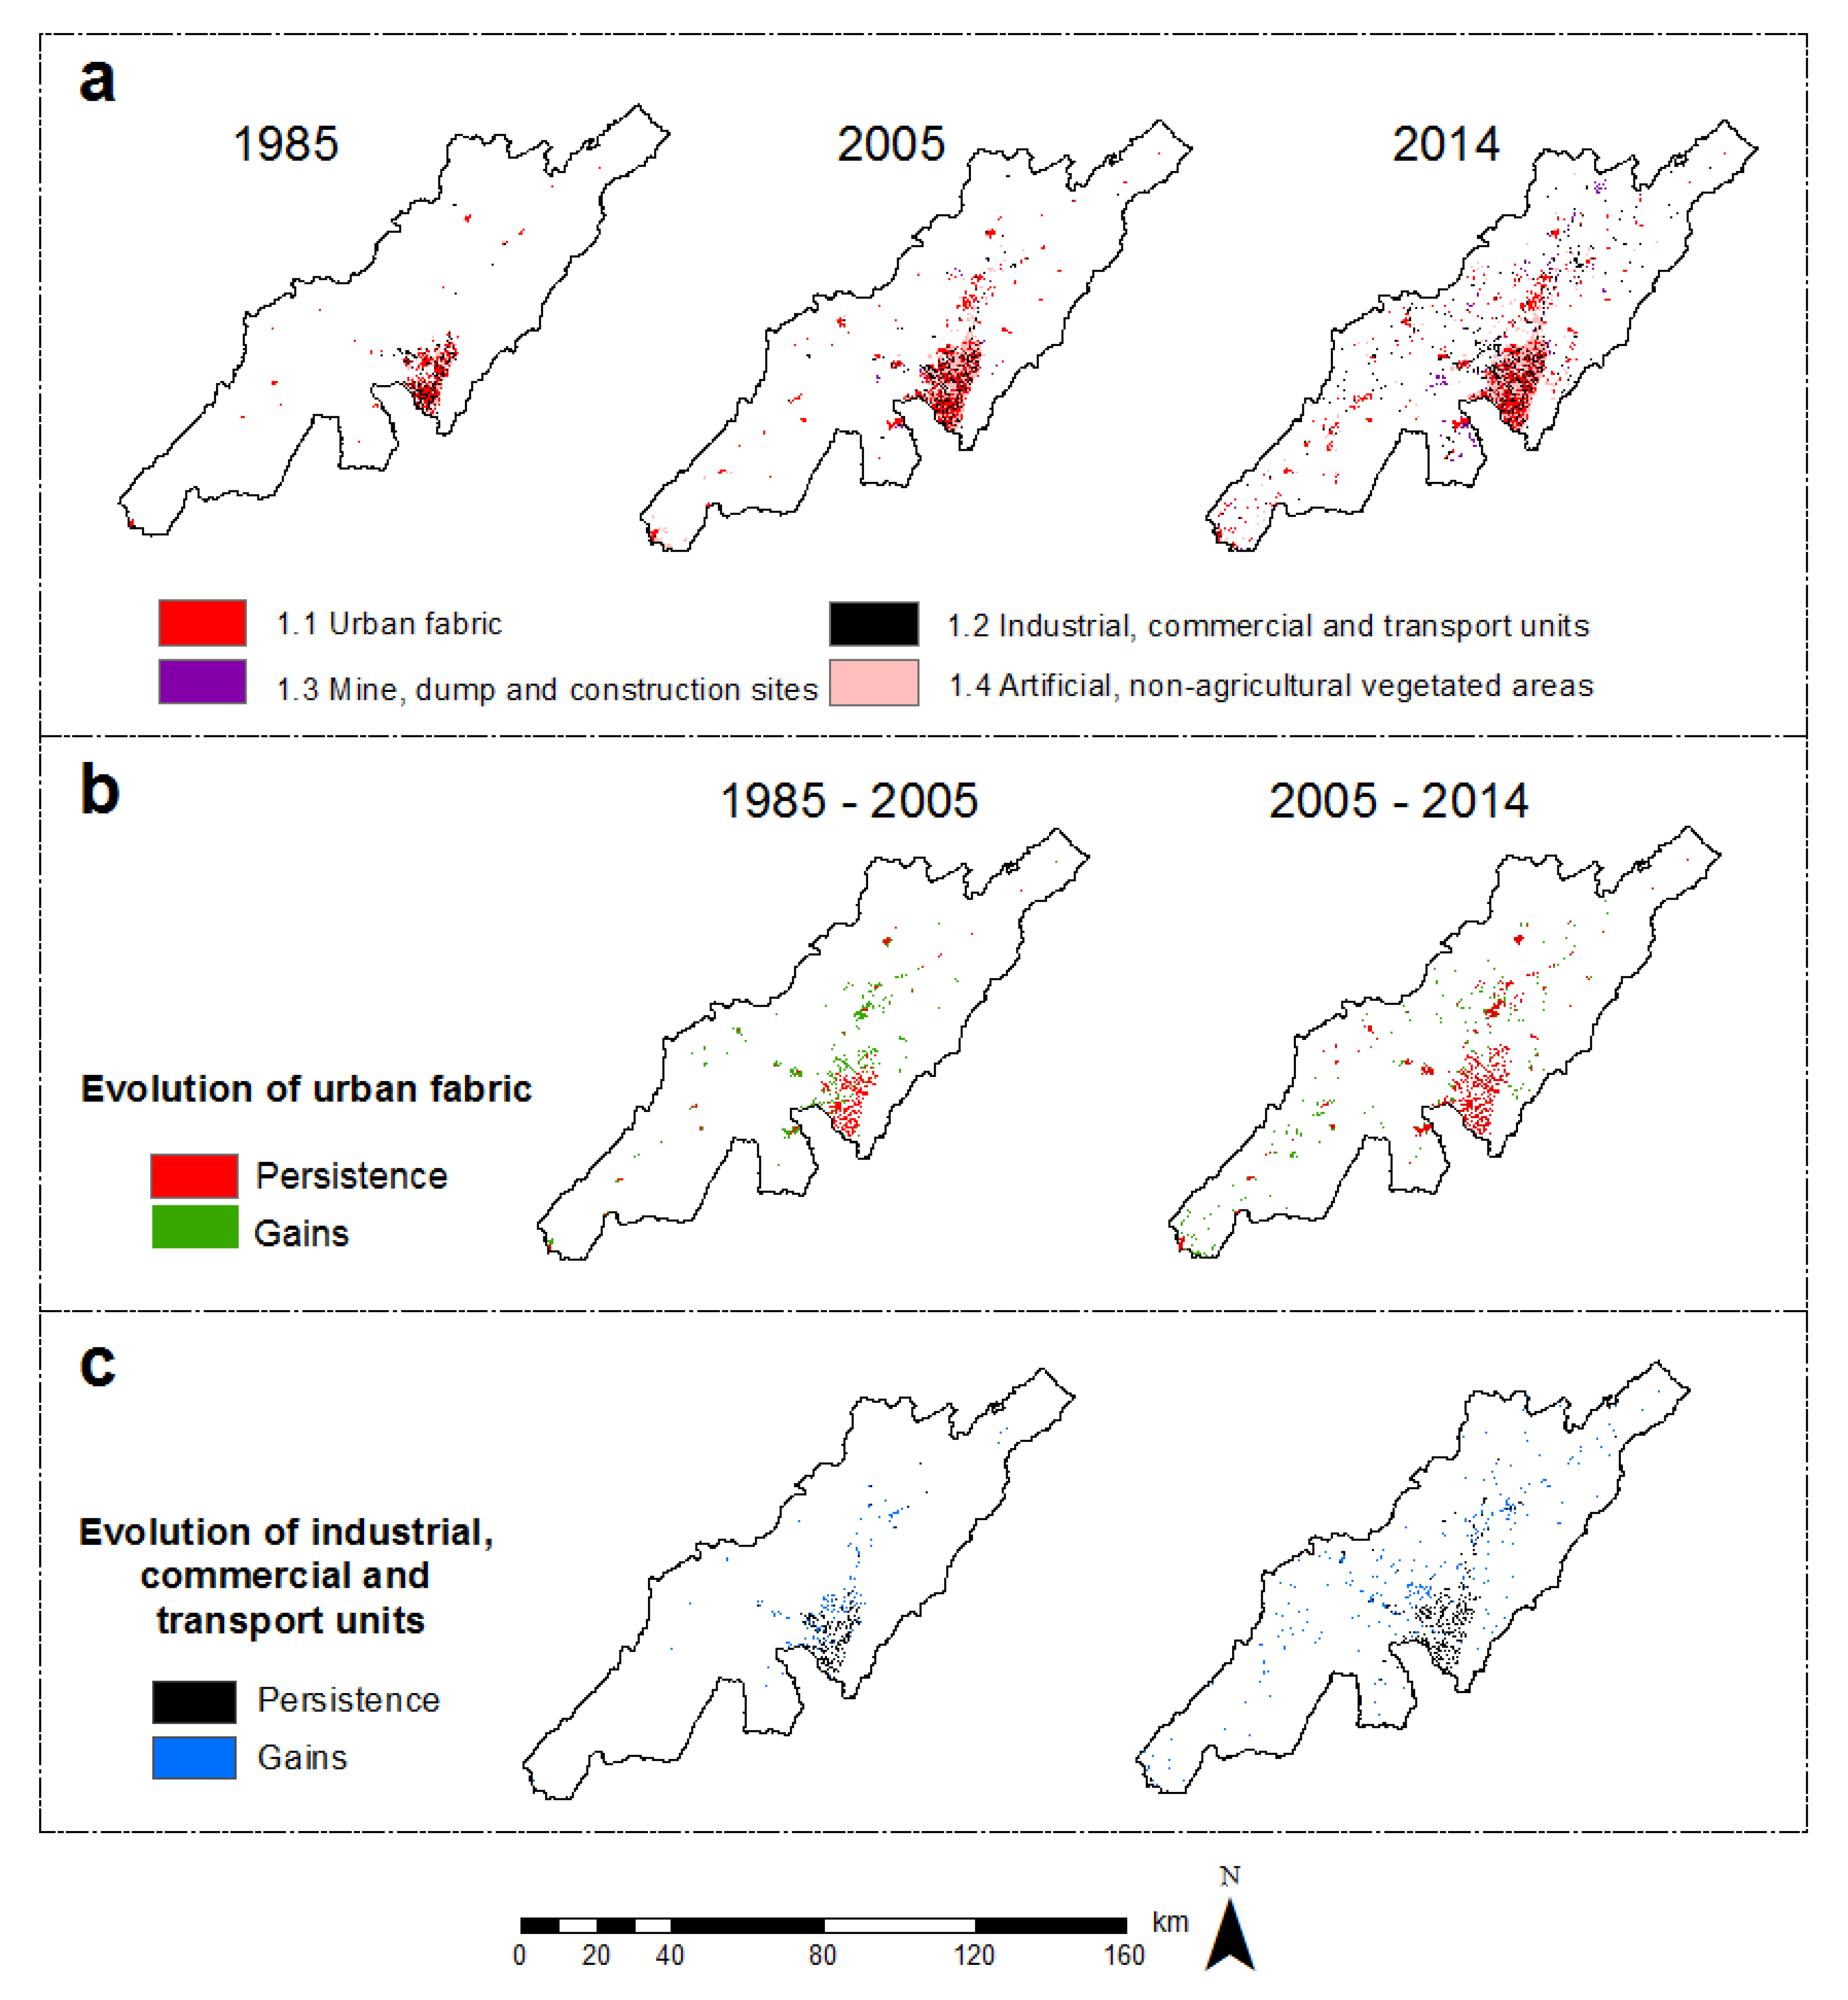
3.1.3. Transition towards Artificial Areas (from Categories 2 or 3 to Categories 1)

The analysis on LULC changes since 1985 (Table 3) shows the existence of a transition from agricultural lands and forest to urban/artificial area in the catchment. This phenomenon has affected 416.2 km2 in the whole period (1985 to 2014), and almost 50% of this area (208.8 km2) has been reallocated to urban uses between the 2005 and 2014. This fact indicates an acceleration of this urbanization between 2005 and 2014. The urban development of the city has been responsible for 89.3% of the changes related to anthropic land uses (all inside category 1).
In 1985, the total urban surface (all uses included, categories 1.1 to 1.4) was 151.2 km2, with Bogotá city the main urban center with a population of 4 million inhabitants in that date [44]. This surface reached 567.5 km2 in 2014, which is almost four times larger than in 1985. This overall growth has not been constant during the studied period. Between 1985 and 2005, urbanization expended to 358 km2 over these 20 years, while the urban area increased to 567 km2 between 2005 and 2014. Therefore, assuming a theoretical linear growth, this last decade saw a greater expansion of urban area (+21 km2/year) than before 2005 (+10.34 km2/year).
Housing/small commercial-services urban activities were the main use (47%). Industrial, commercial, and transport units covered 30% or the urban area of Bogotá, while 22% was dedicated to other urban use (urban parks and areas under construction) leading to the land anthropization. The urban fabric was much concentrated in Bogotá city in 1985 (Figure 7, Panel a). It extended toward the North and West side of Bogotá city, while the urban area during the last decade became more spread across the basin, with a growth of urban fabric around smallest city centers. This was first done by the conversion of the agricultural land located close to Bogotá City and along the transport infrastructures. This was driven by the demand for land for housing of a growing population. Indeed, low-income inhabitants had to move to the city’s outskirts, or even to nearby towns. This phenomenon of infrastructures and housing being built in small urban centers has caused economic growth around the city and a tendency towards integrating a large urban area that comprises the city and its metropolitan area [45,46].

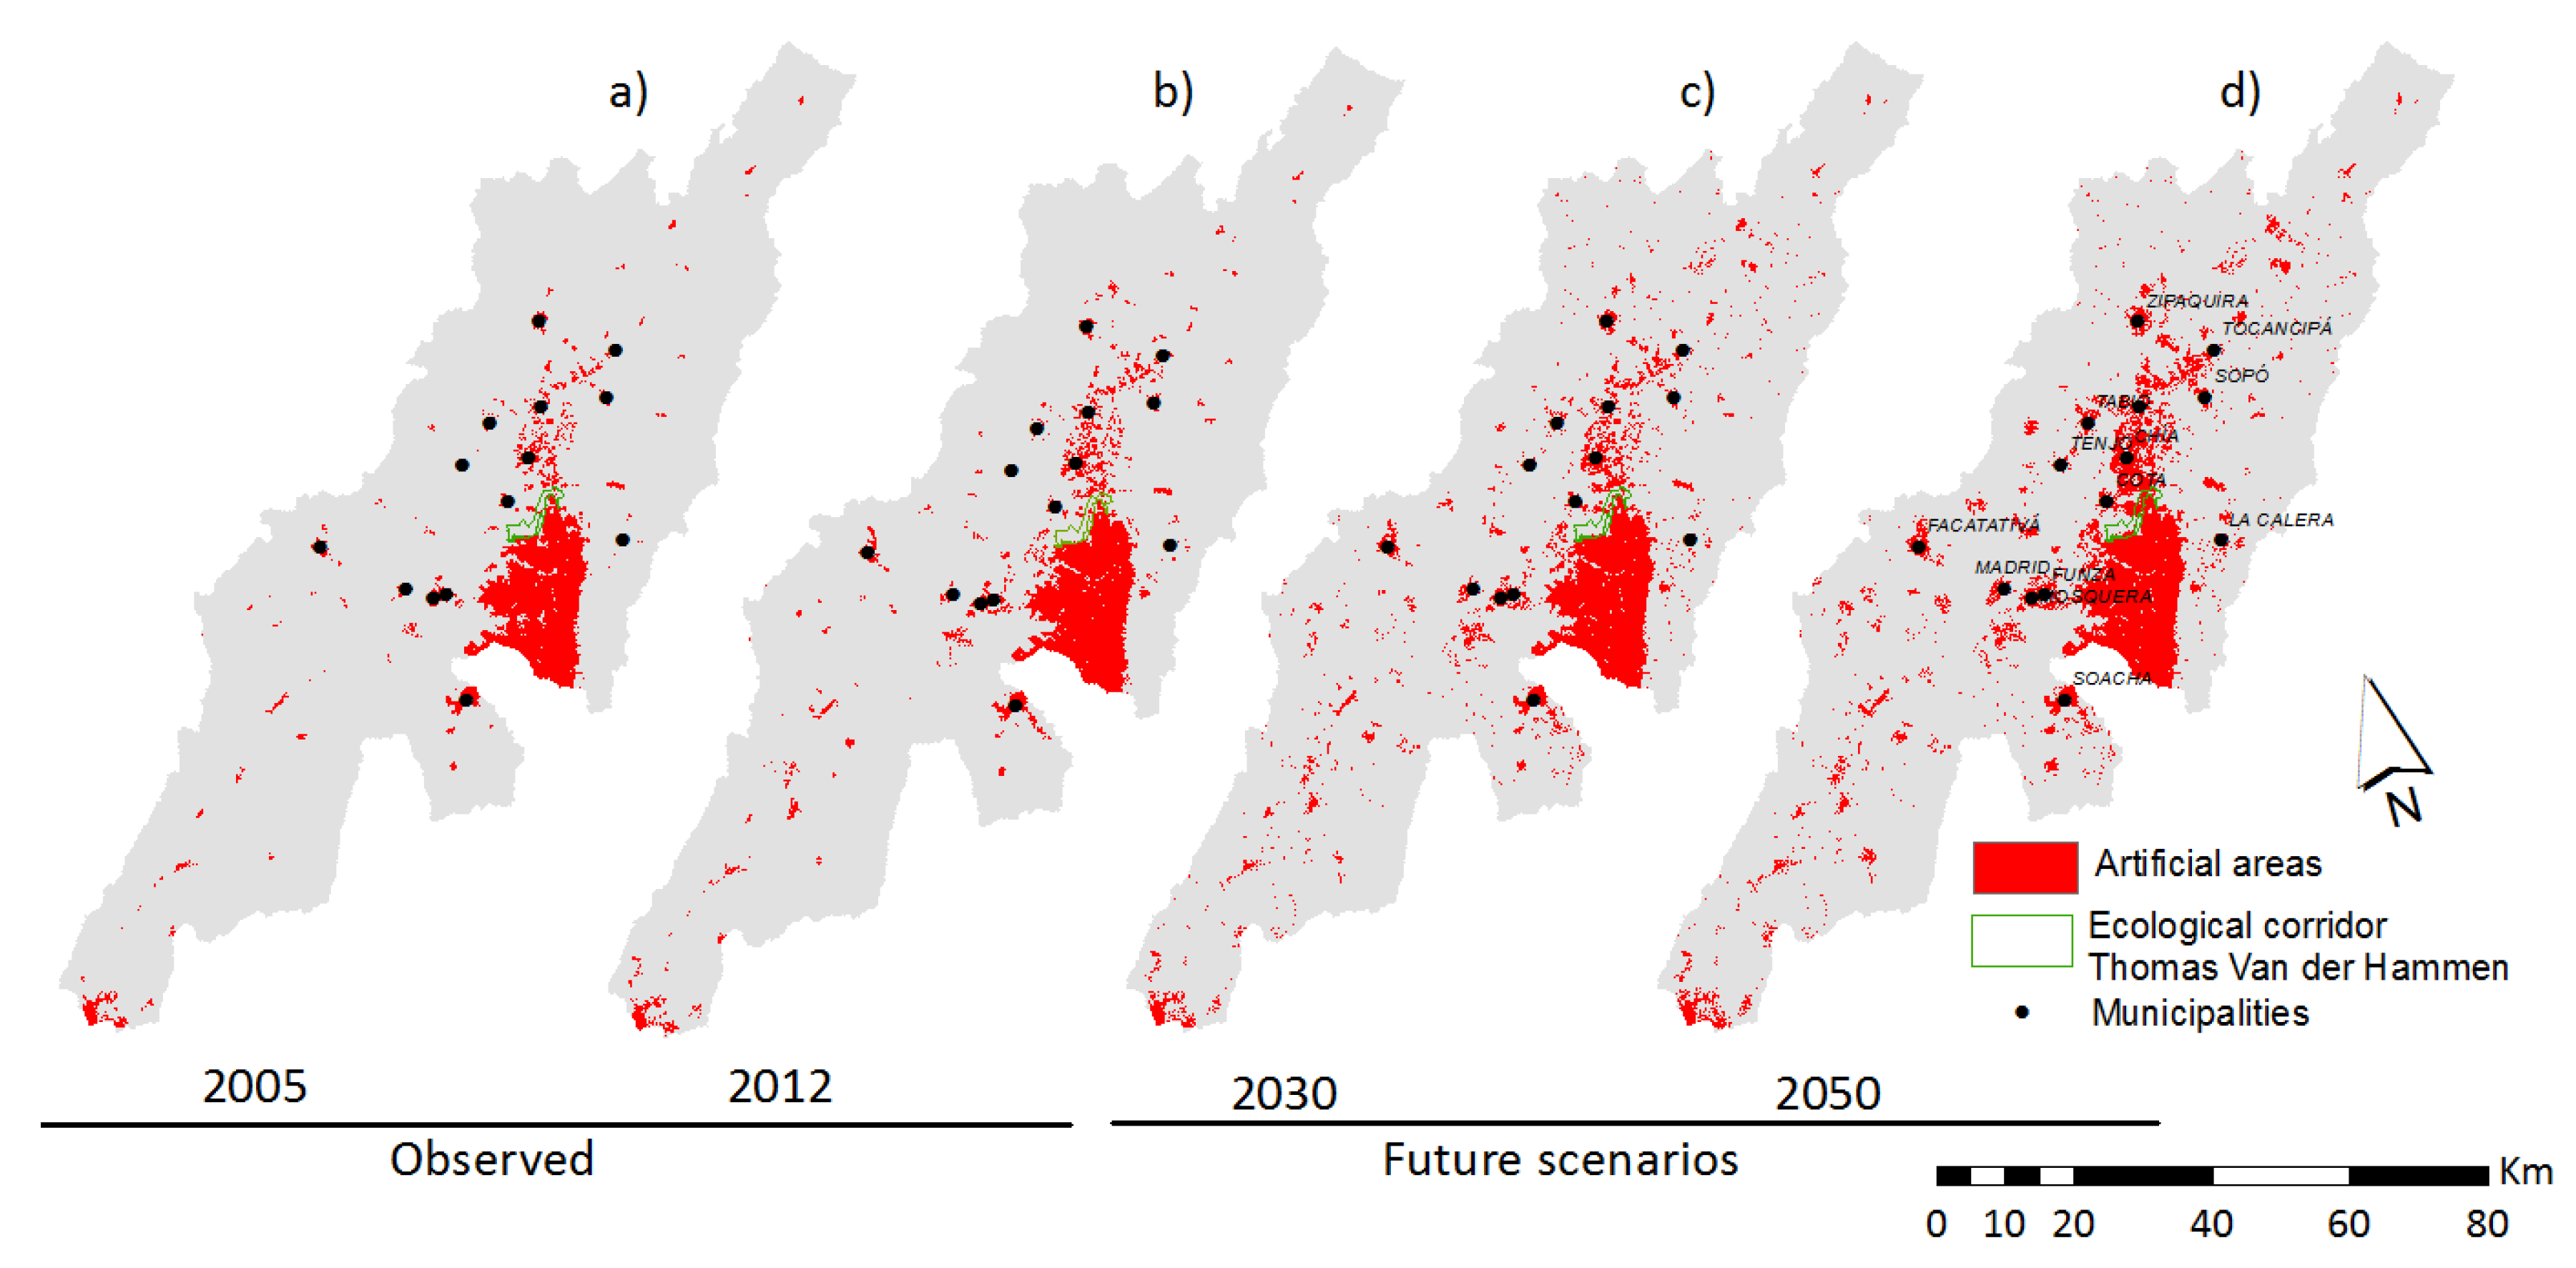
3.2. LULC Dynamics and Futures Scenarios

The validation of the model results was suitable for categories of forest and urban areas (Section 2.4) and, therefore, future LULC scenarios were selected at horizon 2030 and 2050 based on the transition probability matrix for the period from 2005 to 2012. Horizons 2030 and 2050 are coherent with the climate scenarios developed for the Bogotá river basin [47]. This will facilitate future work on the integration of the hydrological modeling and climate scenarios that are foreseen on this river basin.
It has been observed that urbanization in the Bogotá river basin will continue increasing at both horizons 2030 and 2050. Therefore, urban fabric category is expected to increase 149.9 km2 by 2050, representing an 84.2% gain compared to total urban area in 2012. In addition, 90.9 km2 are foreseen to be dedicated to industrial, commercial, and transport units, which represented 90.4% of the dedicated area in 2012. The artificial, non-agricultural vegetated areas would be reduced by 31.2 km2, which represented 25.8% of total area in 2012 (Table 4).
Model estimations show that urban areas in the Bogotá river basin will also increase. Bogotá municipality [32] considers that the population will grow to reach 14 million inhabitants in 2050 within the basin. Following these estimations, the population density is foreseen to decrease in the city center but will increase in Bogotá’s outskirts. This movement of population towards the periphery is certainly induced by two simultaneous drivers: the increasing land prices in the city center and the availability of housing/building at reasonable price in the outskirts [48]. Besides these economic drivers, urban growth and spatial spreading of Bogotá’s metropolitan area will also be constrained by national/municipal policy and recommendations in terms of land planning and development [49]. Restrictions are in place to protect natural forest in some specific areas (resolución-1114/2016 CAR). The spatial distribution of the urban area will probably be conditioned by communication infrastructures and implementation of new productive activities [32]. As shown in Figure 8, these urban area gains will take place mainly to the NW of the megacity along a general direction SW-NE, because this is a natural expansion area constrained by hilly topography on the East side of Bogotá metropolitan side. Work is currently underway to develop policies to the creation of the ecologic corridor to the forest protected area “Thomas Vander Hammer” [50]. This ecological corridor acts as an environmental connection both for flora and fauna of Bogotá Savannah while constraining the city growth towards the northern areas and avoiding it to merge completely with the metropolitan area. However, the pressure implied by the megacity’s growth does not allow for the recovery and improvement of the forest areas that are now located inside the metropolitan area [48,49]. These results show a trend on the city growth that will absorb the closer districts of its metropolitan area (Funza, Mosquera, Chía and Cota and south of the town of Soacha) to create a single large megacity [45].
This further extension will be first made over agricultural land. Heterogeneous agricultural areas are estimated to lose 898.5 km2 by 2050, which represents 60.4% of the area in 2012. Pastureland is expected to grow up to 934.2 km2, which represents an increase of 50% on the period 2012–2050. However, this result may not be totally accurate due to the considerations explained before (see Section 2.4.1).
There are two different evolutions about the area covered by natural vegetation. The shrubs and/or herbaceous vegetation will suffer a strong reduction within the basin (areal decrease to 309.4 km2 in 2050), but this will not significantly affect the Páramos ecosystems.
The forest is expected to recover with an increase of 106.7 km2 for 2050 (21% of 2012 surface). However, a significant fragmentation will persist following the pattern detected by historical analysis (Figure 9).
Impacts related to forest fragmentation are expected to be important inside the basin. Climate change effects are expected to lead to more frequent and greater dry periods, thereby causing increased forest fires (burning), air pollution, and diminishing water availability. Additionally, alterations of the rain regime may cause more frequent extreme events, which would increase landslides mainly in areas with higher slopes. Consequently, fragmentation of the forest category should be included as soon as possible in forest protection, land planning, and connectivity policies.
These forecasted LUCL changes call for a reinforcement of the current policy and urban planning, in particular, inside the Bogotá metropolitan area, but also across the river basin, to ensure sustainable use and development. First, the effort of the policy and urban planning in the Bogotá megacity, in particular in the Eastern part, would need to be reinforced to ensure an efficient development and access to basic services, housing, green spaces, and jobs. This will support a better quality of life in balance with the river basin resources. This may include: (1) the concentration of the urban expansion and reorganisation in particular of eastern outskirt of the city. This has to be done to avoid anarchical spreading and limit, for instance, the daily congestion due to the displacement of workers to and from the Bogotá city. Renovation of urban areas and the organization of transports (in particular public transport) are crucial [51]. To do so, the collaboration and harmonization of the different Urban Plans (POT) of Bogotá and the metropolitan municipalities would need to be reinforced; (2) the planning of the connections between Bogotá and neighboring cities (Funza, Mosquera, Chía, and Cota and south of the town of Soacha). This is one key element to guide future urban expansion; (3) despite the protection of specific forest areas was and is efficient, POT should also include measures to limit the fragmentation of this forest. This should be combined with measures to organize pastoral activities that tend to gradually gain on the forest [30], contributing to this fragmentation. Pastures are expected indeed to progress by 50% at horizon 2050.

4. Conclusions

This work shows how improving LULC change dynamics knowledge becomes essential considering the continued expansion of megacities in the world. It has been seen that assessing qualitative and quantitative impacts on the environment and natural resources allow for a better understanding of land cover challenges and policy needs to ensure good living conditions of urban populations. This is even more important in the context of climate change. These results have been observed when analyzing the LULC dynamics of the Bogotá river basin for the period 1985 to 2014 and the forecasting scenarios at horizon 2030 to 2050.
The work summarized in this paper shows two important outcomes: (i) the main LULC changes that took place between 1985 and 2012 inside the Bogotá river basin were identified, and (ii) the results of the model’s prediction to generate future scenarios for 2030 and 2050 were validated. The developed model was able to predict LULC changes, with an 85% positive prediction rate for urban uses and a very slight overestimation of agricultural uses and natural vegetated areas.
The analysis of historical dynamics shows the strong and structural influence of the expanding megacity of Bogotá over the whole river basin LULC dynamics. Since 1985, LULC change dynamics have showed a general reallocation trend of forest and agricultural areas toward urban areas.
In particular, from 1985 to 2005, the Andean forest has been degraded and fragmented, over large and continuous areas in the northern part of the basin. In the lower part of the basin, the fragmentation process is happening differently due to its topographic conditions. However, loss of forest area is still important. Between 2005 and 2014, this degradation was very much limited due to protection policies.
A transition from agricultural or vegetated areas to artificial areas has mainly occurred, as expected, around the metropolitan area of Bogotá and also follow the spreading of urban areas along transport infrastructures and around secondary cities.
LULC simulations confirmed the strong influence that the megacity of Bogotá has on the LULC changes and a trend towards a generalized growth of urban areas within the basin.
At horizon 2030–2050, urbanization is expected to spread mainly on the eastern side of Bogotá and, in particular, toward the direction SW-NW. This will imply a re-affectation of agricultural and natural land near the metropolitan area, potentially creating a larger urban continuum between Bogotá and nearest cities. Therefore, efforts in urban planning and coordination between different municipalities are important to ensure an efficient and compact urban development. These efforts make it possible to keep a minimum balance between urban and vegetal areas in the metropolitan areas (Section 3.2). Nevertheless, it has been seen that future actions taken will directly impact the quality of life of the inhabitants.
Forests areas are predicted to increase, replacing mainly the scrub vegetation, assuming that current protection polices will not be modified. Indeed, current land-planning management tools that organize and manage the land uses under a 12-year period consider as priorities for the development of the megacity the protection of the natural areas, the adaptation to climate change considerations, and solid waste management issues. However, forest fragmentation will remain and make its recovery difficult. This situation may jeopardize the basin’s environmental balance and it will increase natural risks like flooding and landslides. Since the pastures are expected to increase greatly by 2050, the land-planning management tools would need to further address the organisation of pastoral activities. This is to prevent Forest and Páramos ecosystems fragmentation across the basin, since they are strategic ecosystems for water supply, flood control, and biodiversity.
Future research should focus on assessing whether the river basin will be able to respond to the increasing water demand, considering the forecasting trends under different climate change scenarios that will affect precipitation patterns (temporally and spatially). To perform this task, hydrological and meteorological data should be integrated to the LULC results presented to model, considering the water availability under future climate change scenarios at horizons 2030-2050. This future research will provide useful knowledge to estimate the risk of water shortage and/or scarcity in Bogotá city at horizon 2030/2050, but also food security issues. Besides this, it will provide quantitative and qualitative elements to policy-makers and managers of the city to anticipate and mitigate potential risks.

Author Contributions

Conceptualization, C.P.R., and F.F.; methodology, C.P.R., and A.G.-A.; software, C.P.R., and A.G.-A.; validation, C.P.R., and A.G.-A.; formal analysis, C.P.R., A.G.-A. and C.D.; investigation, C.P.R.; resources, F.F.; data curation, C.P.R. and A.G.-A.; writing—original draft preparation, C.P.R.; writing—review and editing, C.D., and F.F.; supervision, F.F.; project administration, F.F.; funding acquisition, F.F. All authors have read and agreed to the published version of the manuscript.

Funding

This research was funded by the SANTO TOMÁS UNIVERSITY (Colombia) and the Ministry of Science and Innovation of Spain through the research projects TETISMED (CGL2014-58127-C3-3-R) and TETISCHANGE (ref RTI2018-093717-B-I00).

Acknowledgments

The Autonomous Corporation of the Cundinamarca region (CAR) and the Cadastre of the city of Bogotá provided the data set.

Conflicts of Interest

The authors declare no conflict of interest.

References

  1. UNDESA. World Population Prospects 2019: Highlights; UNDESA: New York, NY, USA, 2019. [Google Scholar]
  2. UNDESA. World Urbanization Prospect-The 2018 Revisions; UNDESA: New York, NY, USA, 2019. [Google Scholar]
  3. Aguilar, A.G.; Ward, P.M. Globalization, regional development, and mega-city expansion in Latin America: Analyzing Mexico City’s peri-urban hinterland. Cities 2003, 20, 3–21. [Google Scholar] [CrossRef]
  4. Kourtit, K.; Nijkamp, P.; Reid, N. The new urban world: Challenges and policy. Appl. Geogr. 2014, 49, 1–3. [Google Scholar] [CrossRef]
  5. Grimm, N.B.; Faeth, S.H.; Golubiewski, N.E.; Redman, C.L.; Wu, J.; Bai, X.; Briggs, J.M. Global change and the ecology of cities. Science 2008, 319, 756–760. [Google Scholar] [CrossRef] [PubMed] [Green Version]
  6. European Commission and Joint Research Centre (JRC). Atlas of the Human Planet 2018—A World of Cities; European Commission: Luxembourg, 2018. [Google Scholar]
  7. Alexandratos, N.; Bruinsma, J. World Agriculture towards 2030/2050: The 2012 Revision; FAO: Rome, Italy, 2012. [Google Scholar]
  8. Lin, Y.-P.; Chu, H.-J.; Wu, C.-F.; Verburg, P.H. Predictive ability of logistic regression, auto-logistic regression and neural network models in empirical land-use change modeling—A case study. Int. J. Geogr. Inf. Sci. 2011, 25, 65–87. [Google Scholar] [CrossRef] [Green Version]
  9. Heinrichs, D.; Krellenberg, K.; Hansjürgens, B.; Martínez, F. Risk Habitat Megacity; Springer Science & Business Media: Berlin, Germany, 2012. [Google Scholar]
  10. Rothwell, A.; Ridoutt, B.; Page, G.; Bellotti, W. Feeding and housing the urban population: Environmental impacts at the peri-urban interface under different land-use scenarios. Land Use Policy 2015, 48, 377–388. [Google Scholar] [CrossRef] [Green Version]
  11. Haas, J.; Ban, Y. Urban growth and environmental impacts in Jing-Jin-Ji, the Yangtze, River Delta and the Pearl River Delta. Int. J. Appl. Earth Obs. Geoinf. 2014, 30, 42–55. [Google Scholar] [CrossRef]
  12. Tian, L.; Li, Y.; Yan, Y.; Wang, B. Measuring urban sprawl and exploring the role planning plays: A shanghai case study. Land Use Policy 2017, 67, 426–435. [Google Scholar] [CrossRef]
  13. Veldkamp, A.; Fresco, L. CLUE: A conceptual model to study the Conversion of Land Use and its Effects. Ecol. Model. 1996, 61, 253–270. [Google Scholar] [CrossRef]
  14. Kok, K. The role of population in understanding Honduran land use patterns. J. Environ. Manag. 2004, 15, 35–50. [Google Scholar] [CrossRef]
  15. Brown, L.A. The city in 2050: A kaleidoscopic perspective. Appl. Geogr. 2014, 49, 4–11. [Google Scholar] [CrossRef]
  16. Rodríguez, J.P.; Camacho, L.A.; Raciny, I.C.; Maksimovic, C.; Mcintyre, N. Bogotá´s urban drainage system: Context, research activities and perspectives. In Proceedings of the 10th National Hydrology Symposium, British Hydrological Society, Exeter, UK, 15–17 September 2008; pp. 378–386. [Google Scholar]
  17. Corporación Autonoma Regional de Cundinamarca (CAR). Ajuste del Plan de Ordenamiento y Manejo de la Cuenca del río Bogotá; CAR: Bogotá, Colombia, 2016. [Google Scholar]
  18. Economic Commission for Latin America and the Caribbean (ECLAC). Adaptation to Climate Change in Megacities of Latin America; United Nations: Santiago, Chile, 2014; p. 98. [Google Scholar]
  19. Islam, M.S.; Ahmed, R. Land Use Change Prediction In Dhaka City Using Gis Aided Markov Chain Modeling. J. Life Earth Sci. 1970, 6, 81–89. [Google Scholar] [CrossRef] [Green Version]
  20. Sangermano, F.; Toledano, J.; Eastman, R. Land cover change in the Bolivian Amazon and its implications for REDD+ and endemic biodiversity. Landsc. Ecol. 2012, 27, 571–584. [Google Scholar] [CrossRef]
  21. He, Y.; Ai, B.; Yao, Y.; Zhong, F. Deriving urban dynamic evolution rules from self-adaptive cellular automata with multi-temporal remote sensing images. Int. J. Appl. Earth Obs. Geoinf. 2015, 38, 164–174. [Google Scholar] [CrossRef]
  22. Corporacion Autonoma Regional de Cundinamarca CAR and Consorcio Huitaca. Ajuste del Plan de Ordenamiento y Manejo de la Cuenca del río Bogotá- Fase Diagnóstico; CAR: Bogotá, DC, Colombia, 2017. [Google Scholar]
  23. Vásquez, D.L.A.; Balslev, H.; Sklenář, P. Human impact on tropical-alpine plant diversity in the northern Andes. Biodivers. Conserv. 2015, 24, 2673–2683. [Google Scholar] [CrossRef]
  24. Delgado, J. La Construcción Social del Paisaje de la Sabana de Bogotá 1880–1890; Universidad Nacional de Colombia: Bogotá, Colombia, 2010. [Google Scholar]
  25. IAvH. Atlas de Páramos; Primera, Ed.; Grey Comercializadora Ltda.: Bogotá, Colombia, 2007; Volume 1. [Google Scholar]
  26. Sarmiento Pinzón, C.E.; Cadena Vargas, C.E.; Sarmiento Giraldo, M.V.; Zapata Jiménez, J.A. Aportes a la Conservación Estratégica de los Páramos de Colombia: Actualizacién de la Cartografía de los Complejos de Páramo a Escala 1:100.000; Instituto de Investigación de Recursos Biológicos Alexander von Humboldt: Bogotá, Colombia, 2013. [Google Scholar]
  27. Alonso, D.L.; Pérez, R.; Okio, C.K.Y.A.; Castillo, E. Assessment of mining activity on arsenic contamination in surface water and sediments in southwestern area of Santurbán paramo, Colombia. J. Environ. Manag. 2020, 264, 110478. [Google Scholar] [CrossRef]
  28. Alcaldía Mayor de Bogotá. Plan Distrital de Desarrollo 2016–2020; Alcaldía Mayor de Bogotá: Bogotá, Colombia, 2016. [Google Scholar]
  29. Hofstede. The effects of grazing and burning on soil and plant nutrient concentrations in Colombian p, Aramo grasslands. Plant Soil 1995, 173, 111–132. [Google Scholar] [CrossRef] [Green Version]
  30. Buytaert, W.; Célleri, R.; De Bièvre, B.; Cisneros, F.; Wyseure, G.; Deckers, J.; Hofstede, R. Human impact on the hydrology of the Andean páramos. Earth-Sci. Rev. 2006, 79, 53–72. [Google Scholar] [CrossRef]
  31. Departamento Administrativo Nacional de Estadistica DANE. Censo Nacional de Población y Vivienda—CNPV 2018; DANE: Bogotá, Colombia, 2018. [Google Scholar]
  32. Alcaldía Mayor de Bogotá. Análisis Demográfico y Proyecciones Poblacionales de Bogotá; Alcaldía Mayor de Bogotá: Bogotá, Colombia, 2018. [Google Scholar]
  33. Bocarejo, J.P.; Portilla, I.; Pérez, M.A. Impact of Transmilenio on density, land use, and land value in Bogotá. Res. Transp. Econ. 2013, 40, 78–86. [Google Scholar] [CrossRef]
  34. Instituto de Hidrología Meteorología y Estudios Ambientales (IDEAM). Leyenda Nacional de Coberturas de la Tierra. Metodología CORINE Land Cover adaptada para Colombia Escala 1:100.000; Editorial Scripto Ltda.: Bogotá, Colombia, 2010. [Google Scholar]
  35. Mas, J.; Kolb, M.; Paegelow, M.; Teresa, M.; Olmedo, C.; Houet, T. Inductive pattern-based land use/cover change models: A comparison of four software packages. Environ. Model. Softw. 2014, 51, 94–111. [Google Scholar] [CrossRef] [Green Version]
  36. Pontius, R. Criteria to Confirm Models that Simulate Deforestation and Carbon Disturbance. Land 2018, 7, 105. [Google Scholar] [CrossRef] [Green Version]
  37. Jat, M.K.; Choudhary, M.; Saxena, A. Application of geo-spatial techniques and cellular automata for modelling urban growth of a heterogeneous urban fringe. Egypt. J. Remote Sens. Space Sci. 2017, 20, 223–241. [Google Scholar] [CrossRef]
  38. Stellian, R.; Danna-Buitrago, J.P. Competitividad de los productos agropecuarios colombianos en el marco del tratado de libre comercio con los Estados Unidos: Análisis de las ventajas comparativas. Cepal Rev. 2017, 122, 141. [Google Scholar] [CrossRef] [Green Version]
  39. Saunders, D.A.; Hobbs, R.J.; Margules, C.R.; Biology, C.; Mar, N.; Saunders, D.; Hobbs, R.; Margules, C. Biological Consequences of Ecosystem Fragmentation: A Review. Conserv. Biol. 1991, 5, 18–32. [Google Scholar] [CrossRef]
  40. Fischer, J.; Lindenmayer, D.B. Landscape modification and habitat fragmentation: A synthesis. Glob. Ecol. Biogeogr. 2007, 16, 265–280. [Google Scholar] [CrossRef]
  41. Rojas, I.; Becerra, P.; Gálvez, N.; Laker, J.; Bonacic, C.; Hester, A. Relationship between fragmentation, degradation and native and exotic species richness in an Andean temperate forest of Chile. Gayana Botánica 2011, 68, 163–175. [Google Scholar] [CrossRef]
  42. Mendoza, J.E.S.; Etter, A.R. Multitemporal analysis (1940–1996) of land cover changes in the southwestern Bogotá highplain (Colombia). Landsc. Urban Plan. 2002, 59, 147–158. [Google Scholar] [CrossRef]
  43. IGAC Instituto Geográfico Agustín Codazzi. ¿En dónde están los mejores suelos para cultivar en el país?|Instituto Geográfico Agustín Codazzi. Available online: https://igac.gov.co/es/noticias/en-donde-estan-los-mejores-suelos-para-cultivar-en-el-pais (accessed on 3 April 2020).
  44. Departamento Administrativo Nacional de Estadistica DANE. XV Censo Nacional de Población y IV de Vivienda; DANE: Bogotá, Colombia, 1986. [Google Scholar]
  45. Martínez Herrera, J. El Proceso de Urbanización en los Municipios de la Sabana de Bogotá ∗; Universidad Piloto: Bogotá, Colombia, 2015. [Google Scholar]
  46. Oviedo, D.; Dávila, J.D. Transport, urban development and the peripheral poor in Colombia - Placing splintering urbanism in the context of transport networks. J. Transp. Geogr. 2016, 51, 180–192. [Google Scholar] [CrossRef] [Green Version]
  47. Pabón Caicedo, J.D. El Cambio Climático en el territorio de la Corporación Auntónoma Regional de Cundinamarca; CAR: Bogotá, Colombia, 2011. [Google Scholar]
  48. Lizarazo, P. Cuadernos de Desarrollo Económico 27; RSA: Bogotá, Colombia, 2013. [Google Scholar]
  49. Secretaria Distrital de Planeación. Plan de Ordenamiento Territorial de Bogotá D.C Documento Resumen; Secretaria Distrital de Planeación: Bogotá, Colombia, 2018. [Google Scholar]
  50. Corporacion Autonoma Regional de Cundinamarca CAR. Plan de Manejo Ambiental de la Reserva Forestal Regional Productora del Norte de Bogotá, D.C. Thomas van der Hammen; CAR: Bogotá, Colombia, 2014. [Google Scholar]
  51. Tijacá-Peña, D. Sistema Inteligente y Colaborativo Para la Optimización del Uso de Transporte Publico SICOUT. Master’s Thesis, Universidad Internacional de la Rioja UNIR, Logroño, Spain, 2017. [Google Scholar]
Figure 1. Study area: the Bogotá river basin, Colombia.
Sustainability 12 03884 g001
Figure 2. Final historical land use/land cover (LULC) maps for the Bogotá river basin using CORINE Land Cover level 2 classification in: (a) 1985, (b) 2005, (c) 2012, and (d) 2014.
Sustainability 12 03884 g002
Figure 3. Pixel-to-pixel comparation for urban uses in to map foreseen and map observed for 2014.
Sustainability 12 03884 g003
Figure 4. Forest fragmentation in the Bogotá river catchment. Left: Forest fragmentation that occurred in the area from 1985 to 2005. Right: Forest fragmentation that occurred in the area from 2005 to 2014.
Sustainability 12 03884 g004
Figure 5. Evolution of natural vegetation surface from 1985 to 2014.
Sustainability 12 03884 g005
Figure 6. Left: Area reallocated from forest (cat 3.1) to agricultural areas (all cat 2) since 1985.
Sustainability 12 03884 g006
Figure 7. Artificial LULCs in the Bogotá river basin: (a) situation in 1985, 2005, and 2014; (b) evolution of urban fabric; (c) evolution of industrial, commercial, and transport units.
Sustainability 12 03884 g007
Figure 8. Evolution of urban land uses in the Bogotá river basin: from the historical (a) 2005 and (b) 2012, to the (c) 2030 and (d) 2050 predicted scenarios.
Sustainability 12 03884 g008
Figure 9. Evolution of forest, scrub and herbaceous, and open spaces land uses in the Bogotá river basin: for (a) 2005 and (b) 2012 (historical scenarios) and for (c) 2030 and (d) 2050 (predicted scenarios).
Sustainability 12 03884 g009
Table 1. Results for the LCM validation in year 2014 aggregated in LULC categories.
LULC CORINE Category% Area in the BasinObserved (km2)Forecasted
(km2)
Forecasted/Observed
(%)
1. Artificial areas
1.1 Urban fabric4.0216.4185.285.6
1.2 Industrial, commercial, and transport units2.9157.0104.666.6
1.3 Mine, dump, and construction sites0.631.417.756.5
1.4 Artificial, non-agricultural vegetated areas3.0162.7118.773.0
Subtotal10.7567.5426.272.5
2. Agricultural areas
2.1 Arable land4.3237.648.820.5
2.2 Permanent crops5.1277.298.335.5
2.3 Pastures44.82449.32229.191.0
2.4 Heterogeneous agricultural areas8.9485.91181.5243.2
Subtotal63.13450.03557.6103.1
3. Forest and semi-natural areas
3.1 Forests8.5462.4517.8112.0
3.2 Scrub and/or herbaceous vegetation associations15.6855.2832.797.4
3.3 Open spaces with little or no vegetation0.735.936.7102.2
Subtotal24.71353.51387.1102.5
4.1 Inland wetlands0.422.422.4100.0
5.1 Inland waters1.477.977.9100.0
Total 5471.3
Table 2. Parameters and performance of the MLP neural network implemented to analyze the potential transition of the land in the Bogotá river basin (period 2005–2012).
Submodel
Parameters and Performance FunctionsGreen-UrbAgri-Urb
Input layer neurons14
Hidden layer neurons76
Output layer neurons28
Requested samples per class500190
Final learning rate0.00050.0010
Momentum factor0.50.5
Sigmoid constant11
Stopping criteria: iterations1000010000
Training RMS0.41260.2487
Testing RMS0.40450.2509
Accuracy rate93.21%56.76%
Skill measure0.86430.5058
Table 3. Historical LULC changes between final map (2014) and previous maps (1985 and 2005) of the Bogotá River Basin (areas in km² and LULC categories of CORINE Land Cover classification). Example: Since the areas covered by Forests declined from 1125.72 km² in 1985 to 462.43 in 2014, 404.62 km² remained classified as Forest (cat 3.1) while 21.91 became pastures (cat 2.3) between 1985 and 2014.
Final LULC 2014 Category Total (1985)
1.11.21.31.42.12.22.32.43.13.23.3
LULC
1985
1.171.43----------71.43
1.2-46.03---------46.03
1.3--0.30--------0.3
1.4---33.41-------33.41
2.1----0.270.130.240.06-0.090.010.8
2.2 0.60.370.040.420.618.693.980.14-0.04-14.89
2.381.9054.8816.4755.03130.1667.471173.08169.0121.9150.6517.341837.9
2.4 52.3144.61461.193.27159.881059.78254.3914.0150.791.331795.47
3.17.167.805.3510.148.7540.93177.9155.93404.62402.674.621125.72
3.20.711.481.10.94.530.0430.715.8820.80345.873.33415.51
3.32.331.804.121.660.040.013.620.481.095.119.2329.49
Final LULC 2014Class total (2005)
LULC
2005
1.1151.17----------151.17
1.2-82.38---------82.38
1.30.240.867.62--------8.72
1.46.532.05-107.71-------116.29
2.11.170.960.060.6327.481.5659.436.71-1.630.0399.66
2.2 4.534.660.041.173.40140.3635.8590.87-16.070.05297
2.321.9326.329.9530.4450.2530.53982.7463.640.0318.303.411237.54
2.4 26.6135.255.7818.06152.5296.371280.09313.48-38.183.051969.39
3.10.581.090.270.830.911.5322.131.61418.7235.870.33483.87
3.22.262.933.103.092.916.7863.419.2843.01734.196.52877.48
3.31.420.474.560.730.160.025.670.300.6710.9822.4747.45
Class total (2014)216.44156.9731.38162.66237.63277.152449.32485.89462.43855.2235.86
where: 1.1 Urban fabric
    1.2 Industrial, commercial and transport units
    1.3 Mine, dump and construction sites
    1.4 Artificial, non-agricultural vegetated areas
2.1 Arable land
2.2 Permanent crops
2.3 Pastures
2.4 Heterogeneous agricultural areas
3.1 Forests
3.2 Scrub and/or herbaceous vegetation associations
3.3 Open spaces with little or no vegetation
Table 4. Predictions of the LULCs for the scenarios 2030 and 2050 with the LCM tool and comparison with the initial year 2012.
LULC CORINE CategoryArea in km²% in the BasinGain or Loss between 2050 and 2012
201220302050201220302050km2%
1. Urban areas
1.1 Urban fabric178.1248.0328.03.34.56.0149.984.2
1.2 Industrial, commercial and transport units100.6140.7191.51.82.63.590.990.4
1.3 Mine, dump and construction sites17.717.717.70.30.30.30.00.0
1.4 Artificial, non-agricultural vegetated areas120.7104.389.52.21.91.6−31.2−25.8
Subtotal417.1510.7626.77.69.311.5209.650.3
2. Agricultural areas
2.1 Arable land48.848.848.80.90.90.90.00.0
2.2 Permanent crops147.783.2105.32.71.51.9−42.4−28.7
2.3 Pastures1867.82779.62802.034.150.851.2934.250.0
2.4 Heterogeneous agricultural areas1487.5657.7589.027.212.010.8−898.5−60.4
Subtotal3551.73569.33545.064.965.264.8−6.8−0.2
3. Natural areas
3.1 Forests508.6574.6615.39.310.511.2106.721
3.2 Scrub and/or herbaceous vegetation associations856.7679.7547.315.712.410.0−309.4−36.1
3.3 Open spaces with little or no vegetation36.736.736.70.70.70.70.00.0
Subtotal Open spaces14021290.9119925.623.621.9−202.8−14.5
4 Inland wetlands22.422.422.40.40.40.40.00.0
5 Inland waters77.977.977.91.41.41.40.00.0
The basin’s total area5471.2

