Insights from the Sustainability Monitoring Tool SUMINISTRO Applied to a Case Study System of Prospective Wood-Based Industry Networks in Central Germany


Abstract
:1. Introduction
- (1)
- Production of new bio-based materials may require an increased manufacturing intensity, and expansion of production capacities for these materials may lead to an increased demand for regional fresh wood resources;
- (2)
- Rising final energy demands for fossil-based process energy supplies in the wood manufacturing sector [3] and competition for wood-based energy carriers may require more energy-efficient processes or innovations in fuel substitution;
- (3)
- Additional capacities may increase the competition between material and energy-related use of available woody biomass resources and thus set strong constraints on the implementation and optimization of waste-wood cascading systems [4];
- (4)
- The varying degrees of industrial symbiosis among value-added industrial networks may have their own trade-offs in impact mitigation and resource substitution [5].
1.1. Definition of the Terms and Function of A Wood-Based Bioeconomy Region
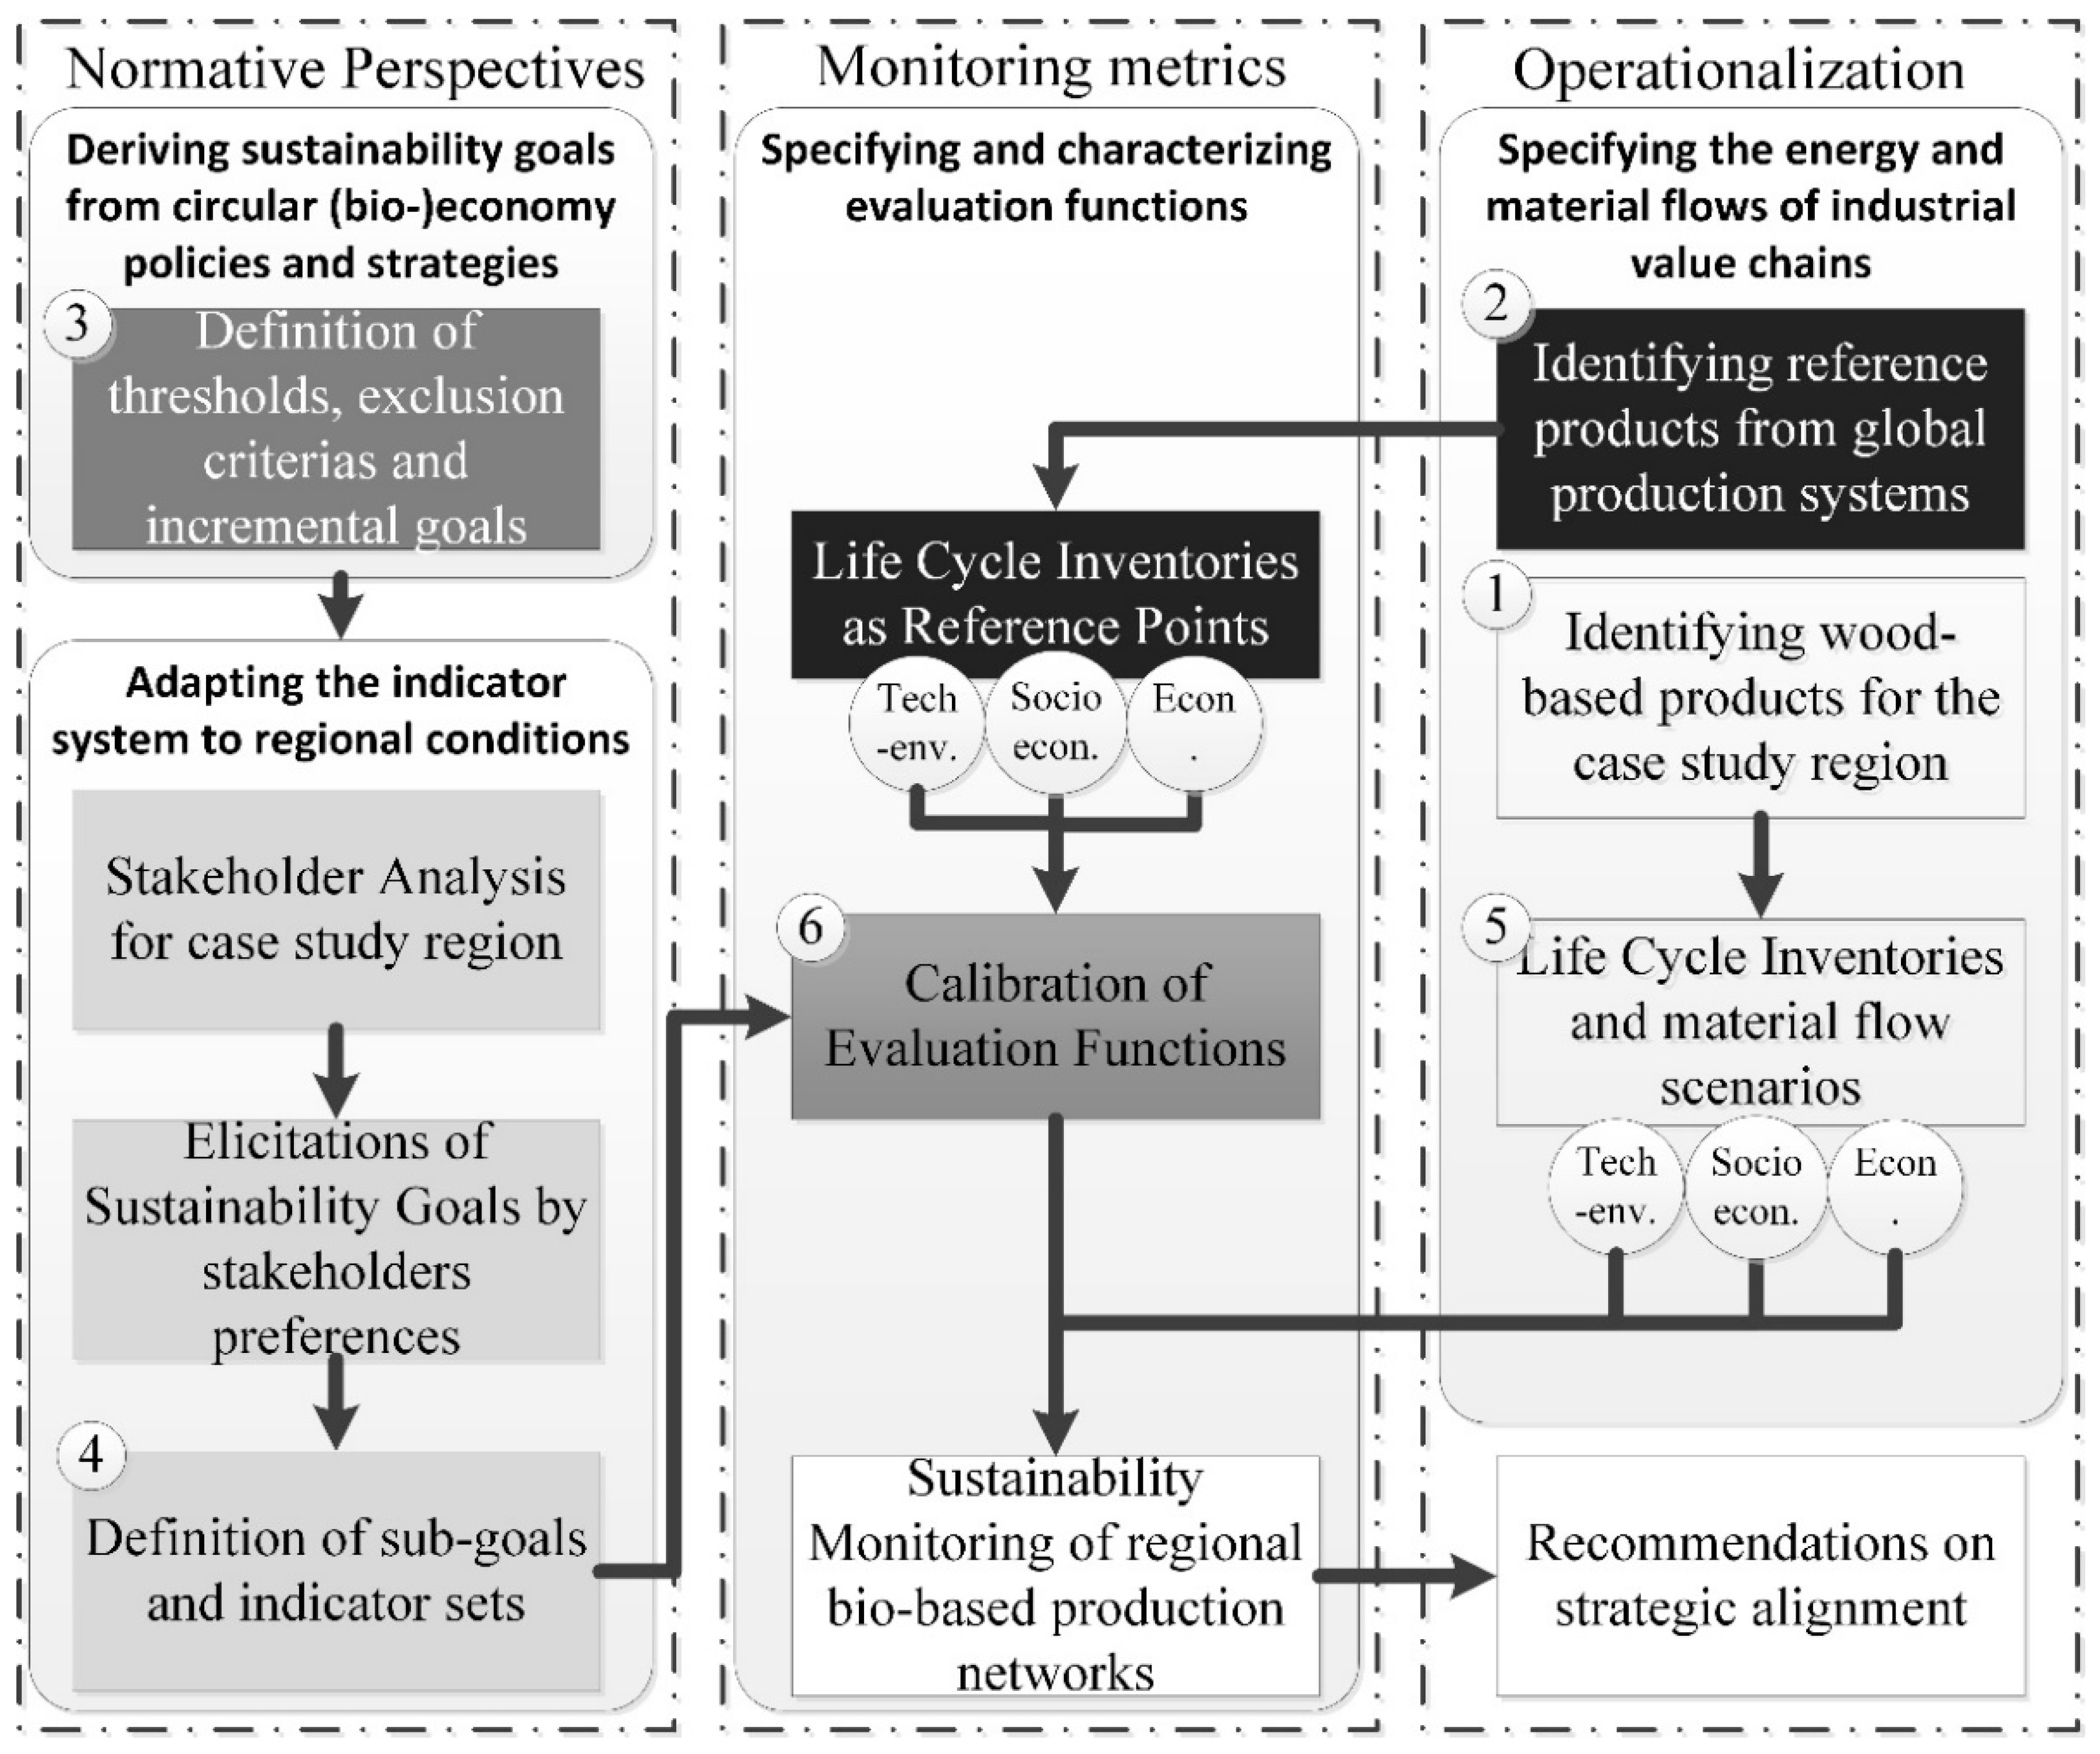
1.2. Conceptual Framework of the Sustainability Monitoring Tool
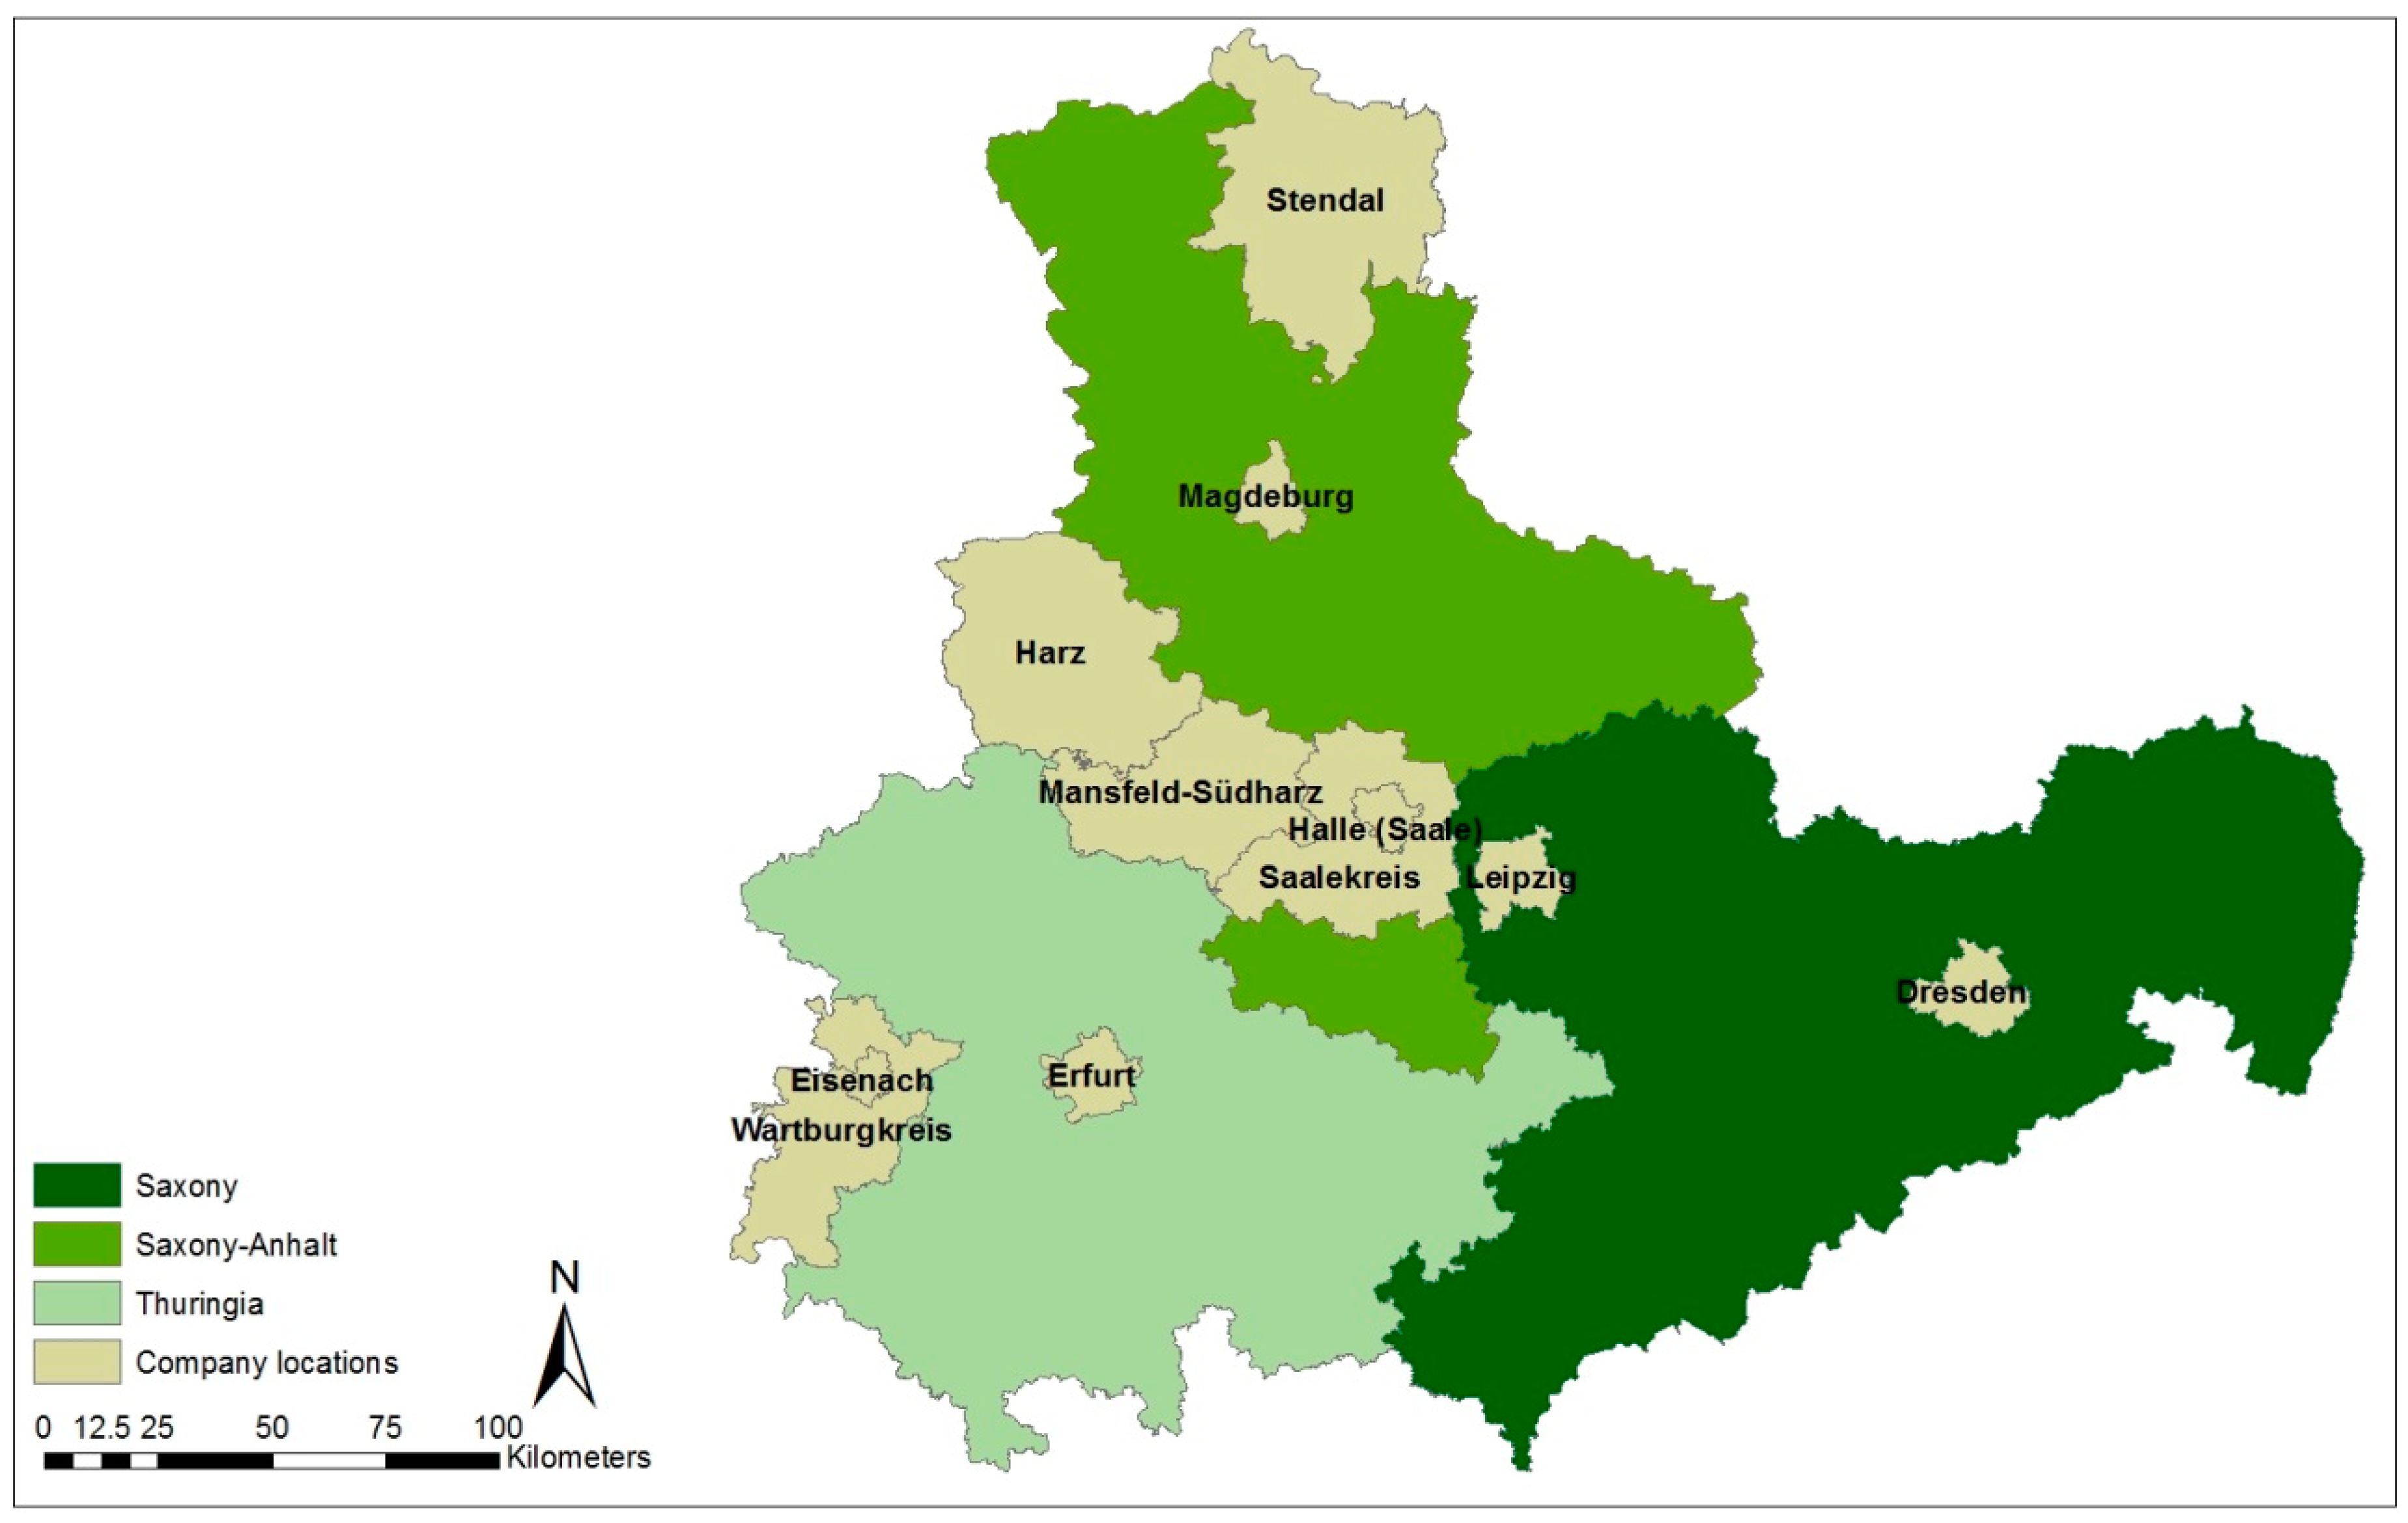
1.3. Background Information on the Case Study Region of Central Germany
2. Materials and Methods
2.1. Aim of This Work
- (1)
- From the operational perspective, the energy and material flow model has to specify technical, environmental, and energy-related parameters, and it has to quantify the existing and future energy and resource flows, product flows, and energy and conversion losses associated with the industrial metabolism of the bioeconomy region.
- (2)
- From the normative perspective, all relevant sustainability and efficiency goals that can be derived from societal and individual stakeholders and stakeholder groups need to be transformed into a quantifiable set of sustainability indicators.
- (3)
- From the perspective of monitoring metrics, the accuracy of the aggregation procedure has to be ensured by calibrating case-specific evaluation functions and specifying the defined indicators according to the life-cycle metrics aggregated from material flow analysis, environmental LCA, and sLCA.
- (i)
- Concerning the modeling of the material flow system of the bioeconomy region:How can the multi-output production system of the bioeconomy region be broken into a basket of bio-based products, and which future scenarios for a blueprint of energy and material flow integration can be applied to this multi-output production system in order to reflect future increased ambition levels in mitigating environmental impacts?
- (ii)
- Concerning the sets of sustainability indicators:Which sets of sustainability indicators for the sustainable management, conversion, and product manufacturing of wood resources in bioeconomy regions can be identified by reviewing the literature and consulting regional stakeholders?
- (iii)
- Concerning the aggregation of the evaluation metrics:How can these indicator sets and evaluation values be aggregated within an indicator-based Multi-Criteria Assessment tool, and how can these indicators be applied in the assessment of an energy and material flow model as a case study system that represents bio-based production networks within a bioeconomy region?
- A sustainability goal aims to define the direction for the performance evaluation of specific indicator values (maximum or minimum), e.g., maximizing resource use efficiency.
- A sub-goal refers to a particular part of resource efficiency, e.g., increasing the biomass conversion efficiency or water use efficiency. Indicator sets are then used to break down the sub-goals into quantifiable values, which can be compared with reference values to construct scoring values.
- The defined sub-indices break down the indicator sets even further in order to allow for calibrating scoring values and reference values for specific unit process modules, e.g., the biomass conversion efficiency of biorefinery processes or the material use efficiency of sawmill processes.
2.2. Methods and Procedures for Calibrating the Sustainability Monitoring Tool
- (1)
- Identifying a regional basket of wood-based products
- (2)
- Defining fossil-based and coniferous wood-based reference product systemsBy establishing the functional units in Task 1, the equality of benefits for benchmarking against fossil-based reference systems was also defined. By applying the sLCA framework RESPONSA, a procedure for identifying reference sectors was established [38].
- (3)
- Deriving sustainability goals and defining a sustainability goal systemThe assessment of sustainable regional development and of biomass utilization pathways is not a new field per se; therefore, the sustainability goals were defined by reviewing the literature (refer to Section 3.3) and exchanging novel findings with A. Siebert [29].
- (4)
- Adapting indicator sets for monitoring sustainability goals to suit regional conditions and stakeholder prioritiesThe goal and indicator system was adapted to meet specific stakeholder priorities derived from stakeholder interviews [37], amended with indices useful for wood-based value chains and revised in cooperation with the cluster management of the Leading-Edge Cluster BioEconomy (refer to Section 3.4).
- (5)
- Allocating life-cycle inventories and impacts associated with production volumes of individual value chainsThe allocation of impacts and the scenarios for fuel substitution inventories were evaluated in further studies and served as an input for the three scenarios also assessed in this manuscript [5].
- (6)
- Scoring and calibration of evaluation functionsFor each of the technical-environmental, socioeconomic, and economic indicators, a specific evaluation function or scoring technique was calibrated (please see Supplementary Materials and Section 3.5 and Section 3.6).
3. Results
3.1. Results of Task 1 and Task 2: Identification of A Wood-Based Product Basket Representing the Case Study System and A Reference Basket Representing Global Reference Products
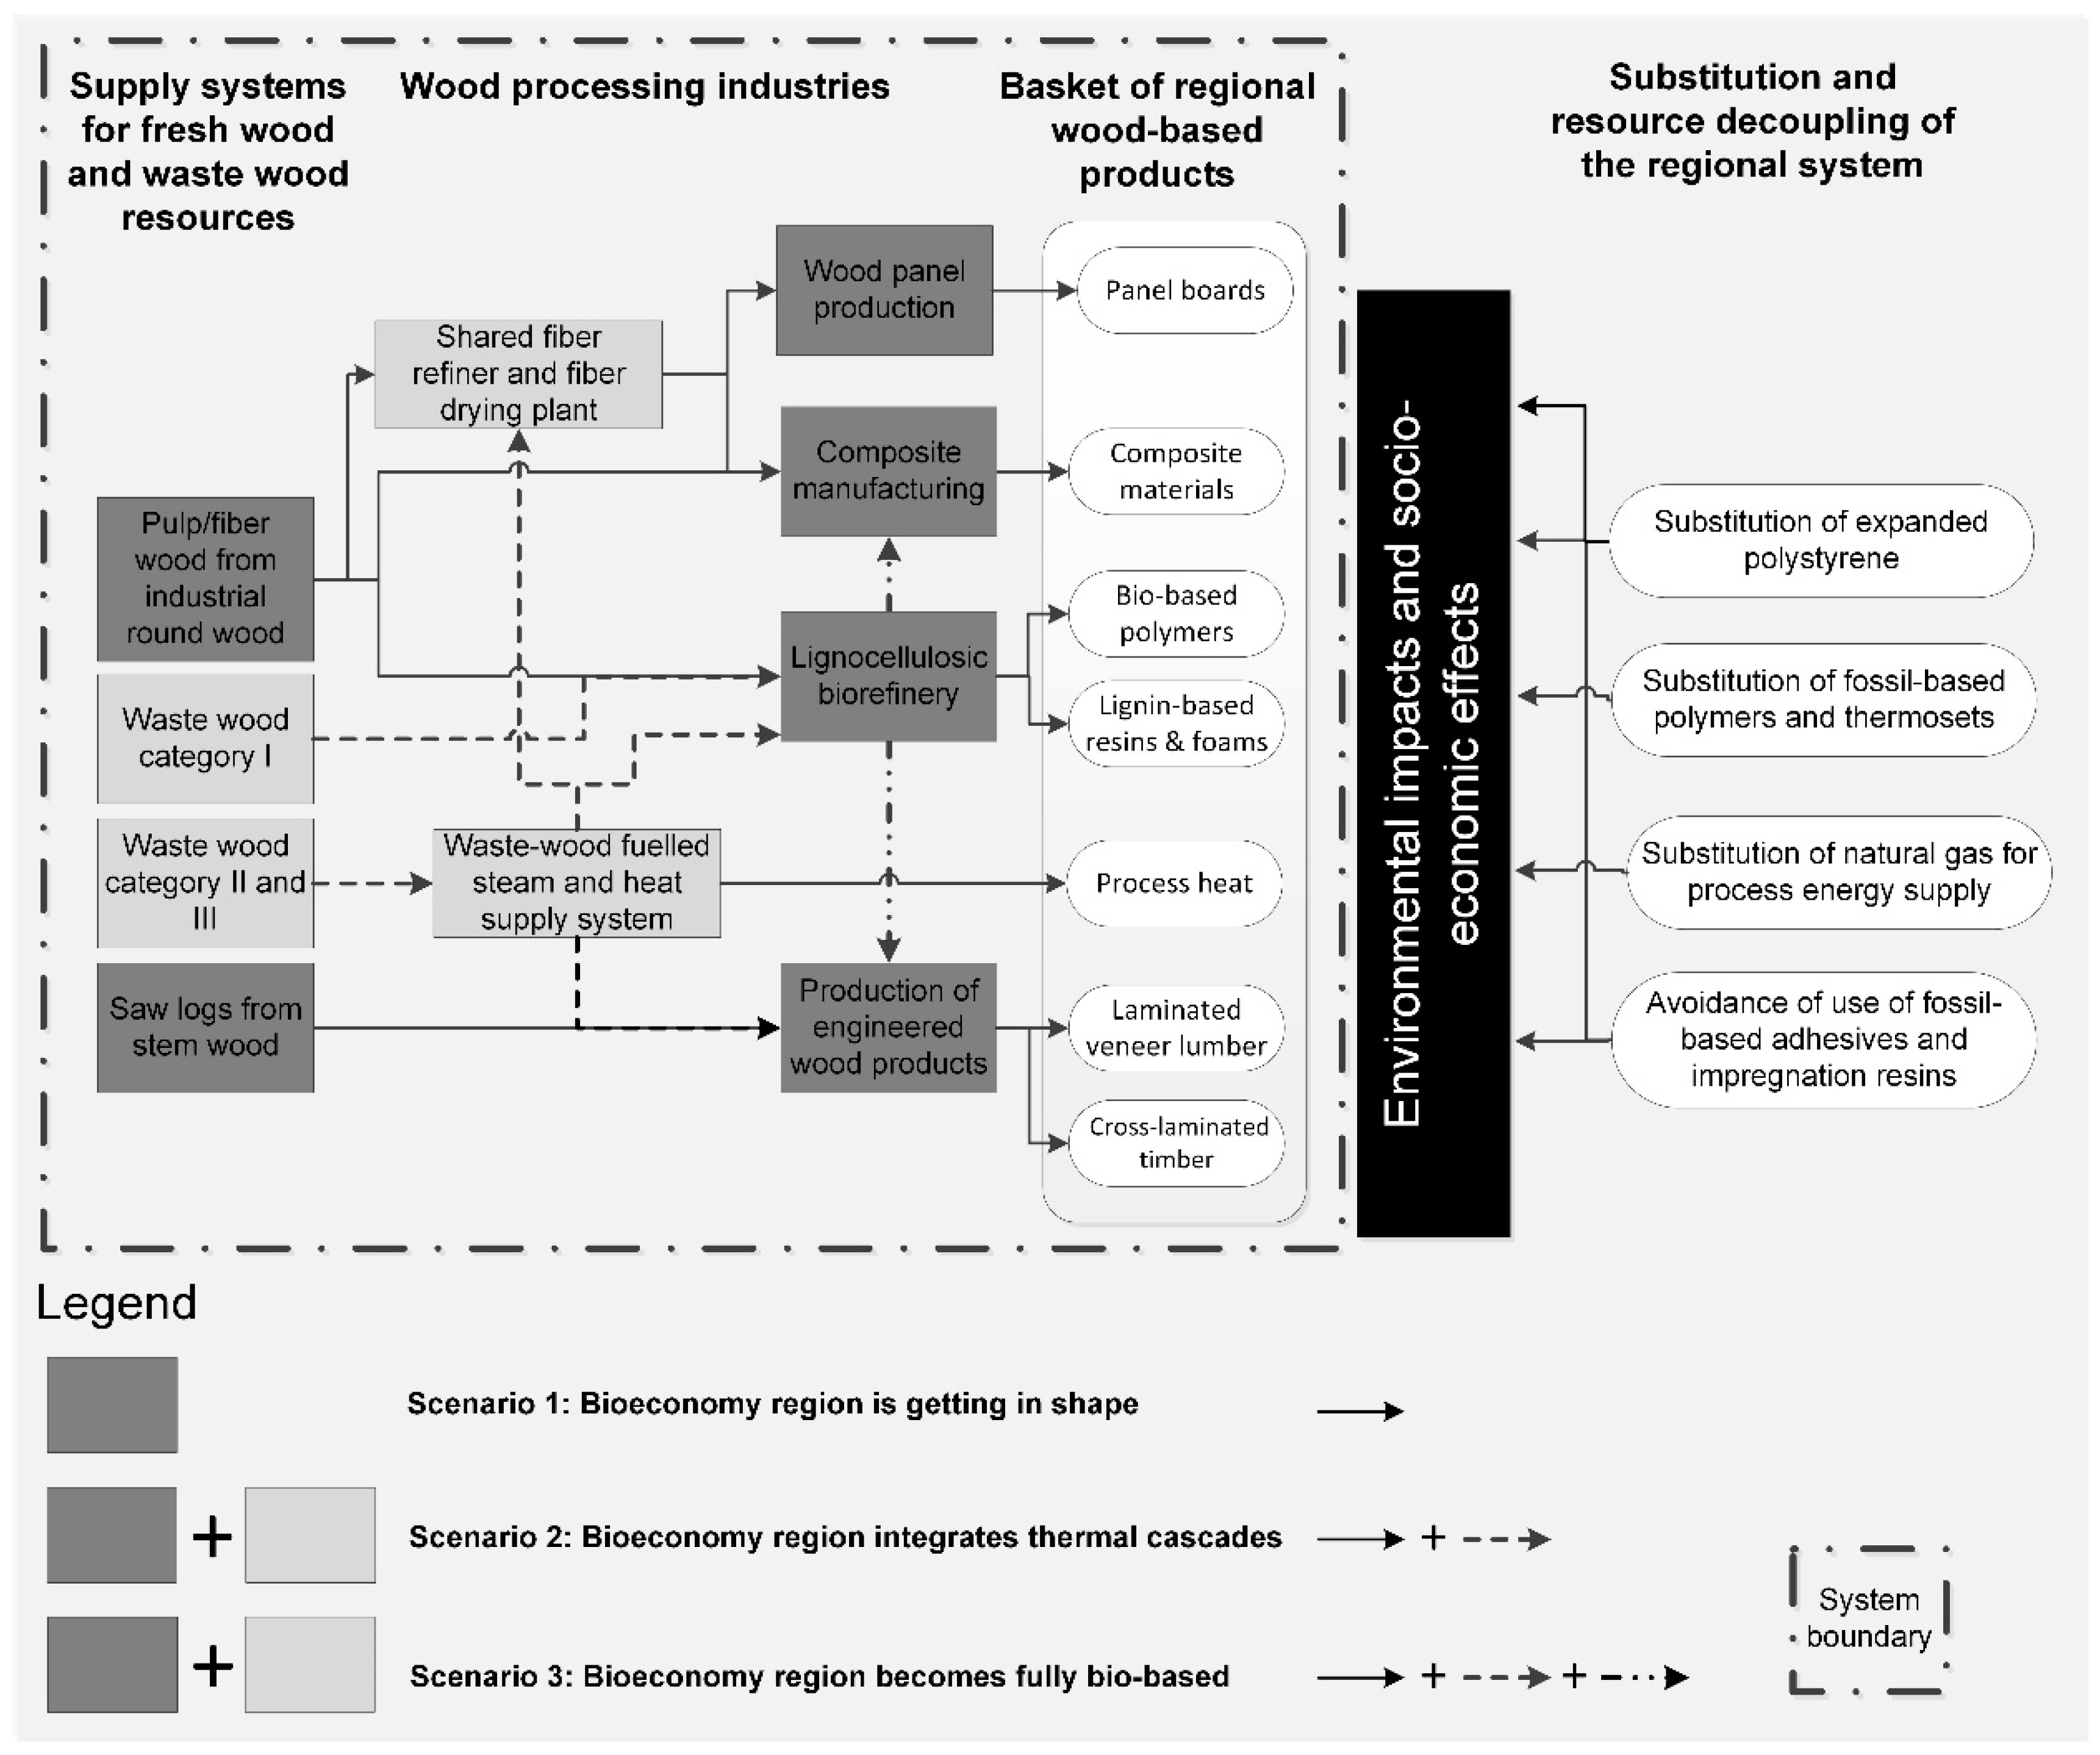
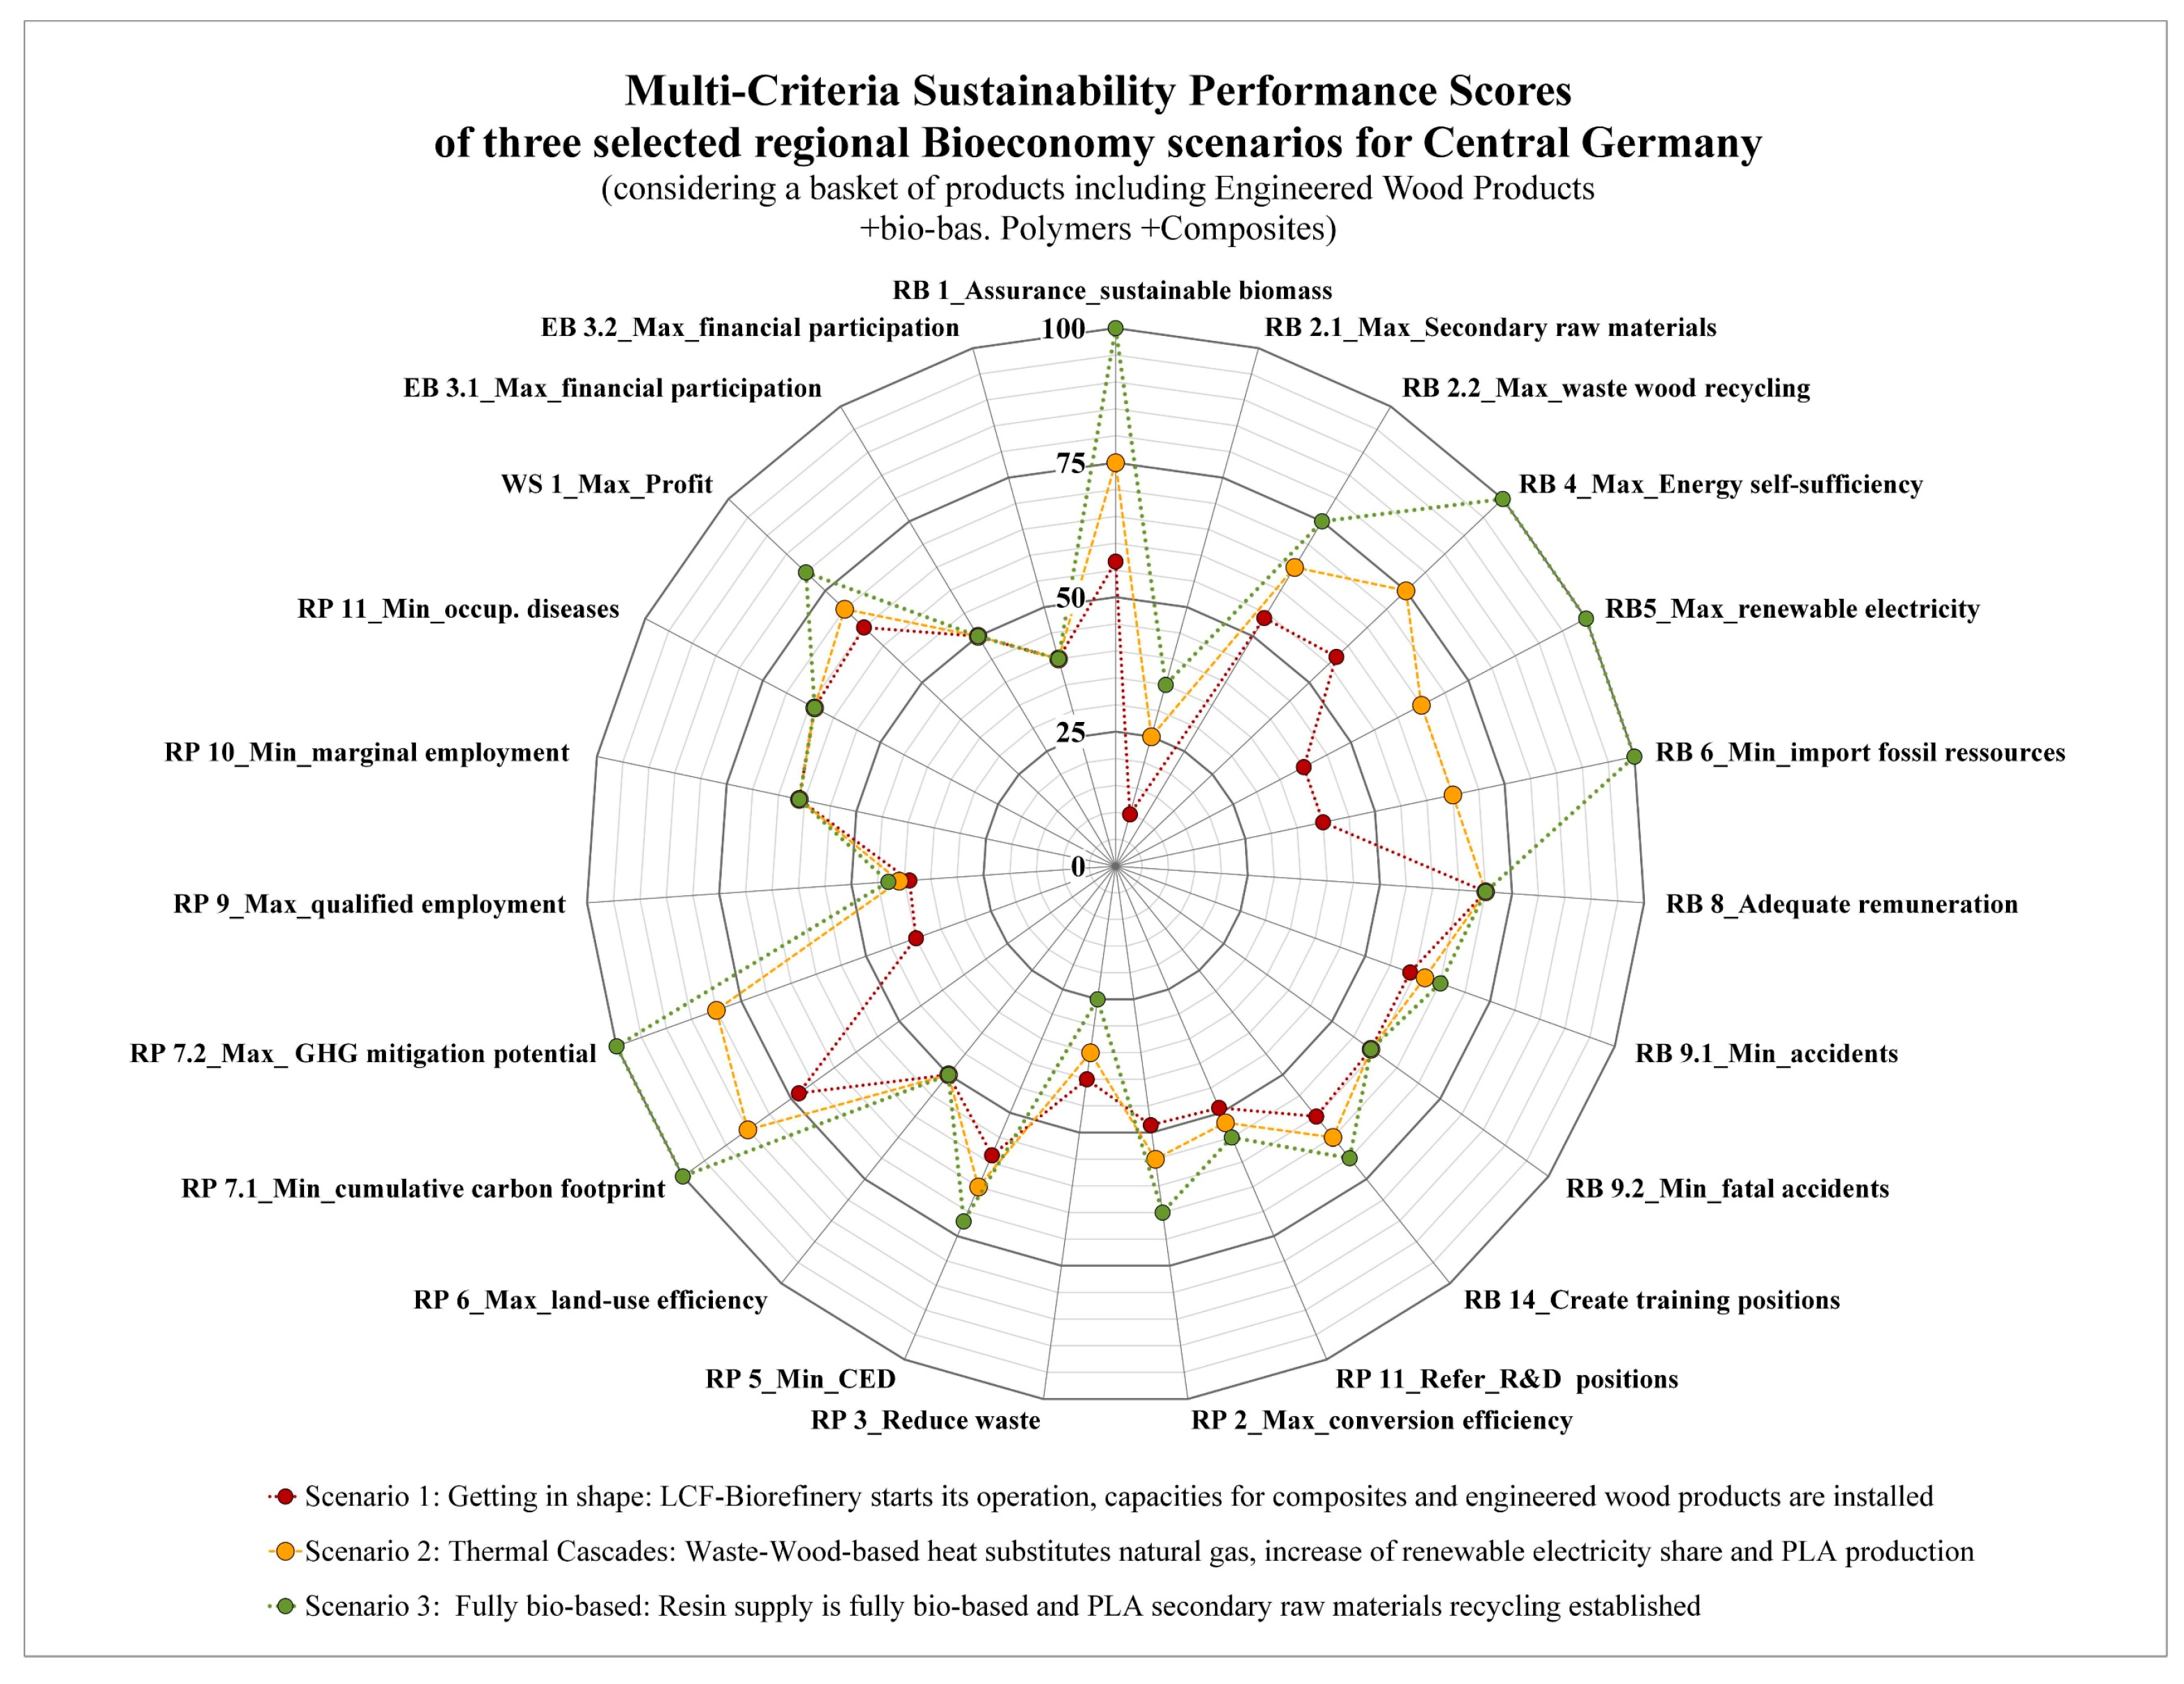
3.2. Results for Task 5: Scenarios for Integration of Material and Energy Flows within the Industrial Production Network
- Scenario 1 (baseline): The bioeconomy region is getting in shape.
- Scenario 2: The bioeconomy region integrates thermal cascades.
- Scenario 3: The bioeconomy region becomes fully bio-based.
3.3. Results of Task 3: Deriving A Sustainability Goals System from A Review of Assessment Frameworks Assessing Circular (Bio-) Economy Strategies and Policies
3.4. Results for Task 4: Definition of Goals and Indicators Adapted to Suit Sustainability Priorities of Stakeholders from Central Germany
- I.
- Identify sustainability goals for the regional wood-based bioeconomy system by breaking down sustainability goals compiled from interviews with local stakeholders and clustering them along the system compartments of the bioeconomy region;
- II.
- Describe and quantify the underlying sustainability assessment rules and sustainability indicators along the value-added chains;
- III.
- Define the evaluation functions and scoring techniques for calibrating the indicator values in the three future scenarios of value-added networks and the baskets of assessed products;
- IV.
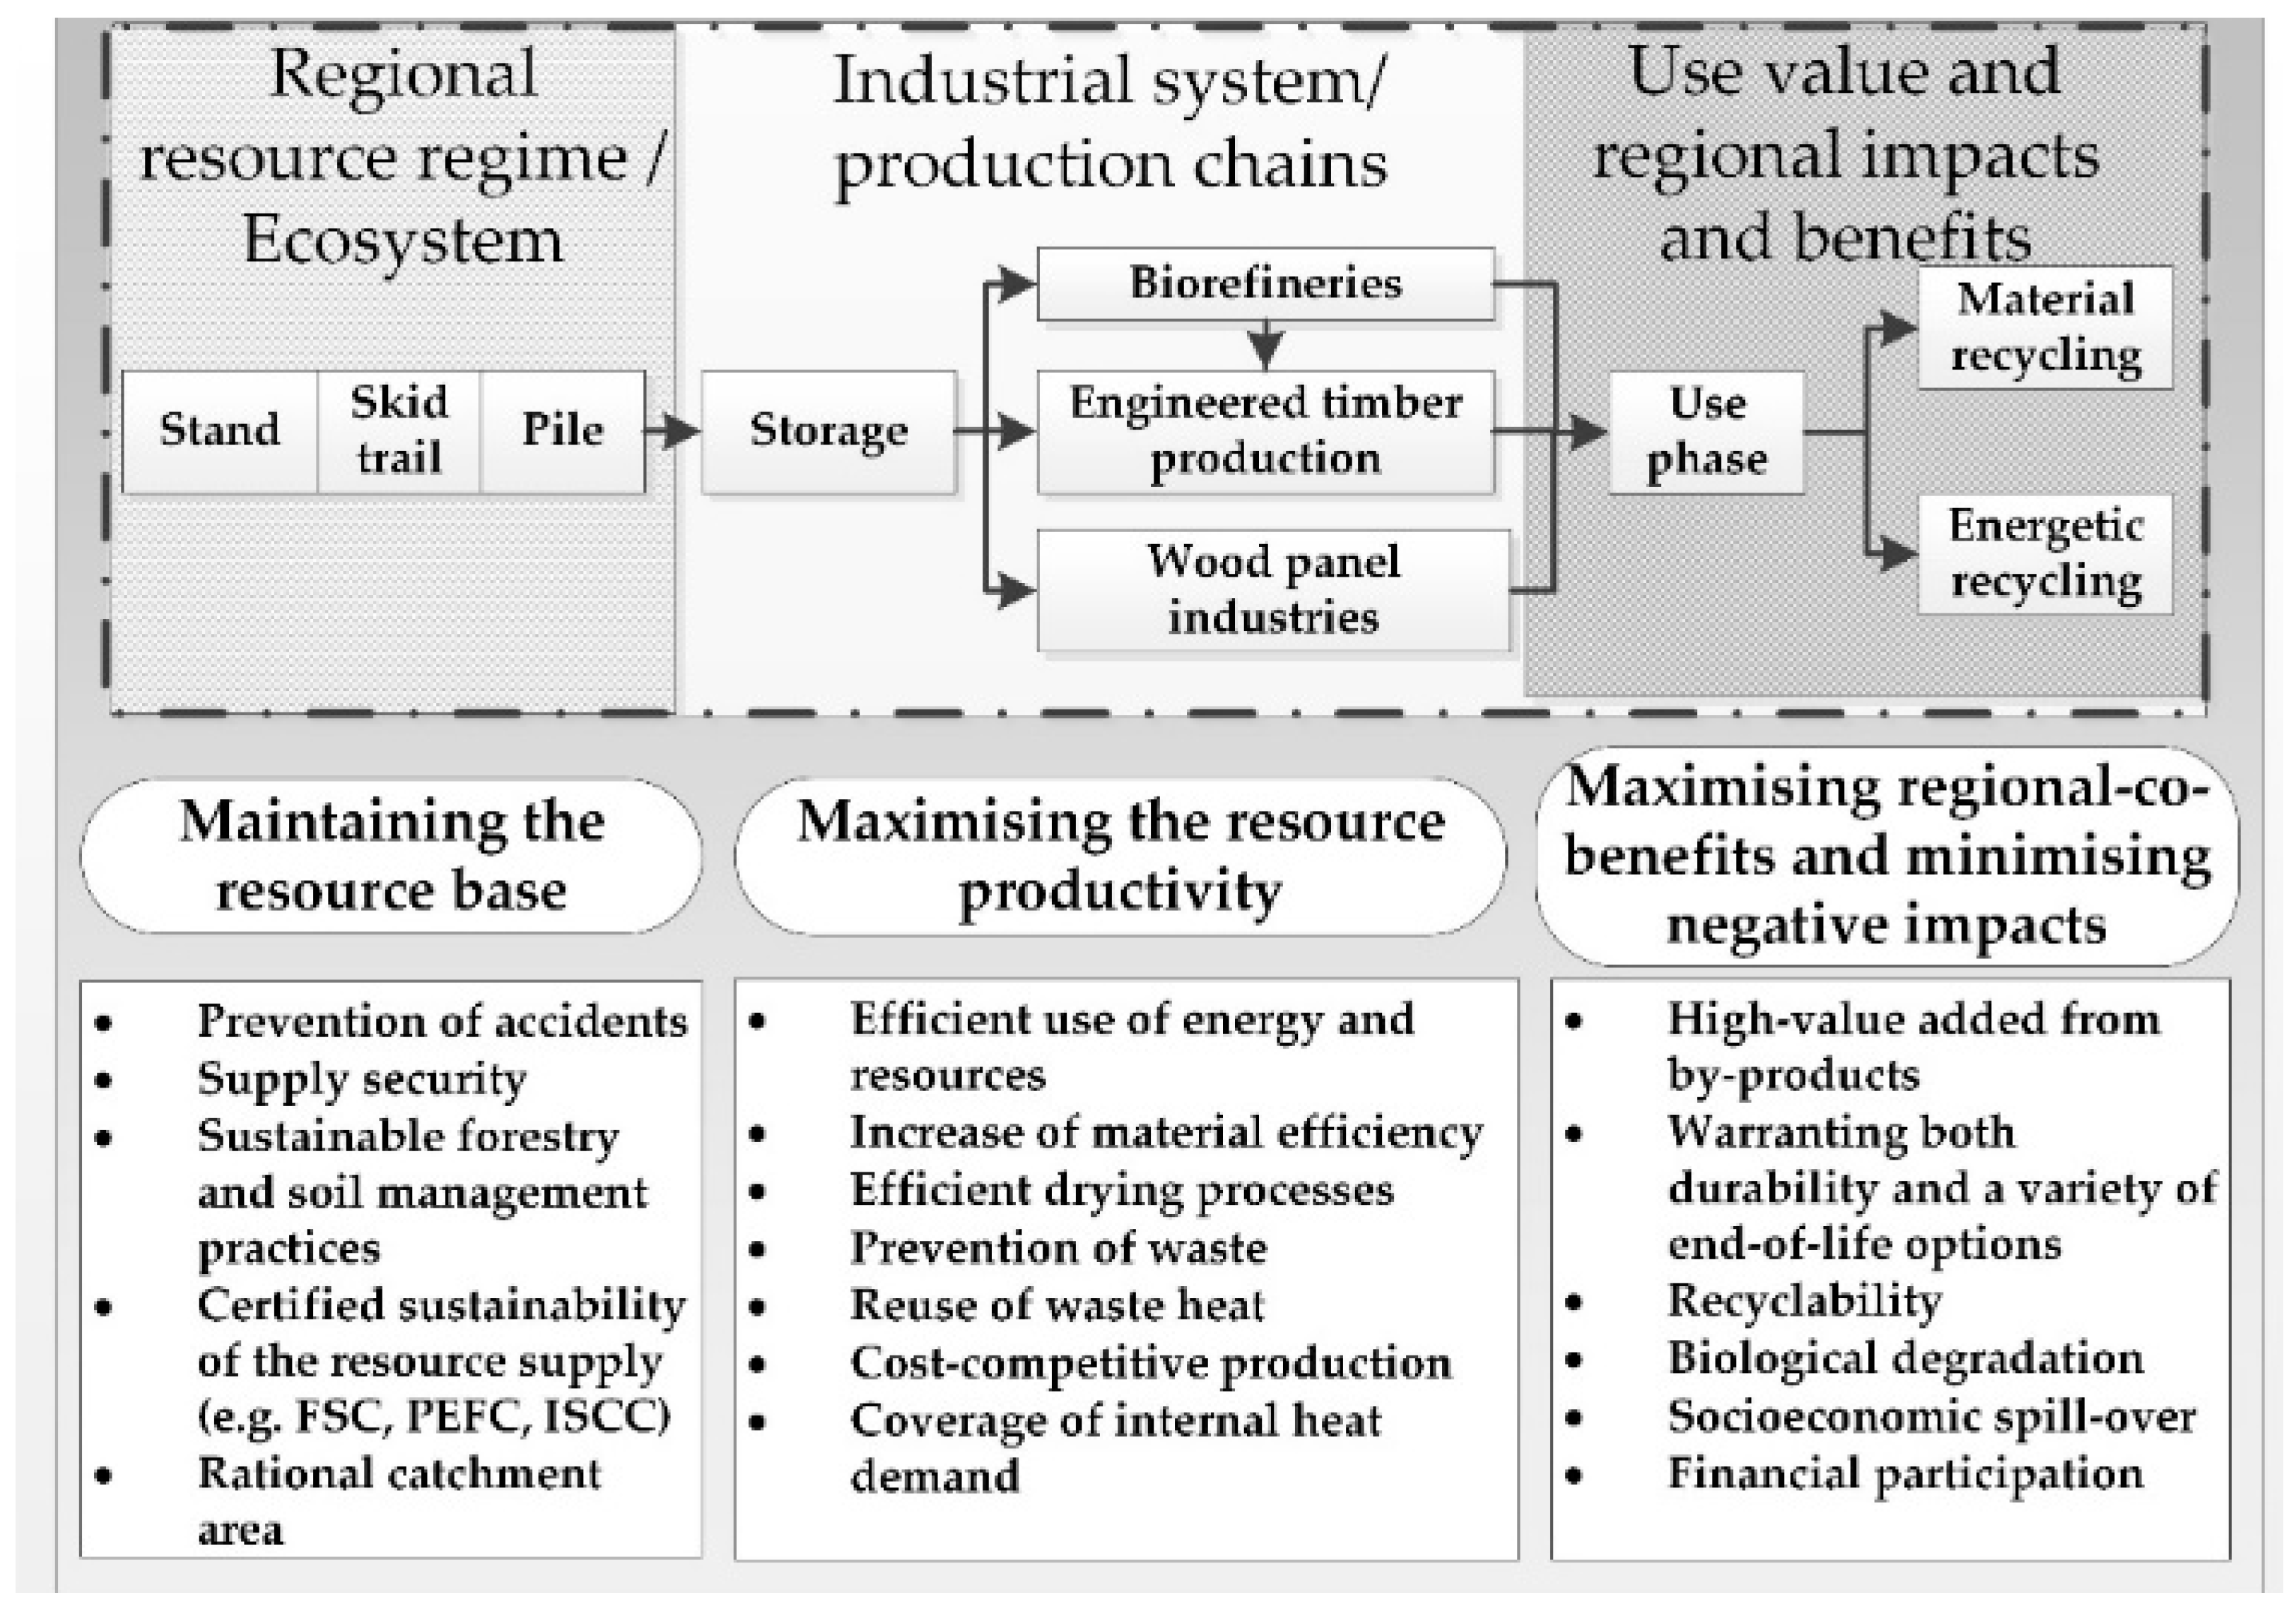
- (1)
- the maintenance of the resource base, which encompasses efficient resource mobilization and sustainable ecosystem management, as presented in Table 6;
- (2)
- the increase in resource productivity, which encompasses efficient process operation and optimized added-value creation, as presented in Table 5; and
- (3)
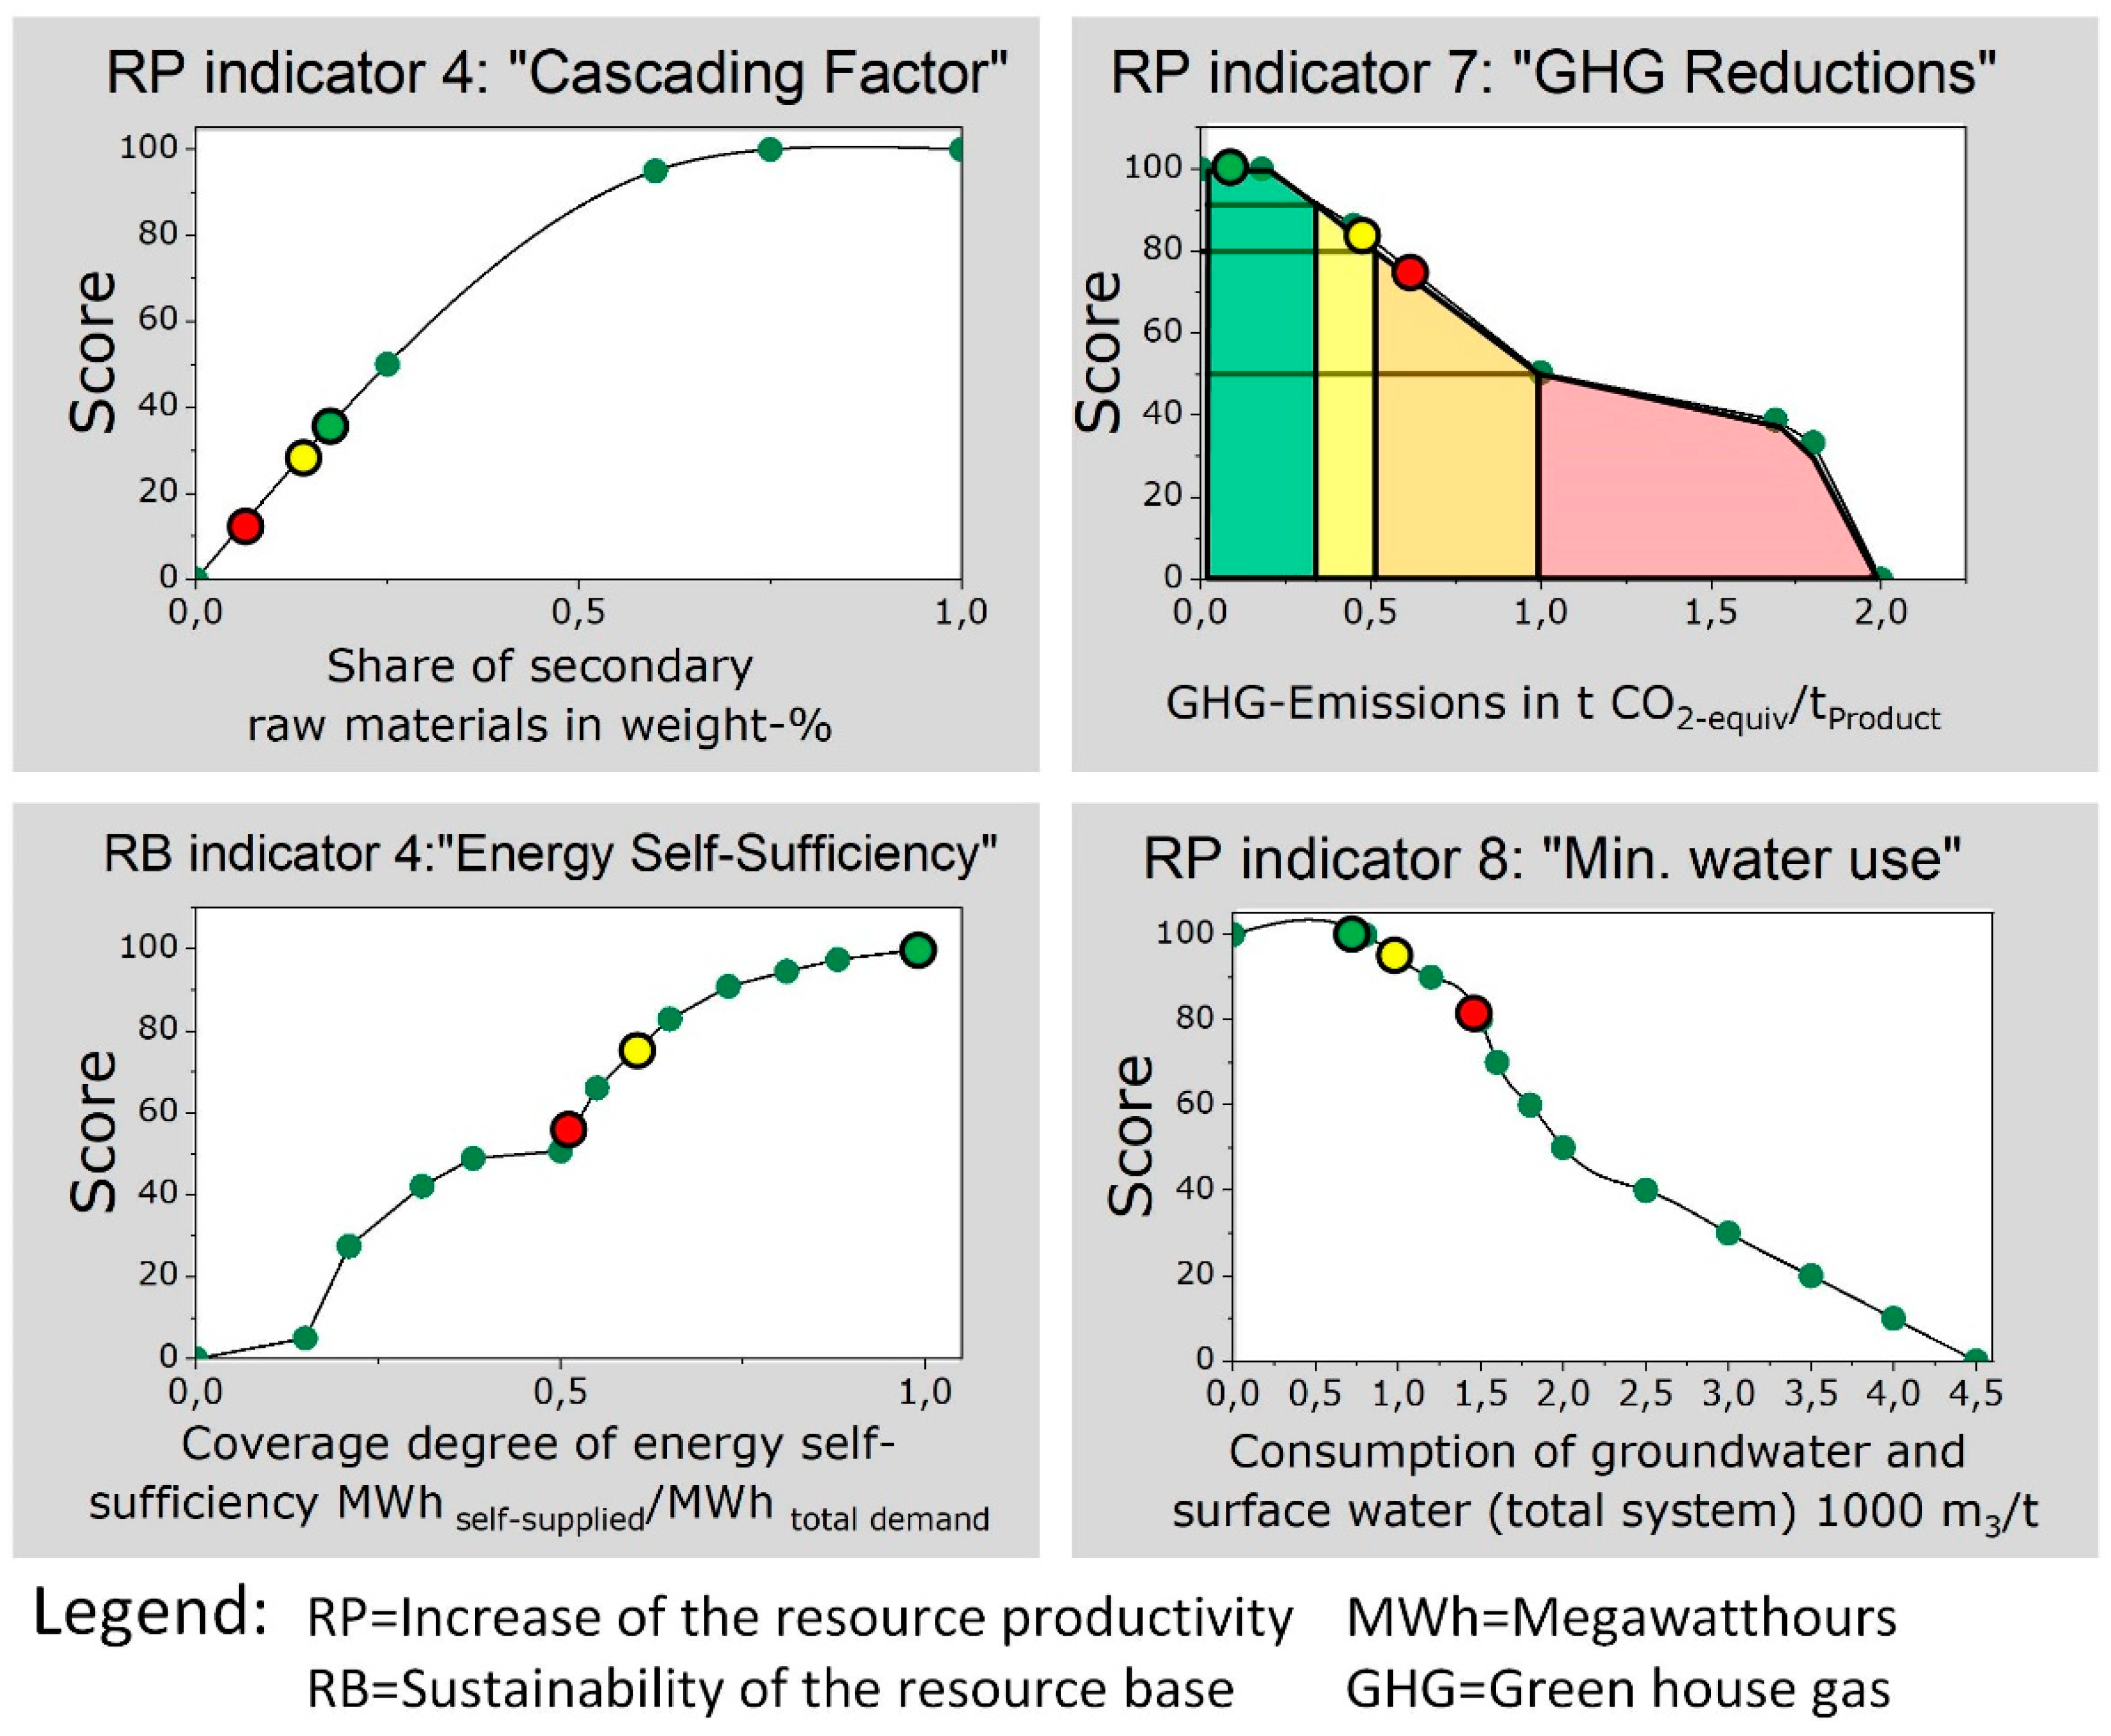
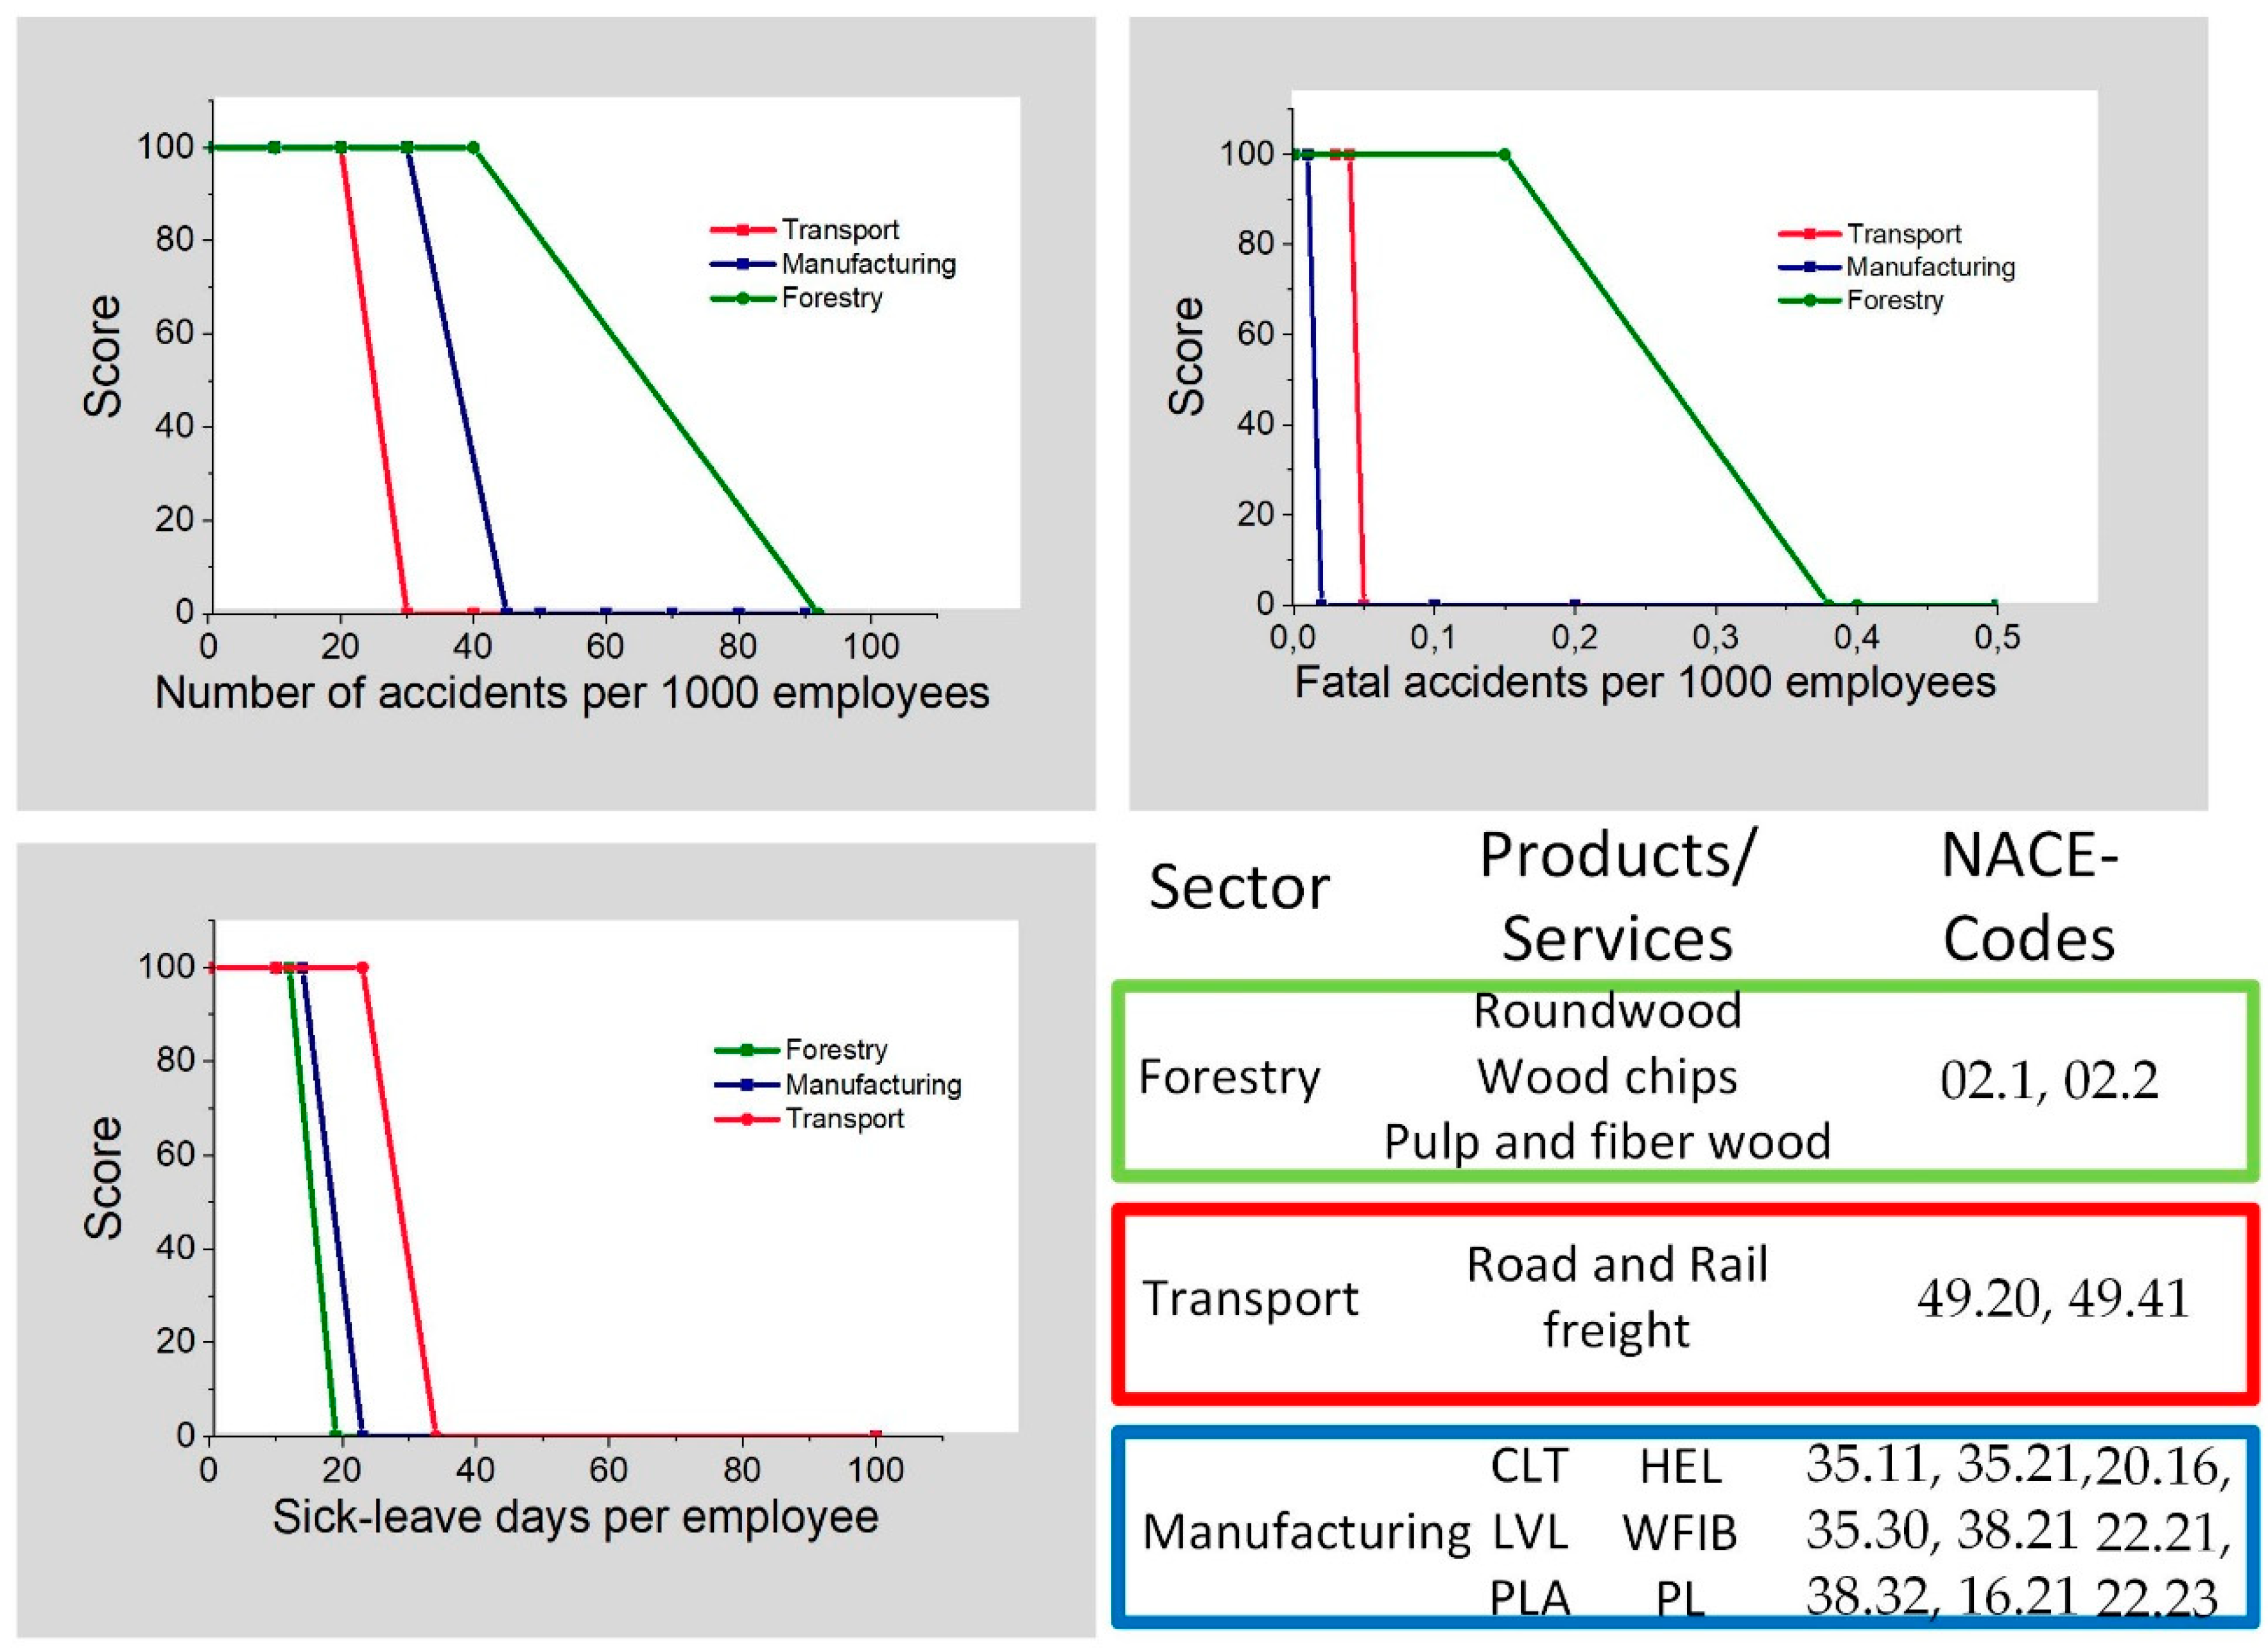
3.5. Results of Task 6: Calibration of Evaluation Functions
- The lower-boundary plateau of the industry standard is scored with at least 50+, the industry’s best practice is scored with 80+, and the next best practice development in the bioeconomy innovation system is scored for a performance plateau with above 80+.
- Every performance metric, e.g., resource use efficiency, renewable energy use, and energy self-supply, that falls below the industry standard is scored with <50 to 0.
- The ranges and steepness of the curves between the industries’ standards and industries’ best practices vary significantly and, therefore, require a higher fraction of reference values.
- For the product footprint (PF), e.g., water use and greenhouse gas (GHG) emission, the industry standard and industry’s best practice are defined by the weighted average of the product footprints for the representative product groups produced within the sector associated with the production network assessed with the monitoring tool.
3.6. Results of Task 5: Aggregating Social and Environmental Life-Cycle Inventories along the Indicator System
3.7. Results of the Full Aggregation Procedure of the Monitoring Tool SUMINISTRO
4. Discussion
5. Conclusions and Further Research Needed
- The marketing of engineered wood products is a safe start, with a robust market perspective and a strategically good outlook for the assessed region and beyond [80].
- The substitution of up to 20% of the total consumption of fossil-based resins, adhesives, and foams is technically possible and environmentally beneficial.
- The use of debarking residues and the installation of waste-wood-fired heat and power plants as thermal integration options for energy provision for wood-based value chains offer many opportunities for fully covering the energy demands of the regional bioeconomy network [5].
- Work safety will increase with higher mechanization in harvesting, increased automatization in production plants, and higher shares of employees in R&D and product design activities.
- The socioeconomic performance, in terms of remuneration and the specific numbers of R&D employees, is more preferable against the benchmarks of the chemical and biotechnology sector compared with those of traditional wood-based industry sectors.
- The expansion of capacities for the production of engineered wood products (EWPs) above 160,000 t/a implies increased market saturation risks when considering overall market developments [80], as well as increased transport burdens and super-regional resource competition conflicts.
- The resource supply is especially dependent on the supply of higher breast-height-diameter assortments and on sustainably sourced materials. For these assortments, the desired qualities may face shortages, particularly when drought events and calamities further limit the supply of saw logs by increasing the amount of damaged wood in the short term [82], and forest regrowth patterns limit the availability in the long term [81]. Thus, the major consequence of adapting to drought events in long-term forest restructuring will be a switch to the selection of more drought-tolerant individuals [83] or the remodification of the mixture of tree species [84] in silviculture management.
- Besides the EWPs, the use, decommissioning, and recycling phases for long-term durable bio-based polymer products and thermosets also have a lot of uncertainties with regard to the use of flame retardants, stabilizers, and future end-of-life treatment options such as feedstock recycling [27].
- The large-scale substitution of commodity chemicals only on the basis of non-food biomass resources from beechwood is not an option when comparing regional production capacities of fossil-based chemicals of above 560,000 t/a of olefins, e.g., [19]. The mobilization of further feedstocks (e.g., from short rotation coppices) and the clear prioritization of bio-based polymer preferences (e.g., polymers selected on the basis of biomass conversion efficiencies) will therefore become necessary in the mid-term [69].
- The overall job creation potential is not increasing, and absolute figures are even dropping in conventional woodworking companies [86]. In the mid-term, it can be expected that a stable plateau can be obtained by increasing the utilization of beechwood resources, but advancements of the overall situation are more unlikely.
Supplementary Materials
Author Contributions
Funding
Acknowledgments
Conflicts of Interest
References
- BMEL. 533 Waldstrategie 2020 Nachhaltige Waldbewirtschaftung—Eine Gesellschaftliche Chance und Herausforderung; BMEL: Berlin, Germany, 2011. [Google Scholar]
- BMEL Nationale Politikstrategie Bioökonomie. Nachwachsende Ressourcen und Biotechnologische Verfahren als Basis für Ernährung, Industrie und Energie; BMEL: Berlin, Germany, 2014. [Google Scholar]
- Lopez, E.; Schlomann, B.; Reuter, M.; Eichhammer, W. Energy Efficiency Trends and Policies in Germany—An Analysis Based on the ODYSSEE and MURE Databases; Fraunhofer Institute for Systems and Innovation Research ISI: Karlsruhe, Germany, 2018; Available online: https://www.odyssee-mure.eu/publications/national-reports/energy-efficiency-germany.pdf (accessed on 10 March 2020).
- Gärtner, S.; Hienz, G.; Keller, H.; Müller-Lindenlauf, M. Gesamtökologische Bewertung der Kaskadennutzung von Holz—Umweltauswirkungen Stofflicher und Energetischer Holznutzungssysteme im Vergleich; IFEU: Heidelberg, Germany, 2013. [Google Scholar]
- Hildebrandt, J.; O’Keeffe, S.; Bezama, A.; Thrän, D. Revealing the Environmental Advantages of Industrial Symbiosis in Wood-Based Bioeconomy Networks: An Assessment From a Life Cycle Perspective: Symbiosis in Bioeconomy Networks: Three LCA Scenarios. J. Ind. Ecol. 2018. [Google Scholar] [CrossRef]
- Balkau, F.; Bezama, A. Life cycle methodologies for building circular economy in cities and regions. Waste Manag. Res. 2019, 37, 765–766. [Google Scholar] [CrossRef] [PubMed] [Green Version]
- Bezama, A. Understanding the systems that characterise the circular economy and the bioeconomy. Waste Manag. Res. 2018, 36, 553–554. [Google Scholar] [CrossRef] [PubMed] [Green Version]
- Ingrao, C.; Bacenetti, J.; Bezama, A.; Blok, V.; Goglio, P.; Koukios, E.G.; Lindner, M.; Nemecek, T.; Siracusa, V.; Zabaniotou, A.; et al. The potential roles of bio-economy in the transition to equitable, sustainable, post fossil-carbon societies: Findings from this virtual special issue. J. Clean. Prod. 2018, 204, 471–488. [Google Scholar] [CrossRef]
- Wurpts, K. Mit Clustern zur BioÖkonomie Eine Internationale Bestandsaufnahme zur Einführung und Grundlage für Benchmarking und Evaluierung des Spitzencluster BioÖkonomie Mitteldeutschland; Leipzig Graduate School of Management: Leipzig, Germany, 2013. [Google Scholar]
- Auer, V.; Zscheile, M.; Engler, B.; Haller, P.; Hartig, J.; Wehsener, J.; Husmann, K.; Erler, J.; Thole, V.; Schulz, T.; et al. BIOECONOMY CLUSTER: Resource efficient creation of value from beech wood to bio-based building materials. In Proceedings of the Proceedings World Conference on Timber Engineering 2016, Vienna, Austria, 22–25 August 2016. [Google Scholar]
- Thrän, D.; Bezama, A. The knowledge-based bioeconomy and its impact in our working field. Waste Manag. Res. 2017, 35, 689–690. [Google Scholar] [CrossRef] [Green Version]
- Kennard, B. BIC Platform for Regions-Stimulating Bio-Based Investment by Connecting Regions & Industry; BIC: Brussels, Belgium, 2019; Available online: https://errin.eu/sites/default/files/2019-10/191022%20-%20Bioeconomy%20WG%20-%20Urban%20biowaste%20-%20BIC%20digital%20platform%20for%20regions.pdf (accessed on 10 March 2020).
- Spatial Foresight; SWECO; ÖIR; t33; Nordregio; Berman Group. Infyde Bioeconomy Development in EU Regions- Mapping of EU Member States’/Regions’ Research and Innovation Plans & Strategies for Smart Specialisation (RIS3) on Bioeconomy for 2014-2020; Publications Office of the EU: Brussels, Belgium, 2017. [Google Scholar]
- Charles, D.; Davies, S.; Miller, S.; Clement, K.; Overbeek, G.; Hoes, A.C.; Hasenheit, M.; Kiresiewa, Z.; Kah, S.; Bianchini, C. Case studies of regional bioeconomy strategies across Europe. In Report for the Project: Promoting Stakeholder Engagement and Public Awareness for a Participative Governance of the European Bioeconomy (BioSTEP); University of Strathclyde, European Policies Research Centre (EPRC): Glasgow, UK; Ecologic Institute: Berlin, Germany, 2016; Available online: http://www.bio-step.eu/fileadmin/BioSTEP/Bio_documents/BioSTEP_D3.2_Case_studies_of_regional_strategies.pdf (accessed on 10 March 2020).
- Committee of the Regions. Opinion of the Committee of the Regions on ‘Innovating for sustainable growth: A bioeconomy for Europe’ 2013/C 17/09. Off. J. Eur. Union 2013. [Google Scholar]
- Cooke, P. Growth Cultures: The Global Bioeconomy and Its Bioregions; Routledge: Abingdon, UK, 2013; ISBN 0-415-86019-9. [Google Scholar]
- CIRCE Foundation POWER4BIO. emPOWERing Regional Stakeholders for Realising the Full Potential of European BIOeconomy—Project Brochure; CIRCE Foundation POWER4BIO: CIRCE Foundation—Research Centre for Energy Resources and Consumption: Zaragoza, Spain, 2019; Available online: https://power4bio.eu/wp-content/uploads/2019/09/20190913_P4B-Brosch%C3%BCre_148x148_web.pdf (accessed on 10 March 2020).
- BIO Deutschland e. V. The Council of Bioregions in Germany (AK-BioRegio for short) as the Central Network of Regional Biotechnology Initiatives in Germany; Council of German Bioregions: Berlin, Germany, 2019; Available online: https://www.biodeutschland.org/de/ak-bioregio.html (accessed on 10 March 2020).
- ECRN. “Chemical Parks as Regional Growth Engines for European Chemical Regions” Saxony-Anhalt (Central Germany), North-Rhine Westphalia (GER), Lower Saxony (GER), Masovia (POL), Limburg (NET), Huelva (ESP), Rhineland Palatinate (GER), Piemonte (ITA); European Chemical Regions Network: Magdeburg, Germany, 2005; Available online: https://www.idepa.es/documents/20147/225058/Estudio_3._Gestixn_Parques_Quxmicos._Versixn_europea_inglxs.pdf/44f2207b-b55a-7175-45fc-2b6679ed0d54 (accessed on 10 March 2020).
- Leeuwen, M.; Meijl, H.; Smeets, E. Toolkit for a Systems Analysis Framework of the EU Bioeconomy: Overview of WP2 in the EU FP 7 SAT-BBE Project: Systems Analysis Tools Framework for the EU Bio-Based Economy Strategy; LEI Wageningen UR: Den Haag, The Netherlands, 2014; Available online: https://edepot.wur.nl/318439 (accessed on 10 March 2020).
- Angenendt, E.; Poganietz, W.-R.; Bos, U.; Wagner, S.; Schippl, J. Modelling and Tools Supporting the Transition to a Bioeconomy. In Bioeconomy; Lewandowski, I., Ed.; Springer International Publishing: Cham, Switzerland, 2018; pp. 289–316. ISBN 978-3-319-68151-1. [Google Scholar]
- Zörb, C.; Lewandowski, I.; Kindervater, R.; Göttert, U.; Patzelt, D. Biobased Resources and Value Chains. In Bioeconomy; Lewandowski, I., Ed.; Springer International Publishing: Cham, Switzerland, 2018; pp. 75–95. ISBN 978-3-319-68151-1. [Google Scholar]
- Massari, S.; Sonnemann, G.; Balkau, F. (Eds.) Life Cycle Approaches to Sustainable Regional Development; Routledge: Abingdon, UK, 2016; ISBN 978-1-138-94060-4. [Google Scholar]
- Lindner, M.; Suominen, T.; Palosuo, T.; Garcia-Gonzalo, J.; Verweij, P.; Zudin, S.; Päivinen, R. ToSIA—A tool for sustainability impact assessment of forest-wood-chains. Ecol. Model. 2010, 221, 2197–2205. [Google Scholar] [CrossRef]
- Imperial College London; JAMK &Region of Central Finland; CERTH & Region of Western Macedonia; University of Ljubljana; BioCampus StraubingGmbH& FNR; Madrid Biocluster & Parque Científico de Madrid; Wageningen University, Gemeente Westland & Biobased Delta. A Representative Set of Case Studies; Imperial College London: London, UK, 2015; p. 155. [Google Scholar]
- Teräs, J.; Johnsen, I.H.; Lindberg, G.; Perjo, L.; Giacometti, A. Bioeconomy in the Nordic region: Regional Case Studies; Volume Working Paper 2014:4; Nordregio: Stockholm, Sweden, 2014; ISBN 78-91-87295-21-8. [Google Scholar]
- Hildebrandt, J.; Bezama, A.; Thrän, D. Cascade use indicators for selected biopolymers: Are we aiming for the right solutions in the design for recycling of bio-based polymers? Waste Manag. Res. 2017, 35, 367–378. [Google Scholar] [CrossRef]
- Olsson, O.; Roos, A.; Guisson, R.; Bruce, L.; Lamers, P.; Hektor, B.; Thrän, D.; Hartley, D.; Jens, P.; Hildebrandt, J. Time to tear down the pyramids? A critique of cascading hierarchies as a policy tool. WENE 2018. [Google Scholar] [CrossRef]
- Siebert, A.; Bezama, A.; O’Keeffe, S.; Thrän, D. Social life cycle assessment: In pursuit of a framework for assessing wood-based products from bioeconomy regions in Germany. Int. J. Life Cycle Assess. 2016. [Google Scholar] [CrossRef] [Green Version]
- Pfau, S.; Hagens, J.; Dankbaar, B.; Smits, A. Visions of Sustainability in Bioeconomy Research. Sustainability 2014, 6, 1222–1249. [Google Scholar] [CrossRef] [Green Version]
- Hildebrandt, J.; Budzinski, M.; Bezama, A.; O‘Keeffe, S.; Thrän, D. SUMINISTRO -Sustainability Monitoring Index for assessing regional bio-based Industry Networks; Helmholtz-Centre for Environmental Research: Leipzig, Germany, 2018. [Google Scholar]
- Hildebrandt, J. Results 2 -MCDA Assessment Tools for Sustainability Monitoring of Bioeconomy Networks, Presentation of Results on the Final Workshop for the Leading-Edge Cluster Bioeconomy, Hosted by the Helmholtz-Centre for Environmental Research-UFZ, Leipzig, Germany, 2017. Available online: https://www.ufz.de/export/data/2/234057_Jakob%20Hildebrandt_Abschlu%C3%9Fworkshop_Bio%C3%B6konomie_17.03.17.pdf (accessed on 10 March 2020).
- Federal Ministry of Education and Research (BMBF). Creating value from non-food-biomass. In Germany’s Leading-Edge Clusters; Federal Ministry of Education and Research (BMBF): Berlin, Germany, 2015. [Google Scholar]
- Hildebrandt, J.; Budzinski, M.; Nitzsche, R.; Weber, A.; Krombholz, A.; Thrän, D.; Bezama, A. Assessing the technical and environmental performance of wood-based fiber laminates with lignin based phenolic resin systems. Resour. Conserv. Recycl. 2019, 141, 455–464. [Google Scholar] [CrossRef]
- Nitzsche, R.; Budzinski, M.; Gröngröft, A. Techno-economic assessment of a wood-based biorefinery concept for the production of polymer-grade ethylene, organosolv lignin and fuel. Bioresour. Technol. 2016, 200, 928–939. [Google Scholar] [CrossRef]
- Budzinski, M.; Nitzsche, R. Comparative economic and environmental assessment of four beech wood based biorefinery concepts. Bioresour. Technol. 2016, 216, 613–621. [Google Scholar] [CrossRef] [PubMed]
- Siebert, A.; Bezama, A.; O’Keeffe, S.; Thrän, D. Social life cycle assessment indices and indicators to monitor the social implications of wood-based products. J. Clean. Prod. 2017. [Google Scholar] [CrossRef]
- Siebert, A.; O’Keeffe, S.; Bezama, A.; Zeug, W.; Thrän, D. How not to compare apples and oranges: Generate context-specific performance reference points for a social life cycle assessment model. J. Clean. Prod. 2018, 198, 587–600. [Google Scholar] [CrossRef]
- Michels, J.; Ehrich, K.; Schrader, J.; Puls, J.; Saake, B.; Kordsachia, O.; Schweinle, J.; Unkelbach, G.; Schweppe, R.; Schäfer, C.; et al. Pilotprojekt “Lignocellulose-Bioraffinerie” Gemeinsamer Schlussbericht zu den wissenschaftlich-technischen Ergebnissen aller Teilvorhaben; Dechema e.V.; vTI; KIT; Fraunhoher ICT; TU München; TU Kaiserslautern; BIOPOS e.V.: Frankfurt, Germany, 2009. [Google Scholar]
- SmartPilots Interreg Europe SmartPilots position paper for H2020 evaluation. Project News. 2017. Available online: https://www.interregeurope.eu/smartpilots/news/news-article/518/smartpilots-position-paper-for-h2020-evaluation/ (accessed on 10 March 2020).
- Clusterplattform Germany Federal Ministry for Economic Affairs and Energy BioEconomy Cluster Wood Meets Chemistry – The Future of the Biobased Economy Starts in Central Germany. Available online: http://www.clusterplattform.de/CLUSTER/Redaktion/EN/Cluster/go-cluster/bioeconomy_cluster.html (accessed on 22 November 2019).
- Mosler, H. Cluster Management BioEconomy Cluster Where Wood meetsChemistry - Leading Edge Cluster BioEconomy–Network for a Bio-Based Economy in Central Germany; BioEconomy Cluster: Halle-Saale, Germany, 2016. [Google Scholar]
- Hildebrandt, J. Monitoring the Sustainability of Added-Value Networks within Bioeconomy Regions. Ph.D. Thesis, Faculty of Economics and Management Science, University of Leipzig, Leipzig, Germany, 2018. [Google Scholar]
- BioEconomy Cluster Programm Statuskolloquium_Spitzencuster_BioEconomy; BioEconomy Cluster: Halle-Saale, Germany, 2015.
- Ligthart, F.A.T.M. Eco-industrial Parks in Germany: Dortmund Technology Centre, Value Park, Schkopau, Avantis, Aachen. ECN-C--04-066; ECN Energy in the Built Environment. 2004. Available online: https://publications.ecn.nl/E/2004/ECN-C--04-066 (accessed on 10 March 2020).
- Petrochemicals Europe Crackers Capacities. Available online: http://www.petrochemistry.eu/about-petrochemistry/facts-and-figures/crackers-capacities.html?cgv0c=264 (accessed on 10 August 2016).
- Cluster Mitteldeutschland. Cluster Atlas: The Future Cluster Chemistry/Plastics Central Germany; isw Gesellschaft für wissenschaftliche Beratung und Dienstleistung mbH: Halle, Germany, 2013. [Google Scholar]
- Bundesinstitut für Bau-, Stadt- und Raumforschung (BBSR). INKAR online, Indicators and Maps on Spatial and Urban Development, Bonn, Germany, 2017. Available online: http://www.bbsr.bund.de and https://www.inkar.de/WizardStart (accessed on 10 March 2020).
- Hildebrandt, J.; Bezama, A.; Thrän, D. Establishing a robust sustainability index for the assessment of bioeconomy regions. Green Energy for Sustainable Development (ICUE). In Proceedings of the 2014 International Conference and Utility Exhibition, Pattaya, Thailand, 19–21 March 2014. [Google Scholar]
- Cinelli, M.; Coles, S.R.; Kirwan, K. Analysis of the potentials of multi criteria decision analysis methods to conduct sustainability assessment. Ecol. Indic. 2014, 46, 138–148. [Google Scholar] [CrossRef] [Green Version]
- Munda, G. Social Multi-Criteria Evaluation for a Sustainable Economy; Springer: New York, NY, USA, 2008; ISBN 978-3-540-73703-2. [Google Scholar]
- Coordination team BERST. LEI Wageningen BioEconomy Regional Strategy Toolkit For Benchmarking and Developing Strategies. Available online: http://www.berst.eu/News.aspx?id=news (accessed on 8 August 2016).
- Lindner, M.; Werhahn-Mees, W.; Suominen, T.; Vötter, D.; Zudin, S.; Pekkanen, M.; Päivinen, R.; Roubalova, M.; Kneblik, P.; Brüchert, F.; et al. Conducting sustainability impact assessments of forestry-wood chains: Examples of ToSIA applications. Eur. J. For. Res. 2012, 131, 21–34. [Google Scholar] [CrossRef]
- Fritsche, U.R.; Iriarte, L. Sustainability Criteria and Indicators for the Bio-Based Economy in Europe: State of Discussion and Way Forward. Energies 2014, 7, 6825–6836. [Google Scholar] [CrossRef] [Green Version]
- Nita, V.; Benini, L.; Ciupagea, C.; Kavalov, B.; Pelletier, N. Bio-Economy and Sustainability: A Potential Contribution to the Bio-Economy Observatory; European Commission Joint Research Centre Institute for Environment and Sustainability: Luxembourg, 2013. [Google Scholar]
- Hildebrandt, J.; Siebert, A.; Thrän, D.; Bezama, A. Monitoring Material Flows of a Bioeconomy Region. In Proceedings of the 25th European Biomass Conference and Exhibition 2017, Stockholm, Sweden, 12–15 June 2017; p. 9. [Google Scholar] [CrossRef]
- Hildebrandt, J. Assessment tools for Sustainability Monitoring of added-value networks in the bioeconomy. In Proceedings of the Global Bioeconomy Summit, Berlin, Germany, 24–26 November 2015. [Google Scholar]
- Krombholz, A.; Theumer, T.; Hildebrandt, J.; Budzinski, M.; Weber, A. LCA and Mechanics of Beech Fiber laminates with Lignin Based Phenolic Resin Systems; Institut für Holztechnologie Dresden gemeinnützige GmbH (IHD): Dresden, Germany, 2015; Volume 11. [Google Scholar]
- IEA; ICCA; DECHEMA Gesellschaft für Chemische Technik und Biotechnologie e. V. Energy and GHG Reductions in the Chemical Industry via Catalytic Processes: ANNEXES 2013; IEA: Paris, France, 2013. [Google Scholar]
- Werner, F.; Richter, K. Wooden building products in comparative LCA: A literature review. Int. J. Life Cycle Assess. 2007, 12, 470–479. [Google Scholar] [CrossRef]
- Paulitsch, M.; Barbu, M.C. Holzwerkstoffe der Moderne; DRW-Verlag: Leinfelden-Echterdingen, Germany, 2015; ISBN 3-87181-891-7. [Google Scholar]
- Rüter, S.; Diederichs, S. Ökobilanz-Basisdaten für Bauprodukte aus Holz; Bundesforschungsinstitut für Ländliche Räume; Wald und Fischerei Institut für Holztechnologie und Holzbiologie (HTB); Institut für Holztechnologie und Holzbiologie, Zentrum Holzwirtschaft Universität Hamburg: Hamburg, Germany, 2012; p. 316. [Google Scholar]
- Rüter, S. Grunddatensätze für Holz und Holzwerkstoffe im Netzwerk Lebenzyklusdaten; BFH-Institut für Holzphysik und mechanische Technologie des Holzes: Hamburg, Germany, 2007. [Google Scholar]
- Sommerhuber, P.F.; Wenker, J.L.; Rüter, S.; Krause, A. Life cycle assessment of wood-plastic composites: Analysing alternative materials and identifying an environmental sound end-of-life option. Resour. Conserv. Recycl. 2017, 117, 235–248. [Google Scholar] [CrossRef]
- Studiengemeinschaft Holzleimbau e.V. Umwelt-Produktdeklaration nach ISO 14025 Brettschichtholz (BS-Holz); Studiengemeinschaft Holzleimbau e.V.: Wuppertal, Germany, 2013. [Google Scholar]
- Verband der Deutschen Holzwerkstoffindustrie e.V. UMWELT-PRODUKTDEKLARATION nach ISO 14025 EPD-VHI-20130022-IBE1-DE Mitteldichte Faserplatte (MDF); Verband der Deutschen Holzwerkstoffindustrie e.V.: Gießen, Germany, 2013. [Google Scholar]
- PE INTERNATIONAL AG. ECO-EPS-00040101-1106: EUMEPS – Expanded Polystyrene (EPS) Foam Insulation; EUMEPS – European Association of EPS: Leinfelden-Echterdingen, Germany, 2011. [Google Scholar]
- IEA; ICCA; DECHEMA Gesellschaft für Chemische Technik und Biotechnologie e. V. Technology Roadmap Energy and GHG Reductions in the Chemical Industry via Catalytic Processes; IEA Publications: Paris, France; Brussels, Belgium; Frankfurt, Germany, 2013; p. 60. [Google Scholar]
- Iffland, K.; Sherwood, J.; Carus, M.; Raschka, A.; Farmer, T.; Clark, J.; Baltus, W.; Busch, R.; Diels, L.; van Haveren, J.; et al. Definition, Calculation and Comparison of the “Biomass Utilization Efficiency (BUE)” of Various Bio-Based Chemicals, Polymers and Fuels; nova-Institut GmbH: Cologne-Hürth, Germany, 2015; p. 26. [Google Scholar]
- Norsk Treteknisk Institutt; Technical Research Institute of Swenden; FCBA; Thünen Institute. Ecoinflow -Saw Benchmark; Institut Technologique Forêt, Cellulose, Bois-Construction, Ameublement: Charrey sur Saône, France, 2015. [Google Scholar]
- Jarosch, L.; Zeug, W.; Bezama, A.; Finkbeiner, M.; Thrän, D. A Regional Socio-Economic Life Cycle Assessment of a Bioeconomy Value Chain. Sustainability 2020, 12, 1259. [Google Scholar] [CrossRef] [Green Version]
- Bracco, S.; Tani, A.; Çalıcıoğlu, Ö.; Gomez San Juan, M.; Bogdanski, A. Indicators to Monitor and Evaluate the Sustainability of Bioeconomy. Overview and a Proposed Way Forward; FAO: Rome, Italy, 2019. [Google Scholar]
- Perez-Valdes, G.A.; Nørstebø, V.S.; Ellingsen, M.-B.; Teräs, J.; Werner, A.T. Bioeconomic Clusters—Background, Emergence, Localization and Modelling. Sustainability 2019, 11, 4611. [Google Scholar] [CrossRef] [Green Version]
- Derlukiewicz, N.; Mempel-Śnieżyk, A.; Mankowska, D.; Dyjakon, A.; Minta, S.; Pilawka, T. How do Clusters Foster Sustainable Development? An Analysis of EU Policies. Sustainability 2020, 12, 1297. [Google Scholar] [CrossRef] [Green Version]
- Philp, J.; Winickoff, D. Innovation Ecosystems in the Bioeconomy. Oecd Sci. Technol. Ind. Policy Pap. 2019, 76. Available online: https://www.oecd-ilibrary.org/docserver/e2e3d8a1-en.pdf?expires=1588938431&id=id&accname=guest&checksum=7145F65664C39E3A46A9EA2EF6FF8801 (accessed on 10 March 2020).
- Zeug, W.; Bezama, A.; Moesenfechtel, U.; Jähkel, A.; Thrän, D. Stakeholders’ Interests and Perceptions of Bioeconomy Monitoring Using a Sustainable Development Goal Framework. Sustainability 2019, 11, 1511. [Google Scholar] [CrossRef] [Green Version]
- Heimann, T. Bioeconomy and SDGs: Does the Bioeconomy Support the Achievement of the SDGs? Earth’s Future 2019, 7, 43–57. [Google Scholar] [CrossRef] [Green Version]
- Budzinski, M.; Bezama, A.; Thrän, D. Monitoring the progress towards bioeconomy using multi-regional input-output analysis: The example of wood use in Germany. J. Clean. Prod. 2017, 161, 1–11. [Google Scholar] [CrossRef]
- Ronzon, T.; Sanchez Lopez, J.; Follador, M.; Girardi, I.; Giuntoli, J.; Robert, N.; Barredo Cano, J.; Borzacchiello, M.; Sala, S.; M’Barek, R.; et al. Building a Monitoring System for the EU Bioeconomy: Progress Report 2019: Description of Framework; Publications Office of the European Union: Luxembourg, 2020; Available online: https://publications.jrc.ec.europa.eu/repository/bitstream/JRC119056/bemonitoring_finaltopubsy_withbackcover_gm.pdf (accessed on 10 March 2020)ISBN 978-92-76-15385-6.
- Hildebrandt, J.; Bezama, A.; Thrän, D. The contribution of wood-based construction materials for leveraging a low carbon building sector in europe. Sustain. Cities Soc. 2017. [Google Scholar] [CrossRef]
- Husmann, K.; Auer, V.; Beitzen-Heneke, I.; Bischoff, H.; Fehrensen, W.-G.; Fischer, C.; Gilly, A.; Pflüger-Grone, H.; Nagel, J.; Spellmann, H.; et al. Mittelfristigem Anstieg folgt stetiger Rückgang—Zustand und Entwicklung der Rohholzverfügbarkeit in der buchenreichen Mitte Deutschlands. Holz-Zent. 2016, 37, 899–901. [Google Scholar]
- Matzku, P. Damaged wood accrual doubled. Österreichischer Agrarverlag 2019. [Google Scholar]
- Zang, C.; Hartl-Meier, C.; Dittmar, C.; Rothe, A.; Menzel, A. Patterns of drought tolerance in major European temperate forest trees: Climatic drivers and levels of variability. Glob. Chang. Biol. 2014, 20, 3767–3779. [Google Scholar] [CrossRef] [PubMed]
- Schwarz, J.A.; Bauhus, J. Benefits of Mixtures on Growth Performance of Silver Fir (Abies alba) and European Beech (Fagus sylvatica) Increase With Tree Size Without Reducing Drought Tolerance. Front. For. Glob. Chang. 2019, 2, 79. [Google Scholar] [CrossRef]
- Hill, C.A.S. Wood Modification: Chemical, Thermal and Other Processes; Wiley series in renewable resources; John Wiley & Sons: Chichester, UK; Hoboken, NJ, USA, 2006; ISBN 978-0-470-02172-9. [Google Scholar]
- Becher, G. Clusterstatistik Forst und Holz: Tabellen für das Bundesgebiet und die Länder 2000 bis 2013; Johann Heinrich von Thünen-Institut: Braunschweig, Germany, 2015. [Google Scholar]


| Research Questions | |
|---|---|
General Focus
|
|
| Perspective: Sustainability indicators Focus areas:
|
|
| Perspective: Assessment tool Focus areas:
|
|
| Product Group | Wood-based Products | Product Applications | Share of Product with in the Basket |
|---|---|---|---|
| Engineered wood products (EWP), panel boards, and composite materials | Cross-laminated timber (CLT) Laminated veneer lumber (LVL) Glulam timber Wood fiber insulation boards (WFIB) Fiber-reinforced composites (FRIC) | Load-bearing walls Beams Stanchions Insulation boards Construction materials and interior designs | 20% w/w out of which the individual product shares are the following: CLT: 14.1 % w/w LVL: 4.1 % w/w WFIB: 0.9 % w/w FRIC: 0.9 % w/w |
| Polymer products and bio-based resins and foams | Expanded Poly lactic acid (E-PLA) Premium Lignin for foams and resins (PRL) | Platform chemicals | 32% w/w out of which the individual product shares are the following: E-PLA: 22.5 % w/w PRL: 9.5 % w/w |
| (Solid) energy carriers | Hydrolysis lignin (HEL) Biomethane (BM) Wood chips Sawmill byproducts (SMBP), bark residues | Solid biofuels Heat and Power | 48% w/w out of which the individual product shares are the following: HEL: 39 % w/w BM: 7.5 % w/w |
| Selected Impacts and Sustainability Metrics | Reference Number a | ||||||
|---|---|---|---|---|---|---|---|
| 1 | 2 | 3 | 4 | 5 | 6 | 7 | |
| Technical and Environmental Criteria | |||||||
| Biomass availability | x | x | x | x | x | x | x |
| Resource use efficiency | x | x | x | x | |||
| Energy efficiency | x | x | x | ||||
| Land use efficiency | x | x | x | x | |||
| Cascading factors | x | x | x | x | x | ||
| Waste avoidance and minimization | x | x | x | x | x | ||
| Water use efficiency | x | x | x | x | x | ||
| Self-sufficiency of energy supply | x | x | x | x | x | ||
| Decoupling from use of fossil resources | x | x | x | x | x | ||
| Eco-design and Circular economy | x | ||||||
| Renewable power and heat | x | x | x | x | |||
| Avoidance of persistent, toxic, and bioaccumulating substances | x | x | x | ||||
| Decarbonization of the industry | x | x | x | ||||
| Organizational and Socioeconomic Criteria | |||||||
| Cluster and regional networking | x | x | x | ||||
| Competitive products | x | x | x | x | x | ||
| R&D employment | x | x | x | x | |||
| Employment of qualified/unskilled workers | x | x | |||||
| Average/Fair Income of employees | x | ||||||
| Rate of formation of small and medium- sized enterprises (SMEs) and of start-up companies | x | ||||||
| Creation of added value | x | x | x | x | x | ||
| Public health and safety of workers | |||||||
| Stakeholder Category | Interview Partners | Explanation | |
|---|---|---|---|
 | Working health and safety and workers’ rights | Industriegewerkschaft Bau Agrar Umwelt (IG B.A.U.) Sozialversicherung für Landwirtschaft, Forsten, Gartenbau (SVLFG) | Labor union representing workers in the German forestry industries Employer’s liability insurance association in Germany |
 | Cluster management and cluster companies | Members of Cluster management of Leading-Edge Cluster BioEconomy in Central Germany Companies within the Cluster | The BioEconomy e.V. is supported by a team for Cluster management to steer the activities of the Leading-Edge Cluster BioEconomy |
 | Local government bodies | State Ministry for Science and Arts State Ministry for Science and Economy Regional planning organization | Department of State Government Department of State Government Organization for regional planning |
 | Societal groups, NGOs, and Academia | Friends of the Earth Germany (BUND) Forest Stewardship Council (FSC) Programme for the Endorsement of Forest Certification Schemes (PEFC) State forest organization Nordwestdeutsche Forstliche Versuchsanstalt | Association for environmental protection and nature conservation German branches of certification organization for sustainable forest management Forest organization owned by the government Research institute for forest owners, forest companies and politics from several federal states |
| Category | Index | |||
|---|---|---|---|---|
| Goal | Sub-Index | Indicator | Unit | Equation/Measure/Data Sources |
| Maximization of the resource productivity | Minimization of Water Use | |||
| Consumption of ground and surface water | m3/t | Life-Cycle Inventories and Water Footprint data | ||
| Maximization of the Efficiency in Use of Biomass Resources | ||||
| Stoichiometric efficiency | % w/w | |||
| Flows of enthalpy | % E/E | Enthalpy of formation (products) compared to Enthalpy of formation | ||
| Reduction of Fossil-Based Additives and Auxiliaries | ||||
| More efficient use of resins and adhesives | % w/w | Life-Cycle Inventories for product specific resin dosing | ||
| Substitution of fossil-based adhesives and resins | % w/w | Amount of fossil-based resins and adhesives substituted by alternatives | ||
| Increase of Cascading Use of Bio-Based Secondary Raw Materials | ||||
| Reduction of waste in production chains | % w/w | |||
| Share of secondary raw materials in the input resources | % w/w | |||
| Reduction of the Cumulative Energy Demand | ||||
| Increase of heat reuse and power generation from by-products | MJ/t | Inventory-based | ||
| Reduction of steam and power demand | MJ/t | |||
| Reduction of Greenhouse Gas (GHG) Emissions | ||||
| Carbon footprint for product basket | t CO2-eqv. | Cumulated GHG emissions for entire production processes from cradle-to-gate | ||
| Saved emissions | t CO2-eqv. | Saved GHG emissions from gate-to-grave compared to substituted energy carriers and materials | ||
| Category | Index | |||
|---|---|---|---|---|
| Goal | Sub-Index | Indicator | Unit | Equation/Measure/Data Sources |
| Maintaining the resource base | Increase or Steady Extend of External Certification of Sustainable Forestry in the Catchment of the Wood Resources | |||
| Fractions of input raw materials externally certified for their origin from sustainably managed forest catchments | % w/w | Questionnaire-based and inventory-based | ||
| Maximization of the Recycled Share at the End of Product Life | ||||
| Fraction of waste wood suitable for multi-stage cascade use | % w/w | Inventory- and scenario-based | ||
| Fraction of polymers suitable for multi-stage cascade use | % w/w | Inventory- and scenario-based | ||
| Increase of the Energy Self-Sufficiency of Utility Services such as Steam and Power | ||||
| Cumulated heat and power produced from bark, wood chips, and other sawmill by products | kWhSS/ kWhtotal | Inventory-based | ||
| Increase of the Share of Electricity from Renewable Sources in the Production Processes | ||||
| Cumulated share of electricity provided from renewable sources in the overall electricity mix | kWhRE/ kWhtotal | |||
| Minimization of the Share of Imported Fossil-Resources | ||||
| Cumulated share of fossil-resources (natural gas, resins, adhesives) | t/t Output | Inventory-based, cumulated consumption of non-renewable fossil resources | ||
| Products | Involved Industry Sectors | Associated NACE-Codes |
|---|---|---|
| Silviculture, Logging Transport, Manufacture of veneer sheets and wood-based panels | 02.1, 02.2, 49.20, 49.41, 02.3, 16.21 |
| Silviculture, Logging Transport, Manufacture of veneer sheets and wood-based panels | 02.1, 02.2, 49.20, 49.41, 02.3, 16.21 |
| Silviculture, Logging Transport, Manufacture of veneer sheets and wood-based panels | 02.1, 02.2, 49.20, 49.41, 02.3, 16.21 |
| Silviculture, Logging Transport, Manufacture of plastics in primary forms, Manufacture of plastics products, Manufacture of builders’ ware of plastic | 02.1, 02.2, 02.3, 2400, 49.20, 20.16, 22.21, 22.23 |
| Silviculture, Logging Transport, Manufacture of gas, steam, and air conditioning supply, waste treatment, and disposal, Recovery of sorted materials | 02.1, 02.2, 49.20, 49.41, 35.11, 35.21, 35.30, 38.21, 38.32 |
| ID | Description of the Indicator | Unit | Benchmarking Ranges | Weighted Average | |
|---|---|---|---|---|---|
| Max. | Min. | ||||
| RP 1 | Minimizing the consumption of fresh water | m3/t | 1383.15 | 739.0 | 986.2 |
| RP 2 | Increasing the biomass conversion efficiency | w/w | 90.70 | 59.78 | 78.8 |
| RP 3 | Reduction of waste from fossil-based auxiliaries | w/w | 0.07 | 0.02 | 0.046 |
| RP 4 | Cascading factor | w/w | 1.33 | 1.00 | 1.2 |
| RP 5 | Reduction of cumulative energy consumption | MJ/t | 58.18 | 23.49 | 38.5 |
| RP 6 | Maximizing land use efficiency (forest biomass, agroforestry, and agrarian biomass) | t saw logs/ha, t fiber/ha, t sugar/ha, t pulp/ha | 14.13 | 4.90 | 8.7 |
| RP 7 | Reduction of GHG emissions | t CO2-eqv./t | 1.25 | 0.87 | 1.035 |
| RP 8 | Increase in material efficiency | U-Value, Tensile modulus | 1.63 | 0.77 | 1.1 |
| RP 9 | Employment of highly qualified employees | % of total workforce | 5.39 | 3.24 | 4.0 |
| RP 10 | Employment of marginally employed persons | % of total workforce | 7.19 | 2.80 | 6.2 |
| RP 11 | Employment in research and development | % of total workforce | 7.37 | 5.60 | 6.3 |
| RB 1 | Maximizing or Guaranteeing high standards of raw material provision | w/w [t Input certified, regional/t total input] | 99.88 | 37.22 | 74.0 |
| RB 2.1 | Maximizing the recycled content at end-of-life | 15.22 | 5.13 | 9.8 | |
| RB 2.2 | Qualitative factor for multi-stage cascading | Extrusion and molding | 0.84 | 0.76 | 0.8 |
| RB 4 | Maximizing the coverage degree of energy self-sufficiency | % [MWh Self-supply/ MWh total demand] | 80.79 | 30.55 | 43.1 |
| RB 5 | Maximizing the share of renewable energy | % | 65.92 | 38.46 | 43.8 |
| RB 6 | Proportion of imported fossil resources | % | 78.09 | 45.45 | 61.7 |
| RB 8 | Adequate remuneration | Score from A. Siebert | 7.57 | 4.64 | 7.0 |
| RB 9 | Minimizing the accident numbers | Score from A. Siebert | 7.991 | 5.99 | 7.0 |
| RB 11 | Prevention of occupational diseases | Score from A. Siebert | 6.807 | 4.00 | 5.4 |
| RB 12 | Minimizing the cases of illness | Score from A. Siebert | 6.492 | 5.61 | 5.9 |
| RB 13 | Employees per 100 t moisture free wood (atro) processed into product output | MA/100 t atro | 0.120 | 0.01 | 0.035 |
| RB 14 | Creation of training places | Score from A. Siebert | 7.991 | 5.48 | 7.0 |
| EB 3 | Maximizing financial participation | Score from A. Siebert | 4.889 | 1.20 | 4.8 |
| EB 5 | Improvement of working conditions | Score from A. Siebert | 8.890 | 4.72 | 6.2 |
| WS 1 | Added-value creation (Distant second-best performer) | €/t | 307.838 | 55.08 | 233.4 |
| WS 2 | Competitive production costs | €/t | 483.638 | 736.4 | 558.1 |
| WS 3 | Potential for capacity expansion in the competition regime (input capacities) | Kilotons (kt) | 2315.0 | 482.5 | 632.663 |
© 2020 by the authors. Licensee MDPI, Basel, Switzerland. This article is an open access article distributed under the terms and conditions of the Creative Commons Attribution (CC BY) license (http://creativecommons.org/licenses/by/4.0/).
Share and Cite
Hildebrandt, J.; Bezama, A.; Thrän, D. Insights from the Sustainability Monitoring Tool SUMINISTRO Applied to a Case Study System of Prospective Wood-Based Industry Networks in Central Germany. Sustainability 2020, 12, 3896. https://doi.org/10.3390/su12093896
Hildebrandt J, Bezama A, Thrän D. Insights from the Sustainability Monitoring Tool SUMINISTRO Applied to a Case Study System of Prospective Wood-Based Industry Networks in Central Germany. Sustainability. 2020; 12(9):3896. https://doi.org/10.3390/su12093896
Chicago/Turabian StyleHildebrandt, Jakob, Alberto Bezama, and Daniela Thrän. 2020. "Insights from the Sustainability Monitoring Tool SUMINISTRO Applied to a Case Study System of Prospective Wood-Based Industry Networks in Central Germany" Sustainability 12, no. 9: 3896. https://doi.org/10.3390/su12093896