Article

Looking for Answers to Food Loss and Waste Management in Spain from a Holistic Nutritional and Economic Approach

by
Jara Laso
1,
Cristina Campos
1,
Ana Fernández-Ríos
1,
Daniel Hoehn
1,
Andrea del Río
1,
Israel Ruiz-Salmón
1,
Jorge Cristobal
1,
Ainoa Quiñones
2,
Francisco José Amo-Setién
3,
María del Carmen Ortego
3,
Sergio Tezanos
4,
Rebeca Abajas
3,
Alba Bala
5,
Pere Fullana-i-Palmer
5,
Rita Puig
6,
María Margallo
1,
Rubén Aldaco
1,* and
Ricardo Abejón
1,7
1
Departamento de Ingenierías Química y Biomolecular, Universidad de Cantabria, Avda. de Los Castros s/n, 39005 Santander, Spain
2
Departamento de Administración de Empresas, Universidad de Cantabria, Avda. de Los Castros s/n, 39005 Santander, Spain
3
Departamento de Enfermería, Universidad de Cantabria, Avda. de Los Castros s/n, 39005 Santander, Spain
4
Departamento de Economía, Universidad de Cantabria, Avda. de Los Castros s/n, 39005 Santander, Spain
5
UNESCO Chair in Life Cycle and Climate Change ESCI-UPF, Pg. Pujades 1, 08003 Barcelona, Spain
6
Department of Computer Science and Industrial Engineering, Universitat de Lleida (UdL), Pla de la Massa, 8, 08700 Igualada, Spain
7
Departamento de Ingeniería Química, Universidad de Santiago de Chile, Av. Libertador Bernardo 11 O’Higgins 3363, Estación Central, Santiago 9170019, Chile
*
Author to whom correspondence should be addressed.
Sustainability 2021, 13(1), 125; https://doi.org/10.3390/su13010125
Submission received: 11 November 2020 / Revised: 10 December 2020 / Accepted: 21 December 2020 / Published: 24 December 2020

Abstract

:
The generation of food loss and waste (FLW) is a global problem for worldwide politics. About one-third of the food produced ends up in the rubbish before it is consumed. For this reason, it is essential to design and implement new strategies along the food supply chain (FSC) with the aim of reducing this FLW at each stage. However, not only mass quantification should be considered, but also economic and nutritional performance. The novelty of this study is the definition of a methodology based on the “distance to target” approach by means of multi-objective optimization to evaluate the economic and nutritional cost produced by this FLW. This methodology was applied to the Spanish food basket in 2015. The results revealed that 80% of the total FLW generated in economic and nutritional terms is concentrated in the agricultural production (53.3%) and consumption (26.3%) stages. In the first stages of the FSC, fruits (Dn eq.= 0.7), cereals (Dn eq.= 0.61), and vegetables (Dn eq.= 0.57) were the furthest from the distance target due to the great amount of FLW generated. Moreover, according to the normalized weighted distances obtained from the minimization of economic and nutritional cost, pulses (Dn eq. = 0.05–0.03) and eggs (Dn eq. = 0.02) were the more efficient food categories. The methodology described in this study proposes a single index to quantify the economic and nutritional cost of different food categories to facilitate the decision-making process. This index makes possible the definition of reduction strategies focused on specific food categories and depending on the FSC stage.

1. Introduction

Food loss and waste (FLW) is a mainstream environmental, social, and economic concern at a global scale [1]. It is estimated that around 1300 million tons of food for human consumption are wasted each year in the world [2]. FLW is produced along the whole food supply chain (FSC), including agricultural production, post-harvest, handling and storage, processing and packaging, distribution, and final consumption. However, despite of the lack of harmonization in terminology, it is important to distinguish between the losses (FL) that occur at the beginning of the FSC (agricultural production, post-harvest, and processing), and those wastes (FW) generated at the end of the FSC [3], which are more related to retailers and consumer behavior [4]. Geographically, low-income countries are characterized by important FL in the early stages of FSC, from agricultural production to processing, where impacts are the strongest and losses tend to be the largest due to the lack of technological infrastructure causing significant post-harvest losses. In contrast, medium- and high-income countries result in great FW in the retail and consumption stages, as products are discarded even if they are still suitable for human consumption [5]. The causes of these losses stem mainly from consumer behavior and lack of coordination between different actors in the supply chain [6].
Figure 1 displays global FL and FW per capita in 2011. In Europe and North America, the per capita FLW reached 280 kg/year and 300 kg/year, representing FL 68% and 60% of the total amount, respectively. This means that, on average in industrialized countries, around 40% of FLW take place at retail and consumer levels. On the other hand, FLW per capita in Sub-Saharan Africa and South/Southeast Asia were 170 kg/year and 120 kg/year, respectively. In this case, FL represented more than 90% of the total FLW, with low contribution of the last stages of the FSC [6]. Moreover, Gustavsson et al. [7] estimated that the food wasted in industrialized regions is around 12 times higher than in developing countries.
The amount of FLW in the different stages depends on several factors, such as the type of agricultural production systems, market requirements, diets and consumption patterns, or income level. These FLW lead to a great imbalance between developing and developed countries, with more than 90% of the global undernourished people living in Asia and Africa [8]. Therefore, several measures focused on the different stages (production, post-harvest, storage, distribution, and consumption) of the FSC are required to enhance food security [9] and to face the challenge of feeding the world’s population sustainably [10]. Some remarkable measures are improving farmers’ livelihoods by marketing perishable food crops to reduce post-harvest losses of these products. Furthermore, investing in food processing infrastructure and market facilities including packaging would also sustainably improve the food security situation by addressing the growing demand in metropolitan areas. In addition, transport and energy losses would be improved and the product’s life increased. All these measures require coordinated action by states, international organizations, the private sector, and civil society [11].
From an economic point of view, the Food and Agriculture Organization of the United Nations (FAO) estimated that wasting 1300 million tons of food produced around USD 1 trillion of economic costs per year, whereas environmental costs reach around USD 700 billion and social costs around USD 900 billion [11]. At the European level, economic losses reached €143 billion in 2012, with two-thirds of the costs being related to household consumption [9]. In environmental terms, FLW supposes a great squandering of energy, water, and material resources, as well as the emission of greenhouse gases (GHG), among other pollutants. In 2007, the carbon footprint (CF) related to global FLW was estimated at 3.3 Gtons of CO2 equivalent (eq.), increasing to 4.4 Gtons of CO2 eq. in 2011, with cereals (34% of the total CF), meat (21%), and vegetables (21%) as the main contributors. Comparing this value with the CF of several countries, the emissions of CO2 eq. from FLW would rank number three in the world, overtaken only by USA (7.1) and China (6.9) [12]. In addition, the global blue water footprint related to surface and groundwater consumption was about 250 km3 and the global land occupation footprint was about 1.4 billion hectares [13].
These alarming data raise the need to include the reduction of FLW in Sustainable Development Goal (SDG) number 12, whose goal 12.3 calls for “halving per capita global food waste at the retail and consumer level, and reducing food losses along production and supply chains by 2030” [14].
Moreover, actions and strategies to reduce FLW have been developed by several authors and taken by means of initiatives and regulations at European and national level. Prevention aims to reduce the amount of waste, its adverse impact on the environment and human health, and the content of harmful substances in materials and products [15]. This is the most favorable action according to the waste hierarchy and it has been valued in the FSC by several authors. Lasaridi et al. [16] established some measures that should be considered in order to prevent FLW, both in production and consumption stages, such as donations, appropriate storage conditions, management of order in the retail sector, and education of personnel in the retail-wholesale sectors, among others. Likewise, Zorpas et al. [17] investigated the implementation of some prevention activities at household and the consequent reduction of food waste. In addition, a holistic approach processing how to develop, implement, monitor, and improve a strategy that can be applied for food waste prevention was developed by Zorpas [18].
However, when prevention is not possible, other actions to reduce FLW have been taken by means of initiatives and regulations at European and national level. In 2011, the European Parliament adopted the decision on “how to avoid food wastage: strategies for a more efficient food chain in the EU” that aims to halve food waste by 2025 and to improve food security in Europe [19]. In 2015, the European Commission published the action plan for the circular economy (Closing the loop—An EU action plan for the Circular Economy) that prioritizes FLW prevention and encourages member states to include in their policy measures to reduce FLW along the whole FSC [20]. In 2016, the European Union (EU) Platform on FLW was established, bringing together experts, stakeholders, and institutions of the EU to define measures to prevent and reduce FLW evaluating its progress and sharing their experiences [21].
To meet these goals several European projects have been approved. For instance, FUSIONS (Food Use for Social Innovation by Optimising Waste Prevention Strategies) contributed to harmonize FW monitoring and to develop guidelines for a common food waste policy for the 27 European Union countries (EU-27), among other actions [22]. In 2015, the REFRESH project [23], financially supported by the EU Horizon 2020, was planned to contribute to reaching the FLW reduction target of SDG 12.3, which is equivalent to between 25 and 40 million tons of food not being wasted in 2025 and accounts for €10 billion a year [24]. On the other hand, awareness-raising events, such as the “International Food Loss and Waste Awareness Day”, are also celebrated to make society aware of this issue.
At the national level, Spain is the seventh largest food-waste country (7.7 million tons). In 2019, 1352 million kg/L of food and drinks were thrown away (4.7% of the food we buy) of which 1.146 million were unprocessed products and 206 million were cooked dishes. Currently, during the COVID-19 health crisis, food waste has been reduced by up to 14% (March to June 2020) [25]. On the other hand, the main reasons for the generation of waste in Spanish companies are product quality and machinery damage. Most of the wasted products are sent to the landfill although the high cost of sending products to the landfill is causing companies to be more aware of the need of reducing the amount waste landfilled. As a result, 71% of companies have internal strategies to combat this type of waste treatment [26]. To handle this issue, the initiative called “Food has no waste” [27] promoted prevention practices to take advantage of the production surplus and to make society aware of the FLW problem. In 2013, the Spanish Ministry of Agriculture, Fisheries and Food launched the campaign “More food, less waste 2013–2016” [28] followed by the new Strategy 2017–2020 [29]. These documents expected to measure the amount, type, and reasons of food wastage, in which stages of the FSC they were produced, and to disseminate and promote best practices [29]. Despite these efforts, currently Spain does not have a harmonized regulation for FLW management. Regional regulations and measures were adopted in the Balearic Islands with the Waste Reduction Law of 2019 that includes good practice guidelines [30], in Galicia where restaurants are required to deliver leftover to their clients [31], or in Catalonia with the first law that penalizes food wastage through the entire FSC [32].
Although progress can be observed in the adoption and publication of policies and regulations taken at European, national, or regional level, the content of these actions is similar in all of them. In 2011, the European Parliament adopted the decision “how to avoid food wastage: strategies for a more efficient food chain in the EU”, which outlined a series of strategies to reduce food waste by 2025. In 2015, an action plan for the circular economy was published. However, the strategies proposed in both regulations are quite similar. Likewise, initiatives in Spain (“food has no waste” or “more food, less waste 2013–2016”) and at the regional level also focus on those actions proposed at European level, such as the publication and dissemination of best practices guides, regulatory aspects, collaboration with stakeholders, new technologies, and other measures. Therefore, despite the existence of several regulations and projects related to reducing FLW, progress in its content in recent years is scarce.
Several studies have estimated and evaluated FLW from the economic, weight, nutritional, or environmental perspective. Gustavsson et al. [7] determined the FLW at a global level, finding a direct relation between higher amounts of FW and the industrialization level of the country. Kummu et al. [33] determined FLW in terms of mass and its nutritional energy lost, considering the difference between FL and FW. From a nutritional perspective, Buzby et al. [34] and Spiker et al. [35] estimated a nutritional loss in the USA of 1249 and 1217 kcal/capita per day in 2010 and 2012, respectively. However, Hall et al. [36] obtained a higher amount of calories wasted in the USA, 1400 kcal/capita per day. At a global scale, Abbade [37] estimated the nutritional cost derived from FLW registered worldwide, which would allow feeding about 940 million people, being enough to feed the undernourished population worldwide.
From an environmental perspective, Scherhaufer et al. [38] reported a value of 2.13 t CO2 eq./t waste in Europe, similar to the value published by the European Commission, 1.9 t CO2 eq./t waste [24]. At a national scale, Quested and Johnson [39] estimated a value of 4.5 t CO2 eq./t waste in UK households. Gruber et al. [40] assessed the environmental burdens of three products’ waste (potatoes, milk, and rice) using life cycle assessment (LCA), determining the influence of consumers’ behavior and food category on the total impact of each life cycle stage.
Finally, from an economic point of view, there are few studies related to FLW at the agricultural production, post-harvest, and processing stages. Rutten [41] established that FLW in industrialized and developing countries was very different (US$ 680 and US$ 310 billion, respectively). These data suggested that losses were much higher at the immediate post-harvest stages in developing countries and higher for perishable foods across industrialized and developing economies alike. At the European scale, economic losses were estimated at €143 billion, with 66.6% of costs related to household consumption [42]. Recent studies showed that economic losses have increased by 11% because of COVID-19. Furthermore, food products like red meat, cereal, fruits, and vegetables were the highest contributors to economic waste with a 60.2% (€4.5/capita per week). Due to lower demand and price of products, lamb, fresh fish, and especially beverages, contributed to reducing the FLW cost (12.5%) [43]. Although FLW management has been assessed from different points in view, it is imperative to promote an integrated and comprehensive way to combine the different points of view to facilitate the decision-making.
Recently, some authors combined some of these variables to have a holistic approach since more complex metrics include additional relevant aspects to support the decision-making process. For instance, García-Herrero et al. [9] assessed the energetic and environmental efficiency of the Spanish agri-food system using a life cycle approach. Authors defined a nutritional and economic index called Nutritional Cost Footprint (NCF) for the supply chain of the Spanish food system to define recovery strategies. Similarly, Vazquez-Rowe et al. [10] combined the nutritional and economic efficiency of FLW along the supply of 13 food categories included in the Spanish food basket. On the other hand, Laso et al. [44] combined LCA and data envelopment analysis (DEA) to assess the efficiency of Spanish agri-food system and to propose improvement actions in order to reduce energy usage and GHG emissions.
Although these indicators allow the quantification of the performance of different solutions depending on the variables assessed, case studies related to sustainability assessment and impact reduction with multiple objectives are based on a “direction to target” approach, which is focused on a sustainable objective without quantitative guidelines. However, a “distance to target” approach provides practical guidelines by measuring and quantifying the magnitude towards a previously defined sustainable target. In this sense, the main novelty of this study is the definition of a methodology to obtain a single indicator that combines economic and nutritional variables applying a “distance to target” approach by means of multi-objective optimization. This methodology allows to identify the hotpots, critical food categories, and FSC stages to focus the improvement measures of them. Furthermore, unlike other conventional optimization methods, it combines the economic and nutritional variables, minimizing both functions together, and providing a single solution, rather than a set of them, making its interpretation easier. However, this fact can also present a limitation, since it is not possible to choose another solution that provides a greater improvement in a specific variable if necessary. In this case, the Spanish food system was used as case study to identify the food categories in which FLW represent a greater economic and nutritional impact. It provides a thorough analysis that would help decision making process for the definition of strategies to minimize FLW along the agri-food supply chain.

2. Methodology

The methodology developed in this study aims to obtain an optimized indicator based on the normalized Euclidean distance between an individual solution and the optimization target, applying a “distance to target” approach. This single index combines both nutritional and economic variables, so it provides a useful tool to identify the most critical food categories and facilitates the decision-making process to design initiatives and policies for a better management of FLW. In addition, the distance values are normalized in the range between 0 and 1, so a direct and easily comparable outlook of the results is provided, which presents an important advantage over conventional multi-objective optimization methods. In this case, FLW along the Spanish FSC in 2015 was selected as a case of study. The food categories sourced were fruits, vegetables, cereals, milk and other dairy products, vegetable oils, fish, meat, pulses, roots and tubers, sugar, and eggs. More information about the case study can be found in [3].
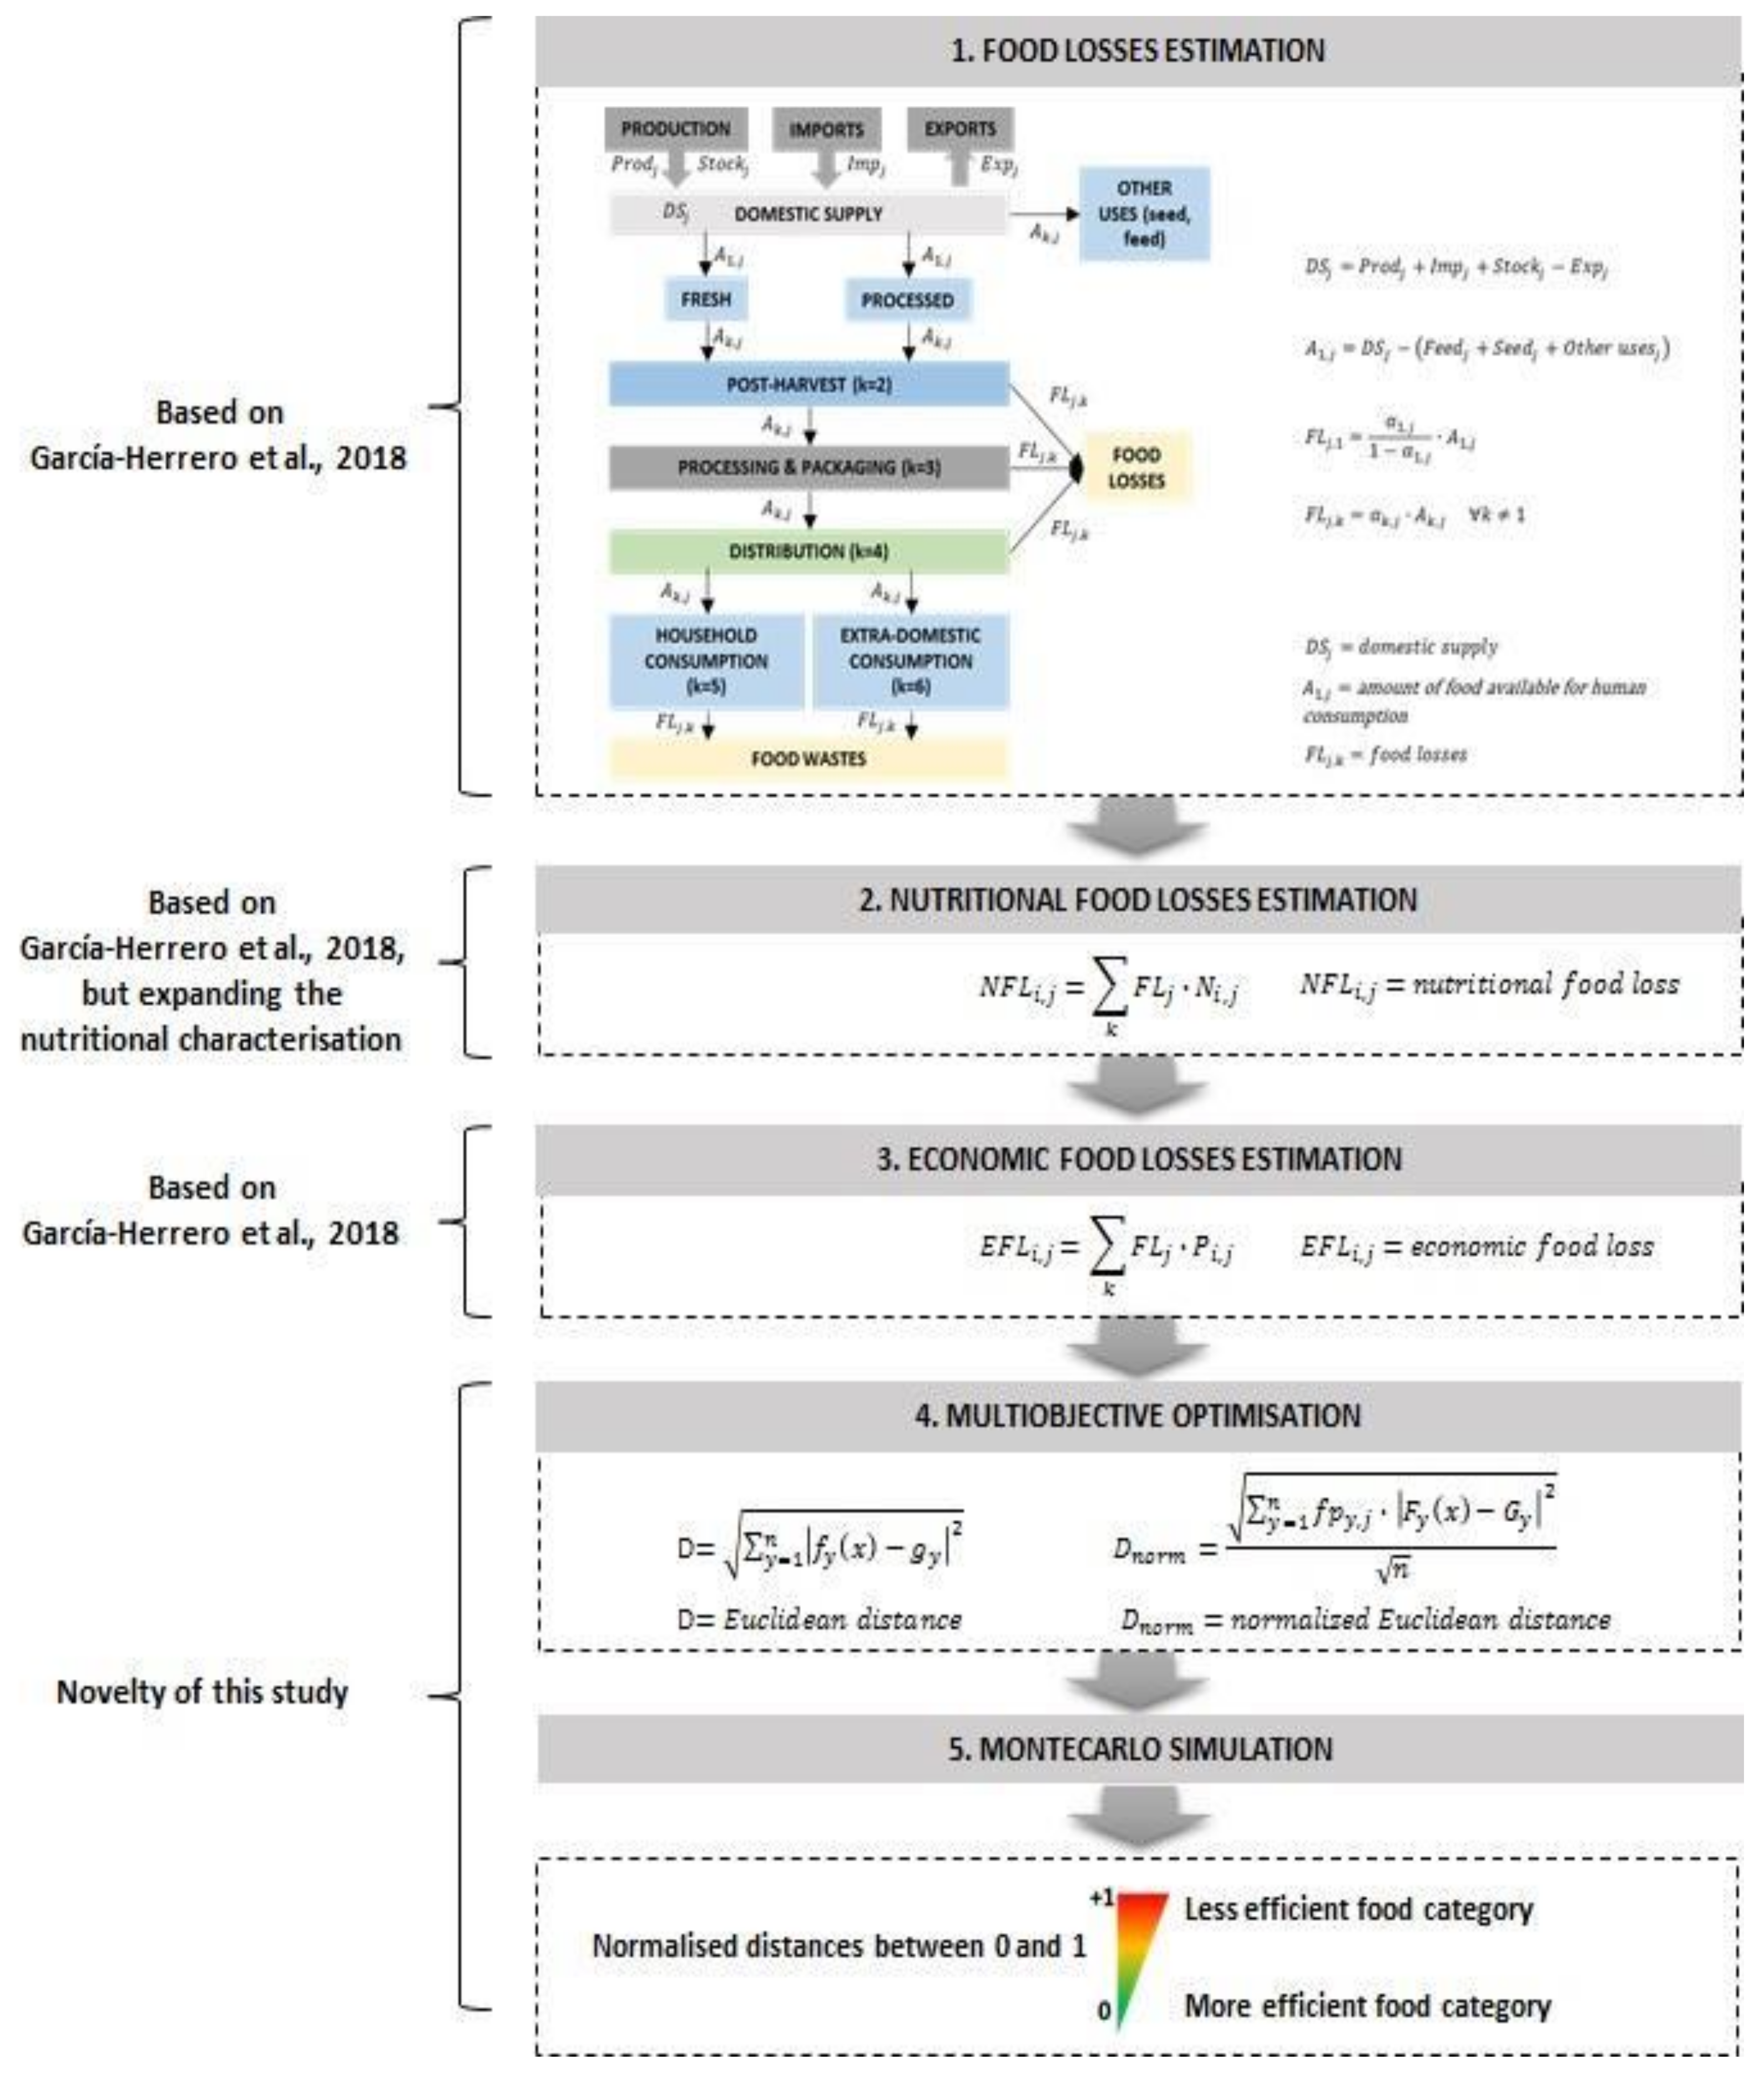
Figure 2 shows the flowchart of the methodology proposed in this study, which includes five phases: (1) food losses estimation, (2) nutritional food losses estimation, (3) economic food losses estimation, (4) multi-objective optimization, and (5) Monte Carlo simulation. The first phase consists of the calculation of the food losses during the FSC, which are estimated through a material flow analysis (MFA). García-Herrero et al. [3] developed this MFA, considering FLW throughout the 6 main stages of the FSC (k = 1 agriculture; k = 2 post-harvest; k = 3 processing and packaging; k = 4 distribution; k = 5 household consumption, and k = 6 extra-domestic consumption), according to the food balances by FAO [45]. The first stage of the FSC is domestic supply, which is calculated following Equation (1) and refers to the total amount of food available to be used considering the production losses, imports, exports, and stock variations in a specific year and country.
D S j = P r o d j + I m p j + S t o c k j E x p j
where Prodj refers the food production for food category j (j = 1 cereals; j = 2 roots and tubers; j = 3 sugar; j = 4 vegetable oils; j = 5 vegetables; j = 6 fruits; j = 7 pulses; j = 8 meat; j = 9 fish; j = 10 milk and other dairy products; j = 11 eggs); Impj describes the movements of the products in of the country (or imports); Expj is the movements of the products out of the country (or exports); and Stockj refers to the stock availability of the product for the year under study. In order to determine the amount of food for the supply chain (DSj) available for human consumption (A1,j), the quantities of commodities used for other purposes were considered, as Equation (2) established.
A 1 , j = D S j F e e d j + S e e d j + O t h e r   u s e s j
where F e e d j describes the amount of commodity destined to animal feed; S e e d j is the amount of commodity used for reproductive purpose; and O t h e r   u s e s j refers to the quantities of commodities used for other non-food purposes.
Knowing the amount of food intended to human consumption (A1,j), FLW is determined by means of the Equations (3) and (4), which consider the percentage of FLW generated in each stage k for food category j (∝k,j) (see Table A1 of the Appendix A).
F L W j , 1 = α 1 , j 1 α 1 , j · A 1 , j
F L W j , k = α k , j · A k , j       k 1
where α k , j is the percentage of FLW generated in each stage k for food category j (see Table A1 of the Appendix A). More information about MFA is available in [3].
The second stage of the methodology is the nutritional food losses estimation. For this purpose, the estimation carried out by García-Herrero et al. [3] was used as reference, as it calculated the nutritional food loss footprint (NFLWF). In this study, the nutritional assessment was developed considering six nutritional characteristics of each food category: i = 1 proteins; i = 2 fats; i = 3 fiber; i = 4 carbohydrates; i = 5 minerals, and i = 6 kilocalories. In order to calculate the nutritional content present in the amount of FLW, the nutritional characterization of food category in the supply stage k and nutritional descriptor i (Ni,j) was used [46]. Therefore, Equation (5) was applied to calculate NFLW. The Bedca database [41] was used to determine the different nutritional content of food categories.
N F L W i , j = K F L W j · N i , j
The third stage of the methodology consists of the economic food losses estimation. The calculations are similar to those used for the NFLW but using the economic value of food category j in the supply stage k (Pi,j) instead of the nutritional content.:
E F L W i , j = k F L W j · P i , j
Depending on the supply stage, the economic value was divided into three groups: (a) for the agricultural production and post-harvest stages the price at origin is used; (b) for the processing and packaging and distribution and wholesale and retail stages the wholesale prices are considered, and (c) for the consumption stage the price for consumers (see Table A3 of the Appendix A). The use of the different prices is due to the fact that the price of foods increases as it moves through the supply chain, which means that FL in the consumption stage generates a higher economic impact that in the agricultural one [3].
The fourth stage consists of the multi-objective optimization. This analysis is the novelty of this study, since this holistic approach considers the nutritional and economic impact of FLW as a single indicator. This methodology proposes a “distance to target” approach, which provides some advantages when compared to standard multi-objective optimization methods [47]. For instance, it provides a single Pareto solution rather than a Pareto front of solutions, i.e., it supplies only one optimum solution that cannot be improved. Moreover, it can be applied to identify the best way to improve suboptimal solutions [48]. This single indicator is based on the Euclidean distance that is the distance between the individual solutions and the optimization targets and is defined by the following Equation (7):
D = y = 1 n f y x g y 2
where f y x is the vector to be optimized and g y the specified target. In the current study, a normalized weighted distance Dnorm was employed as the main indicator to identify minimal nutritional and economic costs of different categories of food products applying Equation (8):
D n o r m = y = 1 n f p y , j · F y x G y 2 n
where F y x is the normalized vector to be optimized and G y the normalized specified target vector, while f p y , j represents the weighting factor of each objective. This definition of Dnorm implied that the distance values were normalized in the range between 0 (closest to the target) and 1 (furthest to the target), so a direct and easily comparable outlook of the results was provided (another clear advantage over conventional multi-objective optimization methods). In this case, since both objectives must be minimized, the normalized target vector was the null vector (all components are equal to 0).
Since FLW generation is influenced by several factors, such as the geographic area, the supply chain stage, or the production area, it is necessary to consider these factors when elaborating policies and initiatives. Therefore, it is imperative to analyze how the target distances change when the weighting factor of each objective varies. In this sense, this study used the Monte Carlo simulation approach for the calculation of distances for each food category. This method is useful for the analysis of FLW in a quantitative basis, where numerical values are assigned to these losses or wastes. The core of Monte Carlo analysis is to vary input parameters according to the probability distribution function within likewise pre-defined ranges (max and min) of input parameters. For each random set of input, total outputs are calculated. The Monte Carlo simulator has many advantages over other types of deterministic analysis, such as providing graphical results, allowing you to see exactly which values present each variable when certain results occur and which variables have the largest influence on the final results, as well as finding out precisely the reason, when some factors rise, others rise or fall in parallel way [49]. In this case, Equation (8) was used to vary random values of weighting factors of each objective fpy,j to obtain multiple of distances per food category.
The optimization tasks were carried out using GAMS [50] software environment to solve the developed non-linear programming (NLP) model using CONOPT3 solver. The General Algebraic Modeling System (GAMS) is a high-level modeling system for mathematical programming and optimization. It is based on a language compiler and a library of integrated high-performance solvers. In the case of the Monte Carlo analysis, Excel was employed for the assessment of the relative relevance of the impacts, leading to a distribution of distance values resulted of 1000 different runs.

3. Results

The results include the quantification of the FLW in mass, economic, and nutritional terms in Section 3.1, the multi-objective simulation based on distances (Section 3.2), and finally, the Monte Carlo simulation in Section 3.3.

3.1. FLW Quantification in Mass, Economic, and Nutritional Terms

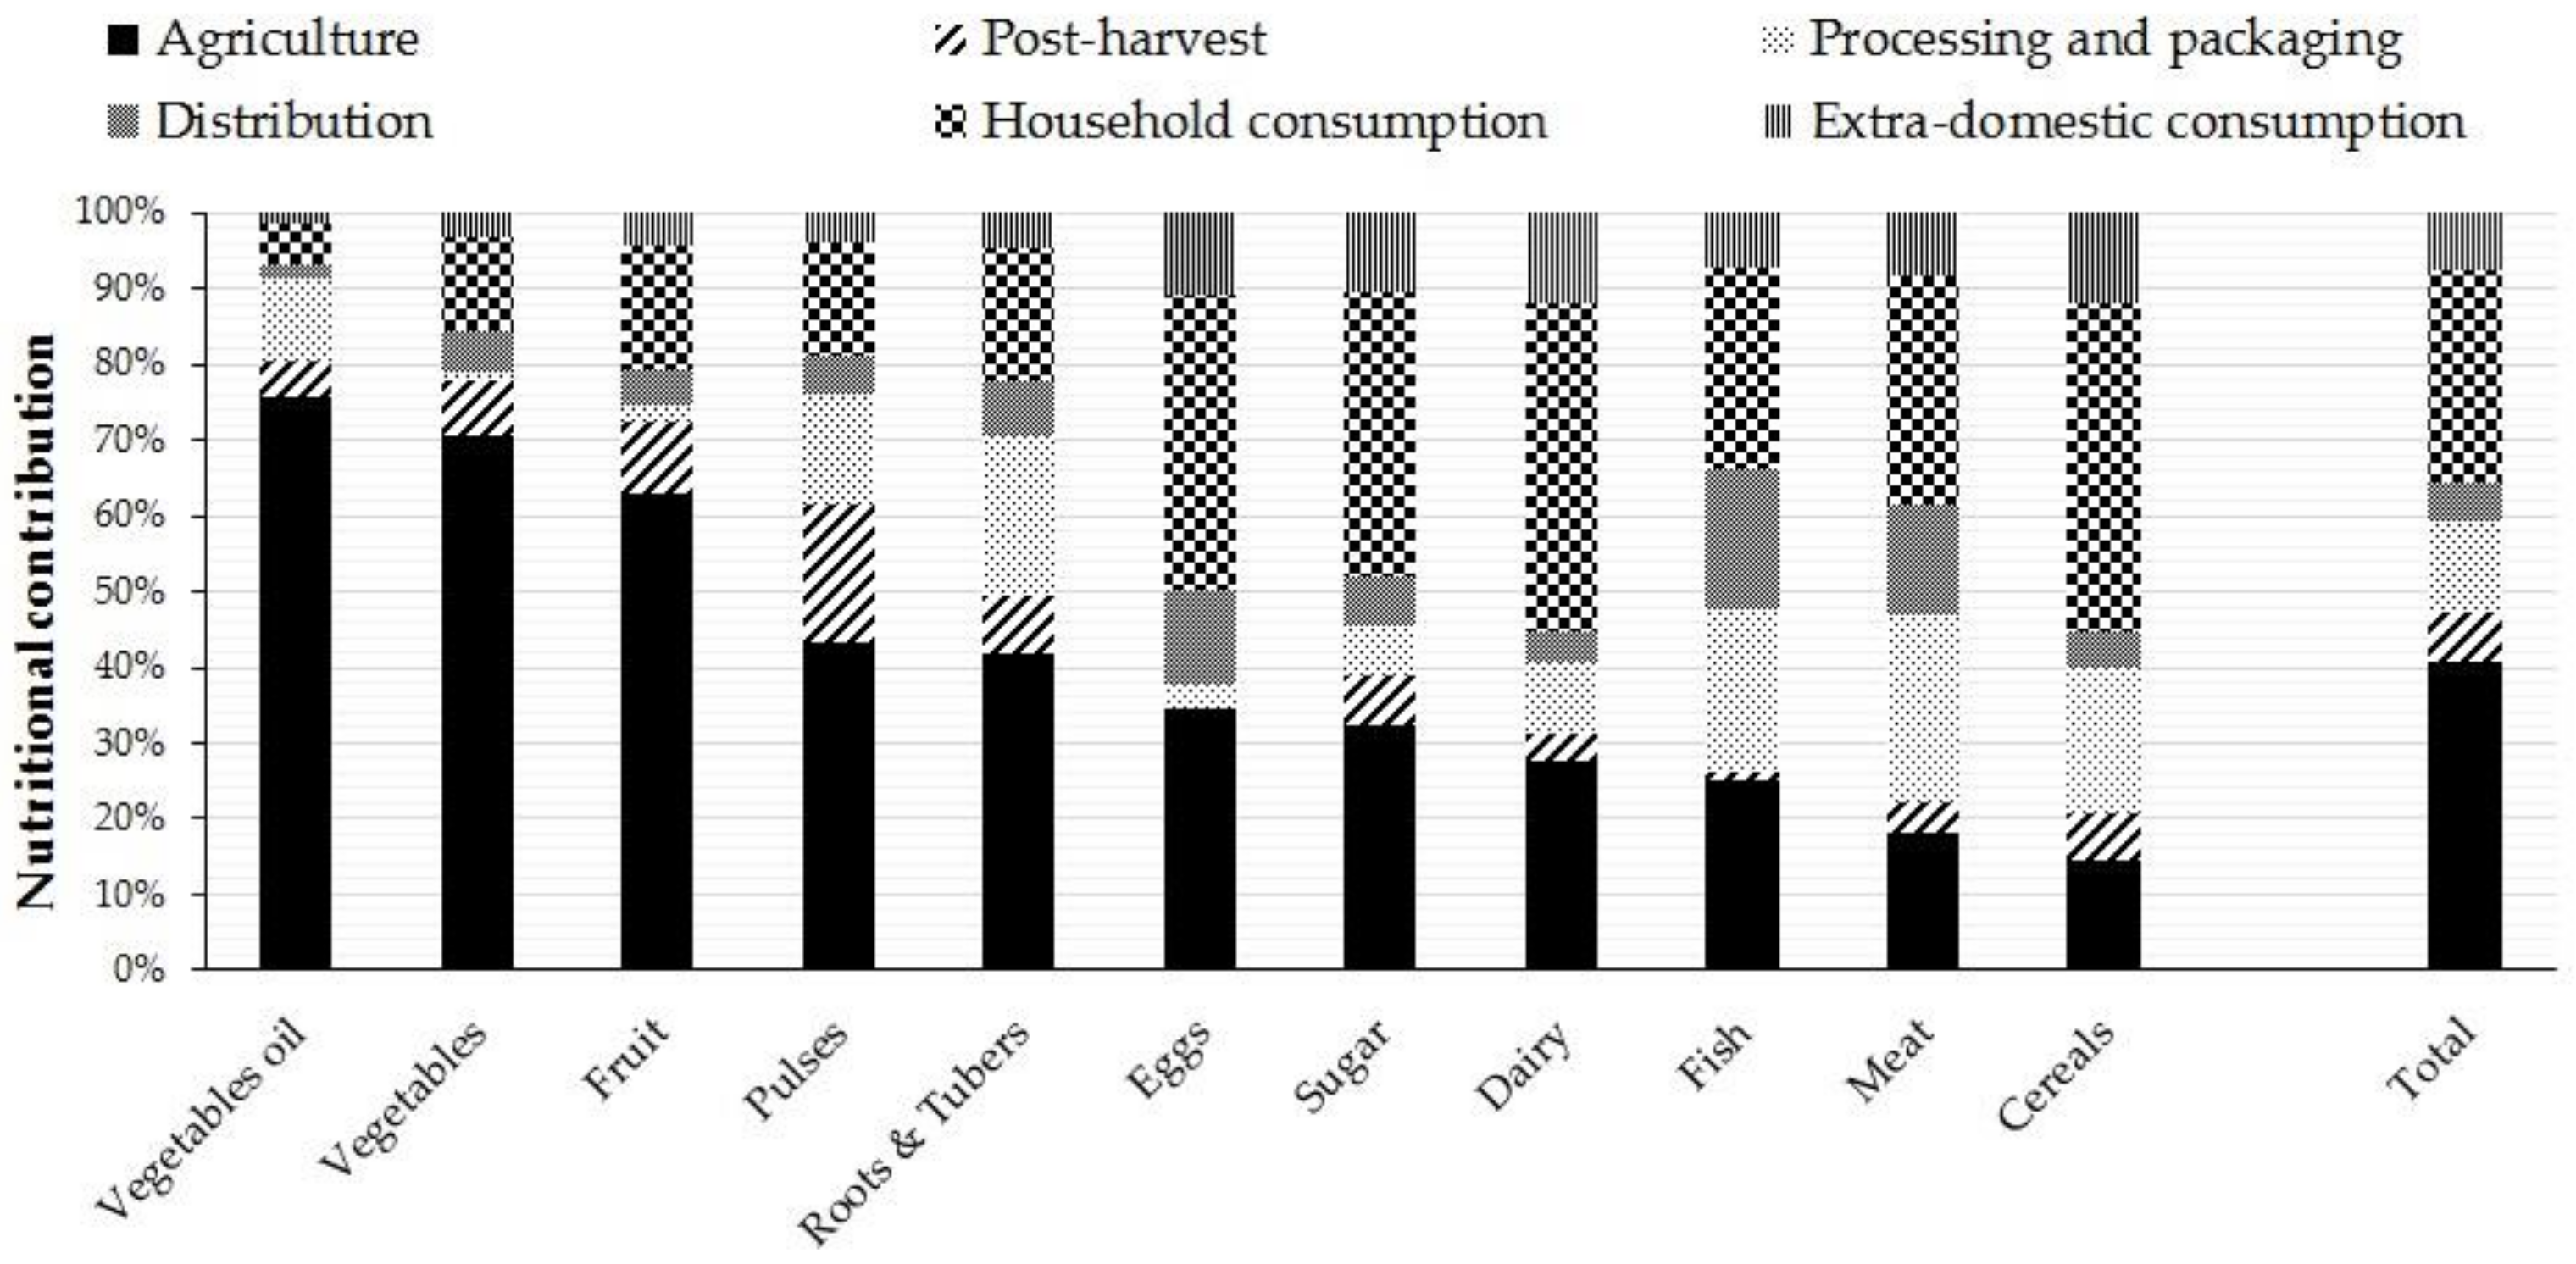
Figure 3 shows the mass contribution of the different stages of the FSC to the generation of FLW for each food category. In addition, the total FLW is shown on the right bar of the graph. This analysis revealed that almost 54% of FLW was generated in the agriculture stage due to climatic causes, technological deficiencies, overproduction, and food quality standards. Vegetable oils (75%), vegetables (70.5%), and fruits (62.8%) were the most wasted food categories in this stage. About 27% of the total FLW was produced at the consumption stage, particularly 21% in households and 6% in extra-domestic consumption, due to poor (or lack of) planning in the food basket, over-provisions, and unsustainable consumption habits. At this stage, the highest losses were found in milk and dairy products (55.2%) and cereals (55.4%). The remaining stages of the FSC, such as post-harvest (7.3%), processing and packaging (7.4%), and distribution (5.7%) had low mass contribution, below 8%. Nevertheless, by food categories, pulses presented the greatest contribution in post-harvest (18%), whereas meat (24.5%) and fish (18.3%) were highlighted in the processing and packaging and distribution stages, respectively.
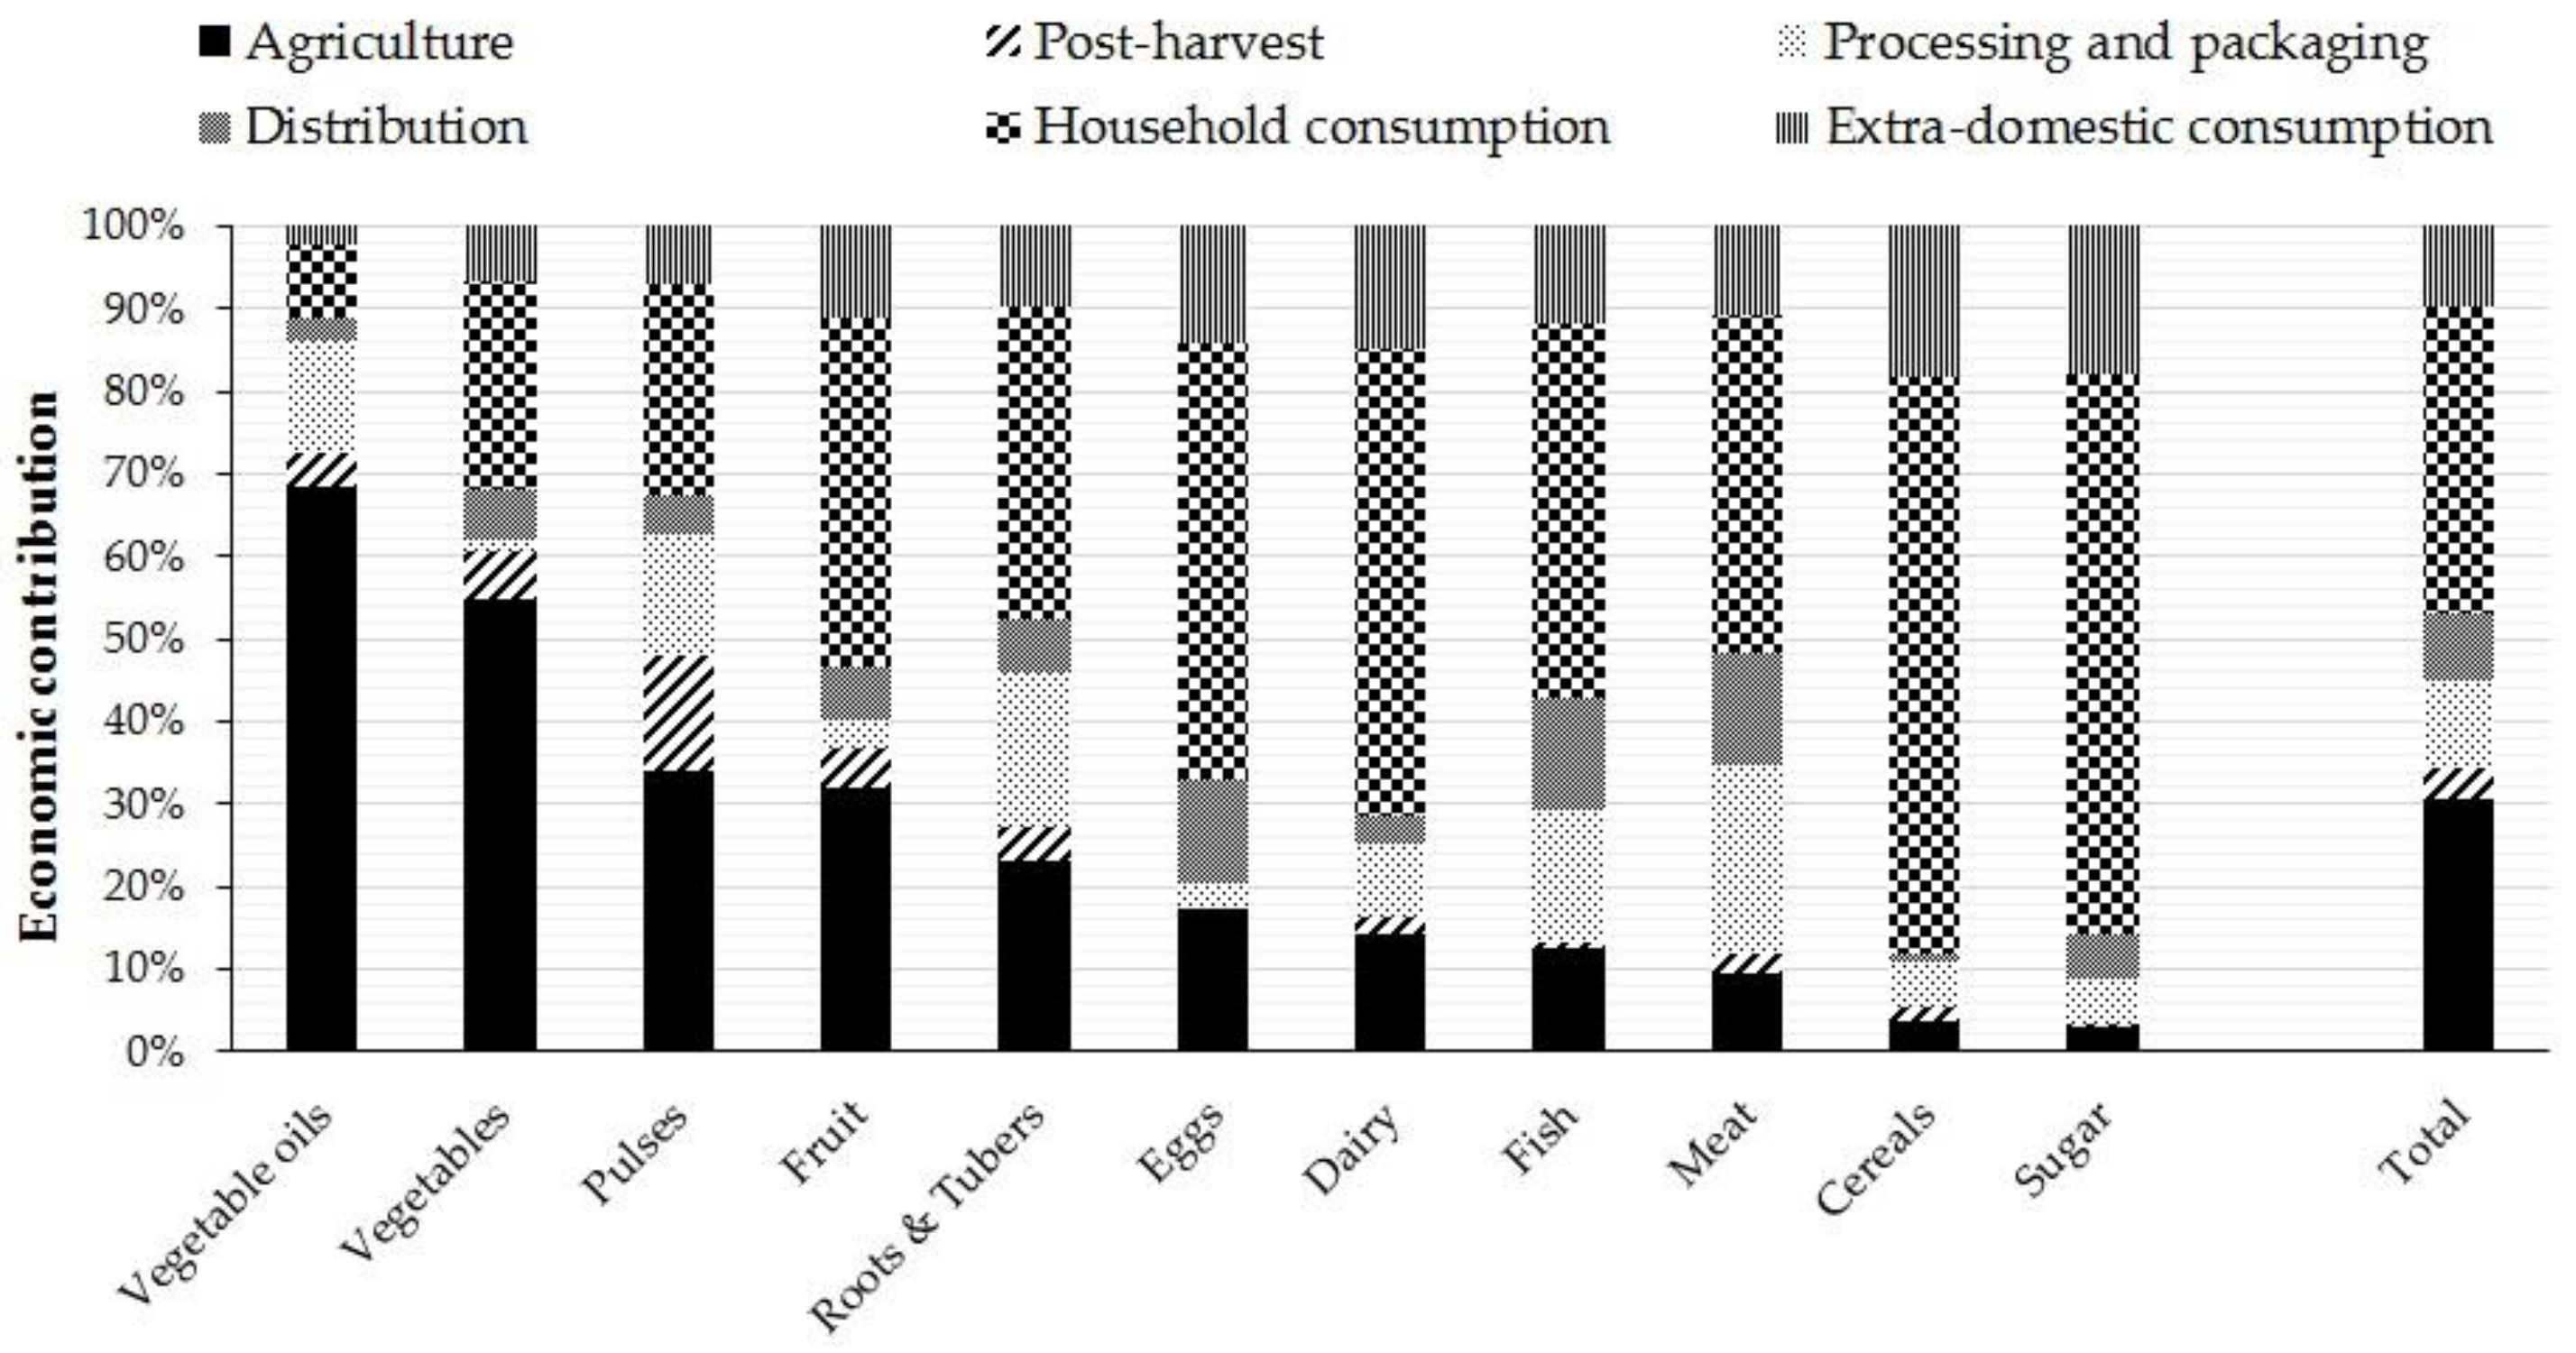
Regarding the economic assessment of the FLW, Figure 4 shows that the consumption stage gained the leading role at the expense of the agricultural stage. As shown on the right bar of the graph, almost 50% of the economic losses were produced at the consumption stage, both household (37%) and extra-domestic services (10%). Cereals (69.7%) and sugar (67.7%) were the food categories with the greatest economic losses. On the contrary, agriculture was the dominant stage for vegetables and vegetable oils, accounting for 68.3% and 54.9% of the costs, respectively. Post-harvest, processing and packaging, and distribution stages contributed 3.6%, 10.6%, and 8.2%, respectively, to the total economic losses, with the highest impact for pulses (14%) in post-harvest and meat (23% and 13.7%) in processing and packaging and distribution stages, respectively. Finally, concerning nutritional FLW, the trend was similar to mass FLW. According to Figure 5, 41% of global FLW corresponded to the agricultural production stage (right bar), with the highest contributions in vegetables oils (75.7%), vegetables (70.5%), and fruits (62.8%). The consumption stage represented 35.7% of the nutritional FLW, reaching household consumption 28% and extra-domestic consumption 7.8%. Cereals (55.4%) and milk and other dairy products (55.2%) were the food categories with a larger nutritional loss in this stage.

3.2. Multi-Objective Simulation Results

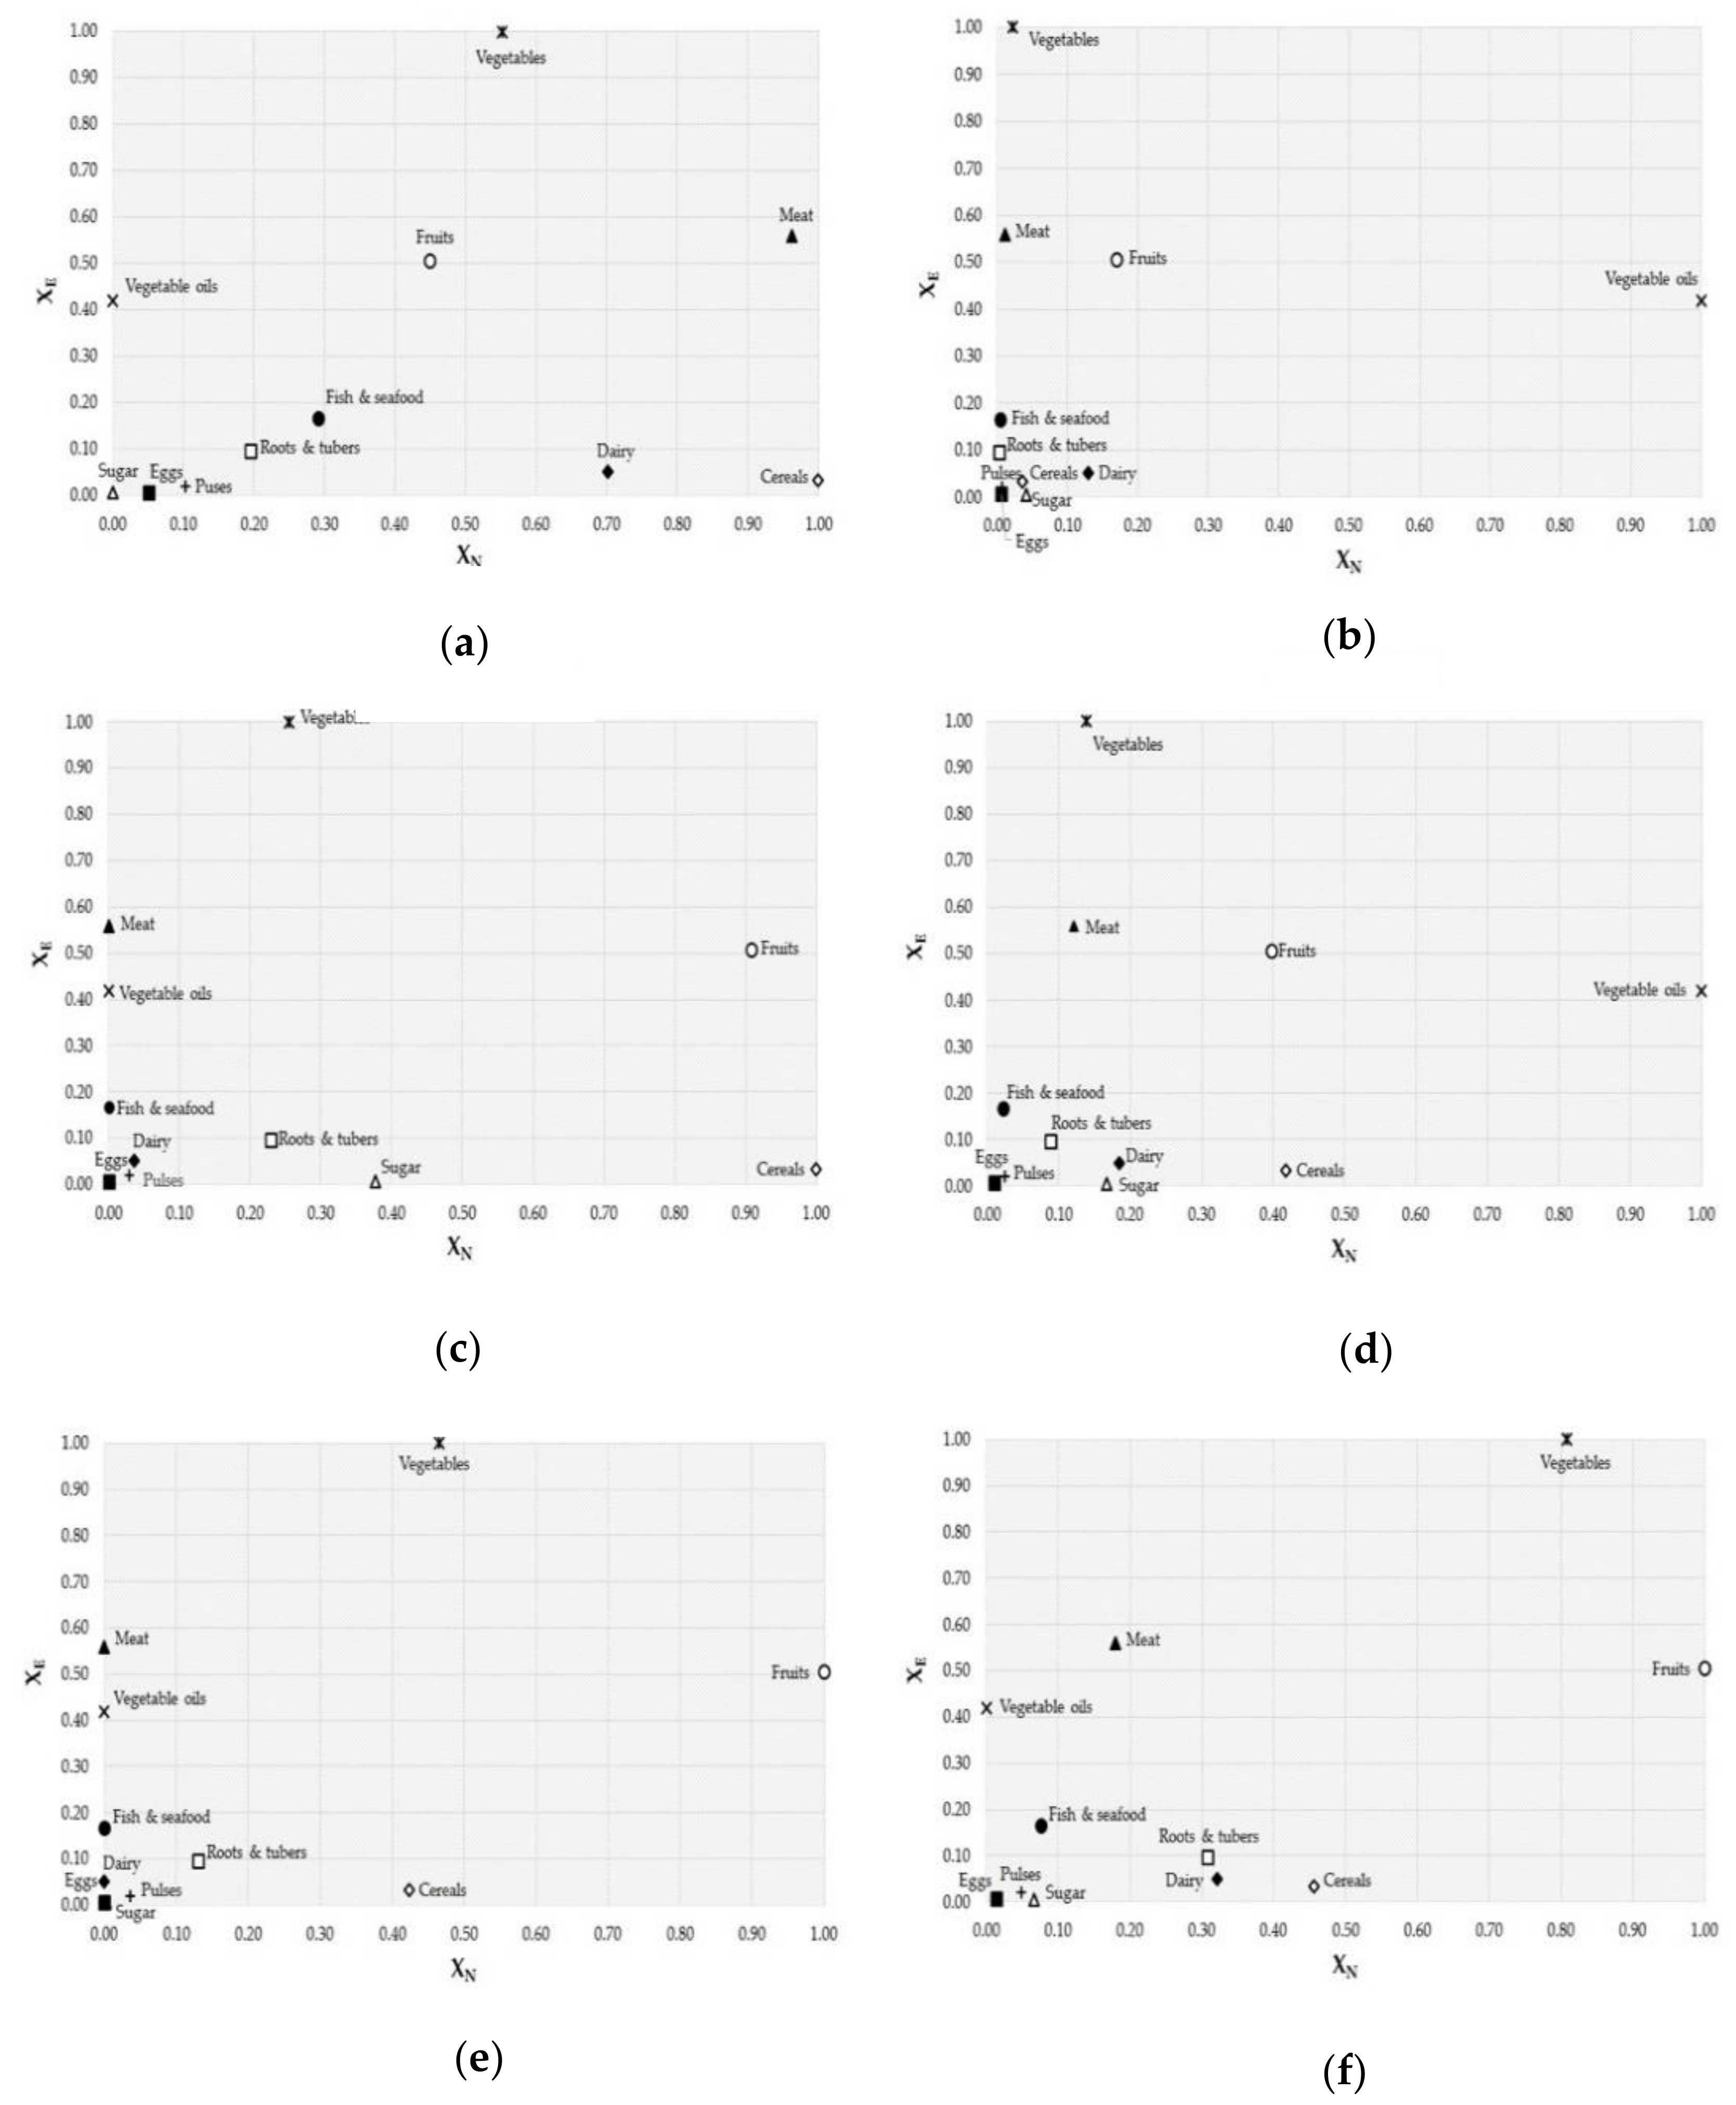
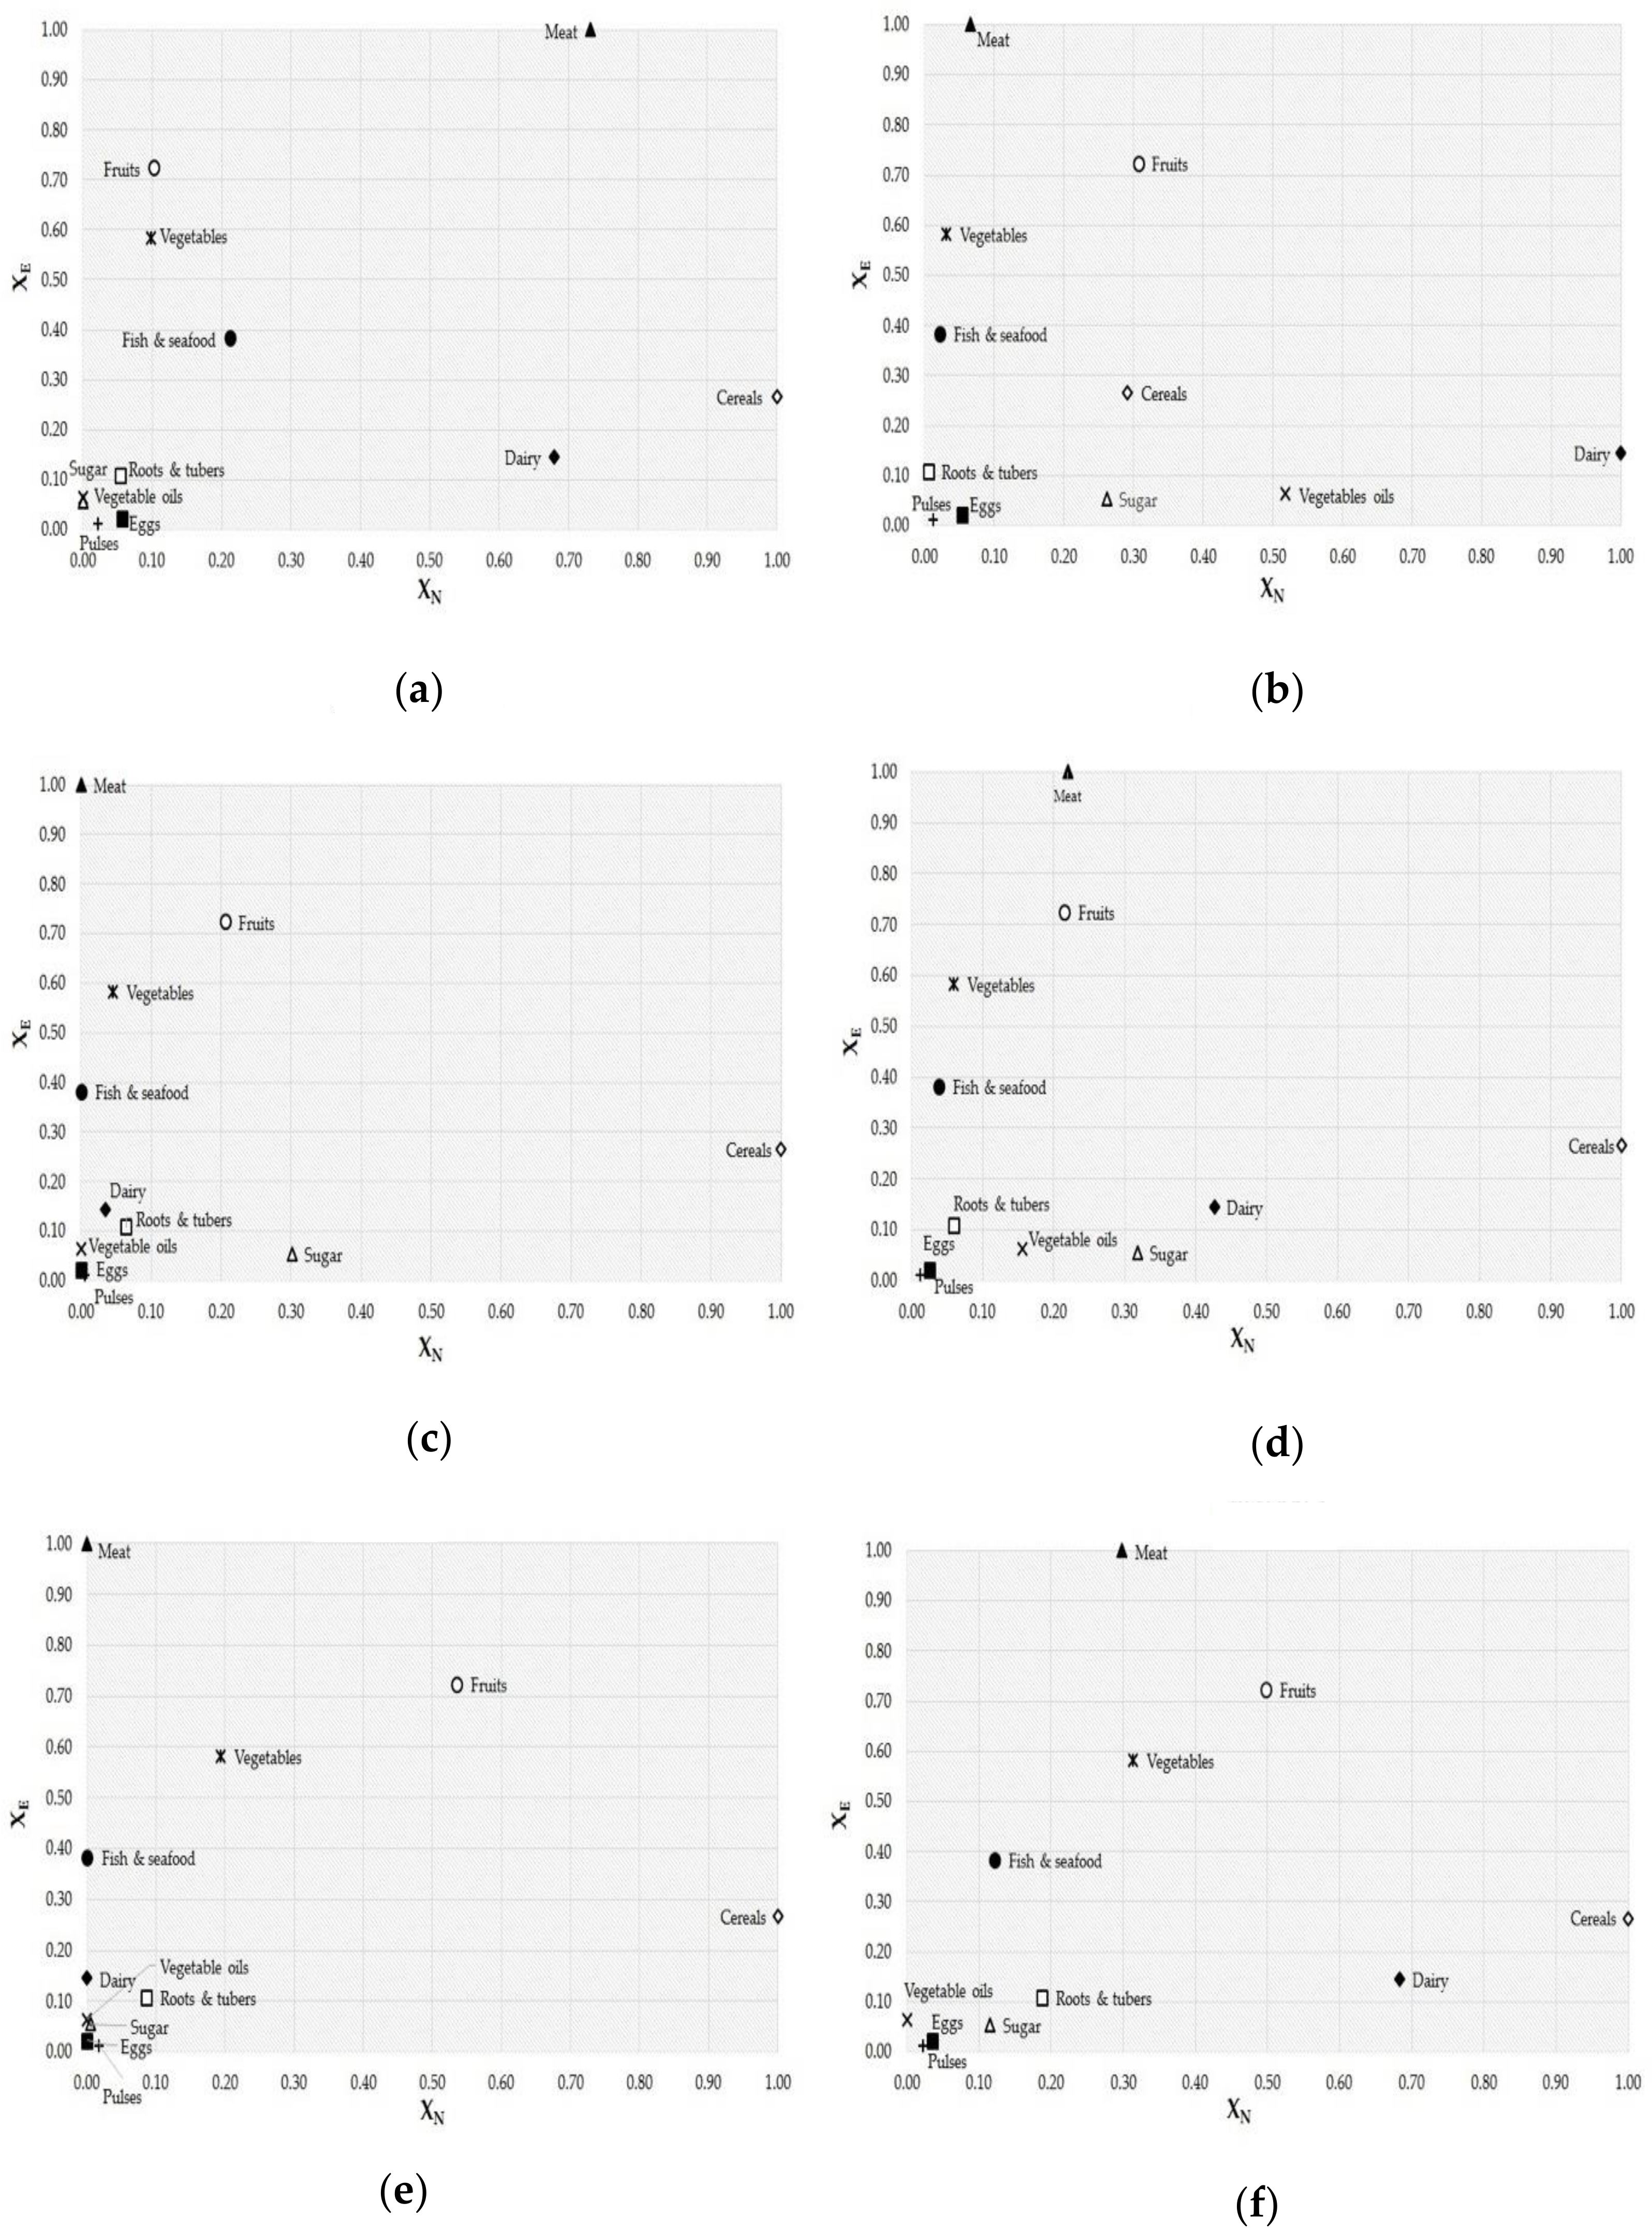
The FLW was analyzed in terms of normalized loss and waste factors (qualitative analysis): XE (normalized economic loss factor per category) and XN (normalized nutritional loss factor per category). Figure 6 and Figure 7 compare the nutritional content for the different food categories with their economic value along the FSC. The former displays the first three stages of the FSC (agricultural production, post-harvest, and processing and packaging), and the latter shows the distribution and consumption stages. Six nutrients were evaluated: proteins, carbohydrates, energy content, fats, fibers, and minerals. To classify the different food categories according to the intensity of nutritional-economic waste, the position where these food categories were found in the graph must be assessed. This way, food categories closer to 0 were more economically-nutritionally efficient, while those closer to 1 were less efficient.
In general terms, Figure 6 denotes that vegetables, fruit, vegetable oils, and meat had the worst XE/XN ratio whereas sugar, eggs, and pulses were the most efficient food categories. A similar trend was followed in the last stages of the FSC (Figure 7). Generally, eggs and pulses got an excellent rating for all nutrients, and meat and vegetables reached the worst XE/XN ratio. It should be highlighted that there was a great XN for cereals, close to 1, for almost all nutrients, which indicated that it was not an efficient food category.
According to these results, the decision-making process is not straightforward, as any food category presented the best XE/XN ratio for all nutrients. This is the reason why determining a single indicator is key for identifying the food categories with the highest FLW along the FSC in economic and nutritional terms.
The Pareto method was used to simplify the decision-making process determining which food categories can be considered Pareto optimal points. According to Limleamthong and Guillen-Gosálbez [48], an S1 solution is a Pareto optimum when there is no other S2 solution that improves in one objective without worsening at least one of the others.
Table 1 details the identification of Pareto optimal values. The blue cross marks the optimum food categories in the first stages of the supply chain (lower losses generated), whereas food with an orange cross represented the distribution and consumption stages with less waste generation. However, Table 1 shows a pairwise analysis that did not allow the real determination of the most efficient food, as not all food categories contain the nutrients in their composition.
For example, in the protein column, sugar was found as Pareto optimum since it is the best positioned product in the graph (in economic and nutritional terms); however, sugar does not contain protein. In the same vein, vegetable oils do not contain minerals and eggs do not contain fiber either. As a result, it is necessary to obtain an index that combines economic and nutritional characteristics in a single value. This is the case of multi-objective optimization based on distances, which calculates the “distances to the target” by food category.
Firstly, with the standardized factors Xe and Xn discussed above (Figure 6 and Figure 7), distances were calculated considering equal weighting factors for economic and nutritional objectives. Equation (8) (Dnorm) was applied to obtain the equivalent distances for each food group, taking into account that Fy(x) are the standard factors Xe and Xn to be optimized, Gy is equal to 0, n is the number of targets to be optimized, and Fpy,j are the weights of each target by food category, in this case 1. Then, the minimum and maximum distances of each food category were calculated. GAMS software was used to work with the non-linear programming (NLP) models using the CONOPT3 solver. In addition, this software was employed to allocate weights to the losses of each food category to define the most extreme performances These minimum and maximum distance values refer to the worst- and best-case of each food category. In this case, the software gives different weighting factors (fpy,j) to the objectives (Xe and Xn) of each food category to maximize or minimize their performance.
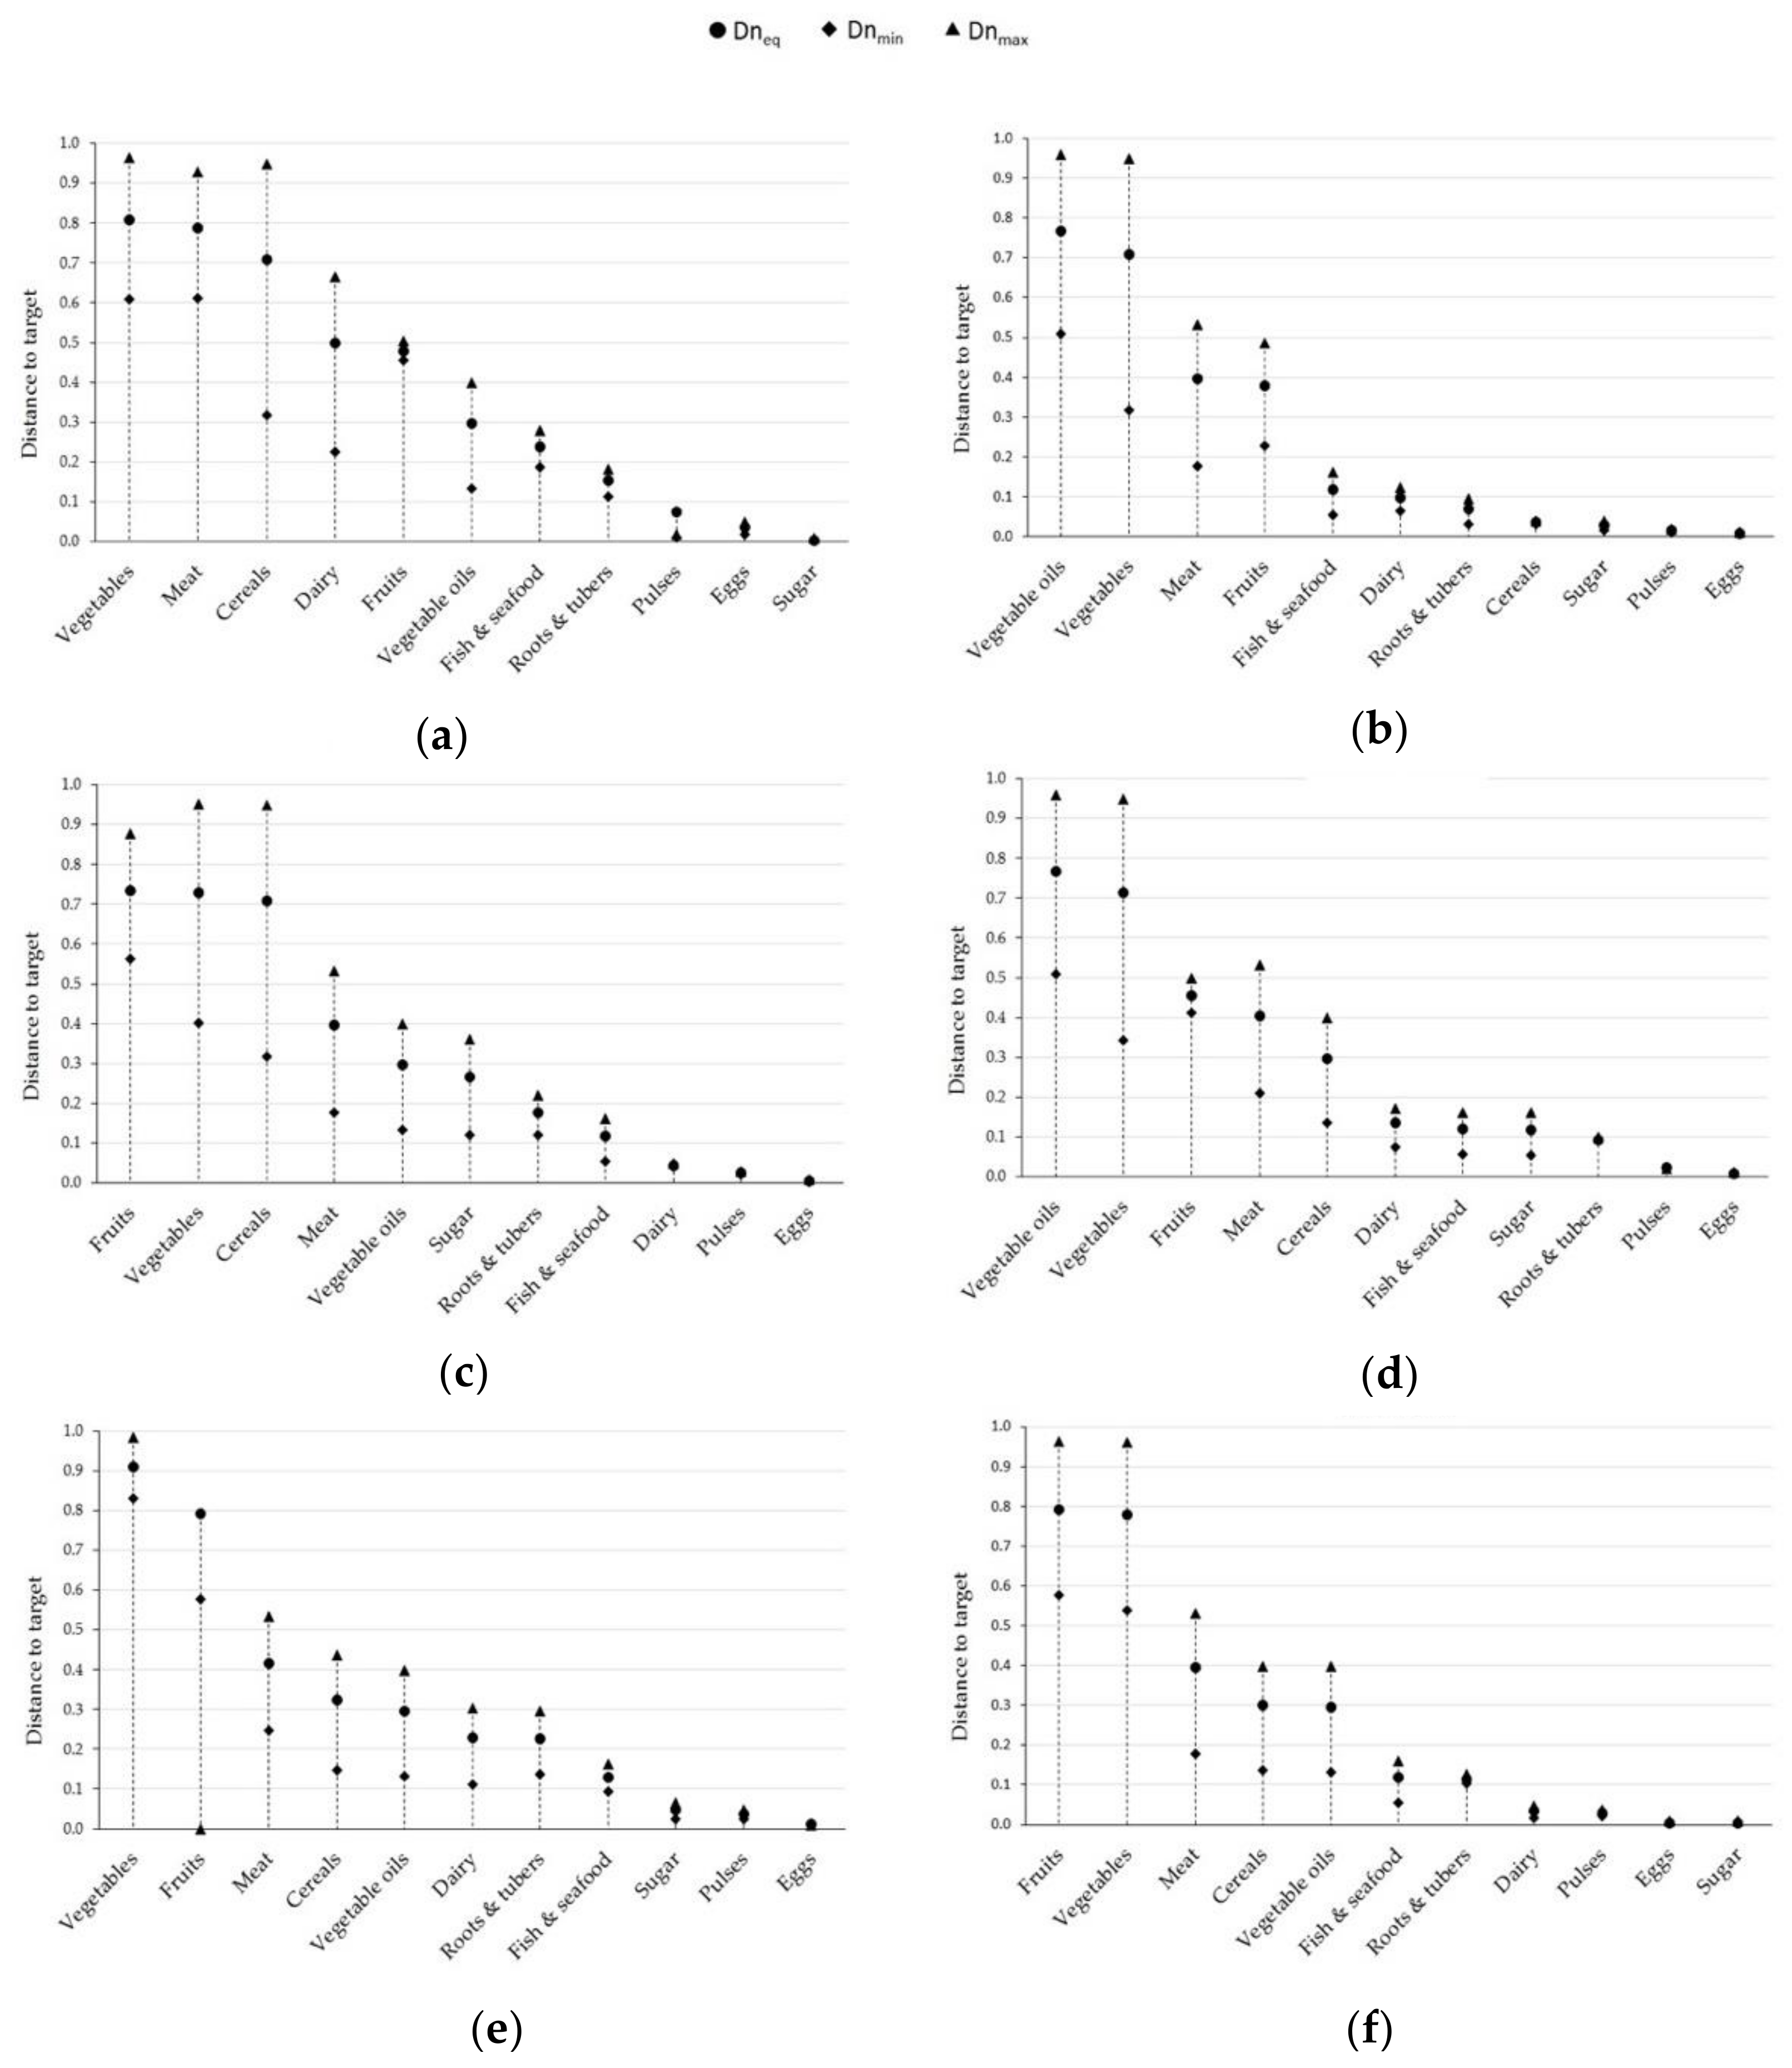
Figure 8 shows the distances obtained in pairs for each nutrient category in the first stages of the FSC, considering the economic and nutritional variables in a single indicator. Food categories appear from largest to smallest distance. Vegetables, vegetable oils, meat, and fruits were the food categories furthest from the desired target for all nutrients assessed. This means their FL along the first stages of the FSC generated the highest economic and nutritional costs. These outcomes follow the same trend of the results in Figure 4 and Figure 5, concluding that these food categories had the highest contribution to the economic and nutritional FL. In addition, these food categories were the closest to 1 in Figure 6. On the other hand, pulses, sugar, and eggs were the most efficient food categories, with a distance to target close to 0 in the first stages of the FSC, following the same trend as in Figure 6.
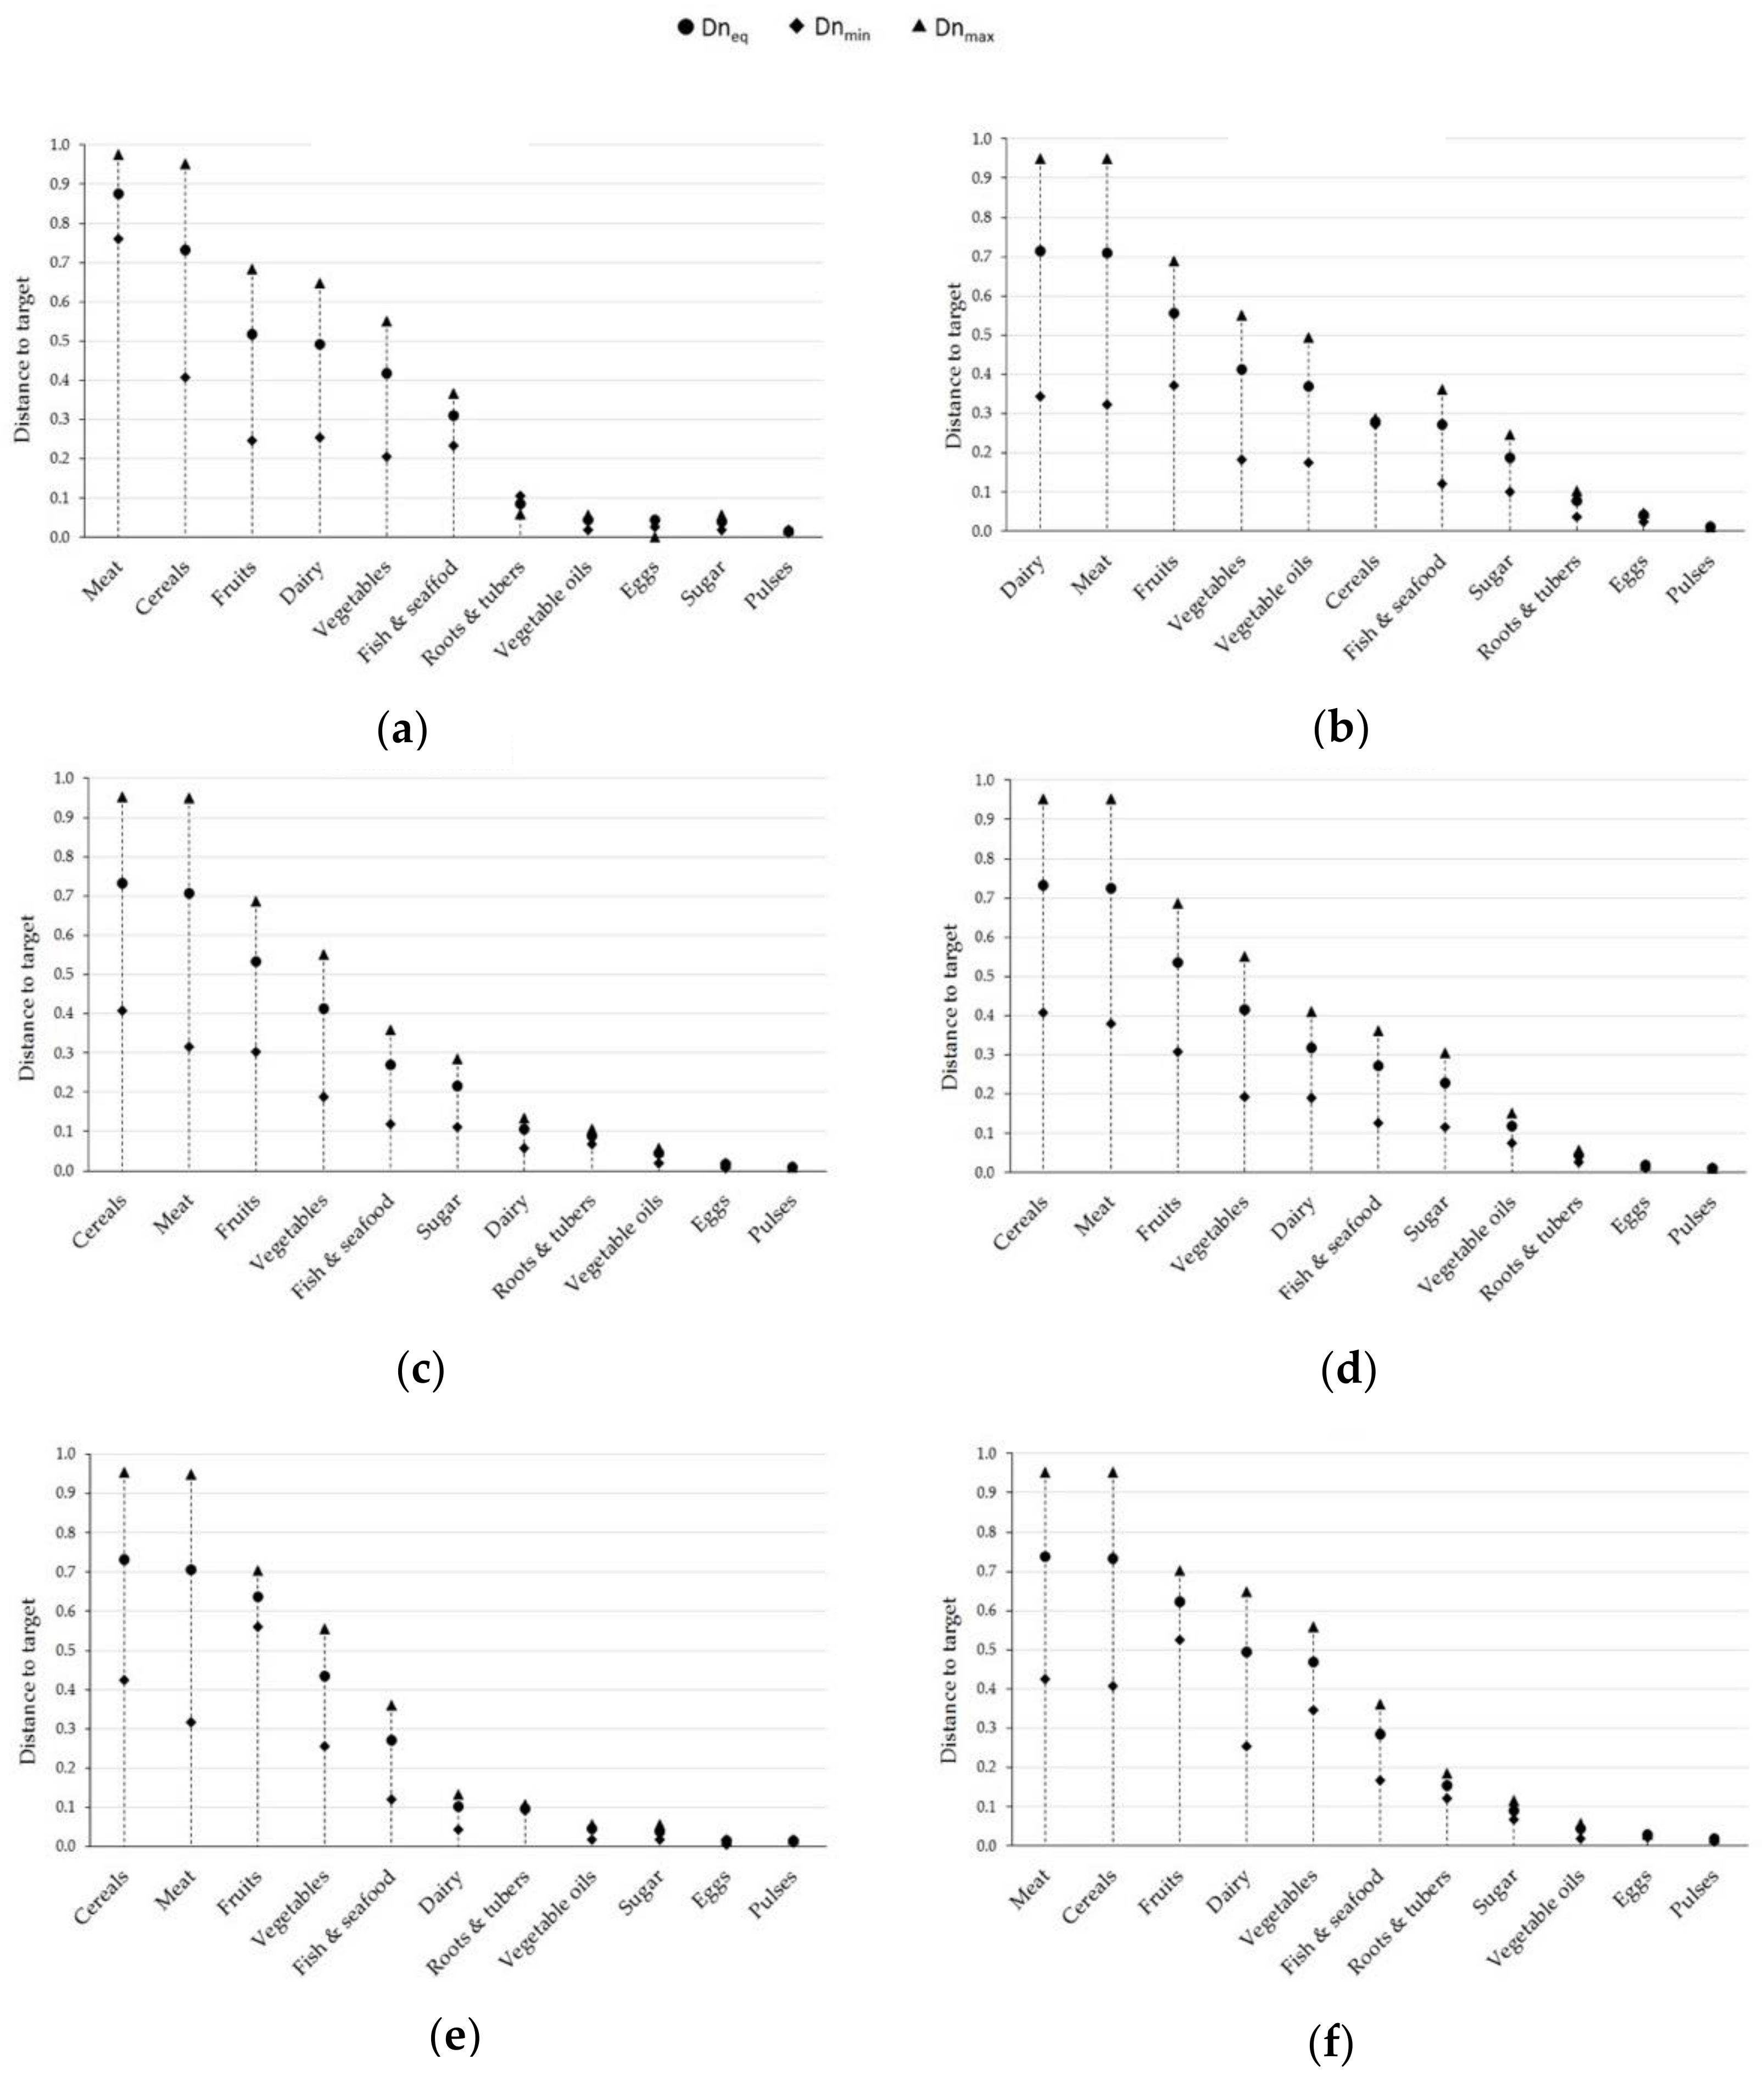
Figure 9 shows the distances obtained in pairs for all nutrients in the distribution and consumption stages of the FSC. In this case, meat, cereals, and fruits were the food categories furthest from the desired target for all nutrients. That is to say, the FW of these food categories had the greatest economic and nutritional impact and, therefore, it is necessary to design new strategies to reduce amount of waste. In contrast, pulses and eggs were the food categories most efficient since their distance to target was the lowest. In these stages of the FSC, vegetables were found in the middle positions of the graph, overtaken by meat, cereals, fruit, and dairy products. These results denoted that many vegetables were lost in the first stages of the FSC; however, its management in the last stages of the FSC was better.
After analyzing the results obtained, it was observed that despite obtaining a single value that combines economic and nutritional characteristics, the optimization by pairs of objectives did not provide enough information to position the food groups according to the impact they generate because nutrients were studied separately. Therefore, it is necessary to obtain global distances for all the nutrients. Equation (8) was again applied, obtaining the equivalent distances by category. In this case, the standardized factors to be optimized were seven: an economic factor and six nutrients factors (proteins, fats, carbohydrates, minerals, fibers, and kcal). The minimum and maximum distances were calculated with the previous GAMS programming by changing the constraints.
Table 2 and Table 3 present the normalized factors (XE and XN) and the equivalent, minimum, and maximum distances obtained for each food category, distinguishing between losses (Table 2) and wastes (Table 3).
The food categories with distances highlighted in red are the ones furthest from the target and thus, the categories with the greatest impact. In contrast, the categories highlighted in green are the food products that had the lowest distance and impact.
In the agricultural production, post-harvest, and processing and packaging stages, fruits (Dn eq. = 0.7), cereals (Dn eq. = 0.61), and vegetables (Dn eq. = 0.57) were the furthest from the distance target (Table 2). In addition, cereals (Dn eq. = 0.86) were also in the worst position in the distribution and consumption stages (Table 3). In these stages, cereals were followed by milk and other dairy products and meat (Dn eq. = 0.49). Therefore, in the whole FSC, vegetables, fruits, and meat, together with cereals, had the highest Dn eq. both for FL and FW, revealing them as the least efficient food categories. These results are in agreement with those of García-Herrero et al. [3], which stated that vegetables, fruits, and meat were the least efficient food categories, and that household consumption was the main factor responsible for FW generation, followed by agricultural production. Vázquez-Rowe et al. [10] concluded that vegetables and fruits were the food categories most affected by the inefficiencies in the FSC under a nutritional perspective, agricultural production and household consumption being the main stages in which the nutritional content of food was lost or wasted. On the contrary, pulses and eggs appeared as the most efficient food categories. These and other studies with similar approaches have been included in Table A4 in Appendix A, reflecting the wide diversity of analyses and results that exist in this field of study.

3.3. Monte Carlo Simulation

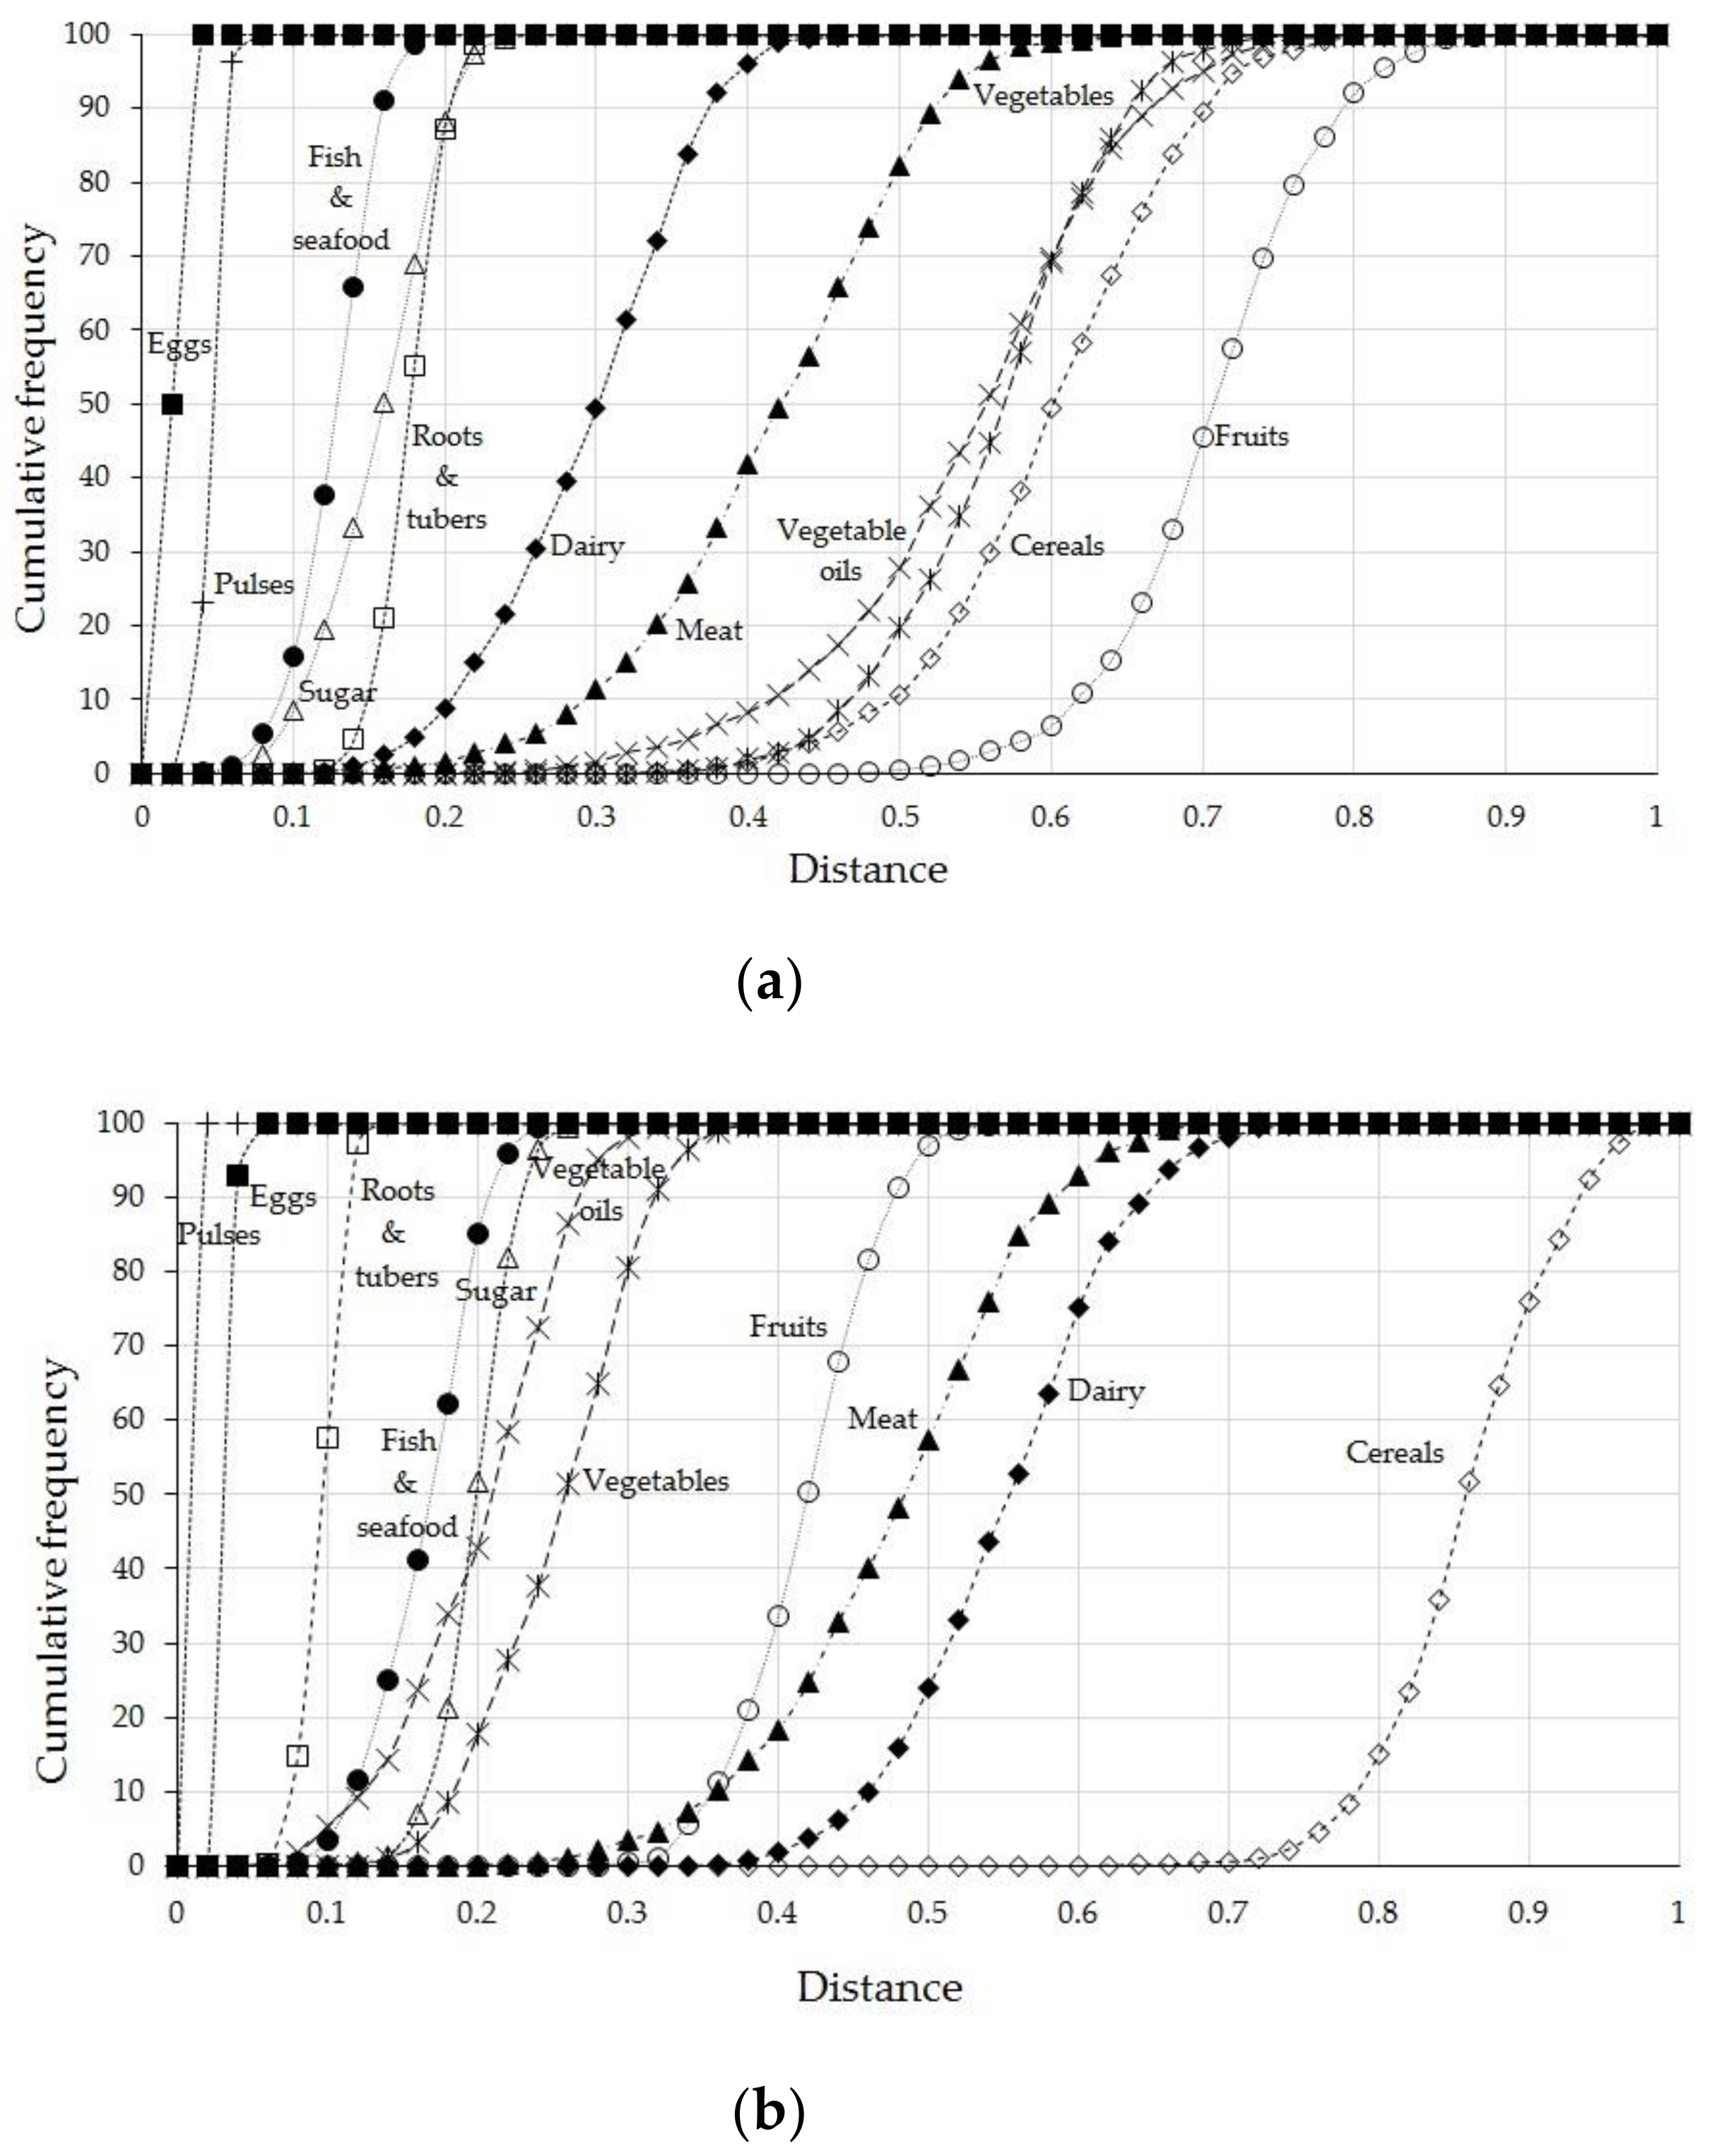
In order to increase the usefulness of this study to promote FLW reduction policies by different actors with specific interests, the applicability of the developed methodology was further analyzed to have a better understanding of the evolution of distances when the weighting factors take different variable values. For this purpose, a Monte Carlo simulation was carried out, based on random values for the different f p y , j values (although the sum of the parameters was always maintained constant). The results obtained are shown in Figure 10. On the one hand, Figure 10a shows the variation (expressed as cumulative frequency) of the distances to the target obtained by food category referring to the first stages of agricultural production, storage, and processing, while, on the other hand, Figure 10b shows the variation of distances focused on the final stages of distribution and consumption.
In Figure 10a, it is observed that practically all the food categories maintain their position from lowest to highest distance from the target compared to the results obtained by applying multi-objective optimization, except in specific cases (such as vegetables and vegetable oils or sugar and roots and tubers). In these cases, the corresponding curves have intersection points and the relative positions of these pairs of categories according to the distance to target vary.
Nevertheless, at the national level taken as case study, the category of fruits is clearly shown as the one furthest from the objective (in 50% of cases its distance is greater than 0.7). In the second position cereals appear, followed by vegetables and vegetable oils. These last two groups are intertwined with each other, since, depending on the weight factors applied, the distance of one is better than that of the other. In 70% of the cases, the distance to the objective of the vegetables is greater, but when the distance exceeded 0.6, the position of the oils worsened. Therefore, there is an urgent need to create specific reduction and management methods for these categories in the first stage of the supply chain. It is worth noting that the categories of eggs and legumes had the least impact (100% of cases present a distance from the target of less than 0.05).
When attention is pointed to the amount of waste generated in the final stages of the supply chain (Figure 10b), the positions of the food categories change. In this context, cereals occupy the worst position by far compared to the rest of the categories, with a distance greater than 0.8 in 50% of the cases. Dairy products are in the second worst position, although with a significantly shorter distance (0.55 in 50% cases) than cereals. The third position is occupied by meat products. Regarding fruits, which had the greatest impact in the early stages of the chain, now they present an intermediate distance curve (practically 100% of cases present a distance less than 0.5). Legumes and eggs are again the food categories that are closest to the target.
It should be noted again that the results obtained refer to the total FLW of food in Spain. Therefore, for the proposed tool to be effective, it must be adjusted by the different stakeholders (institutions and governments at different scales, agricultural producer organizations, logistics companies, food industries, hotel and restaurant chains, consumer associations, etc.), since their respective goals will be very different. This divergent perspective, with specific targets for specific stakeholders, can be adapted to the methodology proposed in this work, which can withstand the definition of particular sustainability targets with appropriate weighting factors without jeopardizing its robustness. Moreover, the methodology applied in this study is particularly interesting, not only because of the environmental criteria along the FSC, but also nutritional aspects, closely related to re-use strategies for human consumption and animal feeds, and the economic dimension allowing the optimization of the food waste management, prioritizing the commercial purpose, and adding value to the products. This methodology could be used to develop a tool for measuring these environmental, nutritional, and economic aspects, which could be integrated in a new eco-label to raise public awareness. This complex tool would follow the tenets of other environmental studies, adding in nutritional and economic indicators. For instance, the free software Calcafé (not open yet) that measures the environmental footprint of coffee (from the extraction to the point of export) helping producers and consumers in the decision-making process [51], or Pescaenverde, an eco-label for the fishing and seafood sectors that uses a life cycle perspective based on the carbon footprint and edible protein energy return on investment [52].
Regarding policy implications, currently, FLW reduction policies are focused on weight reduction targets. In addition, they do not distinguish between food categories or FSC stages, but are focused on the consumption stage. In this sense, the methodology proposed in this work could help policymakers to design strategies not only in terms of weight, but also considering their nutritional and economic impact. Hence, new strategies can be addressed to critical food categories and FSC stages. Moreover, this methodology could serve as a baseline for stakeholders to set individual reduction targets for each food category and FSC stage and develop initiatives to minimize FLW.

4. Conclusions

Currently, FLW management policies are focused on reduction targets at the consumption stage; however, it is imperative to act along the whole FSC. To reduce FLW, the agricultural stage requires the coordination of farmers that follow calendars depending on market demand, and the dissemination of best practices to comply with food security standards.
At the consumption stage, it is necessary to increase awareness and knowledge about FLW generation and its economic, social, and environmental costs. Several measures would contribute to this goal, including launching awareness campaigns, promoting sustainable consumption partners, improving products’ labeling, developing programs for the use of food leftovers, etc. In FLW management, reduce, reuse, recycle, and valorize alternatives have to be prioritized. Starting with the redistribution of food leftovers in food banks, which sensitize populations and improve the food and nutrition security of people in need. Another measure is recycling food by-products, which at the industrial level are used to produce animal feed; however, due to high-water content, some foods require drying and dewatering or mechanic pressing. Regarding FLW valorization, anaerobic digestion recovers two products: energy and an established sludge that can be used as compost. In this regard, this study applied a “distance to target” approach to estimate the nutritional and economic cost of FLW along the Spanish FSC. The proposed methodology facilitates the decision-making process and lays down the foundations to reduce FLW. Results demonstrated that 80% of FLW occurred at agricultural (53.3%) and consumption stages (26.3%). Vegetables, fruits, and cereals were the least efficient foods due to the great amount of FLW. Therefore, it is necessary to design specific strategies depending on the food and FSC stage. Moreover, to mitigate FLW, multiple actors should collaborate to reduce the amount of waste and to recover their nutritional and economic content.

Author Contributions

Conceptualization, R.A. (Rubén Aldaco), R.A. (Ricardo Abejon), and M.M.; methodology, R.A. (Ricardo Abejón), J.L., and A.F.-R.; formal analysis, R.A. (Rebeca Abajas), R.A. (Ricardo Abejón), D.H., A.B., J.C., M.M., R.P., I.R.-S., A.F.-R., C.C., A.Q., F.J.A.-S., M.d.C.O., S.T., and R.A. (Rubén Aldaco); investigation, R.A. (Ricardo Abejón) and A.d.R.; writing—original draft preparation, J.L., R.A. (Ricardo Abejón), A.F.-R., C.C., A.Q., F.J.A.-S., M.d.C.O., and S.T.; writing—review and editing, R.A. (Rubén Aldaco), R.A. (Ricardo Abejón), M.M., and J.C.; supervision, R.A. (Rubén Aldaco), M.M., and J.L.; project administration, R.A. (Rubén Aldaco), R.P., P.F.-i.-P., and M.M.; funding acquisition, P.F.-i.-P., M.M., R.P., and R.A. (Rubén Aldaco) All authors have read and agreed to the published version of the manuscript.

Funding

This research was funded by Spanish Ministry of Science and Competitiveness, grant number CERES-PROCON Project CTM2016-76176 (AEI/FEDER, UE) and KAIROS-BIOCIR Project PID2019-104925RB (AEO/FEDER, UE).

Institutional Review Board Statement

Not applicable.

Informed Consent Statement

Not applicable.

Data Availability Statement

The data presented in this study are available on request from the corresponding author.

Acknowledgments

The authors are grateful for the funding of the Spanish Ministry of Science and Competitiveness through the CERES-PROCON Project CTM2016-76176 (AEI/FEDER, UE) and the KAIROS-BIOCIR Project PID2019-104925RB (AEO/FEDER, UE). Jara Laso thanks the University of Cantabria for its financial support via the postdoctoral grant “Augusto Gonzalez Linares”. Daniel Hoehn thanks the Ministry of Economy and Competitiveness of Spanish Government for their financial support via the research fellowship BES-2017-080296. Jorge Cristóbal acknowledges financial support from the Spanish Ministry of Science, Innovation and Universities through the “Beatriz Galindo” grant BEAGAL18/00035.

Conflicts of Interest

The authors declare no conflict of interest. The authors are responsible for the choice and presentation of information contained in this paper as well as for the opinions expressed therein, which are not necessarily those of UNESCO and do not commit this Organization.

Appendix A

Table A1. Percentage (%) of loss of each food category by stage [11,53].
CategoryAgriculturePost-HarvestProcessing and PackagingDistributionConsumption
MillingProcessingFreshProcessingFreshProcessing
Cereals4.620.510222525
Roots and tubers2.671515731712
Sugar205221021915
Oils26.22.19551144
Vegetables27.64221021915
Fruit20.74221021915
Pulses4.62551144
Meat3.10.76.36.3441111
Fish and seafood9.40.566951110
Milk3.50.51.21.20.50.577
Eggs400.50.52288
Table A2. Nutritional composition of each food category (per 100 grams).
Proteins (%)Fats (%)Carbohydrates (%)Fiber (%)Minerals (%)Energy (kcal)
Cereals13.003.5768.468.720.91363
Roots and tubers1.850.1911.481.960.4556
Sugar0.0012.1478.140.160.40439
Oils0.0099.970.000.000.00888
Vegetables1.120.342.741.500.2519
Fruit0.902.569.603.180.3170
Pulses20.9011.7331.7111.331.53326
Meat19.941.700.000.000.57167
Fish and seafood 17.961.700.220.000.7289
Milk12.0316.683.300.000.85211
Eggs12.5011.100.000.000.54150
Table A3. Percentage (%) of loss of each food category by stage [11,53].
Food CategoryOriginWholesale MarketConsumption
Cereals0.170.171.03
Roots and tubers0.310.481.20
Sugar0.040.370.81
Oils2.092.953.82
Vegetables0.791.192.09
Fruit0.381.051.95
Pulses1.572.013.46
Meat3.235.768.29
Fish and seafood3.364.9011.27
Milk0.290.510.73
Eggs (dozen)0.631.031.44
Table A4. State of the art of similar studies and working conditions.
StudyYearAssessmentGoalScopeMain Results
Quested and Johnson [39]2009CO2 eq./t wasteHousehold food and drink waste.United Kingdom4.5 t CO2 eq./t waste.
Hall et al. [36]2009Nutritional loss and freshwater consumption of food waste.Energy content of nationwide food waste.United StatesFood waste generation: more than 1400 kcal per person per day, more than one quarter of the total freshwater consumption and 300 million barrels of oil per year.
Cuéllar & Webber [54]2010Embodied energy loss (EEL).Sustainability of meat based and plant-based diets.United StatesHighest EEL of food waste: dairy products and vegetables.
Gustavsson et al. [7]2011Weight of food losses and waste.Differences between countries.GlobalDirect relation between higher amounts of food waste and the industrialization level of the country.
Berners-Lee et al. [55]2012Greenhouse gas (GHG) emissions.Impacts of realistic dietary choices.Supermarket chain—northwest of EnglandHighest GHG emissions of food waste: fresh fruit, vegetables, and salads.
Kummu et al. [33]2012Weight of food losses and waste and its nutritional energy loss.Food supply losses and the resources used to produce them.GlobalAround one quarter of the produced food supply (614 kcal/capita/day) is lost (enough food for one billion extra people).
Rutten [41]2013Economic loss.Comparison of different countries.GlobalFood losses and waste in industrialized and developing countries: US$ 680 and US$ 310 billion.
Vázquez-Rowe et al. [56]2014Edible protein energy return on investment (ep-EROI).Ratio between energy inputs and energy provided.Seafood products in Galicia (Spain)Highest ep-EROI: Small pelagic species.
Vittuari et al. [57]2016EEL.Assessment of the food supply chain.ItalyHighest EEL of food waste: meat, milk and fish.
Spiker et al. [35]2017Nutritional loss.Nutrient loss and comparison to gaps in dietary intake.Retail and consumer levels in the United StatesFood wasted: 1217 kcal, 33 g protein, 5.9 g dietary fiber, 1.7 μg vitamin D, 286 mg calcium, and 880 mg potassium per capita per day.
Eriksson and Spångberg [58]2017Carbon footprint and energy use.Impacts of different food waste management options.Fresh fruit and vegetables from supermarkets in Växjö (Sweden)Reduction in GHG emissions and primary energy use by changes to more favorable options in the waste hierarchy.
García-Herrero et al. [3]2018Weight of food losses and waste and its nutritional and economic loss.Development of the nutritional food losses footprint index. SpainLowest efficiency: vegetables, fruits and meat.
Main FW generation: consumption and agricultural production stages.
Abbade [37]2018Nutritional loss.Rate of loss for the main food groups in the world.GlobalThe rate of loss remains constant or slightly growing. The amount of food losses would be enough to feed 940 million adult individuals.
Scherhaufer et al. [38]2018Environmental impacts of food waste.CO2 eq./t waste.Europe1.9 t CO2 eq./t waste.
Laso et al. [44]2018Energetic and environmentally efficiency.Assessment of the efficiency of agri-food system.SpainAn average energy saving of approximately 70% is estimated in order to be efficient.
García-Herrero et al. [9]2019Nutritional and economic food losses and waste.Development of a nutritional cost footprint indicator combining nutritional and economic variables.SpainHighest nutritional and economic food waste: agricultural production and fruits and vegetables.
Hoehn et al. [59]2019EEL and food energy loss.Energy return on investment—circular economy index.SpainHighest energy loss: cereals, meat, fish and seafood and vegetables. Lowest energy loss: vegetarian diet.
Vázquez-Rowe et al. [10]2019Nutritional cost footprint.Assessment of the nutritional and economic efficiency of food loss and waste.SpainLess efficiency: vegetables and fruits
Main FW generation: agricultural production and consumption.
Aldaco et al. [43]2020Climate, economic, and nutritional impacts assessment.Impacts of food loss and waste.COVID-19 outbreak in SpainHighest loss rates: fruits and vegetables. Highest nutritional loss: animal fats, snacks, pastries, and sweets. Highest economic loss: red meat, cereals, fruits, and vegetables. Highest GHG emissions: red meat.
Chen et al. [60]2020Nutritional and environmental losses.Nutritional and environmental footprint in food waste.151 countriesHighest mass loss: vegetables, cereals, and fruits. Highest nutritional loss: cereals, fruits, vegetables, and meat. Highest environmental impacts: cereals, fruits, and vegetables.
Wohner et al. [61]2020Environmental and economic assessment.Impacts of food-packaging systems with a focus on food waste.AustriaHigher food waste resulted in higher environmental impacts but also higher value added to the economy.

References

  1. Esposito, B.; Sessa, M.R.; Sica, D.; Malandrino, O. Towards Circular Economy in the Agri-Food Sector. A Systematic Literature Review. Sustainability 2020, 12, 7401. [Google Scholar] [CrossRef]
  2. Bahadur, K.; Haque, I.; Legwegoh, A.; Fraser, E. Strategies to Reduce Food Loss in the Global South. Sustainability 2016, 8, 595. [Google Scholar] [CrossRef] [Green Version]
  3. García-Herrero, I.; Hoehn, D.; Margallo, M.; Laso, J.; Bala, A.; Batlle-Baver, L.; Fullana, P.; Vazquez-Rowe, I.; González, M.J.; Sarabia, C.; et al. On the estimation of potential food waste reduction to support sustainability. Food Policy 2018, 80, 24–38. [Google Scholar] [CrossRef]
  4. Parfitt, J.; Barthel, M.; Macnaughton, S. Food waste within food supply chains: Quantification and potential for change to 2050. Philos. Trans. R. Soc. Lond. B Biol. Sci. 2010, 365, 3065–3081. [Google Scholar] [CrossRef] [PubMed] [Green Version]
  5. Chauhan, Y. Food waste Management with Technological Platforms: Evidence from Indian Food Supply Chains. Sustainability 2020, 12, 8162. [Google Scholar] [CrossRef]
  6. FAO. Global Food Losses and Wastes—Scope, Causes and Prevention; FAO: Rome, Italy, 2012; ISBN 978-92-5-307205-7. [Google Scholar]
  7. Gustavsson, J.; Cederberg, C.; Sonesson, U.; Emanuelsson, A. The Methodology of the FAO Study: “Global Food Losses and Food Waste Exent, Causes and Prevention”-FAO 2011; FAO: Rome, Italy, 2013; p. 857. ISSN 0436-2071. [Google Scholar]
  8. FAO. The State of Food Security and Nutrition in the World. Report. 2019. Available online: https://reliefweb.int/sites/reliefweb.int/files/resources/ca5162es.pdf (accessed on 19 October 2020).
  9. García-Herrero, I.; Margallo, M.; Laso, J.; Batlle-Bayer, L.; Bala, A.; Fullana, P.; Vazquez-Rowe, I.; González, M.J.; Amo, F.; Durá, M.J.; et al. Nutritional data management of food losses and waste under a life cycle approach: The case study of the Spanish agri-food system. J. Food Compos. Anal. 2019, 82, 103223. [Google Scholar] [CrossRef]
  10. Vázquez-Rowe, I.; Laso, J.; Margallo, M.; García, I.; Hoehn, D.; Amo-Setién, F.; Bala, A.; Abajas, R.; Sarabia, C.; Durá, M.J.; et al. Food loss and waste metrics: A proposed nutritional cost footprint linking linear programming and life cycle assessment. Int. J. Life Cycle Assess. 2019, 25, 1197–1209. [Google Scholar] [CrossRef]
  11. FAO. Food Losses and Wastage in the Context of Sustainable Food Systems. Report of the High-Level Panel of Experts on Food Security and Nutrition. 2014. Available online: http://www.fao.org/3/a-i3901s.pdf (accessed on 19 October 2020).
  12. FAO. Food Wastage Footprint. Impacts on Natural Resources. Summary Report. 2013. Available online: http://www.fao.org/3/i3347e/i3347e.pdf (accessed on 20 October 2020).
  13. FAO. Toolkit: Reducing the Food Wastage Footprint. Report. 2013. Available online: http://www.fao.org/3/i3342e/i3342e.pdf (accessed on 19 October 2020).
  14. FUSIONS. Recommendations and Guidelines for a Common European Food Waste Policy Framework. Report. 2016. Available online: https://www.eu-fusions.org/phocadownload/Publications/D3.5%20recommendations%20and%20guidelines%20food%20waste%20policy%20FINAL.pdf (accessed on 20 October 2020).
  15. Zorpas, A.A.; Lasaridi, K. Measuring waste prevention. Waste Manag. 2013, 33, 1047–1056. [Google Scholar] [CrossRef]
  16. Lasaridi, K.; Chroni, C.; Zorpas, A.A.; Abeliotis, K. Waste Prevention. Sustain. Solid Waste Manag. 2016, 53–93. [Google Scholar] [CrossRef]
  17. Zorpas, A.A.; Lasaridi, K.; Pociovalisteanu, D.M.; Loizia, P. Monitoring and evaluation of prevention activities regarding household organics waste from insular communities. J. Clean. Prod. 2018, 172, 3567–3577. [Google Scholar] [CrossRef]
  18. Zorpas, A.A. Strategy development in the framework of waste management. Sci. Total Environ. 2020, 137088. [Google Scholar] [CrossRef] [PubMed]
  19. European Parliament. Report on How to Avoid Food Wastage: Strategies for a More Efficient Food Chain in the EU. Report. 2011. Available online: https://www.europarl.europa.eu/sides/getDoc.do?pubRef=-//EP//NONSGML+REPORT+A7-2011-0430+0+DOC+PDF+V0//EN (accessed on 27 October 2020).
  20. European Commission. Regions Closing the Circle: An EU Action Plan for the Circular Economy. Report from the Commission to the European Parliament, the Council, the European Economic and Social Committee and the Committee. 2015. Available online: https://data.consilium.europa.eu/doc/document/ST-14972-2015-INIT/es/pdf (accessed on 20 October 2020).
  21. European Commission. EU Platform on Food Losses and Food Waste. Report from the European Commission. 2020. Available online: https://ec.europa.eu/food/safety/food_waste/eu_actions/eu-platform_en#:~:text=The%20EU%20and%20the%20EU,food%20production%20and%20supply%20chains (accessed on 23 October 2020).
  22. FUSIONS. Estimates of European Food Waste Levels. Report. 2016. Available online: http://www.eu-fusions.org/phocadownload/Publications/Estimates%20of%20European%20food%20waste%20levels.pdf (accessed on 20 October 2020).
  23. REFRESH. Resource Efficient Food and Drink for the Entire Supply Chain. Report from European Union. 2015. Available online: https://eu-refresh.org/comienza-el-nuevo-proyecto-de-la-ue-para-reducir-el-desperdicio-alimentario-en-toda-europa (accessed on 21 October 2020).
  24. European Commission. Preparatory Study on Food Waste across EU 27. Technical Report from the European Commission. 2011. Available online: https://ec.europa.eu/environment/eussd/pdf/bio_foodwaste_report.pdf (accessed on 20 October 2020).
  25. Mapama. Desperdicio Alimentario en los Hogares Españoles. Available online: https://www.mapa.gob.es/es/prensa/200922informedesperdicioalimentario_tcm30-543937.pdf (accessed on 3 December 2020).
  26. Mena, C.; Adenso-Diaz, B.; Yurrt, O. The causes of food waste in the supplier-retailer interface: Evidences from the UK and Spain. Resour. Conserv. Recycl. 2020, 55, 648–658. [Google Scholar] [CrossRef]
  27. AECOC. Manufacturers and Distributors Association. Food Is Not Wasted. 2012. Available online: https://www.alimentacionsindesperdicio.com/ (accessed on 20 October 2020).
  28. Mapama. “More Food, Less Waste” strategy. In Programme for the Reduction of Food Losses and Waste and the Evaluation of Discarded Food; Report from the Ministry of Agriculture, Food and Environment; Ministry of Agriculture, Food and Environment: Madrid, Spain, 2013. Available online: http://www.besana.es/sites/default/files/estrategia_mas_alimento.pdf (accessed on 23 October 2020).
  29. Mapama. Las pérdidas y el Desperdicio Alimentario Generado por la Producción Agrícola en España. Resumen Ejecutivo. Ministerio de Agricultura, Pesca y Alimentación, 2014. Available online: https://menosdesperdicio.es/sites/default/files/documentos/relacionados/resumen_perdidas_desperdicioagricolas_2014.pdf (accessed on 26 October 2020).
  30. BOE. Law 8/2019. Waste and Contaminated Soil of the Balearic Islands; Consolidated Legislation; Government of Spain: Madrid, Spain, 2019.
  31. Xunta. Draft Bill of the Law of Waste and Contaminated Soils of Galicia. Explanation of Reasons. 2020. Available online: https://ficheiros-web.xunta.gal/transparencia/normativa-tramitacion/cmatv/CMATV_anteproxecto_lei_residuos_soloscontam_2019_cas.pdf (accessed on 20 October 2020).
  32. BOE. Law 3/2020. 11th of March on the Prevention of Food Losses and Wastage. Off. J. General. Catalunya 2020. [Google Scholar]
  33. Kummu, M.; de Moel, H.; Porkka, M.; Siebert, S.; Varis, O.; Ward, P.J. Lost food, wasted resources: Global food supply chain losses and their impacts on freshwater, cropland, and fertiliser use. Sci. Total Environ. 2012, 438, 477–489. [Google Scholar] [CrossRef] [PubMed]
  34. Buzby, J.C.; Wells, H.F.; Hyman, J. The estimated amount, value, and calories of postharvest food losses at the retail and consumer levels in the United States. In Food Loss in the United States: Selected Analyses; Report for United States Department of Agriculture; United States Department of Agriculture: Washington, DC, USA, 2014. Available online: https://www.ers.usda.gov/webdocs/publications/43833/43680_eib121.pdf?v=2822.4 (accessed on 27 October 2020).
  35. Spiker, M.L.; Hiza, H.A.B.; Siddiqi, S.M.; Neff, R.A. Wasted Food, Wasted Nutrients: Nutrient Loss from Wasted Food in the United States and Comparison to Gaps in Dietary Intake. J. Acad. Nutr. 2017, 117, 1031–1040. [Google Scholar] [CrossRef] [Green Version]
  36. Hall, K.D.; Guo, J.; Dore, M.; Chow, C.C. The progressive increase of food waste in America and its environmental impact. PLoS ONE 2009, 4, e7940. [Google Scholar] [CrossRef] [PubMed] [Green Version]
  37. Abbade, E.B. Estimating the nutritional loss and the feeding potential derived from food losses worldwide. World Dev. 2018, 134, 105038. [Google Scholar] [CrossRef]
  38. Scherhaufer, S.; Moates, G.; Hartikainen, H.; Waldron, K.; Obersteiner, G. Environmental impacts of food waste in Europe. Waste Manag. 2018, 77, 98–113. [Google Scholar] [CrossRef]
  39. Quested, T.; Johnson, H. Household Food and Drink Waste in the UK. Report from WRAP (Material Change for a Better Environment). 2009. Available online: https://www.wrap.org.uk/sites/files/wrap/Household_food_and_drink_waste_in_the_UK_-_report.pdf (accessed on 20 October 2020).
  40. Gruber, L.M.; Brandstetter, C.P.; Bos, U.; Lindner, J.P.; Albrech, S. LCA study of unconsumed food and the influence of consumer behavior. Int. J. Life Cycle Assess. 2015, 21, 773–784. [Google Scholar] [CrossRef]
  41. Rutten, M.M. What economic theory tells us about the impacts of reducing food losses and/or waste: Implications for research, policy, and practice. Agric. Food Secur. 2013, 2, 13. [Google Scholar] [CrossRef] [Green Version]
  42. Stenmarck, A.; Jensen, C.; Quested, T.; Moates, G.; Buksti, M.; Cseh, B.; Juul, S.; Parry, A.; Politano, A.; Redlingshofer, B.; et al. Estimates of European Food Waste Levels. Report from EU Fusions. 2016. Available online: https://research.wur.nl/en/publications/estimates-of-european-food-waste-levels (accessed on 28 October 2020).
  43. Aldaco, R.; Hoehn, D.; Laso, J.; Margallo, M.; Ruiz-Salmón, J.; Cristobal, J.; Kahhat, R.; Villanueva-Rey, P.; Bala, A.; Batlle-Bayer, L.; et al. Food waste management during the COVID-19 outbreak: A holistic climate, economic and nutritional approach. Sci. Total Environ. 2020, 742, 140524. [Google Scholar] [CrossRef] [PubMed]
  44. Laso, J.; Hoehn, D.; Margallo, M.; García-Herrero, I.; Batlle-Bayer, L.; Bala, A.; Fullana-i-Palmer, P.; Vázquez-Rowe, I.; Irabien, A.; Aldaco, R. Assessing Energy and Environmental Efficiency of the Spanish Agri-Food System Using the LCA/DEA Methodology. Energies 2018, 11, 3395. [Google Scholar] [CrossRef] [Green Version]
  45. FAO. FAO Food Balance Sheets: A Handbook; Report; Food and Agriculture Organization of the United Nations: Rome, Italy, 2001; Available online: http://www.fao.org/3/a-x9892e.pdf (accessed on 20 October 2020).
  46. Bedca. Base de Datos Española de Composición de Alimentos. 2007. Available online: http://www.bedca.net/bdpub/index.php (accessed on 20 October 2020).
  47. Abejón, R.; Vazquez-Rowe, I.; Bala, A.; Fullana, P.; Margallo, M.; Aldaco, R. Application of the “Distance to target” Approach to the Multiobjective Optimization of nutritional and economic costs due to food loss and waste. Comput. Aided Chem. Eng. 2020, 48, 24–27. [Google Scholar] [CrossRef]
  48. Limleamthong, P.; Guillen-Gosálbez, G. Rigorous analysis of Pareto fronts in sustainability studies based on bilevel optimization: Application to the redesign of the UK electricity mix. J. Clean. Prod. 2017, 164, 1602–1613. [Google Scholar] [CrossRef]
  49. Fichthorn, K.A.; Weinberg, W.H. Theoretical foundations of dynamical Monte Carlo simulations. J. Chem. Phys. 1991, 95, 1090–1096. [Google Scholar] [CrossRef] [Green Version]
  50. GAMS. GAMS Development Corporation: General Algebraic Modeling System. 2017. Available online: https://www.gams.com/ (accessed on 23 October 2020).
  51. RPCV. Red Peruana de Ciclo de Vida y Ecología Industrial. Calculadora para la Huella Ambiental del Café Peruano. Available online: https://red.pucp.edu.pe/ciclodevida/proyecto/calculadora-la-huella-ambiental-del-cafe-peruano/ (accessed on 2 January 2020).
  52. Vázquez-Rowe, I.; Villanueva-Rey, P.; Moreira, M.T.; Feijoo, G. Opportunities and challenges of implementing life cycle assessment in seafood certification: A case study for Spain. Int. J. Life Cycle Assess. 2016, 21, 451–464. [Google Scholar] [CrossRef]
  53. Mapama. Precios Origen-Mayorista. Available online: https://www.mapa.gob.es/es/alimentacion/servicios/observatorio-de-precios-de-los-alimentos/default2.aspx (accessed on 23 October 2020).
  54. Cuéllar, A.D.; Webber, M.E. Wasted Food, Wasted Energy: The Embedded Energy in Food Waste in the United States. Environ. Sci. Technol. 2010, 44, 6464–6469. [Google Scholar] [CrossRef]
  55. Berners-Lee, M.; Hoolohan, C.; Cammack, H.; Hewitt, C.N. The relative greenhouse gas impacts of realistic dietary choices. Energy Policy 2012, 43, 184–190. [Google Scholar] [CrossRef]
  56. Vázquez-Rowe, I.; Villanueva-Rey, P.; Moreira, M.T.; Feijoo, G. Edible Protein Energy Return on Investment Ratio (ep-EROI) for Spanish Seafood Products. AMBIO 2014, 43, 381–394. [Google Scholar] [CrossRef] [Green Version]
  57. Vittuari, M.; de Menna, F.; Pagani, M. The Hidden Burden of Food Waste: The Double Energy Waste in Italy. Energies 2016, 9, 660. [Google Scholar] [CrossRef] [Green Version]
  58. Eriksson, M.; Spångberg, J. Carbon footprint and energy use of food waste management options for fresh fruit and vegetables from supermarkets. J. Waste Manag. 2017, 60, 786–799. [Google Scholar] [CrossRef] [PubMed]
  59. Hoehn, D.; Margallo, M.; Laso, J.; García-Herrero, I.; Bala, A.; Fullana-i-Palmer, P.; Irabien, A.; Aldaco, R. Energy embedded in food loss management and in the production of uneaten food: Seeking a sustainable pathway. Energies 2019, 12, 767. [Google Scholar] [CrossRef] [Green Version]
  60. Chen, C.; Chaudhary, A.; Mathys, A. Nutritional and environmental losses embedded in global food waste. Resour. Conserv. Recycl. 2020, 160, 104912. [Google Scholar] [CrossRef]
  61. Wohner, B.; Gabriel, V.H.; Krenn, B.; Krauter, V.; Tacker, M. Environmental and economic assessment of food-packaging systems with a focus on food waste. Case study on tomato ketchup. Sci. Total Environ. 2020, 738, 139846. [Google Scholar] [CrossRef] [PubMed]
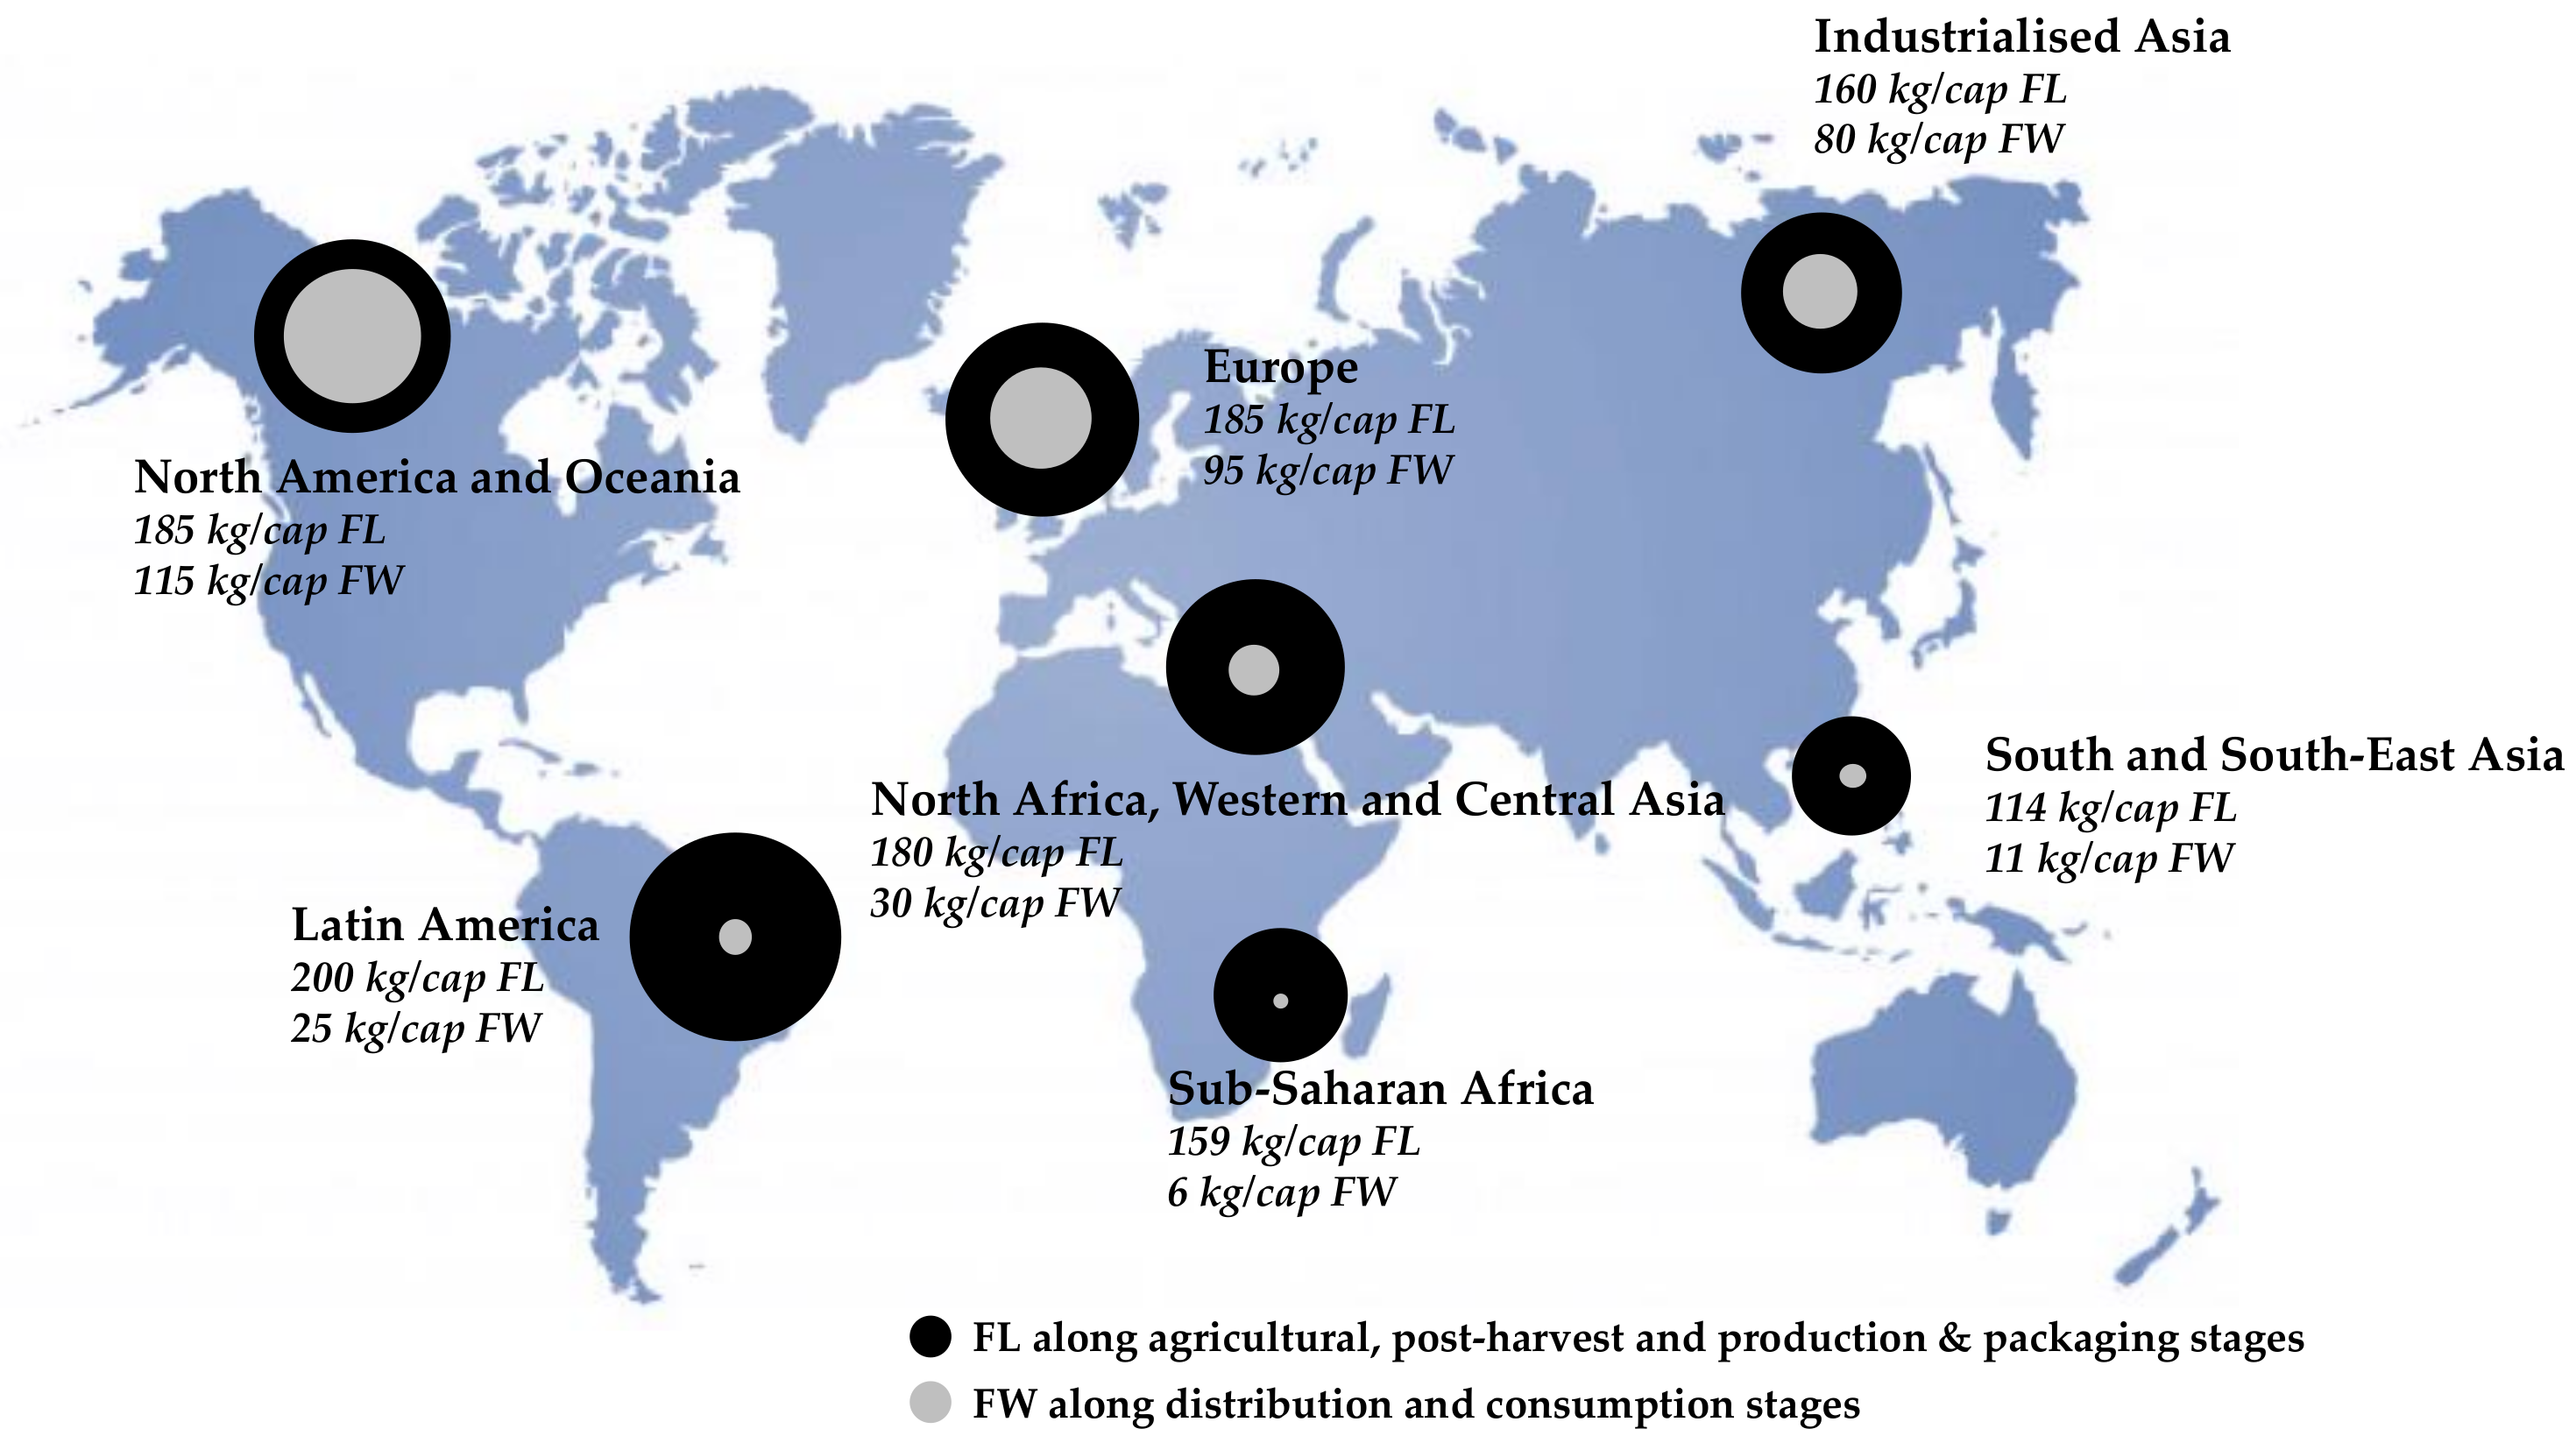
Figure 1. Global food losses (FL) and food wastes (FW) measured in kg per capita in 2011 [6].
Sustainability 13 00125 g001
Figure 2. Flowchart of the methodology proposed in this study.
Sustainability 13 00125 g002
Figure 3. Mass contribution (%) of total food loss and waste (FLW) generated along the supply chain of the Spanish food system.
Sustainability 13 00125 g003
Figure 4. Economic contribution (%) of the total FLW generated along the supply chain of the Spanish food system.
Sustainability 13 00125 g004
Figure 5. Nutritional contribution (%) of the total FLW generated along the supply chain of the Spanish food system.
Sustainability 13 00125 g005
Figure 6. Normalized economic and nutritional factors of each food category per nutrient in the first stages of the food supply chain: (a) proteins; (b) fats; (c) carbohydrates; (d) energy content; (e) fiber; and (f) minerals.
Sustainability 13 00125 g006
Figure 7. Normalized economic and nutritional factors of each food category per nutrient in in the distribution and consumption stages of the food supply chain: (a) proteins; (b) fats; (c) carbohydrates; (d) energy content; (e) fiber; and (f) minerals.
Sustainability 13 00125 g007
Figure 8. Normalized distance under equal weighting factors and minimal and maximal normalized distances for each nutrient in the first stages of the FSC (agricultural production, post-harvest and processing and packaging): (a) proteins; (b) fats; (c) carbohydrates; (d) kilocalories; (e) fiber; and (f) minerals.
Sustainability 13 00125 g008
Figure 9. Normalized distance under equal weighting factors and minimal and maximal normalized distances for each nutrient in the first stages of the FSC (distribution and consumption): (a) proteins; (b) fats; (c) carbohydrates; (d) kilocalories; (e) fiber; and (f) minerals.
Sustainability 13 00125 g009
Figure 10. Monte Carlo simulation along the supply chain of the Spanish food system: (a) first stages of the supply chain (agricultural production, post-harvest, and processing and packaging); (b) last two stages of the supply chain (distribution and consumption).
Sustainability 13 00125 g010
Table 1. Pareto optimal categories per food category and nutrient. Blue cross: losses. Orange cross: wastes.
Food CategoryProteinsCarbohydratesFatsKcalMineralsFiber
Cereals
Roots and tubers X
SugarX X
Vegetable oils X X
Vegetables
Fruits
PulsesXXXX XXX
Meat
Fish
Milk and other dairy products
Eggs X XXXXX X
Table 2. Normalized economic and nutritional factors, normalized distance, and minimal and maximal normalized distances in the first stages of the supply chain (agricultural production, post-harvest, and processing and packaging).
Food CategoryXEXNDn eq.Dn MinDn Max
ProteinsFatsCarbohydratesMineralsFiberKcal
Fruits0.510.450.170.911.001.000.400.700.420.91
Cereals0.031.000.041.000.460.420.420.610.250.72
Vegetables1.000.550.020.260.810.460.140.570.320.83
Vegetable oils0.420.001.000.000.000.001.000.560.300.89
Meat0.560.960.010.000.180.000.120.430.230.71
Milk and other dairy products0.050.700.130.040.320.000.180.300.170.50
Roots and tubers0.100.190.000.230.310.130.090.180.110.25
Sugar0.010.000.040.380.070.000.170.160.090.27
Fish0.170.290.000.000.080.000.020.130.070.21
Pulses0.020.100.010.030.050.040.020.050.030.07
Eggs0.010.050.010.000.010.000.010.020.010.03
Table 3. Normalized economic and nutritional factors, normalized distance, and minimal and maximal normalized distances in the distribution and consumption stages of the supply chain (distribution and consumption).
Food CategoryXEXNDn eq.Dn MinDn Max
ProteinsFatsCarbohydratesMineralsFiberKcal
Fruits0.271.000.291.001.001.001.000.860.450.94
Cereals0.140.681.000.040.680.000.430.550.300.79
Vegetables1.000.730.070.000.300.000.220.490.270.79
Vegetable oils0.720.100.310.210.500.540.220.420.270.59
Meat0.580.100.030.050.310.190.060.260.150.42
Milk and other dairy products0.060.000.520.000.000.000.160.210.110.35
Roots and tubers0.060.000.260.300.120.000.320.200.110.28
Sugar0.380.210.020.000.120.000.040.170.090.28
Fish0.110.050.010.060.190.090.060.100.060.14
Pulses0.020.060.050.000.030.000.020.030.020.05
Eggs0.010.020.010.010.020.020.010.020.010.02
Publisher’s Note: MDPI stays neutral with regard to jurisdictional claims in published maps and institutional affiliations.