Article

Effect of Protected Areas on Human Populations in the Context of Colombian Armed Conflict, 2005–2018

by
Roberto Rodríguez-Díaz
1,
Víctor Javier Colino-Rabanal
2,*,
Alejandra Gutierrez-López
1 and
María José Blanco-Villegas
1
1
Section of Physical Anthropology, Department of Animal Biology, Parasitology, Ecology, Edaphology and Agronomic Chemistry, University of Salamanca, Campus Miguel de Unamuno, 37071 Salamanca, Spain
2
Section of Zoology, Department of Animal Biology, Parasitology, Ecology, Edaphology and Agronomic Chemistry, University of Salamanca, Campus Miguel de Unamuno, 37071 Salamanca, Spain
*
Author to whom correspondence should be addressed.
Sustainability 2021, 13(1), 146; https://doi.org/10.3390/su13010146
Submission received: 2 October 2020 / Revised: 17 December 2020 / Accepted: 22 December 2020 / Published: 25 December 2020

Abstract

:
It is widely recognised that conservation policies in protected areas must also favour the development and viability of human populations. Although much research has focused on economic consequences, understanding the real impact of conservation on local populations requires a more holistic standpoint. Using quasi-experimental matching methods and a diachronic perspective, the biodemographic and socio-economic effects of Colombia’s National Natural Parks (NNPs) were evaluated (all in a context of internal conflict and post-conflict). The analyses were made for the set of NNPs and then grouped into four natural regions (Andes, Caribbean, Amazon-Orinoquía and Pacific) and two conflict intensities. Differences were found mainly for NNPs with low-intensity conflict, but only for biodemographic variables, not for socio-economic ones. Starting from a situation of disadvantage, a relative improvement in the conditions of the NNP municipalities was observed throughout the 13-year period in relation to the control group. Results should be taken with caution due to the conflict situation, but the lack of correlation between biodemographic and socio-economic aspects highlights the need to include more complex approaches in protected area management policies.

1. Introduction

Protected areas are an essential mechanism for conserving the biological and cultural diversity of a territory [1]. Initially, protected areas were conceived as spaces isolated from human populations [2,3,4]. However, since the 1980s [5], the idea began to spread that they should also be socially inclusive and contribute to the development of nations and the reduction of poverty [6]. Moreover, policies that fail to take into account the various relationships between conservation needs and the demands of poverty reduction are more likely to fail [7]. The issue has been the subject of considerable controversy, with much debate over the role that protected areas play in the livelihoods and development of communities within their area of influence [8,9,10,11].
Some authors argue that the establishment of protected areas can alter socio-economic dynamics, increasing poverty conditions and conflict over the use of territory [3,12,13]. Limitations are imposed on future land-use options, with potentially significant opportunity costs [14], which are borne by local populations [15]. Meanwhile, other authors claim that these areas contribute to improving the quality of life of local populations, through income from tourism [16], access to ecosystem services [17], diversification of lifestyles [18] and/or modernisation of infrastructure [19]. Thus, it seems that there is no single answer. The relationships between poverty and conservation actions are dynamic and locally specific [20].
In addition to these socio-economic dynamics, demographic changes have also been observed. Attracted by the opportunities provided by protected areas, many people have settled in the vicinity of these zones [21]. Apart from attraction mechanisms, the increase in population could also be explained by frontier engulfment models or by incidental processes [22]. However, Joppa et al. [23] considered these results to be only an artifice. In their study of 45 countries, they found no clear pattern in population trends, with both increases and decreases around protected areas. In addition, sometimes the population may decrease, but at the same time there may be an increase in residential pressure [24].
Nevertheless, the impact of protected areas on human populations shows many dimensions, so more holistic approaches must be sought that go beyond purely monetary analyses [25]. In this sense, surprisingly few observational or experimental details are available on the consequences that these socio-economic and demographic effects—but also other possible effects of a different nature—have on the biology of human populations under the influence of protected areas. Biodemographic factors (demographic variables that make it possible to study human populations from a biological perspective) are also relevant as indicators of the well-being of populations but, above all, these factors offer the best vision of the dynamics involved in the medium- and long-term viability of populations. In this sense, it would be very interesting to analyse the relationship between changes in socio-economic conditions and biodemographic aspects to attempt to verify the dependence or independence between them. It could be the case that an improvement in the former does not directly translate into an improvement in the latter, so that the objectives of well-being and viability (in demographic and biological terms) are not being met. It could also be that the effects of natural areas could manifest themselves in the form of changes in these biodemographic aspects, but without a reflection in socio-economic conditions. To date, only a few authors, such as Naidoo et al. [26], have included biodemographic variables. Thus, in their study of 34 countries, they found that protected areas contribute to improved child growth rates, possibly through the positive impact of tourism on the living standards of local people. In another study of developing countries, no differences were found in infant mortality rates between areas near protected areas and national averages, although the results should be taken with caution given the poor spatial resolution of the baseline data [27].
To increase our knowledge about the biodemographic effects of protected areas on local populations, this study analyses the impact that Colombian National Natural Parks (NNP) have on the municipalities under their influence. Colombia is an ideal candidate for this type of study as it has an important natural heritage and a network of natural parks that is more than 50 years old and covers the country’s main biomes. The Colombian National System of Protected Areas develops different strategies that seek to guarantee the quality of life of human populations through sustainable local development and the social participation of the communities that live in and around the protected areas [28]. In the Colombian context, the effects of protected areas on the livelihoods of the population have been analysed mainly via political perspectives, conflict, displacement and poverty [29,30,31,32]. Protected areas have thus played a relevant role throughout the armed conflict, which is demonstrated by an increase in the presence and violence of guerrillas in their vicinity [33], and which has made it difficult to achieve their conservation objectives [34].
Quasi-experimental matching was used to study the effects of NNPs on local populations [16,35,36,37,38]. Matching methods, by selecting for analysis a sample of control localities with similar characteristics but not included in an NNP, reduce possible biases caused by confounding baseline effects. For example, Andam et al. [16] used this design to demonstrate that, although the protected areas in Costa Rica and Thailand had poverty levels above the average in their respective countries, the creation of these areas was a slight improvement over similar areas not included within natural parks.
The analysis was carried out for all of Colombia’s NNPs. In addition, given the great diversity among humans and ecosystems present in Colombia, the analyses were repeated for each of the country’s four natural regions (Andes, Caribbean, Amazon-Orinoquía and Pacific). Moreover, as Colombia is a country where armed conflict has had a great impact, with unpredictable repercussions at both the population and social levels, a detailed analysis has been carried out by grouping the areas analysed according to the intensity of the conflict. The municipality was used as the unit of analysis because it is the fundamental territorial entity of the political-administrative division of the Colombian State. In addition, to introduce a diachronic perspective, uncommon in previous studies, a time interval of 13 years was considered based on data from the 2005 and 2018 Colombian population and housing censuses.

2. Materials and Methods
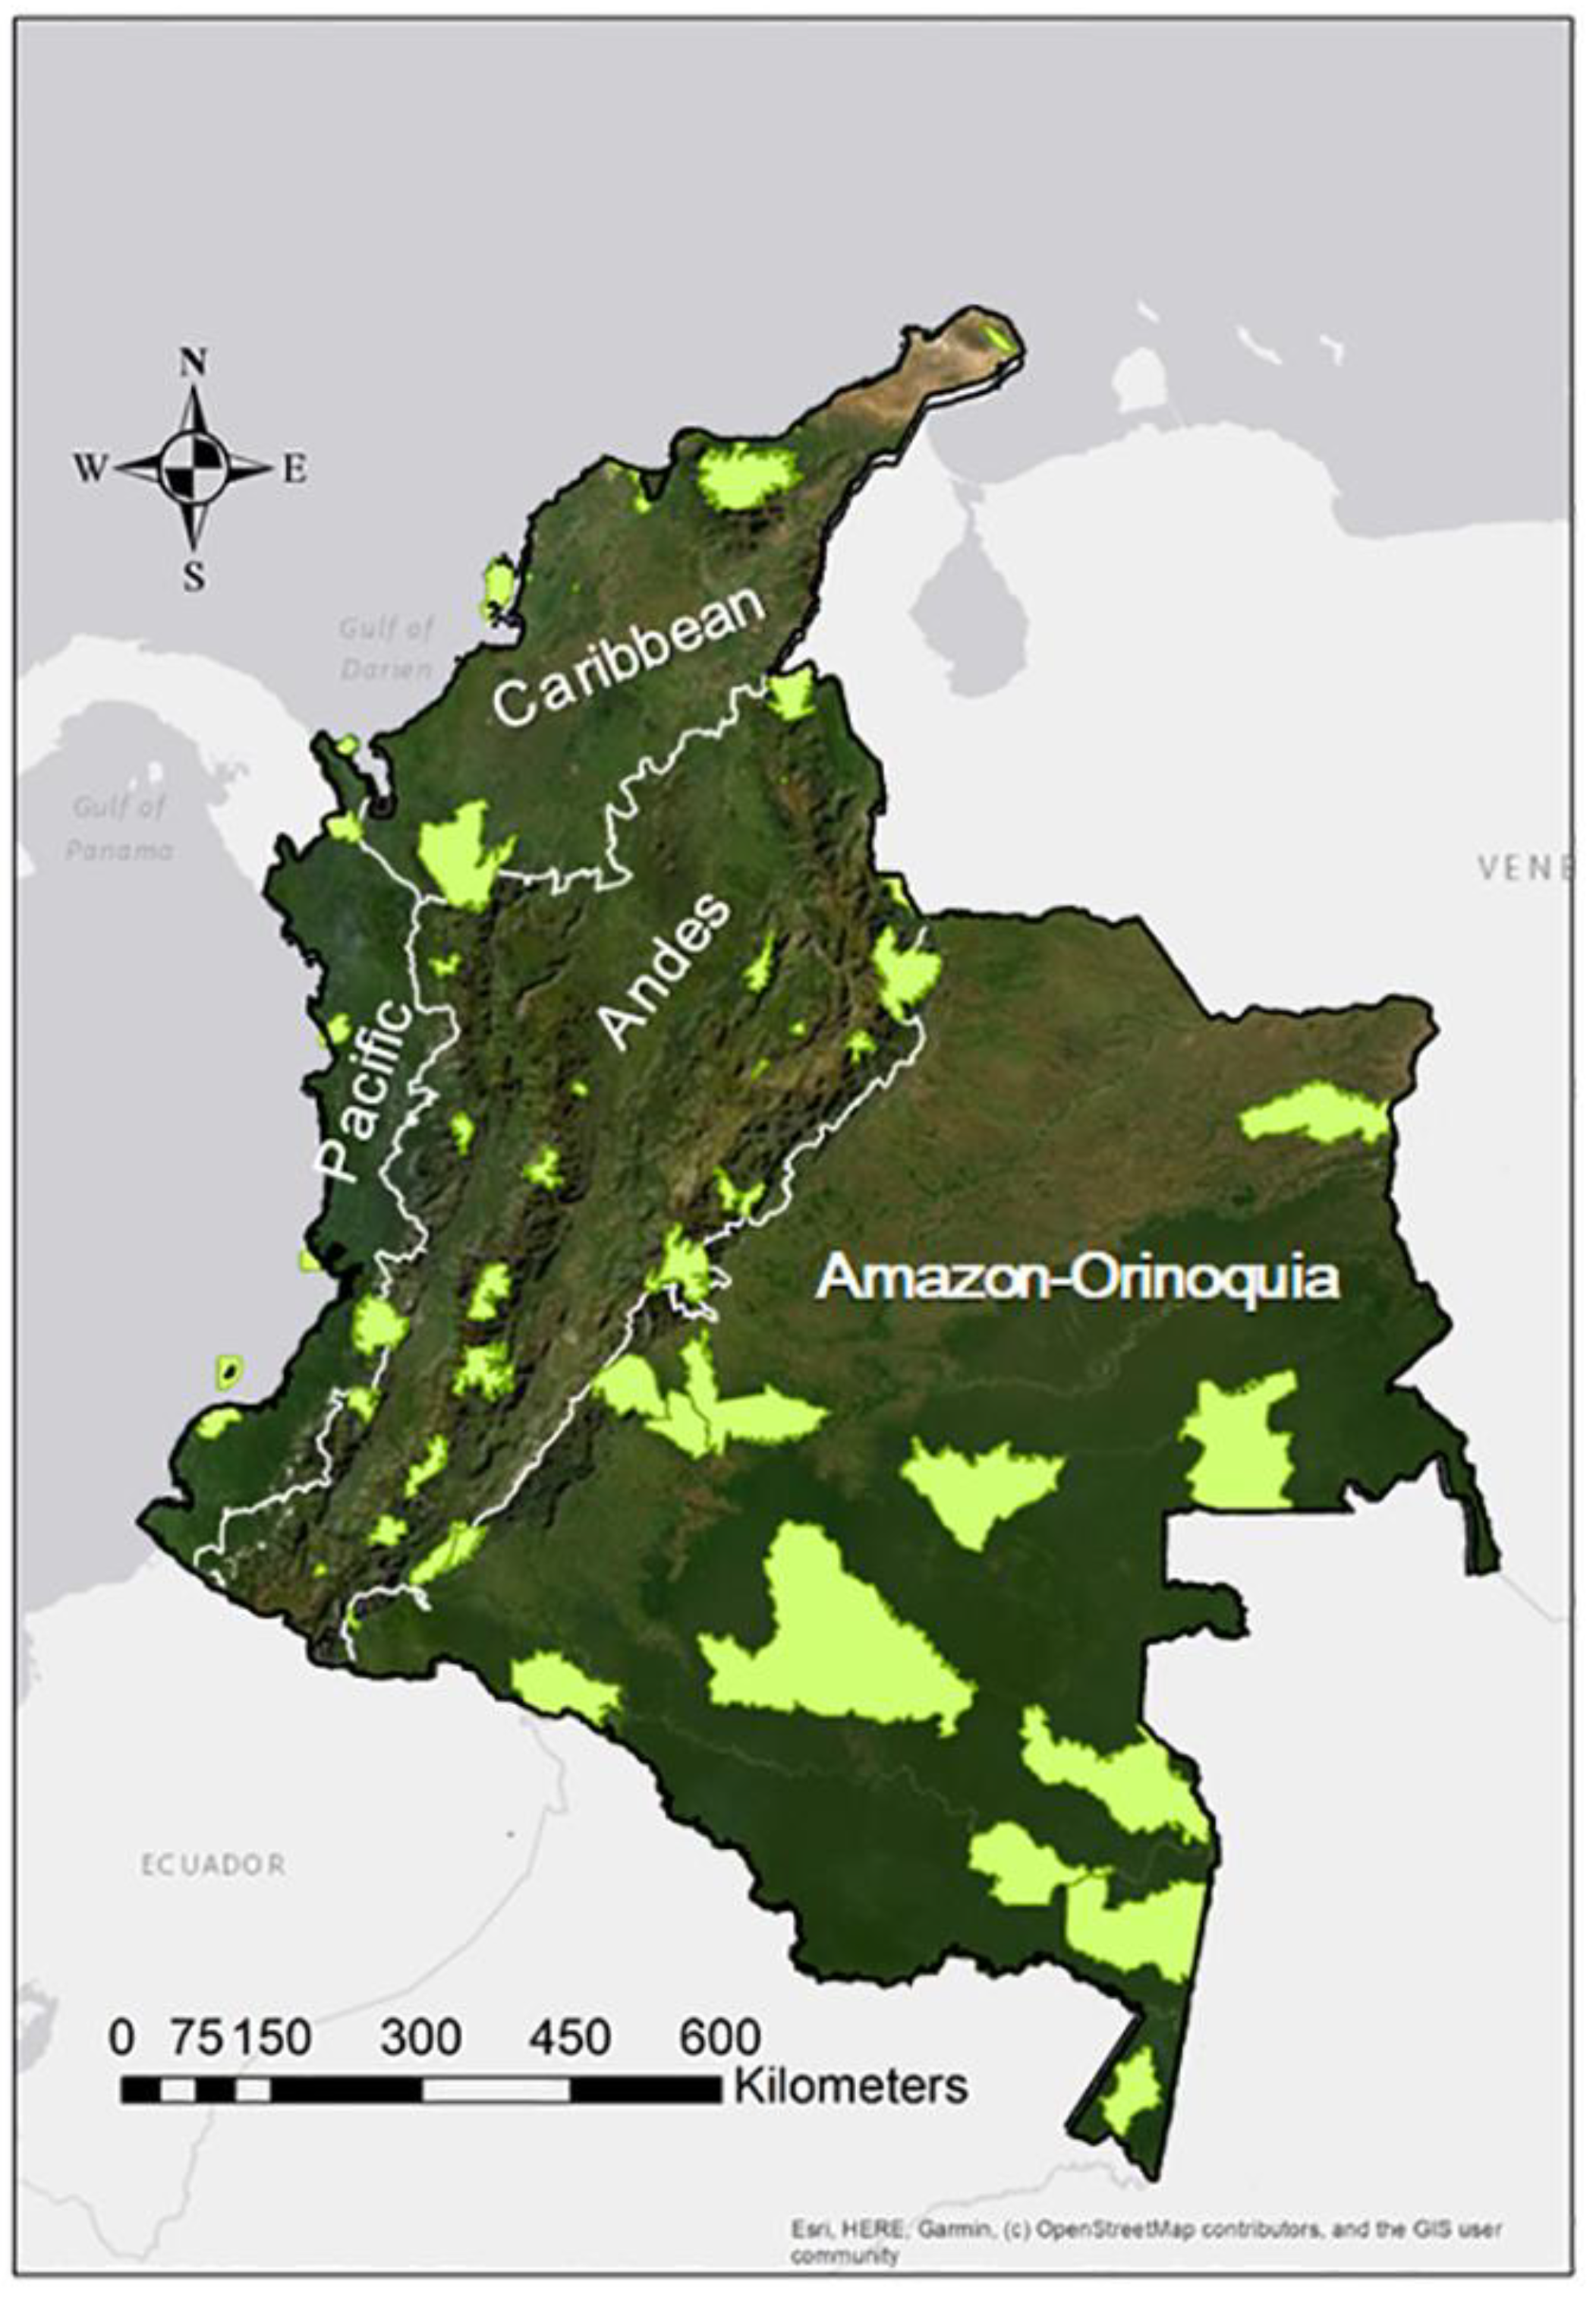
2.1. Study Area

2.1.1. Basic Data and Natural Regions

Colombia is located in the intertropical convergence zone in the northwest of South America. Its surface area is 1,141,748 km2 [39]. It has a population of 45.5 million people, organised administratively in 32 departments, which are in turn divided into 1101 municipalities [40]. Its climate is predominantly tropical, with a temperature that varies according to altitude. Colombia is a very diverse country, both environmentally and ethnically. The genetic composition of the Colombian population is 40–60% European, 28–40% Amerindian and 10–25% African [41,42,43]. On the mainland, four major natural regions can be distinguished [40], each of which maintains a certain homogeneity in terms of relief, climate, biomes and human populations: the Andes (282,540 km2), the Caribbean (151,118 km2), the Amazon-Orinoquía (624,958 km2) and the Pacific (83,170 km2) (see Figure 1).
The Andean Region is bound by three branches of the Andes: the Western, Central and Eastern Cordilleras, which reach an altitude of 5000 m and between which are interspersed the inter-Andean valleys of the main rivers, the Cauca and the Magdalena. This complexity of relief explains the diversity of climates, from tropical and temperate to high mountain. There are significant variations in rainfall (from 500 to 2000 mm per year). Altitudinal variations explain the diversity of ecosystems in the area. It is also the most populated region (75% of Colombia’s total), where the main cities and most of the country’s economic activity are concentrated. The Caribbean Region comprises the coastal plains located in the north and west of the country. It also includes the Sierra Nevada de Santa Marta and the Guajira peninsula. From the human point of view, it is characterised by marked ethnic and racial integration. Agriculture, fishing, and livestock, along with tourism activities, are its main sources of income. The Pacific Region is a mountainous territory characterised by one of the rainiest areas in the world (more than 4000 mm per year), with a dense tropical forest and very abundant rivers despite their short course. It is a sparsely populated area (3% of the country’s total) and has the highest percentage of Afro-Colombians (in the Department of Chocó, 74% of the population). The Orinoco and Amazon Regions (joined here to agglutinate enough NNPs) are vast plains, the Orinoco basin of savannahs and the Amazon basin of tropical rainforest. The Orinoco is a natural and cultural region shared by Colombia and Venezuela with a livestock vocation, where 3% of the Colombian population lives. The Amazon is the least populated area (0.5%) and has a higher proportion of indigenous population (in the Department of Vaupés, exceeding 80%).

2.1.2. National Natural Parks (NNPs)

This geomorphological and environmental complexity explains why Colombia is one of the megadiverse countries, second only to Brazil. A total of 58,312 species have been recorded, of which approximately 15% are endemic, and 1302 (2.2%) are threatened [44]. The country ranks first in the world in terms of the number of orchids and birds; second in terms of plants, amphibians, butterflies and freshwater fish; third in terms of palm tree and reptile species; and fourth in terms of mammal biodiversity. In recent decades, human pressures on the country’s natural areas and values have increased significantly [45,46]. To conserve and protect this rich natural heritage, the Colombian National Natural Park System (SINAP) was created, which is made up of 59 protected areas, representing a total of 17,541,489 hectares of the national surface area [47]. For Colombia, NNPs are areas that allow for ecological self-regulation and whose ecosystems in general have not been substantially altered by human exploitation or occupation, and where plant and animal species, geomorphological complexes and historical or cultural manifestations have national scientific, educational, aesthetic and recreational value and, for their perpetuation, are subject to an adequate management regime [28]. The conservation status and the human pressure on the environment, both in the protected areas and outside them, are irregular and diverse, as a consequence of the high environmental, economic, social, ecological and geographical variability of Colombian territory [45,48]. The dominant strategy in Colombia has been a proactive one, allocating the largest proportion of protected land to intact, hard-to-reach and species-rich areas such as the Amazon [49]. The first NNP was declared in 1960; 6 were declared in the 1960s, 24 in the 1970s, 12 in the 1980s, 4 in the 1990s and 13 since 2000. By natural region, 26 are located in the Andes, 12 in the Caribbean, 4 in the Pacific, 14 in the Amazon-Orinoquía region and 3 on islands. This study only considers continental NNPs with a declaration date up to 2005, since this is the year of the first census included in the data [40]. Island or marine NNPs were excluded (i.e., Malpelo, Islas Corales del Rosario and San Bernardo, Isla Gorgona and Old Providence McBean Lagoon) due to the absence of census data for these areas and the impossibility of finding control municipalities with similar characteristics. Protected areas smaller than 10,000 ha were not included (these are mostly flora and fauna sanctuaries). Considering these criteria, a total of 38 NNPs were finally included in the analyses. By natural region: 19 NNPs were in the Andes, 5 in the Caribbean, 3 in the Pacific, and 11 in Amazon-Orinoquía.

2.2. Context of Violence in Colombia

The effect of NNPs on human populations in Colombia cannot be dissociated from the historical and political context of recent decades. Since the 1960s, the country has been marked by an asymmetric and low-intensity armed conflict anchored in agrarian and land tenure conflicts dating back almost a century [50]. This conflict has involved numerous actors, including the Colombian government, guerrillas, paramilitaries, drug cartels, criminal gangs and organised armed groups. The intensity of the conflict has gone through different stages, the period 1988–2012 being the bloodiest due to the rapid growth of Revolutionary Armed Forces of Colombia FARC factions (the main guerrilla group) and paramilitary incursions. In recent years, the violence has been decreasing up to the signing of the 2016 Peace Accords between the Colombian Government and FARC. However, at present, there are still residual trouble spots. The intensity of the conflict has also not been homogeneous throughout Colombian territory. The most affected areas have varied over time, with the departments of Antioquia, Santander, Norte de Santander, Cauca, Valle del Cauca, César, Magdalena or Meta recording the highest number of victims. It is estimated that since the armed conflict began in 1958, there have been up to nine million victims.
Protected areas have played an important role during the armed conflict [51]. The guerrillas, especially in the stages when the Colombian armed forces and paramilitary groups were at their strongest, found a refuge in the NNPs where they could continue their activities. This seems to be explained not only by the fact that the protected areas are located in remote areas that are difficult to access, but also by the fact that, because other legal activities were restricted, these areas were less frequented and offered better conditions as a refuge for guerrilla groups. This presence explains the increase in violence in the vicinity of protected areas [52,53]. The effect of violence on the natural ecosystems of protected areas is complex [46,54]. The practices of armed groups in relation to land use have varied in space and time. In specific areas, the presence of guerrillas has led to what some authors have called ‘gunpoint conservation’, a phenomenon that has been observed in different conflict regions globally [55,56,57]. Armed groups mined and defended certain areas for alleged environmental reasons, but also because that was where they had established their base camps. This control may have given some protection to the environmental values of these areas, at least indirectly [55]. However, many of these areas outside government control have been subject to significant changes in land use, with negative consequences for conservation [53,54,58]. In the post-conflict phase, there has been a growing conflict over the exploitation of the territories previously controlled by the guerrillas, with an increase in deforestation [46,53,57,59].

2.3. Quasi-Experimental Matching Method

Colombian NNPs tend to concentrate on peripheral areas, with a high degree of isolation and specific geomorphological and environmental characteristics [49]. This is a pattern that is repeated practically all over the world [60,61]. These locations also condition the socio-economic possibilities and biodemographic characteristics of human populations. Without careful selection of the control municipalities, the possible differences found for municipalities in NNPs could be related not so much to their being close to the NNP, but to the very conditions of their location, regardless of whether they are in an NNP or not. Thus, to avoid these biases, a comparison must be made between municipalities located in an NNP (treatment) and municipalities with similar characteristics not affected by this protection regime (control). The matching method allows the selection of control populations with the most similar confounding baseline characteristics to ones near NNPs. This quasi-experimental matching method, by minimising the biases by controlling for confounders, ensures that the observed effects are mainly due to the NNP designation.
Table 1 shows the confounding baseline characteristics considered in this study and the indicators used for each one. These characteristics are involved in the socio-economic conditions and biodemographic dynamics of the municipalities in NNPs, but not directly linked to protection status. They are related to the level of isolation (distance from the departmental capital), the orography as an estimator of accessibility (slope) or the environmental conditions (altitude and rainfall). Because some biodemographic variables can vary between ethnic groups, ethnic composition (% Afro-descendants and % Indigenous) was also taken into consideration. Furthermore, due to the context of violence, variables related to conflict intensity (% of displaced persons and conflict rate) were also included. All of these variables were obtained for all Colombian municipalities.
The Euclidean distances between all Colombian municipalities were calculated from the indicators in Table 1. By means of matching, a set of control municipalities most like the municipalities in NNP was selected. There is one control municipality per NNP municipality (n = 181). In the final selection, not only the Euclidean distances obtained from the indicators of the confounding characteristics were taken into account, but three other requirements also had to be met. To avoid any influence of the NNPs on the control municipalities, controls must be located at least 30 km away from the nearest NNP. Furthermore, as the analysis was also carried out by grouping the NNP municipalities by natural region (4 regions) and by conflict intensity (2 levels), an effort was made to ensure that for each municipality in NNP there would be a control municipality placed in the same natural region and in the same conflict intensity category. Thus, as a result of the matching, we obtained a set of 181 control municipalities with similar characteristics (in terms of confounder indicators) as the NNP populations and with a similar distribution between the four natural regions and the different conflict intensities.

2.4. Biodemographic and Socio-Economic Variables

The biodemographic and socio-economic variables used to characterise the influence of NNPs on human populations are described in Table 2. As special emphasis is placed on the impact of NNPs on biodemographic aspects, nine variables were selected to cover the main aspects of human population biology. Those biodemographic variables available from the 2005 and 2018 censuses [40] that best define human population dynamics were selected and grouped into three blocks: population structure, fertility, and infant mortality. The description of the population structure makes it possible to assess the population stability, and to this end, the ageing ratio (AGR), the mean mortality age (MMA) and the changes in the population size (intercensal growth [ICG]), were measured. From the fertility and infant mortality estimates, inferences can be made about the medium- and long-term viability of the population. Regarding fertility, the number of children born alive per woman (BAL), the relationship between weight and height of the newborns (WES) and the duration of pregnancy (DPR) were considered. Infant mortality was analysed along three stages: foetal (FOM), neonatal (NEM) and post-neonatal (POM).
Socio-economic variables were included for a double purpose: first, to identify the possible effects of the NNPs on them, and second, especially, to compare their behaviour with that of the biodemographic variables. The aim was to check whether changes in socio-economic conditions directly lead to changes in the biology of the populations. Four socio-economic variables were included. One of them was linked to educational level (illiteracy [ILL]) and the others were related to the standard of living and access to material goods: unsatisfied basic needs (UBN), proportion of households with insufficient income (INI) in 2005 and per capita income (PCI) in 2018.
This set of variables is intended to address a hitherto little explored approach, namely the direct influence of the effect of protected areas on the biodemography of the local populations. To this end, the effect of the NNPs on the biodemographic variables and on the socio-economic variables is estimated, considering their possible interrelationship.

2.5. Sources of Information

The biodemographic and socio-economic variables were obtained from the General Population and Housing Census of 2005 and 2018, provided by the National Administrative Department of Statistics [40]. The census data were collected by DANE between May and November 2005 through face-to-face interviews. In 2018 the face-to-face interviews were conducted between April and October 2018 and, in addition, electronic interviews were conducted between January and April 2018. In these censuses, economic, social, housing, activity and personal indicators were collected.
Data on conflict intensity were obtained from the Conflict Analysis Resource Centre (CERAC) database [62,63,64]. This database establishes a classification that categorises Colombian municipalities according to the effect caused by the conflict between 2000 and 2012, according to which conflict intensity in each municipality is assessed based on the average number of armed conflict events during the study period with respect to the national average (3 events per municipality). A municipality is considered to have been strongly affected (high-intensity) by the conflict when the average number of events is greater than or equal to the national average and slightly affected (low-intensity) otherwise.

2.6. Statistical Analysis

The statistical differences between NNP and control municipalities in relation to the biodemographic and socio-economic variables were estimated by means of unpaired sample tests: Student’s t-test in the case of normality and Wilcoxon in the case of non-normality [65,66].

3. Results

3.1. Differences between NNP and Control Municipalities for 2005 and 2018

Table 3 shows the average values of the 9 biodemographic and the 4 socio-economic variables in the NNP and control populations for the periods 2005 and 2018 for the country as a whole and for each of the subgroups considered (the four natural regions and the two levels of violence intensity). A total of 6 of the 13 variables considered (AGR, MMA, WES, FOM, NEM and POM) showed significant differences between NNP and control populations (highlighted in bold in Table 3). These differences were not constant over time either for the entire country or for each of the natural regions or each conflict intensity considered.
In 2005, for Colombia as a whole, there were significant differences between the NNP and control municipalities for two variables related to infant mortality (FOM and NEM). FOM (NNP = 22.619, Control = 18.817) and NEM (NNP = 12.773, Control = 10.911) were higher in the municipalities in NNP (Table 3 and Figure 2). For the rest of the variables no differences were found. However, these overall results contained notable variations between natural regions. In the Andes (Table 3 and Figure 3), there were significant differences for the same variables FOM (NNP = 19.484, Control = 15.712) and NEM (NNP = 11.530, Control = 9.516), but there were also differences in two biodemographic variables related to population structure, AGR and MMA. The Andean municipalities in NNP showed a lower AGR (NNP = 0.075, Control = 0.085) and a lower MMA (NNP = 58.908, Control = 60.826). The Caribbean (Table 3 and Figure 2) followed a similar pattern to the Andes. Thus, in terms of infant mortality the differences were also significant in FOM (NNP = 25.574, Control = 19.755) and POM (NNP = 11.932, Control = 7.302). For Amazon-Orinoquía and Pacific there were no differences between municipalities in NNP and the control. No significant differences in socio-economic variables were found for any of the cases.
In summary, in 2005, in general the data for NNP populations are worse than for non-NNP populations. There is a lower level of ageing, probably related to a lower age of mortality. Variables linked to infant and perinatal mortality also show worse results in NNP populations. All effects of NNPs are observed on the biodemographic variables, none on the socioeconomic ones.
In 2018 and for the set of NNPs (Table 3 and Figure 1), the differences in variables related to infant mortality remained, but for this period they were expressed through the POM (NNP = 6.107, Control = 5.165). POM was greater in the populations of NNP municipalities. Unlike 2005, there were also differences for two other biodemographic variables (Figure 2). One related to population structure, MMA, and another related to fertility, WES. Municipalities in NNP showed a lower MMA (NNP = 63.750, Control = 65.595) and a higher WES (NNP = 62.474, Control = 61.993). Differences in WES were found for the Andes (NNP = 62.383, Control = 61.841) and the Caribbean (NNP = 62.642, Control = 61.767). These two areas, with similar response patterns, maintained significantly lower values in AGR (NNP = 0.105 and Control = 0.117 in Andes; NNP = 0.064, Control = 0.076 in Caribbean) and MMA (NNP = 67.177 and Control = 69.097 in Andes, NNP = 61.218, Control = 65.415 in Caribbean). For the Amazon-Orinoquía region, the only variation identified was for POM (NNP = 7.137, Control = 3.966). For the Pacific, as for 2005, no variations were found between NNP and control areas (Table 3). No significant differences in socio-economic variables were found in 2018.
In general terms, in 2018, two opposing changes can be observed. On the one hand, in the adult population in NNP, there is less aging, again probably linked to a lower mortality age. On the other hand, neonates show a greater weight at birth. Similar to 2005, no effect of NNP on socioeconomic variables is detected.

3.2. Variation between 2005 and 2018

In general, the populations of the studied municipalities experienced changes in the values of the biodemographic and socio-economic variables over the 13-year period between 2005 and 2018. Thus, the values of two biodemographic variables related to population structure, AGR and MMA, increased throughout this period both inside and outside NNPs (Table 3). There was also a population increase (but at a lower rate than in 2005), but ICG was the only variable that showed a different evolution in NNP and control municipalities, declining within NNPs and increasing outside them. As for fertility, BAL and WES decreased, while DPR increased. The variables FOM, NEM and POM experienced a notable decrease. Socio-economic indicators behaved in a similar way to biodemographic indicators. Throughout this period, a remarkable socio-economic development was consolidated, as evidenced by the reduction in ILL values and two poverty indicators (UBN and INI/PCI). All of these changes occurred for the entire population under study (p-value < 0.05) and for the populations of all four natural regions, whether they were in NNP or not.
More interesting for the study of the impact of the NNP on local populations is the analysis of the relative changes in the NNP municipalities in relation to control over this 13-year period. Table 4 shows the direction of change for those variables where significant differences were found between NNP and control municipalities in at least one of the two censuses. In relative terms and for all of Colombia, the municipalities in NNP showed an improvement for two of the variables on infant mortality (NEM and FOM) and one on fertility (WES). WES in 2018 was comparably higher in NNPs. The rates of NEM and FOM were reduced proportionally more in the NNP populations, and by 2018 there was no longer a difference with populations outside NNP. However, the rates of the other variable for infant mortality, POM, worsened (was further reduced in control municipalities) although it is likely that the remarkable change in POM between 2005 and 2018 outside NNP in Amazon-Orinoquía (2005 = 10.732, 2018 = 3.966) explained the significant results for the whole country. The other variable for which some relative decline was identified for NNP populations was MMA, related to population structure. MMA values increased in the NNP municipalities, but to a lesser extent than in the controls.
Grouping by natural regions (Table 4 and Figure 2), the Andean NNPs maintained their relative position to the control group in terms of population structure (AGR and MMA) and showed an improvement in variables related to fertility (WES) and infant mortality (FOM and NEM). In the Caribbean NNPs, there were also relative improvements in WES and in two variables on infant mortality (FOM and POM). FOM and POM reduced at a greater rate in NNP, matching those of the control group. In terms of population structure, differences remained for AGR and there was a slight worsening in MMA. Amazon-Orinoquía NNPs regressed in POM. In the Pacific there was no change at all.
Regarding socio-economic variables, if in 2005 there were no differences between PPN and control areas, both groups followed similar changes over the 13 years, so no significant differences were found in 2018, either.

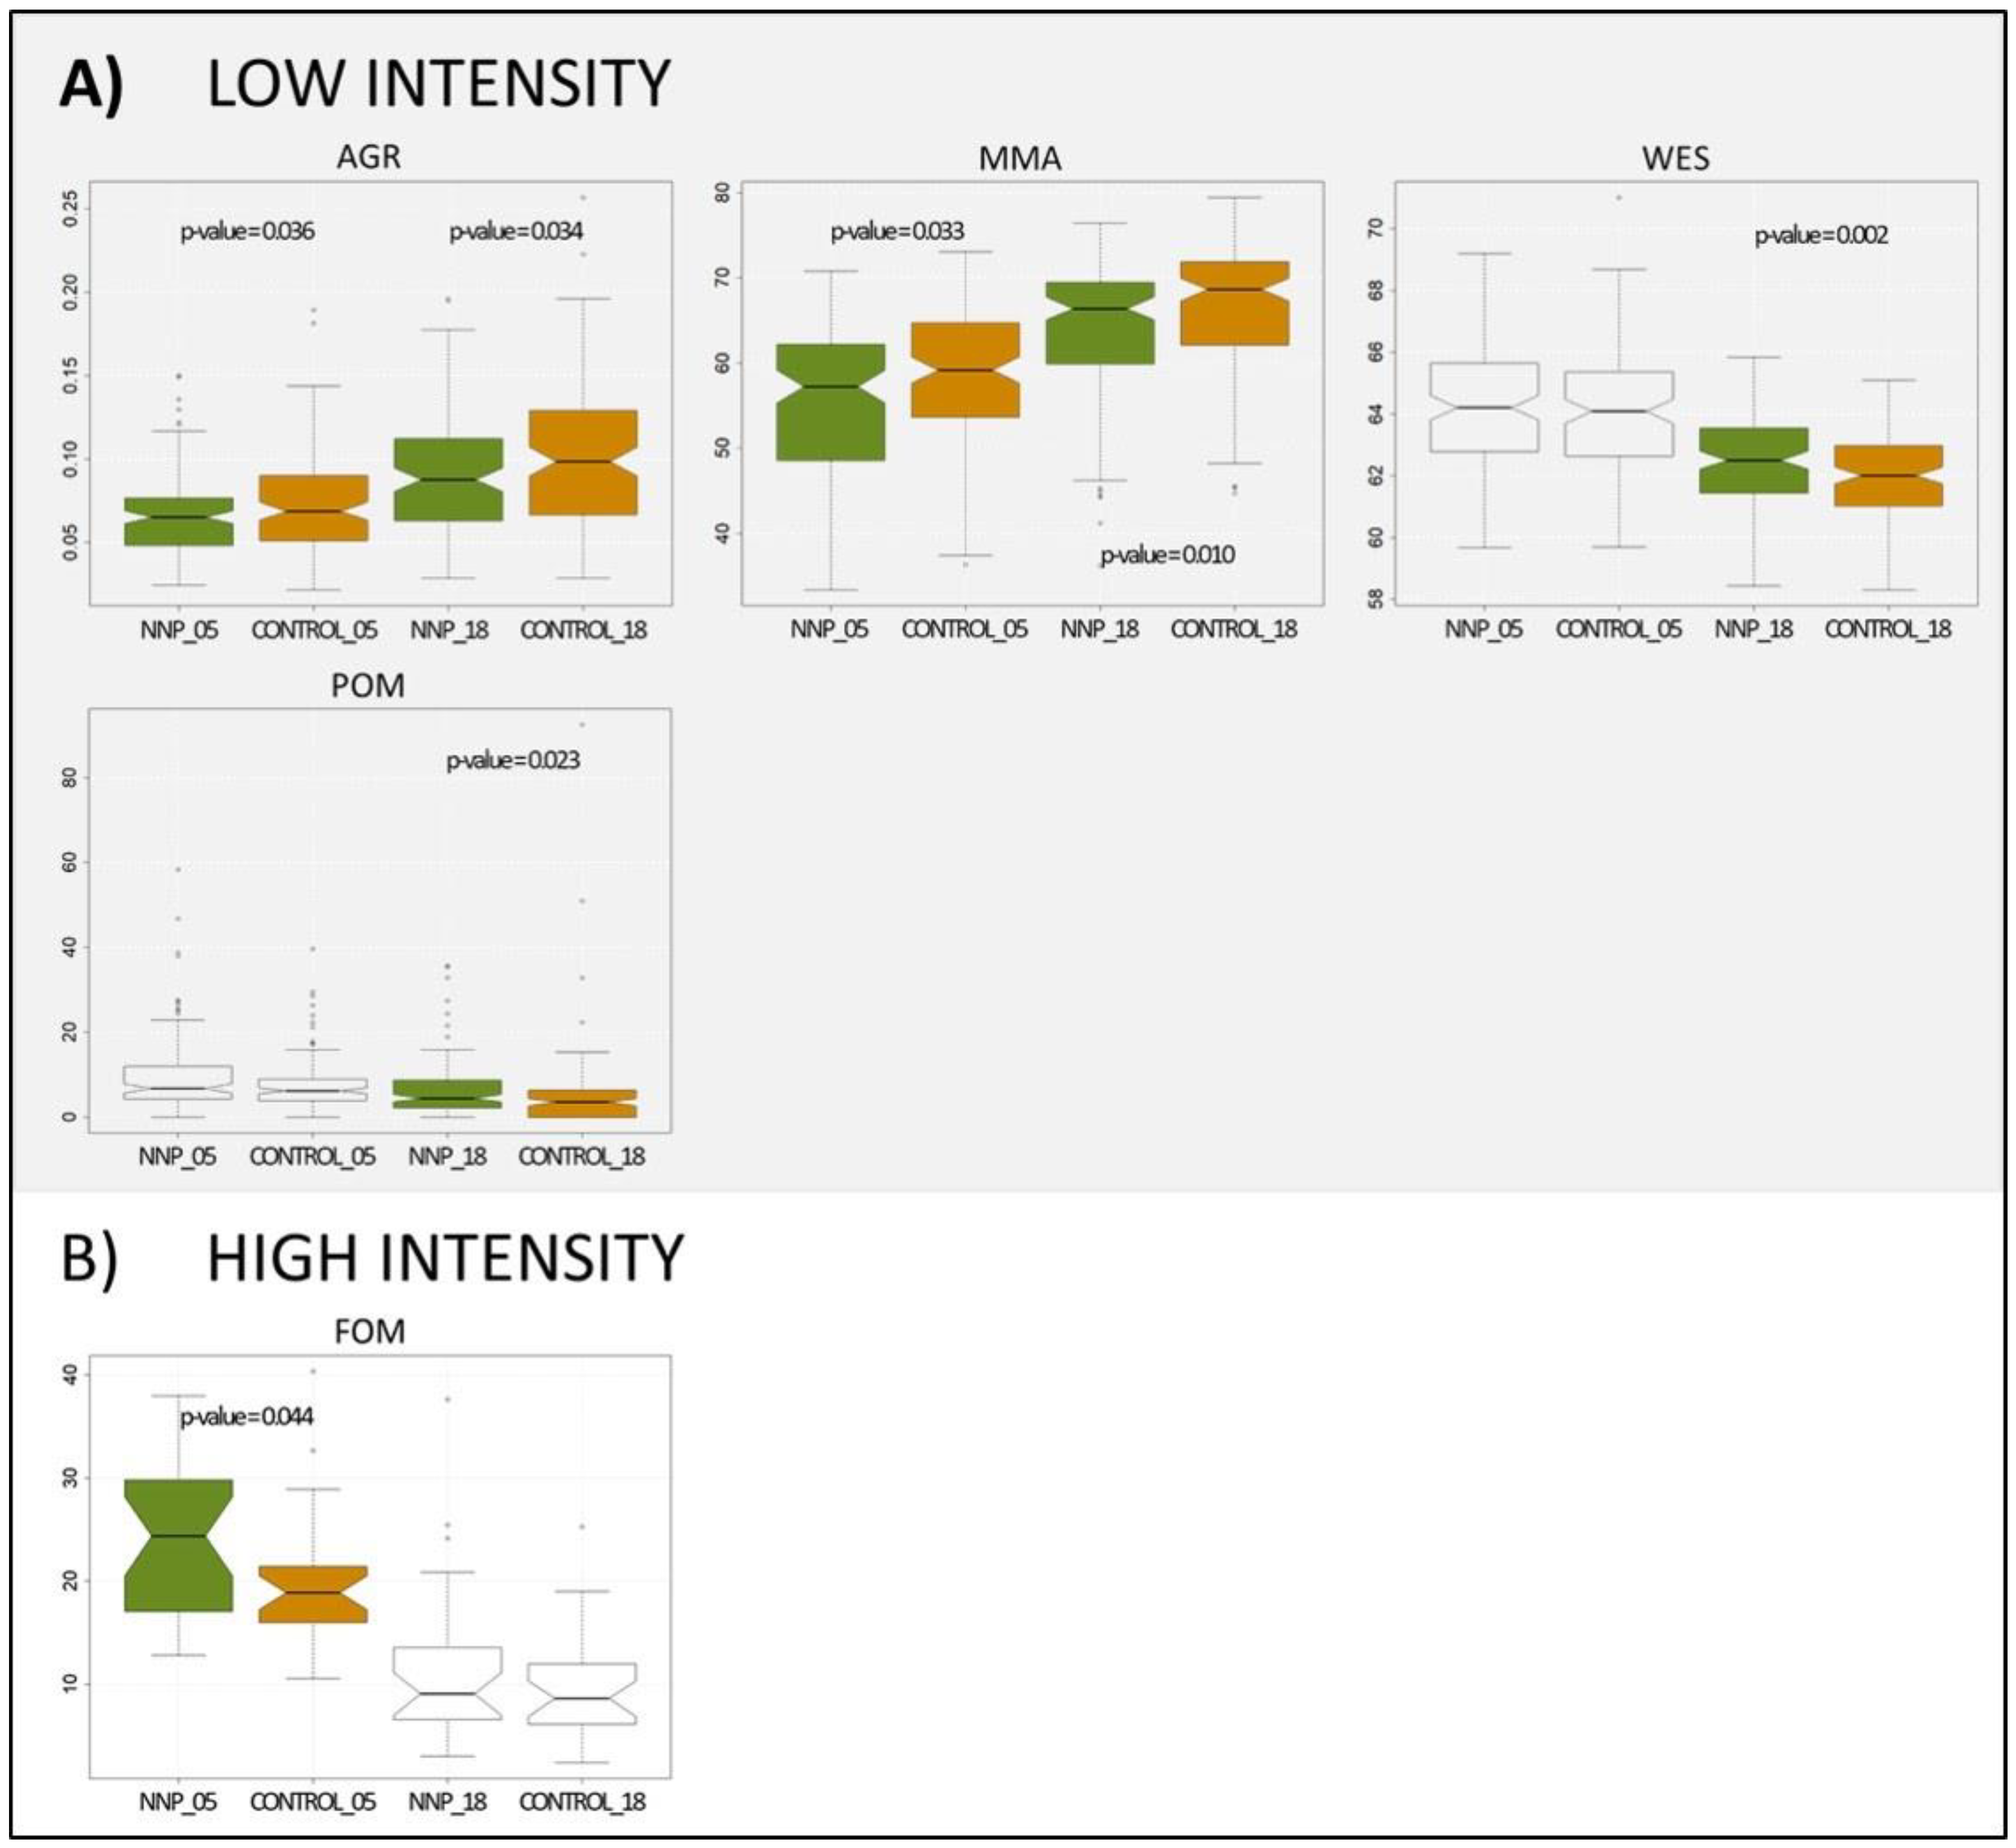
3.3. National Natural Parks and Level of Violence

Grouped by conflict intensity, Figure 4 shows those variables with significant differences between NNP and control localities. For Low-Intensity, in 2005 the main differences were those related to population structure: a higher AGR in NNP (NNP = 0.066, Control = 0.075) and a lower MMA (NNP = 55.606, Control = 57.943). In 2018 the differences between the two groups were repeated: AGR (NNP = 0.091, Control = 0.103) and MMA (NNP = 64.096, Control = 66.363). Among the fertility variables, only in WES (NNP = 62.505, Control = 61.915) were differences significant. In those related to infant mortality only POM (NNP = 6322, Control = 5312) differed significantly. None of the socio-economic variables showed any differences. For 2005, in the NNPs subject to high-intensity conflict (Figure 4) differences were only found in FOM (NNP = 23,989, Control = 19,616). No differences were identified in 2018.

4. Discussion

The main goal in defining protected areas is to preserve environmental values and biodiversity [8], but, at the same time, it is also a priority to guarantee adequate development of the local populations [5,6,28,51]. This human development is linked to a compendium of cultural, environmental, social and biological factors that are often difficult to study separately. Analysis of the effects of protected areas on local populations has thus frequently focused on the analysis of the socio-economic impacts, but other effects remain virtually unexplored. This study is one of the first to focus on the effects that NNPs may have on biodemographic aspects and the relationship between these and socio-economic changes.

4.1. Differences between Municipalities in NNP and Control

All of the differences between the NNP and control populations were observed in biodemographic variables. For at least one of the variables in each of the biodemographic blocks (population structure, fertility, infant mortality), differences were identified between the two groups. These variables can be determining factors in the stability and balance of human populations—as well as in their viability and continuity—and ultimately define their biological structure.
The availability of population and housing censuses for 2005 and 2018 allowed us to introduce a diachronic approach to the analysis. Over these 13 years and as a result of social and economic development, notable progress was observed in biodemographic and socio-economic terms for the entire population under study. However, this progress was differentially more rapid in the NNP populations than in the controls. Following the 2016 peace agreement, the impact of which should begin to be felt in the 2018 census, most of the differences that were noted for 2005 in the NNP municipalities in relation to the control group disappeared. By 2018, the location of a municipality within a protected area represented neither an advantage nor a disadvantage for the human populations (Table 3 and Table 4). In general, there has been a shift from a situation in 2005 in which NNPs have a lower proportion of elderly people and a lower mean age at death, with no differences in fertility, and higher infant mortality (especially in foetuses and newborns), to the scenario in 2018 in which newborns begin to show greater weight than in the control group, differences in variables related to population structure are maintained and there is also a notable relative improvement in infant mortality rates (Table 4 and Figure 1, Figure 2 and Figure 3). These biodemographic variables vary by both individual-level responses and meso-level factors [67].
Contrary to the conclusions of other studies [15,16,26,52,68,69,70], our results for Colombia’s NNPs showed that socio-economic variables remained unchanged regardless of the period or natural region considered. With the data handled in the study, and in a context of armed conflict, it is difficult to determine the mechanisms underlying the biodemographic changes described and why these occur independently of the socio-economic aspects. In this respect, the biological dynamics of human populations are sensitive to different factors, including socio-economic ones, but also environmental, geographical or cultural [71]. Even fortuitous or specific events can also be decisive.
Some differences were found between natural regions. If there are socio-economic winners and losers depending on location [37,72], this is also probably true for the biodemographic variables. However, more research is needed on these differences between protected areas and on the causes of this spatial heterogeneity.

4.2. NNP Municipalities and Armed Conflict

Almost all of the effects associated with the presence of NNPs discussed in the previous section were observed in the municipalities where the intensity of the armed conflict was classified as low [64]. In areas with high-intensity conflict it is very difficult to ensure the linkage of any effect with the NNPs, because the violence could be masking outcomes.
The armed conflict affected the entire Colombian population, although not homogeneously [64]. Thus, protected areas, whose environmental values have been preserved in many cases due to their remote location or special isolation, were frequently used as a refuge by the guerrillas to carry out their operations [52,53]. This peripheral location has hampered the capacity and presence of the state in these areas, with a consequent possible effect on the welfare and health conditions of human populations. In Colombia, this capacity seems to have been limited during the conflict to the vicinity of the main populated areas, where violence was less intense and state services reached the population [46,58]. It has been estimated that if the protected areas had not also increased guerrilla activities, the poverty reduction effects would have been more than triple [38].
Attributing causes to explain the changes observed after the peace process is complicated and is not the subject of this study. Nevertheless, it should be noted that the process has not been homogeneous and that post-conflict scenarios in protected areas have been particularly complex. The Colombian administration may not have reached all of these new territories as effectively, and much of the activity there is still outside government control. Thus, with the abandonment of guerrilla positions in some of the more isolated protected areas, key groups in land management (such as large landowners, peasants, cartels, etc.) seem to have expanded their activities in these areas, favouring large-scale livestock farming and speculative land markets or coca crops, with the resulting increase in deforestation and threats to biodiversity [46,53,73]. It is foreseeable that these activities have also had their effects on local population dynamics [51]. In this sense, if the effects of NNPs on local populations in situations of armed conflict remain to be explored, we have even less knowledge of the dynamics of post-conflict scenarios. Therefore, it seems necessary to establish systems to monitor the functionality of the reserved areas [48] and, in particular, their effect on these dynamics.

5. Conclusions

In this study for Colombia, an effect associated with the presence of NNPs was verified on the biodemography of human populations. These effects were independent of socio-economic factors, which remained unchanged over the period analysed. In other words, no socio-economic changes were observed to which biodemographic alterations could be attributed. Nevertheless, these results should be treated with caution, because the presence of the armed conflict is, on the one hand, a source of population stress capable of displacing any other factor that may influence population dynamics, and on the other hand, a source of noise that makes it extremely difficult to interpret the differences observed. Despite these limitations, and in light of the results, it seems necessary to consider broader approaches that include both socio-economic and bio-demographic dynamics in the study of the effect of protected areas on human populations.
Moving forward, to operationalize the results of this line of research, it is not enough to know that NNP exert a quantifiable influence on human populations. It is also necessary to study in depth the underlying causes that explain the interrelations and dependencies between socio-economic and biodemographic aspects and NNP. These causes are out of the scope of this study and should be explored in future research. In the case of Colombia, where as a consequence of the internal conflict the positive economic effects that tourism provides to protected areas are still taking off, the differences between municipalities within and outside NNPs are probably explained by differential access to education or health systems, nutrition, or differences in access to the ecosystem services provided by nature. In any case, to guarantee future viability and improve the living standards of human populations under the influence of NNPs, it is required to define policies specifically designed to improve not only socio-economic indicators but also biodemographic ones such as those studied here.

Author Contributions

Conceptualization, R.R.-D., V.J.C.-R. and M.J.B.-V.; methodology, R.R.-D. and V.J.C.-R.; formal analysis, R.R.-D., A.G.-L. and V.J.C.-R.; investigation, R.R.-D. and V.J.C.-R.; resources, R.R.-D., A.G.-L. and V.J.C.-R.; data curation, R.R.-D. and A.G.-L.; writing—original draft preparation, V.J.C.-R., R.R.-D. and A.G.-L.; writing—review and editing, V.J.C.-R., R.R.-D. and M.J.B.-V.; visualization, R.R.-D., V.J.C.-R. and A.G.-L.; supervision, M.J.B.-V.; project administration, R.R.-D., V.J.C.-R. and M.J.B.-V.; funding acquisition, A.G.-L. All authors have read and agreed to the published version of the manuscript.

Funding

This research was partially funded by International Scholarship “Universidad de Salamanca-Banco Santander” for Latin America.

Institutional Review Board Statement

Not applicable.

Informed Consent Statement

Not applicable.

Data Availability Statement

No new data were created or analyzed in this study. Data sharing is not applicable to this article.

Acknowledgments

The authors wish to acknowledge the source of various datasets used in the analysis for this study: General Population and Housing Census provided by the Colombian National Administrative Department of Statistics (DANE).

Conflicts of Interest

The authors declare no conflict of interest. The funders had no role in the design of the study; in the collection, analyses, or interpretation of data; in the writing of the manuscript; or in the decision to publish the results.

References

  1. IUCN; WCMC. Guidelines for Protected Area Management Categories; IUCN: Gland, Switzerland, 1994. [Google Scholar]
  2. Scherl, L.M.; Wilson, A.; Wild, R.; Blockhus, J.; Franks, P.; McNeely, J.A.; McShane, T. Can Protected Areas Contribute to Poverty Reduction? Opportunities and Limitations; The World Conservation Union: Gland, Switzerland; Cambridge, UK, 2004. [Google Scholar]
  3. Adams, W.M.; Hutton, J. People, parks, and poverty: Political ecology and biodiversity conservation. Conserv. Soc. 2007, 5, 147–183. [Google Scholar]
  4. Lele, S.; Wilshusen, P.; Brockington, D.; Seidler, R.; Bawa, K. Beyond exclusion: Alternative approaches to biodiversity conservation in the developing tropics. Curr. Opin. Environ. Sustain. 2010, 2, 94–100. [Google Scholar] [CrossRef]
  5. Unesco. World National Parks Congress; Unesco: Bali, Indonesia, 1982. [Google Scholar]
  6. Millennium Ecosystem Assessment. Ecosystems and Human Well-Being: Policy Responses; Millennium Ecosystem Assessment: Washington, DC, USA, 2005. [Google Scholar]
  7. Sanderson, S.E.; Redford, K.H. Contested relationships between biodiversity conservation and poverty alleviation. Oryx 2003, 37, 389–390. [Google Scholar] [CrossRef] [Green Version]
  8. Adams, W.M.; Aveling, R.; Brockington, D.; Dickson, B.; Elliot, J.; Hutton, J.; Roe, D.; Vira, B.; Wolmer, W. Biodiversity conservation and the eradication of poverty. Science 2004, 306, 1146–1149. [Google Scholar] [CrossRef] [PubMed] [Green Version]
  9. Roe, D. The origins and evolution of the conservation-poverty debate: A review of key literature, events, and policy processes. Oryx 2008, 42, 491–503. [Google Scholar] [CrossRef] [Green Version]
  10. Brockington, D.; Wilkie, D. Protected areas and poverty. Philos. Trans. R Soc. B 2015, 370, 20140271. [Google Scholar] [CrossRef]
  11. Naughton-Treves, L.; Alix-Garcia, J.; Chapman, C.A. Lessons about parks and poverty from a decade of forest loss and economic growth around Kibale National Park, Uganda. Proc. Natl. Acad. Sci. USA 2011, 108, 13919–13924. [Google Scholar] [CrossRef] [Green Version]
  12. Brockington, D.; Igoe, J.; Schmidt-Soltau, K.A. Conservation, human rights, and poverty reduction. Conserv. Biol. 2006, 20, 250–252. [Google Scholar] [CrossRef] [PubMed]
  13. West, P.; Igoe, J.; Brockington, D. Parks and peoples: The social impact of protected areas. Annu. Rev. Anthropol. 2006, 35, 251–277. [Google Scholar] [CrossRef] [Green Version]
  14. Norton-Griffiths, M.; Southey, C. The opportunity costs of biodiversity conservation in Kenya. Ecol. Econ. 1995, 12, 125–139. [Google Scholar] [CrossRef]
  15. Ferraro, P.J. The local costs of establishing protected areas in low-income nations: Ranomafana National Park, Madagascar. Ecol. Econ. 2002, 43, 261–275. [Google Scholar] [CrossRef]
  16. Andam, K.S.; Ferraro, P.J.; Sims, K.R.; Healy, A.; Holland, M.B. Protected areas reduced poverty in Costa Rica and Thailand. Proc. Natl. Acad. Sci. USA 2010, 107, 9996–10001. [Google Scholar] [CrossRef] [Green Version]
  17. Ferraro, P.J.; Hanauer, M.M. Quantifying causal mechanisms to determine how protected areas affect poverty through changes in ecosystem services and infrastructure. Proc. Natl. Acad. Sci. USA 2014, 111, 4332–4337. [Google Scholar] [CrossRef] [Green Version]
  18. Baird, T.D.; Leslie, P.W. Conservation as disturbance: Upheaval and livelihood diversification near Tarangire National Park, northern Tanzania. Glob. Environ. Change 2013, 23, 1131–1141. [Google Scholar] [CrossRef]
  19. Ezebilo, E.E.; Mattsson, L. Socio-economic benefits of protected areas as perceived by local people around Cross River National Park, Nigeria. For. Policy Econ. 2010, 12, 189–193. [Google Scholar] [CrossRef]
  20. Upton, C.; Ladle, R.; Hulme, D.; Jiang, T.; Brockington, D.; Adams, W.M. Are poverty and protected area establishment linked at a national scale? Oryx 2008, 42, 19–25. [Google Scholar] [CrossRef] [Green Version]
  21. Wittemyer, G.; Elsen, P.; Bean, W.T.; Burton, A.C.; Brashares, J.S. Accelerated human population growth at protected area edges. Science 2008, 321, 123–126. [Google Scholar] [CrossRef] [Green Version]
  22. Scholte, P.; De Groot, W.T. From debate to insight: Three models of immigration to protected areas. Conserv. Biol. 2009, 24, 630–632. [Google Scholar] [CrossRef]
  23. Joppa, L.N.; Loarie, S.R.; Pimm, S.L. On population growth near protected areas. PLoS ONE 2009, 4, e4279. [Google Scholar] [CrossRef]
  24. Castro-Prieto, J.; Martinuzzi, S.; Radeloff, V.C.; Helmers, D.P.; Quiñones, M.; Gould, W.A. Declining human population but increasing residential development around protected areas in Puerto Rico. Biol. Conserv. 2017, 209, 473–481. [Google Scholar] [CrossRef] [Green Version]
  25. Woodhouse, E.; Homewood, K.M.; Beauchamp, E.; Clements, T.; McCabe, J.T.; Wilkie, D.; Milner-Gulland, E.J. Guiding principles for evaluating the impacts of conservation interventions on human well-being. Phil. Trans. R Soc. B 2015, 370, 20150103. [Google Scholar] [CrossRef]
  26. Naidoo, R.; Gerkey, D.; Hole, D.; Pfaff, A.; Ellis, A.M.; Golden, C.D.; Herrera, D.; Johnson, K.; Mulligan, M.; Ricketts, T.H.; et al. Evaluating the impacts of protected areas on human well-being across the developing world. Sci. Adv. 2019, 5, eaav3006. [Google Scholar] [CrossRef] [PubMed] [Green Version]
  27. De Sherbinin, A. Is poverty more acute near parks? An assessment of infant mortality rates around protected areas in developing countries. Oryx 2008, 42, 26–35. [Google Scholar] [CrossRef] [Green Version]
  28. PNNC (Parques Nacionales Naturales de Colombia). Sistema Nacional de Áreas Protegidas-SINAP. Available online: http://www.parquesnacionales.gov.co/portal/es/sistema-nacional-de-areas-protegidas-sinap/mapa-sinap/ (accessed on 15 January 2020).
  29. Díaz, M. Conflicto de ocupación en áreas protegidas. Conservación versus derechos de comunidades. Opin. Juríd. 2008, 7, 53–69. [Google Scholar]
  30. Durán, C.A. Gobernanza en los Parques Nacionales Naturales Colombianos: Reflexiones a partir del caso de la comunidad Orika y su participación en la conservación del Parque Nacional Natural Corales del Rosario y San Bernardo. Rev. Estud. Soc. 2009, 32, 60–73. [Google Scholar]
  31. Rojas, Y. La historia de las áreas protegidas en Colombia, sus firmas de gobierno y las alternativas para la gobernanza. Soc. Econ. 2014, 27, 155–175. [Google Scholar]
  32. De Pourcq, K.; Thomas, E.; Van Damme, P.; Léon-Sicard, T. Análisis de los conflictos entre comunidades locales y autoridades de conservación en Colombia: Causas y recomendaciones. Gest. Ambiente 2017, 20, 122–139. [Google Scholar] [CrossRef] [Green Version]
  33. Canavire-Bacarreza, G.; Hanauer, M.M. Estimating the impacts of Bolivia’s protected areas on poverty. World Dev. 2013, 41, 265–285. [Google Scholar] [CrossRef] [Green Version]
  34. Ferguson, B.; Gardner, C.J.; Andriamarovololona, M.M.; Healy, T.; Muttenzer, F.; Smith, S.; Hockley, N.; Gingembre, M. Governing ancestral land in Madagascar: Have policy reforms contributed to social justice? In Governance for Justice and Environmental Sustainability: Lessons across Natural Resource Sectors in Sub-Saharan Africa; Sowman, M., Wynberg, R., Eds.; Routledge: London, UK, 2014; pp. 63–93. [Google Scholar]
  35. Stuart, A.E. Matching methods for causal inference: A review and a look forward. Stat. Sci. 2010, 25, 1–21. [Google Scholar] [CrossRef] [Green Version]
  36. Diamond, A.; Sekhon, J.S. Genetic matching for estimating causal effects: A general multivariate matching method for achieving balance in observational studies. Rev. Econ. Stat. 2013, 95, 932–945. [Google Scholar] [CrossRef] [Green Version]
  37. Hanauer, M.M.; Canavire-Bacarreza, G. Implications of heterogeneous impacts of protected areas on deforestation and poverty. Philos. Trans. R Soc. B 2015, 370, 20140272. [Google Scholar] [CrossRef] [PubMed] [Green Version]
  38. Hanauer, M.M.; Canavire-Bacarreza, G. Civil Conflict Reduced the Impact of Colombia’s Protected Areas; Sonoma State University: Rohnert Park, CA, USA; Inter-American Development Bank: Washington, DC, USA, 2018; 31p. [Google Scholar]
  39. Cancillería de Colombia. Símbolos Patrios y Otros Datos de Interés. Available online: https://www.cancilleria.gov.co/colombia/nuestro-pais/simbolos (accessed on 18 March 2020).
  40. DANE (Departamento Administrativo Nacional de Estadística). Available online: http://www.dane.gov.co (accessed on 15 January 2020).
  41. Ruiz-Linares, A.; Adhikari, K.; Acuña-Alonzo, V.; Quinto-Sanchez, M.; Jaramillo, C.; Arias, W.; Fuentes, M.; Pizarro, M.; Everardo, P.; de Avila, F.; et al. Admixture in Latin America: Geographic structure, phenotypic diversity and self-perception of ancestry based on 7,342 individuals. PLoS Genet. 2014, 10, e1004572. [Google Scholar] [CrossRef] [PubMed] [Green Version]
  42. Ibarra, A.; Restrepo, T.; Rojas, W.; Castillo, A.; Amorim, A.; Martínez, B.; Burgos, G.; Ostos, H.; Álvarez, K.; Camacho, M.; et al. Evaluating the X chromosome-specific diversity of Colombian populations using insertion/deletion polymorphisms. PloS Genet. 2014, 9, e87202. [Google Scholar] [CrossRef] [PubMed] [Green Version]
  43. Homburguer, J.R.; Moreno-Estrada, A.; Gignoux, C.R.; Nelson, D.; Sanchez, E.; Ortiz-Tello, P.; Pons-Estel, B.A.; Acevedo-Vasquez, E.; Miranda, P.; Langefeld, C.D.; et al. Genomic insights into the ancestry and demographic history of South America. PloS Genet. 2015, 11, e1005602. [Google Scholar] [CrossRef] [PubMed] [Green Version]
  44. Sistema de Información sobre Biodiversidad de Colombia. Biodiversidad en cifras. Available online: https://cifras.biodiversidad.co/ (accessed on 25 February 2020).
  45. Ayram, C.; Etter, A.; Díaz-Timoté, J.; Rodríguez Buriticá, S.; Ramírez, W.; Corzo, G. Spatiotemporal evaluation of the human footprint in Colombia: Four decades of anthropic impact in highly biodiverse ecosystems. Ecol. Indic. 2020, 117, 106630. [Google Scholar] [CrossRef]
  46. Suarez, A.; Arias-Arévalo, P.A.; Martínez-Mera, E. Environmental sustainability in post-conflict countries: Insights for rural Colombia. Environ. Dev. Sustain. 2018, 20, 997–1015. [Google Scholar] [CrossRef]
  47. PNGIBSE (Política Nacional para la Gestión Integral de la Biodiversidad y sus Servicios Ecosistémicos). Ministerio de Ambiente y Desarrollo Sostenible, Instituto Alexander Von Humboldt, Bogotá, Colombia. Available online: http://www.humboldt.org.co/images/documentos/pdf/documentos/pngibse-espaol-web.pdf (accessed on 12 March 2020).
  48. Sierra, C.A.; Mahecha, M.; Poveda, G.; Álvarez-Dávila, E.; Gutierrez-Velez, V.H.; Reu, B.; Feilhauer, H.; Anáya, J.; Armenteras, D.; Benavides, A.; et al. Monitoring ecological change during rapid socio-economic and political transitions: Colombian ecosystems in the post-conflict era. Environ. Sci. Policy 2017, 76, 40–49. [Google Scholar] [CrossRef]
  49. Forero-Medina, G.; Joppa, L. Representation of global and national conservation priorities by Colombia’s Protected Area Network. PLoS ONE 2010, 5, e13210. [Google Scholar] [CrossRef]
  50. Sánchez, F.; Palau, M.M. Conflict, decentralisation and local governance in Colombia, 1974–2004. In Households in Conflict Network; Working Paper 14; Universidad de los Andes: Bogotá, Colombia, 2006. [Google Scholar]
  51. Aguilar, M.; Sierra, J.; Ramírez, W.; Ragas, O.; Calle, Z.; Vargas, W.; Murcia, C.; Aronson, J.; Barrera Castaño, J.I. Toward a post-conflict Colombia: Restoring to the future. Restor. Ecol. 2015, 23, 4–6. [Google Scholar] [CrossRef]
  52. Canavire-Bacarreza, G.; Diaz-Gutierrez, J.E.; Hanauer, M.M. Unintended consequences of conservation: Estimating the impact of protected areas on violence in Colombia. J. Environ. Econ. Manag. 2018, 89, 46–70. [Google Scholar] [CrossRef]
  53. Hoffmann, C.; García Márquez, J.R.; Krueger, T. A local perspective on drivers and measures to slow deforestation in the Andean-Amazonian foothills of Colombia. Land Use Policy 2018, 77, 379–391. [Google Scholar] [CrossRef]
  54. Dávalos, L. The San Lucas mountain range in Colombia: How much conservation is owed to the violence? Biodivers. Conserv. 2001, 10, 69–78. [Google Scholar] [CrossRef]
  55. Alvarez, M. Forests in the time of violence: Conservation implications of the Colombian war. J. Sustain. For. 2003, 16, 47–68. [Google Scholar] [CrossRef]
  56. Enaruvbe, G.O.; Keculah, K.M.; Atedhor, G.O.; Osewole, A.O. Armed conflict and mining induced land-use transition in northern Nimba County, Liberia. Glob. Ecol. Conserv. 2019, 17, 2351–9894. [Google Scholar] [CrossRef]
  57. Murillo-Sandoval, P.J.; Van Dexter, K.; Van Den Hoek, J.; Wrathall, D.; Kennedy, R. The end of gunpoint conservation: Forest disturbance after the Colombian peace agreement. Environ. Res. Lett. 2020, 15, 034033. [Google Scholar] [CrossRef]
  58. Bonilla-Mejía, L.; Higuera-Mendieta, I. Protected areas under weak institutions: Evidence from Colombia. World Dev. 2019, 122, 585–596. [Google Scholar] [CrossRef]
  59. Clerici, N.; Salazar, C.; Pardo-Díaz, C.; Jiggins, C.D.; Richardson, J.E.; Linares, M. Peace in Colombia is a critical moment for Neotropical connectivity and conservation: Save the northern Andes-Amazon biodiversity bridge. Conserv. Lett. 2018, 12, 1–7. [Google Scholar] [CrossRef]
  60. Joppa, L.N.; Pfaff, A. High and far: Biases in the location of protected areas. PLoS ONE 2009, 4, e8273. [Google Scholar] [CrossRef]
  61. Baldi, G.; Texeira, M.; Martin, O.A.; Grau, H.R.; Jobbágy, E.G. Opportunities drive the global distribution of protected areas. PeerJ 2017, 5, e2989. [Google Scholar] [CrossRef] [Green Version]
  62. Restrepo, J.; Spagat, M.; Vargas, J. The dynamics of the Colombian civil conflict: A new data set. Homo Oecon. 2004, 21, 396–428. [Google Scholar]
  63. Restrepo, J.; Spagat, M.; Vargas, J. The severity of the Colombian conflict: Cross-country datasets versus new micro data. J. Peace Res. 2006, 43, 99–115. [Google Scholar] [CrossRef] [Green Version]
  64. CERAC (Centro de Recursos Para el Análisis de Conflictos). Typology of Colombian Municipalities According to the Internal Armed Conflict. 2014. Available online: http://www.cerac.org.co/es/l%C3%ADneas-de-investigaci%C3%B3n/analisis-conflicto/tipologia-por-municipios-del-conflicto-armado.html (accessed on 17 December 2020).
  65. Bauer, D.F. Constructing confidence sets using rank statistics. J. Am. Stat. Assoc. 1972, 67, 687–690. [Google Scholar] [CrossRef]
  66. Hollander, M.; Wolfe, D.A. Nonparametric Statistical Methods; John Wiley & Sons: New York, NY, USA, 1973; (or second edition 1999); pp. 27–33. [Google Scholar]
  67. Castro Torres, A.F.; Urdinola, B.P. Armed conflict and fertility in Colombia, 2000–2010. Popul. Res. Policy Rev. 2019, 38, 173–213. [Google Scholar] [CrossRef]
  68. Coad, L.; Campbell, A.; Miles, L.; Humphries, K. The Costs and Benefits of Protected Areas for Local Livelihoods: A Review of the Current Literature; United Nations Environment Programme: Nairobi, Kenya; World Conservation Monitoring Centre: Cambridge, UK, 2008. [Google Scholar]
  69. Pfaff, A.; Robalino, J.; Lima, E.; Sandoval, C.; Herrera, L.D. Governance, location and avoided deforestation from protected areas: Greater restrictions can have lower impact due to differences in location. World Dev. 2014, 55, 7–20. [Google Scholar] [CrossRef]
  70. Specht, M.J.; Santos, B.A.; Marshall, N.; Melo, F.P.; Leal, I.R.; Tabarelli, M.; Baldauf, C. Socio-economic differences among resident, users and neighbour populations of a protected area in the Brazilian dry forest. J. Environ. Econ. Manag. 2019, 232, 607–614. [Google Scholar]
  71. Creanza, N.; Kolodny, O.; Feldman, M.W. Cultural evolutionary theory: How culture evolves and why it matters. Proc. Natl. Acad. Sci. USA 2017, 114, 7782–7789. [Google Scholar] [CrossRef] [Green Version]
  72. Ferraro, P.J.; Hanauer, M.M. Protecting ecosystems and alleviating poverty with parks and reserves: ‘win-win’ or tradeoffs? Environ. Resour. Econ. 2011, 48, 269–286. [Google Scholar] [CrossRef]
  73. Murillo-Sandoval, P.J.; Hilker, T.; Krawchuk, M.A.; Van Den Hoek, J. Detecting and attributing drivers of forest disturbance in the Colombian Andes using landsat time-series. Forests 2018, 9, 269. [Google Scholar] [CrossRef] [Green Version]
Figure 1. Map of Colombia with the National Natural Parks and the four major natural regions considered in the study.
Sustainability 13 00146 g001
Figure 2. Boxplots with the variables for which significant differences were detected between NNP and control municipalities for all Colombian NNP considered as a whole: mean mortality age (MMA), weight/length (WES), foetal mortality (FOM), neonatal mortality (NEM) and post-neonatal mortality (POM). The boxplot is only shown in colour if the differences are significant during this period, otherwise the boxplot is shown in white.
Sustainability 13 00146 g002
Figure 3. Boxplots of the variables with significant differences between NNP and control municipalities for 3 natural regions (for Pacific no differences were found): (A) Andes, (B) Caribbean, (C) Amazon-Orinoquía. Variables: ageing rate (AGR), mean mortality age (MMA), weight/height (WES), neonatal mortality (NEM), post-neonatal mortality (POM) and foetal mortality (FOM). The boxplot is only shown in colour if the differences are significant during this period, otherwise the boxplot is shown in white.
Sustainability 13 00146 g003
Figure 4. Boxplots of the variables with statistically significant differences between NNPs and control municipalities according to the incidence of the armed conflict: (A) low intensity; (B) high intensity. Variables: ageing ratio (AGR), mean mortality age (MMA), weight/height (WES), post-neonatal mortality (POM) and foetal mortality (FOM). The boxplot is only shown in colour if the differences are significant during this period, otherwise the boxplot is shown in white.
Sustainability 13 00146 g004
Table 1. Indicators of the confounding baseline characteristics used to select a set of control localities as similar as possible to the National Natural Parks (NNP) municipalities through matching techniques.
CofounderIndicatorDescription
SizeAreaMunicipal area in km2
Population sizeNumber of inhabitants registered in the municipality
Population composition% Afro-descendantsProportion of people according to ethnicity (African descendants)
% IndigenousProportion of people according to ethnicity (Indigenous)
RuralityPercentage of rural population
OrographySlopeAverage slope of the terrain
AltitudeAverage height above sea level
ClimatologyRainfallAverage amount of rain collected over a year
LocationDistance to the departmental capitalDistance from the municipality to the capital of its Department
Armed conflict% DisplacedProportion of residents who had to leave the municipality because of the armed conflict
Armed conflict indexPresence of armed groups and number of events of the internal conflict (2000–2012). Grouped by intensity of the conflict from 1 (strongly affected municipalities and persistent conflict) to 7 (municipalities without conflict)
Table 2. Biodemographic (related to population structure, fertility, and infant mortality) and socio-economic variables used to estimate the influence of NNPs on human populations. All data were obtained from population and housing census published by the Colombian National Administrative Department of Statistics (DANE) [40].
TypeVariableAbbrevDescription
Biodemographic variablesPopulation structureAgeing RatioAGRRatio of the proportion of elderly people (65 years and over) and young people (under 15 years) multiplied by 100
Mean Mortality AgeMMAAverage age of mortality excluding first-year mortality (calculated for the periods 2001–2005 and 2014–2018)
Intercensal GrowthICGDifference between the population size in the current census and that from the previous one
FertilityBorn AliveBALLive births per woman (calculated for the periods 2001–2005 and 2014–2018)
Weight/SizeWESBirth weight divided by height in newborns (for the periods 2001–2005 and 2014–2018)
Duration of pregnancyDPRAverage length of gestation (for 2001–2005 and 2014–2018)
Infant mortalityFoetal MortalityFOMProportion of pregnancies not carried to term (for the periods 2001–2005 and 2014–2018)
Neonatal MortalityNEMProportion of stillbirths by pregnancy (for the periods 2001–2005 and 2014–2018)
Post neonatal MortalityPOMProportion of deaths before age 1 by birth (for the periods 2001–2005 and 2014–2018)
Socio-economic variables IlliteracyILLProportion of the population over 15 years of age that is illiterate
Unsatisfied Basic NeedsUBNProportion of the population unable to meet their basic needs
Insufficient incomeINIProportion of households with insufficient income to cover basic expenses (2005 only)
Per Capita IncomePCIPer capita income by municipality (for 2018 only)
Table 3. Mean and standard deviation (in brackets) for each biodemographic and socio-economic variable in each period (2005 and 2018) and subdivision (4 natural regions and 2 conflict intensities). The orientation of the arrows located to the right of each variable show the changes over the 13-year period except for insufficient income (INI, available only for 2005) and per capita income (PCI, available only for 2018). The variable and the period for which the difference between NNP and control was significant are highlighted in bold.
COLOMBIA ANDES CARIBBEAN AMAZON-ORINOQ PACIFIC LOW-INTENSITY HIGH-INTENSITY
Variable20052018 20052018 20052018 20052018 20052018 20052018 20052018
BIODEMOGRAPHICPopulation StructureAGRNNP0.066
(0.024)
0.088
(0.035)
0.075
(0.023)
0.105
(0.032)
0.048
(0.010)
0.064
(0.015)
0.045
(0.014)
0.057
(0.017)
0.049
(0.014)
0.055
(0.010)
0.066
(0.025)
0.091
(0.036)
0.056
(0.015)
0.076
(0.026)
Control0.072
(0.029)
0.098
(0.042)
0.085
(0.029)
0.117
(0.040)
0.055
(0.011)
0.076
(0.018)
0.044
(0.010)
0.056
(0.013)
0.057
(0.014)
0.059
(0.010)
0.075
(0.031)
0.103
(0.044)
0.058
(0.015)
0.077
(0.025)
MMANNP55.182
(8.537)
63.750
(7.849)
58.908
(6.947)
67.177
(5.597)
52.879
(6.665)
61.218
(6.694)
46.421
(6.152)
58.355
(6.245)
46.050
(7.011)
50.372
(7.963)
55.606
(8.971)
64.096
(8.267)
53.275
(5.977)
62.195
(5.450)
Control56.932
(8.499)
65.595
(7.600)
60.826
(6.721)
69.097
(5.360)
56.162
(5.732)
65.415
(5.114)
45.898
(5.851)
58.312
(5.425)
49.036
(4.663)
52.308
(5.712)
57.943
(8.364)
66.363
(7.673)
52.906
(8.002)
62.894
(6.163)
ICGNNP0.031
(0.267)
0.002
(0.245)
−0.017
(0.195)
−0.043
(0.228)
0.042
(0.501)
0.120
(0.165)
0.182
(0.240)
0.070
(0.333)
0.132
(0.162)
0.020
(0.206)
0.018
(0.273)
−0.001
(0.259)
0.089
(0.234)
0.019
(0.176)
Control−0.003
(0.269)
0.023
(0.251)
−0.047
(0.242)
−0.020
(0.213)
0.017
(0.338)
0.174
(0.152)
0.161
(0.201)
0.064
(0.328)
−0.058
(0.449)
−0.020
(0.388)
−0.014
(0.254)
0.010
(0.258)
0.064
(0.310)
0.075
(0.217)
FertilityBALNNP0.038
(0.0185)
0.030
(0.011)
0.036
(0.010)
0.027
(0.009)
0.036
(0.012)
0.038
(0.013)
0.055
(0.034)
0.034
(0.009)
0.017
(0.011)
0.027
(0.012)
0.036
(0.015)
0.028
(0.010)
0.043
(0.029)
0.036
(0.009)
Control0.037
(0.0167)
0.027
(0.008)
0.036
(0.009)
0.024
(0.007)
0.037
(0.012)
0.037
(0.005)
0.054
(0.029)
0.034
(0.006)
0.014
(0.009)
0.021
(0.008)
0.036
(0.016)
0.026
(0.008)
0.043
(0.019)
0.035
(0.007)
WESNNP64.171
(1.811)
62.474
(1.432)
63.955
(1.988)
62.383
(1.491)
64.454
(1.073)
62.642
(1.713)
64.755
(1.400)
62.966
(0.976)
64.239
(1.964)
61.868
(0.732)
64.114
(1.869)
62.505
(1.506)
64.428
(1.529)
62.333
(1.040)
Control64.212
(1.879)
61.993
(1.407)
63.961
(1.963)
61.841
(1.504)
64.492
(1.945)
61.767
(1.484)
65.119
(1.507)
62.747
(0.935)
63.996
(1.226)
62.074
(0.740)
64.109
(1.978)
61.915
(1.427)
64.741
(1.319)
62.390
(1.287)
DPRNNP250.754
(15.534)
267.656
(1.926)
256.290
(11.755)
267.967
(1.700)
248.358
(12.748)
266.094
(1.613)
229.700
(16.522)
268.242
(2.218)
252.659
(4.336)
266.759
(2.140)
250.609
(16.060)
267.692
(1.942)
251.405
(13.144)
267.491
(1.881)
Control251.669
(13.698)
267.554
(1.853)
257.858
(9.373)
267.785
(1.703)
245.210
(11.402)
265.950
(1.768)
232.400
(13.470)
268.946
(1.069)
252.289
(4.226)
266.020
(1.309)
251.097
(13.925)
267.626
(1.856)
254.079
(13.081)
267.330
(1.881)
Infant MortalityFOMNNP22.619
(15.698)
10.743
(11.192)
19.484
(13.155)
6.706
(5.456)
25.574
(9.487)
18.465
(14.524)
22.225
(14.409)
13.656
(12.021)
45.213
(27.682)
20.054
(6.885)
22.314
(16.956)
10.557
(11.832)
23.989
(7.940)
11.570
(7.869)
Control18.817
(10.837)
9.062
(9.519)
15.712
(7.436)
6.036
(5.438)
19.755
(7.044)
12.746
(5.567)
20.987
(9.662)
10.350
(6.976)
40.086
(19.251)
29.039
(23.575)
18.221
(11.129)
8.648
(9.894)
19.616
(6.484)
9.727
(5.377)
NEMNNP12.773
(8.582)
7.376
(5.237)
11.530
(7.127)
6.623
(5.547)
13.642
(4.634)
9.206
(2.797)
11.063
(6.679)
6.590
(2.799)
25.736
(16.823)
12.546
(7.146)
12.533
(9.248)
7.042
(4.518)
13.854
(4.464)
8.871
(7.605)
Control10.911
(6.225)
7.264
(4.776)
9.516
(4.569)
6.721
(5.116)
12.454
(4.922)
7.623
(3.614)
10.255
(4.686)
7.529
(4.004)
21.689
(12.146)
10.440
(4.721)
10.525
(6.353)
7.260
(5.104)
11.725
(3.737)
7.013
(2.763)
POMNNP9.845
(8.585)
6.107
(6.366)
7.954
(7.711)
5.081
(5.777)
11.932
(6.483)
6.708
(3.687)
11.162
(8.307)
7.137
(5.647)
19.478
(12.620)
12.258
(12.572)
9.781
(9.251)
6.322
(6.850)
10.135
(4.621)
5.144
(3.388)
Control7.906
(6.165)
5.165
(9.064)
6.196
(4.136)
3.316
(3.074)
7.302
(3.263)
5.264
(1.790)
10.732
(6.392)
3.966
(3.780)
18.397
(11.854)
16.011
(14.374)
7.700
(6.392)
5.312
(10.051)
7.891
(3.809)
4.462
(1.881)
SOCIO-ECONOMICILLNNP0.166
(0.098)
0.104
(0.061)
0.146
(0.085)
0.094
(0.055)
0.248
(0.136)
0.139
(0.079)
0.135
(0.034)
0.084
(0.026)
0.242
(0.101)
0.165
(0.070)
0.163
(0.098)
0.105
(0.063)
0.180
(0.102)
0.101
(0.050)
Control0.163
(0.087)
0.103
(0.054)
0.135
(0.068)
0.087
(0.039)
0.235
(0.095)
0.131
(0.057)
0.143
(0.050)
0.082
(0.024)
0.302
(0.065)
0.214
(0.052)
0.159
(0.085)
0.102
(0.054)
0.174
(0.093)
0.101
(0.053)
UBNNNP35.791
(24.141)
26.016
(18.158)
25.718
(16.004)
18.813
(12.127)
44.429
(13.560)
36.019
(18.497)
54.342
(30.795)
31.968
(16.187)
66.876
(29.170)
56.534
(21.877)
35.420
(24.860)
25.518
(18.516)
37.462
(20.924)
28.254
(16.574)
Control35.661
(22.535)
25.213
(18.099)
24.665
(11.460)
16.534
(10.717)
51.676
(19.476)
37.586
(17.553)
47.542
(25.321)
31.678
(14.499)
74.420
(24.111)
59.907
(12.058)
34.343
(21.814)
24.184
(17.859)
37.342
(20.811)
26.606
(15.148)
ININNP0.827
(0.085)
0.826
(0.090)
0.815
(0.070)
0.809
(0.067)
0.896
(0.076)
0.841
(0.081)
0.763
(0.075)
Control0.834
(0.099)
0.833
(0.105)
0.828
(0.075)
0.791
(0.080)
0.935
(0.038)
0.843
(0.096)
0.785
(0.097)
PCINNP 0.011
(0.008)
0.011
(0.004)
0.010
(0.006)
0.015
(0.018)
0.005
(0.003)
0.011
(0.009)
0.011
(0.004)
Control 0.019
(0.041)
0.013
(0.007)
0.012
(0.014)
0.044
(0.090)
0.005
(0.004)
0.020
(0.045)
0.015
(0.011)
Table 4. Change in the differences between the NNP and control municipalities between 2005 and 2018. + means that, in relation to the controls, a negative effect for the NNP disappeared or a positive one appeared; − means that a positive effect disappeared, or a negative effect appeared; = means the effect was maintained; ∅ means no effect observed.
VariableCOLOMBIAANDESCARIBBEANAMAZON-ORINOQUIAPACIFICLOW INTENSITYHIGH INTENSITY
BiodemographicPopulation structureAGR===
MMA==
ICG
FertilityBAL
WES++++
DPR
Infant mortalityFOM++++
NEM++
POM+
Socio-economic ILL
UBN
INI *
PCI *
* The INI and PCI data are only available for one of the two censuses, so the evolution of these two variables could not be analysed.
Publisher’s Note: MDPI stays neutral with regard to jurisdictional claims in published maps and institutional affiliations.

