Abstract
The production and utilization of fertilizers are processes with known and noteworthy environmental impacts. Direct greenhouse gas (GHG) emissions and a high contribution to water eutrophication due to the nitrogen (N) and phosphorus (P) derivatives are some of the most crucial impacts derived from the overall life cycle of fertilizer use. The life cycle assessment (LCA) has been reliable and analytical tool for the identification, quantification, and evaluation of potential environmental impacts of fertilizers related to the products, production processes, or activities throughout their lifecycle. In this paper, a gate-to-gate LCA approach was applied in order to identify and evaluate the impacts derived from the production processes of nitrate and compound fertilizers the production industry in Northeastern Greece. The results from this study prove that compound fertilizers have a greater impact compared with nitrate fertilizers, contributing up to 70% of the total production impacts. Furthermore, climate change, freshwater eutrophication, and fossil fuel depletion were identified as the most crucial impact categories. Finally, a comparison with relevant LCA studies was conducted, in order to identify the possibility of a consistency pattern of the fertilizer production impacts in general.
1. Introduction
In today’s global economy and consumption needs, chemicals play a vital role as there is no single economic sector where chemicals are not being used. Industries that produce and utilize chemicals have a significant impact on the world’s economy, as the chemical industry is a sector with notable economic growth, providing numerous work positions [1].
The chemical industrial sector includes companies that convert raw materials into different products, which can be classified into the following categories [2]:
- (i)
- The basic chemicals industry, which, besides the production of fertilizers, is responsible for the production of chemicals such as polymers, bulk petrochemicals, and basic industrial inorganic chemicals. Basic chemicals are generally produced in large quantities and are typically inexpensive.
- (ii)
- The life sciences industry, including differentiated chemicals and biological substances, pharmaceuticals, diagnostics, animal health products, vitamins, and crop protection chemicals. These products are usually produced with very high specifications and are closely monitored by government agencies.
- (iii)
- The specialty chemicals (fine chemicals) industry, producing electronic chemicals, industrial gases, adhesives, and sealants, as well as, coatings, industrial and institutional cleaning chemicals, and catalysts.
The fertilizer industry (FI), as part of the basic chemicals industry, has a crucial impact on the global economy. In 2018, FI directly employed around 964,000 employees, with East Asia being responsible for approximately two thirds of the global employment status. Furthermore, the sales revenue of FI in 2018 was estimated to be around $150 billion, which is approximately up to 6% of the total sales of the chemical industry sector. Nitrate fertilizers are responsible for almost half of this sales revenue, followed by phosphate fertilizers (Figure 1) [3].

Figure 1.
Sales revenue of the fertilizer industry in 2018 [3].
Besides the importance for the global economic sector, the production of fertilizers could have a significant impact on the environment, mostly because of the significant amount of energy and natural gas needed for the production processes. According to the data from the European Commission, FI is responsible for the consumption of 2–3% of the total global energy, most of which is used for the production of nitrate fertilizers. This amount of energy and natural gas consumption is used during the intermediate stage of ammonia production [4]. In specific countries, this percentage could be even higher, e.g., in Sweden, chemical fertilizer production and use accounts for up to 20% of the total energy consumed for agricultural purposes [5].
In this paper, the environmental impacts of a FI in Northeastern (NE) Greece are assessed alongside the application of the life cycle assessment (LCA) principles. LCA was developed as an analytical tool, and has become an increasingly common method for the identification and evaluation of potential environmental impacts related to the products, production processes, or activities [6,7,8]. Impact assessment in LCA traditionally focuses on environmental impacts that derive from emissions, wastes, resource use, and energy consumption, and impacts are categorized by practitioners in global warming potential (GWP), eutrophication, stratospheric ozone depletion, photo oxidant formation, resource use, land use, and others [9]. Moreover, nowadays, LCA is considered one of the best approaches for sustainability assessment in different industrial sectors [10].
LCA is considered an appropriate tool to assess the environmental impacts of the fertilizer production processes. It has been characterized as a suitable method of assessment, as it takes into consideration all of the relevant impacts derived through the entire life cycle of production, in addition to assessing potential environmental improvements [11]. From several LCA studies [12,13], it is evident that fertilizers are responsible for high emissions to the environment, especially those associated with greenhouse gases (GHG), although most available LCA studies do not focus on fertilizer production, instead they consider their use and effects in the agricultural sector. Besides GHG emissions, fertilizers have been linked with impacts such as nitrate leaching into ground water, toxic heavy metal pollution of soils, and aquatic eutrophication due to the use of nitrogen and phosphorus [14].
The selection of efficient raw materials is a means to mitigate the environmental impacts resulting from the production of fertilizers. Decreasing the nitrogen and phosphorus content of fertilizers may result in significantly lower impacts regarding GHG emissions, as well as resource depletion [11]. Furthermore, both nitrogen and phosphorus fertilizers have a low efficiency during their use phase. This fact means that nitrogen and phosphorus derived from fertilizers are not completely absorbed by plants or crops, and thus relatively high amounts of nitrogen and phosphorus are collected in the soil and are lost to the environment [14]. A relevant study has shown that only 30–35% of the total nitrogen was absorbed by plants, while the rest ended up in the environment, causing significant impacts [15].
Thus, taking into consideration all of the above, in this paper, we attempt to assess and quantify the environmental impacts from the fertilizer industry, while focusing solely on fertilizer production and its direct impacts on the environment. The examined fertilizer production industry (FPI) in this study is currently the only remaining industry associated with fertilizer production in Greece. Its operation began in 1965 in the industrial zone of Kavala, NE Greece (Figure 2), and covers an approximate area of 2.600 Ha. Currently, five production units are in operation (Table 1).
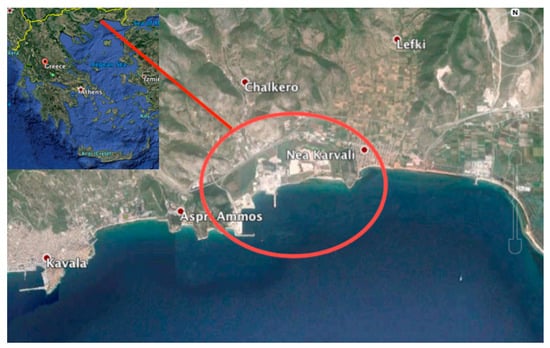
Figure 2.
Location of the operating facilities.

Table 1.
Production units and final product quantities of fertilizer production industry (FPI).
2. Materials and Methods
In this paper, the gate-to-gate LCA approach was adopted, with the employment of relevant software (Simapro 7.2). The guidelines and specific requirements of the International Organization for Standardization (ISO) were followed, and more specifically, the principles of the ISO 14040 standard. The aim of this study is to identify and assess the cumulative environmental impacts of fertilizer production, while in parallel, to compare the impacts between nitrate and compound fertilizers.
2.1. Scope of the Study and Functional Unit
The overall framework of this paper can be divided into four parts:
- Quantification of environmental impacts from the specific fertilizer production industry.
- Comparative impacts from the fertilizer production industry.
- Comparative impacts from each type of fertilizer.
- Comparison with relevant LCA studies on fertilizers.
Based on these findings, a number of auxiliary actions promoting sustainable development and greening the industrial facilities will be discussed.
A gate-to-gate approach was used, taking into consideration all of the production processes, from the entrance of the raw materials to the plant, up to the production of the final product. This means that the inputs of the system include energy and water consumption, and raw materials for all stages of production and for every production unit, as well as for the final outputs of the system, which are the final produced fertilizers. Overall, according to the goals of the study, all production processes taking place within the fertilizer plant are included. The boundaries of the study are presented in Figure 3. The transportation of final products to consumers and the use of the fertilizers are not included, as the study focuses merely on the environmental impacts of the production stage.

Figure 3.
Boundaries of the life cycle assessment (LCA) study.
The functional unit set was the final production of fertilizers for one year (253 kt of nitrate fertilizers and 508 kt of compound fertilizers). Furthermore, based on the final results, a comparison between the impacts per tonne of nitrate and compound fertilizers was conducted, in an attempt to quantify the impacts derived from each type of fertilizer produced within the industrial facilities.
2.2. Inventory Analysis
2.2.1. Data Acquisition
The input data used for this particular study were obtained from the study accompanying the approved environmental terms of the FPI [16]. The approved environmental terms contain all of the primary data describing the production processes within the facilities of the FPI. Background data regarding the extraction of specific first raw materials and transportation to the facilities were obtained from the Ecoinvent database.
2.2.2. Life Cycle Inventory (LCI)
The LCI data for FPI are summarized in Table 2 (for each production process). All data are based on the production of the year, with the maximum production of the last 15 years. The annual production of nitrate fertilizers was approximately 253 kt, while the annual production of compound fertilizers was approximately 508 kt [17].
Table 2.
Life cycle inventory data for nitrate and compound fertilizer production [16].
2.3. Impact Assessment
The data collected to develop the LCI were translated into potential human health and environmental impacts. In this study, the ReCiPe 2008 method was applied. ReCiPe 2008 offers the ability to assess systems and processes by using both midpoint (targeting the environmental mechanisms) and endpoint (targeting the impact) indicators. The overall objective of the ReCiPe method implementation is to translate the list of LCI results into a number of indicator scores, expressing the relative severity on an environmental impact category. These indicators are determined at two levels: 18 midpoint indicators and 3 endpoint indicators, which are presented in Table 3.
Table 3.
Impact categories and category indicators.
For the interpretation of the results, the ReCiPe method was selected. ReCiPe is a life cycle impact assessment method that transforms the data from the life cycle inventory into tangible results. It was selected because it includes a broad set of impact categories, and it is widely used in similar studies [18]; however, as with every impact assessment method, there are some compromises. ReCiPe, in particular, lacks a quantitative assessment for terrestrial and aquatic eutrophication and acidification. In addition, the normalization process in ReCiPe is performed partially [19], yet it still functions within the acceptable range set by ISO standards.
Concerning the endpoint indicators, ReCiPe is aimed at damage assessment, deriving from the respective environmental impacts. The results are reflected in eleven impact categories, which, through the use of weighting factors, are finally organized in three parent categories of damage, namely [20]:
- Damage to human health, which is expressed as the sum of years lost and the years that someone lives in disability. This sum is expressed by the DALY (disability adjusted life years) indicator from the World Bank and the World Health Organization.
- Damage to ecosystem diversity, which is expressed as losses of species in a specific geographic location, during a specific time period.
- Damage to resource availability, which is expressed as the extra energy needed for the future extraction of minerals and fossil fuels.
3. Results
The results from the implementation of the ReCiPe midpoint method are summarized in Table 4. Examining the impact ratio of nitrate/compound per tonne, it becomes evident that in most of the impact categories, the production of compound fertilizers has higher impacts than the production of nitrate fertilizers. This fact changes in some impact categories. The most significant impact regarding nitrate fertilizers in comparison to compound fertilizers is in fossil resource depletion. This is because nitrate fertilizers use high amounts of energy and natural gas, contributing to fossil fuel depletion [21]. On the other hand, the most significant impact regarding compound fertilizers in comparison with nitrate fertilizers is agricultural and urban land occupation. This is because phosphate and compound fertilizers contain elements that are the cause of environmental problems. Studies have shown that phosphate and compound fertilizers have an increased concentration of some metals (e.g., cadmium), which could potentially be harmful for soil resources [22].
Table 4.
Impact assessment using the ReCiPe midpoint method.
According to the results presented in Table 4, it can be inferred that the Global Warming Potential (GWP) of the FPI, which is approximately 628 kt CO2eq, is relatively high and comparable, for instance, to the carbon footprint of the nearby Municipality of Kavala, where the total emissions of GHG are 571 kt of CO2eq [23]. The approximate amount of 628 kt of CO2eq emitted to the atmosphere during the production stages of nitrate and compound fertilizers is mostly CO2, because of the extensive use of fossil fuels in the ammonia production unit and N2O, which is usually produced during the production of nitric acid, serving as a first raw material for the production of ammonium nitrate [11].
In order to facilitate the comparison and interpretation of the results, a normalization step was applied to our results, as shown in Table 4. The normalization step in the ReCiPe method is based on the report of Sleeswijk et al. [24], and recalculates the results per citizen as a common reference impact. This means that the scores for each impact category are all compared to the annual impact of an average European person, which is 1 kpts. In our case, for example, the impact of the total production to freshwater eutrophication is 2.800 Kpts, which is equivalent to the impact of 2.800 average European people. The normalized results are presented in Figure 4. The greater impacts are related to freshwater and marine environments. Freshwater eutrophication and marine ecotoxicity are by far the categories with the highest impacts, followed by freshwater ecotoxicity and natural land transformation.
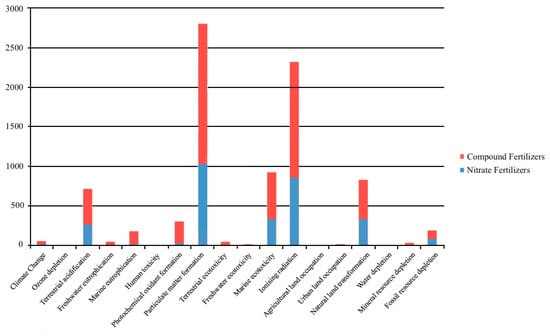
Figure 4.
Results using the ReCiPe midpoint method after normalization (for the total production, expressed in Kpts, where 1 Kpt is the impact of an average European person).
These high impacts on freshwater and marine environments can be explained through the composition of the specific fertilizers produced. Nitrogen and phosphorus are the core materials for nitrate and compound fertilizers. These two nutrients, however, play a crucial role in the eutrophication of water bodies as well. The enrichment of water environments with nutrients, especially nitrogen and phosphorus, may lead to an undesirable disturbance to the balance of organisms present in the water and to the quality of the water [25].
The contribution of each process to the final fertilizer production is presented in Figure 5, using the ReCiPe endpoint method. Compound fertilizers are responsible for up to approximately 70% of the total impacts, resulting from the amount of processes and first raw material needed for their production.

Figure 5.
Schematic contribution of processes using the ReCiPe endpoint method (left: per tonne of compound fertilizer, right: per tonne of nitrate fertilizer).
The ammonia production unit’s contribution to the final impact is among the highest for the production of both types of fertilizers. One of the reasons for this specific result is the high amount of natural gas and energy consumption. As seen in Table 2, the ammonia production unit consumes large quantities of electricity and requires significant quantities of natural gas as a raw material for the production of anhydrous ammonia. This could potentially raise questions regarding the economic and environmental sustainability of the ammonia production unit, which is a worldwide phenomenon. Globally, the production process of ammonia is responsible for roughly 1% of the global energy consumption (approximately 5.6 × 10²⁰ J/year) [26], which has led to the need for finding new alternative ways of producing ammonia (e.g., processes at atmospheric pressure and relatively low temperatures, as described by McEnaney et al. 2017) [27].
The results from the endpoint analysis are summarized in Table 5. Damage to human health and ecosystems caused by fertilizer production is mostly attributed to climate change, while fossil depletion is responsible for the damage to resources category.
Table 5.
Results using the ReCiPe endpoint analysis (maximum annual production).
In order for these results to be easier to understand, the ReCiPe endpoint single score method was used. In it, score, characterization, damage assessment, normalization, and weighting are combined. Although there have been a lot of arguments against using a single score, as it is not always suitable for the life cycle inventory assessment (LCIA; such as the lack of transparency in the value choices that are deployed), the use of single score analysis, combined with midpoint and endpoint indicators, can assist in a better interpretation of the results [28]. In Figure 6, the single score results for both the total production and per tonne of produced fertilizer are presented. The compound fertilizers are responsible for most of the impacts, in both the total production and per tonne of produced fertilizer, proving a consistency in results using the midpoint and endpoint methods. In total, damage from fertilizer production is more intense in human health, mostly because of the climate change and human toxicity impact categories, and in the resources category because of the fossil depletion (results that are consistent with endpoint damage assessment).

Figure 6.
Single score results using the ReCiPe endpoint method.
4. Discussion
Comparing this LCA study to other LCA studies regarding the production of different fertilizer types, we can verify that the results seems to be consistent. Hasler et al. [11], in a relevant LCA study, selected five key impact categories to investigate as the most associated in fertilizer production. Among these categories were climate change, freshwater eutrophication, and fossil fuel depletion, categories that have showed greater impacts in this study. The impact category for climate change, associated with GHG emissions, was proven to have significant importance, mostly because of the CO2 emissions (mainly from fossil fuels used in ammonia production and in the reaction of phosphorite with sulfuric acid [6]) and N2O emissions, derived during the production of nitric acid, which is used in nitrate fertilizers and ammonium nitrate production [11,29].
Specifically regarding GHG emissions per tonne of produced fertilizers, there are not a lot of case studies available. Most of the relevant literature focuses on the use of fertilizers and the overall impacts of the agricultural sector. Some available results are compared with our own case study in Table 6.
Table 6.
Comparison with results from relevant case studies.
The results from the available relevant case studies further validate the results from this study, as for the case of both nitrate and compound fertilizers, our results are within the range discussed in the literature. A significant observation is the notable lower result for potash fertilizers; although these are the results of one study, hence further examination is needed in order to assess the overall impacts compared with different fertilizer types.
The high energy intensity of nitrate fertilizer production is considered to be responsible for the high impact on fossil fuel depletion. In the production of nitrate fertilizers, a significant amount of oil equivalent is needed, mostly from natural gas, during ammonia production. Furthermore, the process where nitrogen is transformed into ammonia is proven to require more than 1% of all of the energy produced worldwide, contributing significantly both to fossil fuel depletion and GHG emissions [33,34]. An idea for resolving the dependency of fertilizer production on fossil fuels is the use of biogas; however, this solution also comes with the burden of increasing the impact on acidification and eutrophication, as presented by Ahlgren et al. in 2010 [35].
5. Conclusions
Fertilizers production is known to have significant environmental impacts throughout the whole cycle of the production stages. The purpose of this LCA study was to determine the total environmental impacts derived from fertilizer production, and to compare the impacts from nitrate and compound fertilizers separately. A case study of an operating fertilizer industry in Greece was selected. This study showcased that compound fertilizer production has higher environmental impacts compared with nitrate fertilizer production, because compound fertilizer production utilizes a wider number of raw materials, as well as materials that are produced through other production processes and/or units within the fertilizer industry. Regarding specific production stages, the ammonia production unit that, in our case, operates within the facilities, supplying ammonia as a raw material both for nitrate and compound fertilizer production, is proven to have significant contributions to the total environmental impact profile, because of its high energy intensity and the relatively high amounts of natural gas required.
As far as the impacts derived from production, the global warming potential is relatively high, with emissions of approximately 630 kt of CO2eq. This high number of GHG emissions, mostly CO2 and N2O, can be explained by the use of fossil fuels in ammonia production and during the production of nitric acid, used as the first raw material for nitrate fertilizers and ammonium nitrate. Furthermore, as expected, because of the use of nitrogen and phosphorus derivatives, freshwater eutrophication and ecotoxicity are issues that should be taken into consideration for the local water environment. Finally, using the endpoint analysis, we have seen a significant impact in resources depletion, mostly fossil fuel depletion, resulting from the high energy intensity of the production stages (especially in the ammonia production unit).
In conclusion, the goal of this study was to develop an accurate LCA model, describing nitrate and compound fertilizer production as a whole, and identifying and evaluating the potential environmental impacts. The results presented can serve as a starting point for the general consideration of optimizing the production stages of fertilizer production in a more sufficient and sustainable matter. It is proposed that future research broadens the boundaries of the LCA model in a cradle-to-grave approach, in order to assess the overall environmental performance of the fertilizers (both production and use). Under the specific framework, issues such as the consumption and performance efficiency of different types of fertilizers should be considered. As the production of fertilizers has been proven to have high demands on energy and raw materials, as well as emitting significant amounts of GHG, the incorporation of symbiotic activities and the establishment of an industrial symbiosis network in the area of our case study is something worth examining in order to minimize resource consumption and emissions.
Author Contributions
Conceptualization, G.G.; Investigation, G.G. and I.K.; Visualization, I.K.; Writing—original draft, G.G. and I.K.; Writing—review & editing, G.G. All authors have read and agreed to the published version of the manuscript.
Funding
This research received no external funding.
Data Availability Statement
Data available in a publicly accessible repository that does not issue DOIs. Publicly available datasets were analyzed in this study. This data can be found to Reference No.16: https://diavgeia.gov.gr/decision/view/4ΑΣΠΥ-Ρ0Κ.
Conflicts of Interest
The authors declare no conflict of interest.
References
- UNEP. Global Chemicals Outlook, Towards Sound Management of Chemicals; Synthesis Report for Decision-Makers; United Nations Environment Programme: Nairobi, Kenya, 2007; ISBN 978-92-807-3275-7. [Google Scholar]
- Leikmuhler, H.J. Trends in Energy and CO2 Reduction in the Chemical Process Industry. In Managing CO2 Emissions in the Chemical Industry; Leikmuhler, H.J., Ed.; Wiley-VCH Veriag & Co. KGaA: Weinheim, Germany, 2010; pp. 4–28. [Google Scholar]
- International Fertilizers Association. Global Sustainability Report 2019. Available online: https://www.fertilizer.org/public/resources/publication_detail.aspx?SEQN=5880&PUBKEY=E5784199-99B4-4DCF-B2D1-B286D65AB905 (accessed on 10 December 2020).
- Basosi, R.; Spinelli, D.; Fierro, A.; Jez, S. Mineral Nitrogen Fertilizers: Environmental Impact of Production and Use. In Fertilizers: Components, Uses in Agriculture and Environmental Impacts, 1st ed.; Lopez-Valdez, F., Luqueno, F.F., Eds.; NOVA Science Publishers: Hauppage, NY, USA, 2014; Chapter 1; pp. 3–43. [Google Scholar]
- Spångberg, J.; Hansson, P.-A.; Tidåker, P.; Jónsson, H. Environmental impact of meat meal fertilizer vs. chemical fertilizer. Resour. Conserv. Recycl. 2011, 55, 1078–1086. [Google Scholar] [CrossRef]
- Skowrońska, M.; Filipek, T. Life cycle assessment of fertilizers: A review. Int. Agrophys. 2014, 28, 101–110. [Google Scholar] [CrossRef]
- Norgate, T.E.; Jahanshahi, S.; Rankin, W.J. Assesing the environmental impact of metal production processes. J. Clean. Prod. 2007, 15, 838–848. [Google Scholar] [CrossRef]
- Hauschild, M.; Jeswiet, J.; Alting, L. From Life Cycle Assessment to Sustainable Production: Status and Perspectives. CIRP Ann. 2005, 54, 1–21. [Google Scholar] [CrossRef]
- Gaidajis, G.; Angelakoglou, K. Screening life cycle assessment of an office used for academic purposes. J. Clean. Prod. 2011, 19, 1639–1646. [Google Scholar] [CrossRef]
- Finnveden, G.; Hauschild, M.; Ekvall, T.; Guinée, J.; Heijungs, R.; Hellweg, S.; Koehler, A.; Pennington, D.W.; Suh, S. Recent developments in Life Cycle Assessment. J. Environ. Manag. 2009, 91, 1–21. [Google Scholar] [CrossRef]
- Hasler, K.; Broring, S.; Omta, S.; Olfs, H.-W. Life cycle assessment (LCA) of different fertilizer product types. Eur. J. Agron. 2015, 69, 41–51. [Google Scholar] [CrossRef]
- Khoshnevisan, B.; Rafiee, S.; Omid, M.; Yousefi, M.; Movahedi, M. Modeling of energy consumption and GHG (greenhouse gas) emissions in wheat production in Esfahan province of Iran using artificial neural networks. Energy 2013, 52, 333–338. [Google Scholar] [CrossRef]
- Cellura, M.; Longo, S.; Mistretta, M. Life Cycle Assessment (LCA) of protected crops: An Italian case study. J. Clean. Prod. 2012, 28, 56–62. [Google Scholar] [CrossRef]
- Chien, S.H.; Pronchnow, L.I.; Cantarella, H. Chapter 8 Recent Developments of Fertilizer Production and Use to Impove Nutrient Efficiency and Minimize Environmental Impacts. In Advances in Agronomy; Elsevier: New York, NY, USA, 2009; Volume 102, pp. 267–322. [Google Scholar]
- Fan, P.X.; Li, F.; Liu, F.; Kumar, D. Fertilization with a New Type of Coated Urea: Evaluation for Nitrogen Efficiency and Yield in Winter Wheat. J. Plant Nutr. 2004, 27, 853–865. [Google Scholar] [CrossRef]
- Greek Ministry of Environment and Enegy. Approval of Environmental Terms of Fertilizers Production Plant in Nea Karvali, Kavala. Available online: https://diavgeia.gov.gr/decision/view/4ΑΣΠΥ-Ρ0Κ (accessed on 27 November 2020).
- Kakanis, I. Industrial Symbiosis and Eco-Industrial Park Development—A case study in the area of Nea Karvali, Kavala. Bachelor’s Thesis, Democritus University of Thrace Department of Production and Management Engineering, Xanthi, Greece, 24 November 2014. [Google Scholar]
- Huang, B.; Zhao, J.; Chai, J.; Xue, B.; Zhao, F.; Wang, X. Environmental influence assessment of China’s multi-crystalline silicon (multi-Si) photovoltaic modules considering recycling process. Sol. Energy 2017, 143, 132–141. [Google Scholar] [CrossRef]
- Amani, P. Environmental impact assessment in a food network. In Regional Environmental Life Cycle Assessment for Improving Food Chain Sustainability; Springer Science and Business Media LLC: Wiesbaden, Germany, 2012; pp. 9–46. [Google Scholar]
- Dong, Y.H.; NG, S.T. Comparing the midpoint and endpoint approaches based on ReCiPe-a study of commercial buildings in Hong Kong. Int. J. Life Cycle Assess. 2014, 19, 1409–1423. [Google Scholar] [CrossRef]
- Eurostat. Agri-Environmental Indicator—Mineral Fertilizer Consumption. Available online: http://ec.europa.eu/eurostat/statistics-explained/index.php/Agri-environmental_indicator_-_mineral_fertiliser_consumption (accessed on 27 November 2020).
- Lenka, S.; Rajendiran, S.; Coumar, V.; Dotaniya, M.; Saha, J. Impact of Fertilizers use on Environmental Quality. In Proceedings of the Environmental Concern for Fertilizer Use in Future, Kalyani, India, 26 February 2016. [Google Scholar]
- Municipality of Kavala. Sustainable Energy Action Plan. Submitted for the Covenant of Mayors. Available online: https://www.covenantofmayors.eu/about/covenant-community/signatories/action-plan.html?scity_id=13952 (accessed on 27 November 2020).
- Sleeswijk, A.W.; van Oers, L.F.; Guinée, J.B.; Huijbregts, M.A.J. Normalization in product life cycle assessment: An LCA of the global and European economic systems in the year 2000. Sci. Total Environ. 2007, 390, 227–240. [Google Scholar] [CrossRef] [PubMed]
- European Commission. Eutrophication and Health. Report from World Health Organization Regional Office for Europe. Available online: https://ec.europa.eu/environment/water/water-nitrates/pdf/eutrophication.pdf (accessed on 27 November 2020).
- U.S. Department of Energy. Sustainable Ammonia Synthesis. Exploring the Scientific Challenges Associated with Discovering Alternative, Sustainable Processes for Ammonia Production. Available online: https://science.osti.gov/-/media/bes/pdf/reports/2016/SustainableAmmoniaReport.pdf?la=en&hash=893E6E2A17E7108968F2CBF6630FD7DCF5D47B95 (accessed on 27 November 2020).
- McEnaney, J.M.; Singh, A.R.; Schwalbe, J.A.; Kibsgaard, J.; Lin, J.C.; Cargnello, M.; Jaramillo, T.; Nørskov, J.K. Ammonia synthesis from N2 and H2O using a lithium cycling electrification strategy at atmospheric pressure. Energy Environ. Sci. 2017, 10, 1621–1630. [Google Scholar] [CrossRef]
- Kägi, T.; Dinkel, F.; Frischknecht, R.; Humbert, S.; Lindberg, J.; De Mester, S.; Ponsioen, T.; Sala, S.; Schenker, U.W. Midpoint, endpoint or single score for decision-making? Int. J. Life Cycle Assess. 2015, 21, 129–132. [Google Scholar] [CrossRef]
- Brentrup, F.; Küsters, J.; Lammel, J.; Barraclough, P.; Kuhlmann, H. Environmental impact assessment of agricultural production systems using the life cycle assessment (LCA) methodology II. The application to N fertilizer use in winter wheat production systems. Eur. J. Agron. 2004, 20, 265–279. [Google Scholar] [CrossRef]
- Dziuba, K.; Todorow, M.; Kowalik, A.; Góra, R.; Bojanowicz-Bablok, A.; Kijeńska, M.; Tokarz, L.; Barański, A.; Gworek, B. Carbon footprint in fertilizer production as a tool for reduction of GHG emissions. In Proceedings of the 22nd SETAC Europe LCA Case Study Symposium, Montpellier, France, 20–22 September 2016. [Google Scholar]
- Kobayashi, H.; Sago, R. A Study on Life Cycle Assessment of Energy Consumption and CO2 Emissions in the Manufacturing and Transportation Processes of Nitrogen and Phosphate Fertilizers. Jpn. J. Farm Work. Res. 2001, 36, 141–151. [Google Scholar] [CrossRef][Green Version]
- Brentrup, F.; Pallière, C. GHG emissions and energy efficiency in European nitrogen fertilizer production and use. In Proceedings of the International Society Conference, Cambridge, UK, 7–9 December 2008. [Google Scholar]
- Uekoetter, F.; Smil, V. Enriching the Earth. Fritz Haber, Carl Bosch, and the Transformation of World Food Production. Environ. Hist. 2002, 7, 532–533. [Google Scholar] [CrossRef]
- Krüger, O. Recycled fertilizers: Do we need new regulations and analytical methods? Waste Manag. 2016, 50, 1–2. [Google Scholar] [CrossRef] [PubMed]
- Ahlgren, S.; Bernesson, S.; Nordberg, A.; Hansson, P.-A. Nitrogen fertilizer production on biogas—Energy input, environmental impact and land use. Bioresour. Technol. 2010, 101, 7181–7184. [Google Scholar] [CrossRef] [PubMed]


Publisher’s Note: MDPI stays neutral with regard to jurisdictional claims in published maps and institutional affiliations. |
© 2020 by the authors. Licensee MDPI, Basel, Switzerland. This article is an open access article distributed under the terms and conditions of the Creative Commons Attribution (CC BY) license (http://creativecommons.org/licenses/by/4.0/).