Article

Sustainable Additive Manufacturing: Mechanical Response of Polypropylene over Multiple Recycling Processes

by
Nectarios Vidakis
1,
Markos Petousis
1,*,
Lazaros Tzounis
2,
Athena Maniadi
3,
Emmanouil Velidakis
1,
Nicolaos Mountakis
1,
Dimitrios Papageorgiou
4,
Marco Liebscher
5,* and
Viktor Mechtcherine
5
1
Mechanical Engineering Department, Hellenic Mediterranean University, 71410 Heraklion Crete, Greece
2
Department of Materials Science and Engineering, University of Ioannina, 45110 Ioannina, Greece
3
Department of Materials Science and Technology, University of Crete, 70013 Heraklion Crete, Greece
4
School of Engineering and Materials Science, Queen Mary University of London, London E1 4NS, UK
5
Institute of Construction Materials, Technische Universität Dresden, DE-01062 Dresden, Germany
*
Authors to whom correspondence should be addressed.
Sustainability 2021, 13(1), 159; https://doi.org/10.3390/su13010159
Submission received: 5 December 2020 / Revised: 18 December 2020 / Accepted: 22 December 2020 / Published: 25 December 2020

Abstract

:
The recycling of polymeric materials has received a steadily growing scientific and industrial interest due to the increase in demand and production of durable and lightweight plastic parts. Recycling of such materials is mostly based on thermomechanical processes that significantly affect the mechanical, as well as the overall physicochemical properties of polymers. The study at hand focuses on the recyclability of Fused Filament Fabrication (FFF) 3D printed Polypropylene (PP) for a certain number of recycling courses (six in total), and its effect on the mechanical properties of 3D printed parts. Namely, 3D printed specimens were fabricated from non-recycled and recycled PP material, and further experimentally tested regarding their mechanical properties in tension, flexion, impact, and microhardness. Comprehensive dynamic scanning calorimetry (DSC), thermogravimetric analysis (TGA), Raman spectroscopy, and morphological investigations by scanning electron microscopy (SEM) were performed for the different 3D printed PP samples. The overall results showed that there is an overall slight increase in the material’s mechanical properties, both in tension and in flexion mode, while the DSC characterization indicates an increase in the polymer crystallinity over the recycling course.

1. Introduction

According to a research report, approximately 360 million tons of plastic product parts are manufactured globally, due to the increasing demand of durable and lightweight parts [1]. Moreover, due to poor waste management, more than 9 billion tons of plastic and plastic byproducts end up in the environment annually [1,2,3,4]. Breaking down those numbers to the core, polyolefin resins, such as High-Density Polyethylene (HDPE), Polystyrene (PS), Polypropylene (PP) and Polyethylene Terephthalate (PET) are the ones mostly used to produce the aforementioned plastic parts. Moreover, literature reports that PP demand was the highest in Europe, when compared to other plastics, with over 10 million tons sold in 2019 [4]. The overall recycling market in 2020 has reached 72.6 billion dollars, while the 4.0% belongs to PP with an estimated value of 2.9 billion dollars [5] (Figure 1).
Nowadays there is also a high demand for personalized, lightweight and at the same time durable parts that could be manufactured in a fast and flexible, versatile, and low-cost production process. Fused Filament Fabrication (FFF) is one of the few 3D printing techniques that can cover all these demands in one manufacturing process [6]. Regarding the 3D printing of thermoplastics and recycled thermoplastics, there are a few studies available that focus on the overall properties and durability of FFF specimens [7,8,9], while studies on recycled Additive Manufacturing (AM) of PP with a special focus on the resulting 3D printed objects’ mechanical properties are limited [10,11,12,13,14,15,16,17,18,19,20,21,22,23]. Moreover, there is only one research article available on the recyclability of PP through extrusion and FFF over multiple recycling courses [10], yet with limited tests and further experimental explanation/evaluation of the findings.
Polypropylene (PP) belongs to the polyolefin group of polymeric thermoplastic materials, produced mainly from oil and natural gas by a process of polymerization of ethylene and propylene, respectively. Amongst other polyolefin-based thermoplastics i.e., HDPE, LDPE, PE, and PS, PP is the most widely used semicrystalline polymer in industry, owing to its exceptional mechanical properties, as well as processability, affordability [23], and recyclability [10].
As stated before, around 90% of plastics globally are based on thermoplastic polymers like PE and PP, while yet little is known regarding the physicochemical properties of 3D printing manufactured parts consisting of these semi-crystalline polyolefin thermoplastics. Changes in their properties due to the manufacturing process are most specifically attributed to the crystallization mechanism of these materials as suggested by the relevant literature [23,24]. The crystallization of these polymers is causing thermal shrinkage and warpage upon cooling of the melt [23,24], thus making 3D printing considerably more challenging, as it affects the adhesion of the deposited layers on to the build plate. Additionally, this affects the bonding between adjacent filament strands and layering interfusion, rendering the deposition of these materials almost impossible or with a great number of structural defects, thus hampering the bulk printed objects performance.
Another important factor that should be considered in a sustainable process, apart from the recycling process protocol that has been mainly addressed in the current study, is the well-known sustainability assessment module [25]. Relatively, there are some major Key Performance Indicators (KPIs) for that; for instance: (i) Social pillar related KPIs, such as work quality, health and safety, social impact, etc.; (ii) Economic pillar related KPIs such as cost, return on investment (ROI), capital expenditures (CAPEx), use of renewables, etc.; (iii) Environmental related KPIs e.g., energy consumption, waster efficiency, recycling efficiency, utilisation of renewable energy sources, etc., all of which have been described and fully analysed in a previous study [25]. The energy efficiency in a process is a metric that can potentially be utilized as a sustainability index as it has been previously reported [26]. It is associated with the triple bottom line aspects, as energy efficiency is related to the economic pillar, the environmental pillar, and the social pillar. Specifically, energy efficiency can be linked to both technologies that can potentially reduce energy consumption, as well as operations and procedures that can have the same impact. The focus can be in different levels, such as the manufacturing process level, machine tool level, manufacturing plant level, etc. The social sustainability aspect can be evaluated on the basis of the health and safety (H&S) of workers, the overtime requirements, and the human toxicity potential. Such metrics can be estimated using life cycle analysis (LCA) techniques.
The current research work seeks to promote the production of recycled, sustainable filaments with optimized and improved overall properties, specifically those of polyolefins and more targeted on PP. Research in that field revealed that the overall worldwide consumption of 3D printing systems, materials, and software is expected to reach an annual peak growth of 22.3% in the next few years [7]. Relatively, IDTechEx forecasts that the overall worldwide market for FFF materials will be worth $23 billion by the 2029 [22], demonstrating a substantial prospective growth opportunity in that field over the next decade.
In the study at hand, the authors report for the first time on the behavior of virgin and recycled PP throughout six (6) recycling courses, with specimens manufactured via FFF 3D printing. The main target is to elucidate the recycling process impact on the mechanical performance of the produced samples, as well as the structural and morphological changes resulting from the alteration of crystallinity and thermal properties, induced by the applied consecutive recycling cycles. The motivation of this study related to sustainability arises from the fact that (i) PP is widely used as a low-cost engineered polymer thermoplastic material with a unique property to crystallize and exhibit various mechanical properties i.e., with an anisotropic character in many cases that there is for instance a polymer chain orientation induced phenomenon due to the specific melt mixing extrusion conditions, etc., as well as (ii) PP has recently gained a great interest for FFF 3D printing processes, so that the recycling of the material can realize its reuse in case the part has not been 3D printed with the optimum design, that some defects have been introduced to the printed part, etc. Extensive mechanical testing (tension, flexion, impact, and microhardness) was employed to evaluate the effects of plausible degradation through the different recycling rounds in the mechanical properties of the specimens. For the corresponding thermal properties, Thermogravimetric Analysis (TGA) and Differential Scanning Calorimetry (DSC) were performed, while Scanning Electron Microscopy (SEM) and Raman spectroscopy were conducted for the evaluation of their morphological characteristics and spectroscopic responses in all the recycling cases studied. A novel finding of this work is that there is an overall increase in mechanical properties throughout the recycling course, both in tension and in flexion. Moreover, thermal analysis showed an increase in material’s crystallinity with each recycling course. Morphological characterization finally showed the existence of crystallites in the specimens’ fractured surfaces in the third to sixth recycling courses. With the data derived from this study, it was shown that there is a cost-effective manufacturing benefit in recycling of PP, especially when used for FFF Additive Manufacturing.

2. Materials and Methods

2.1. Materials

Polypropylene (PP) used in this study was procured from Hellenic Petroleum S.A. (Athens, Greece), under the trademark of Ecolen PP. Ecolen PP is an isotactic homopolymer PP (i-PP) employed in a wide range of engineering applications. Virgin material was in powder form. It was formed in small pellets over the consecutive five (5) cycles of extrusion, via fine shredding, following a methodology analyzed below.

2.2. Methods

2.2.1. Recycling Process

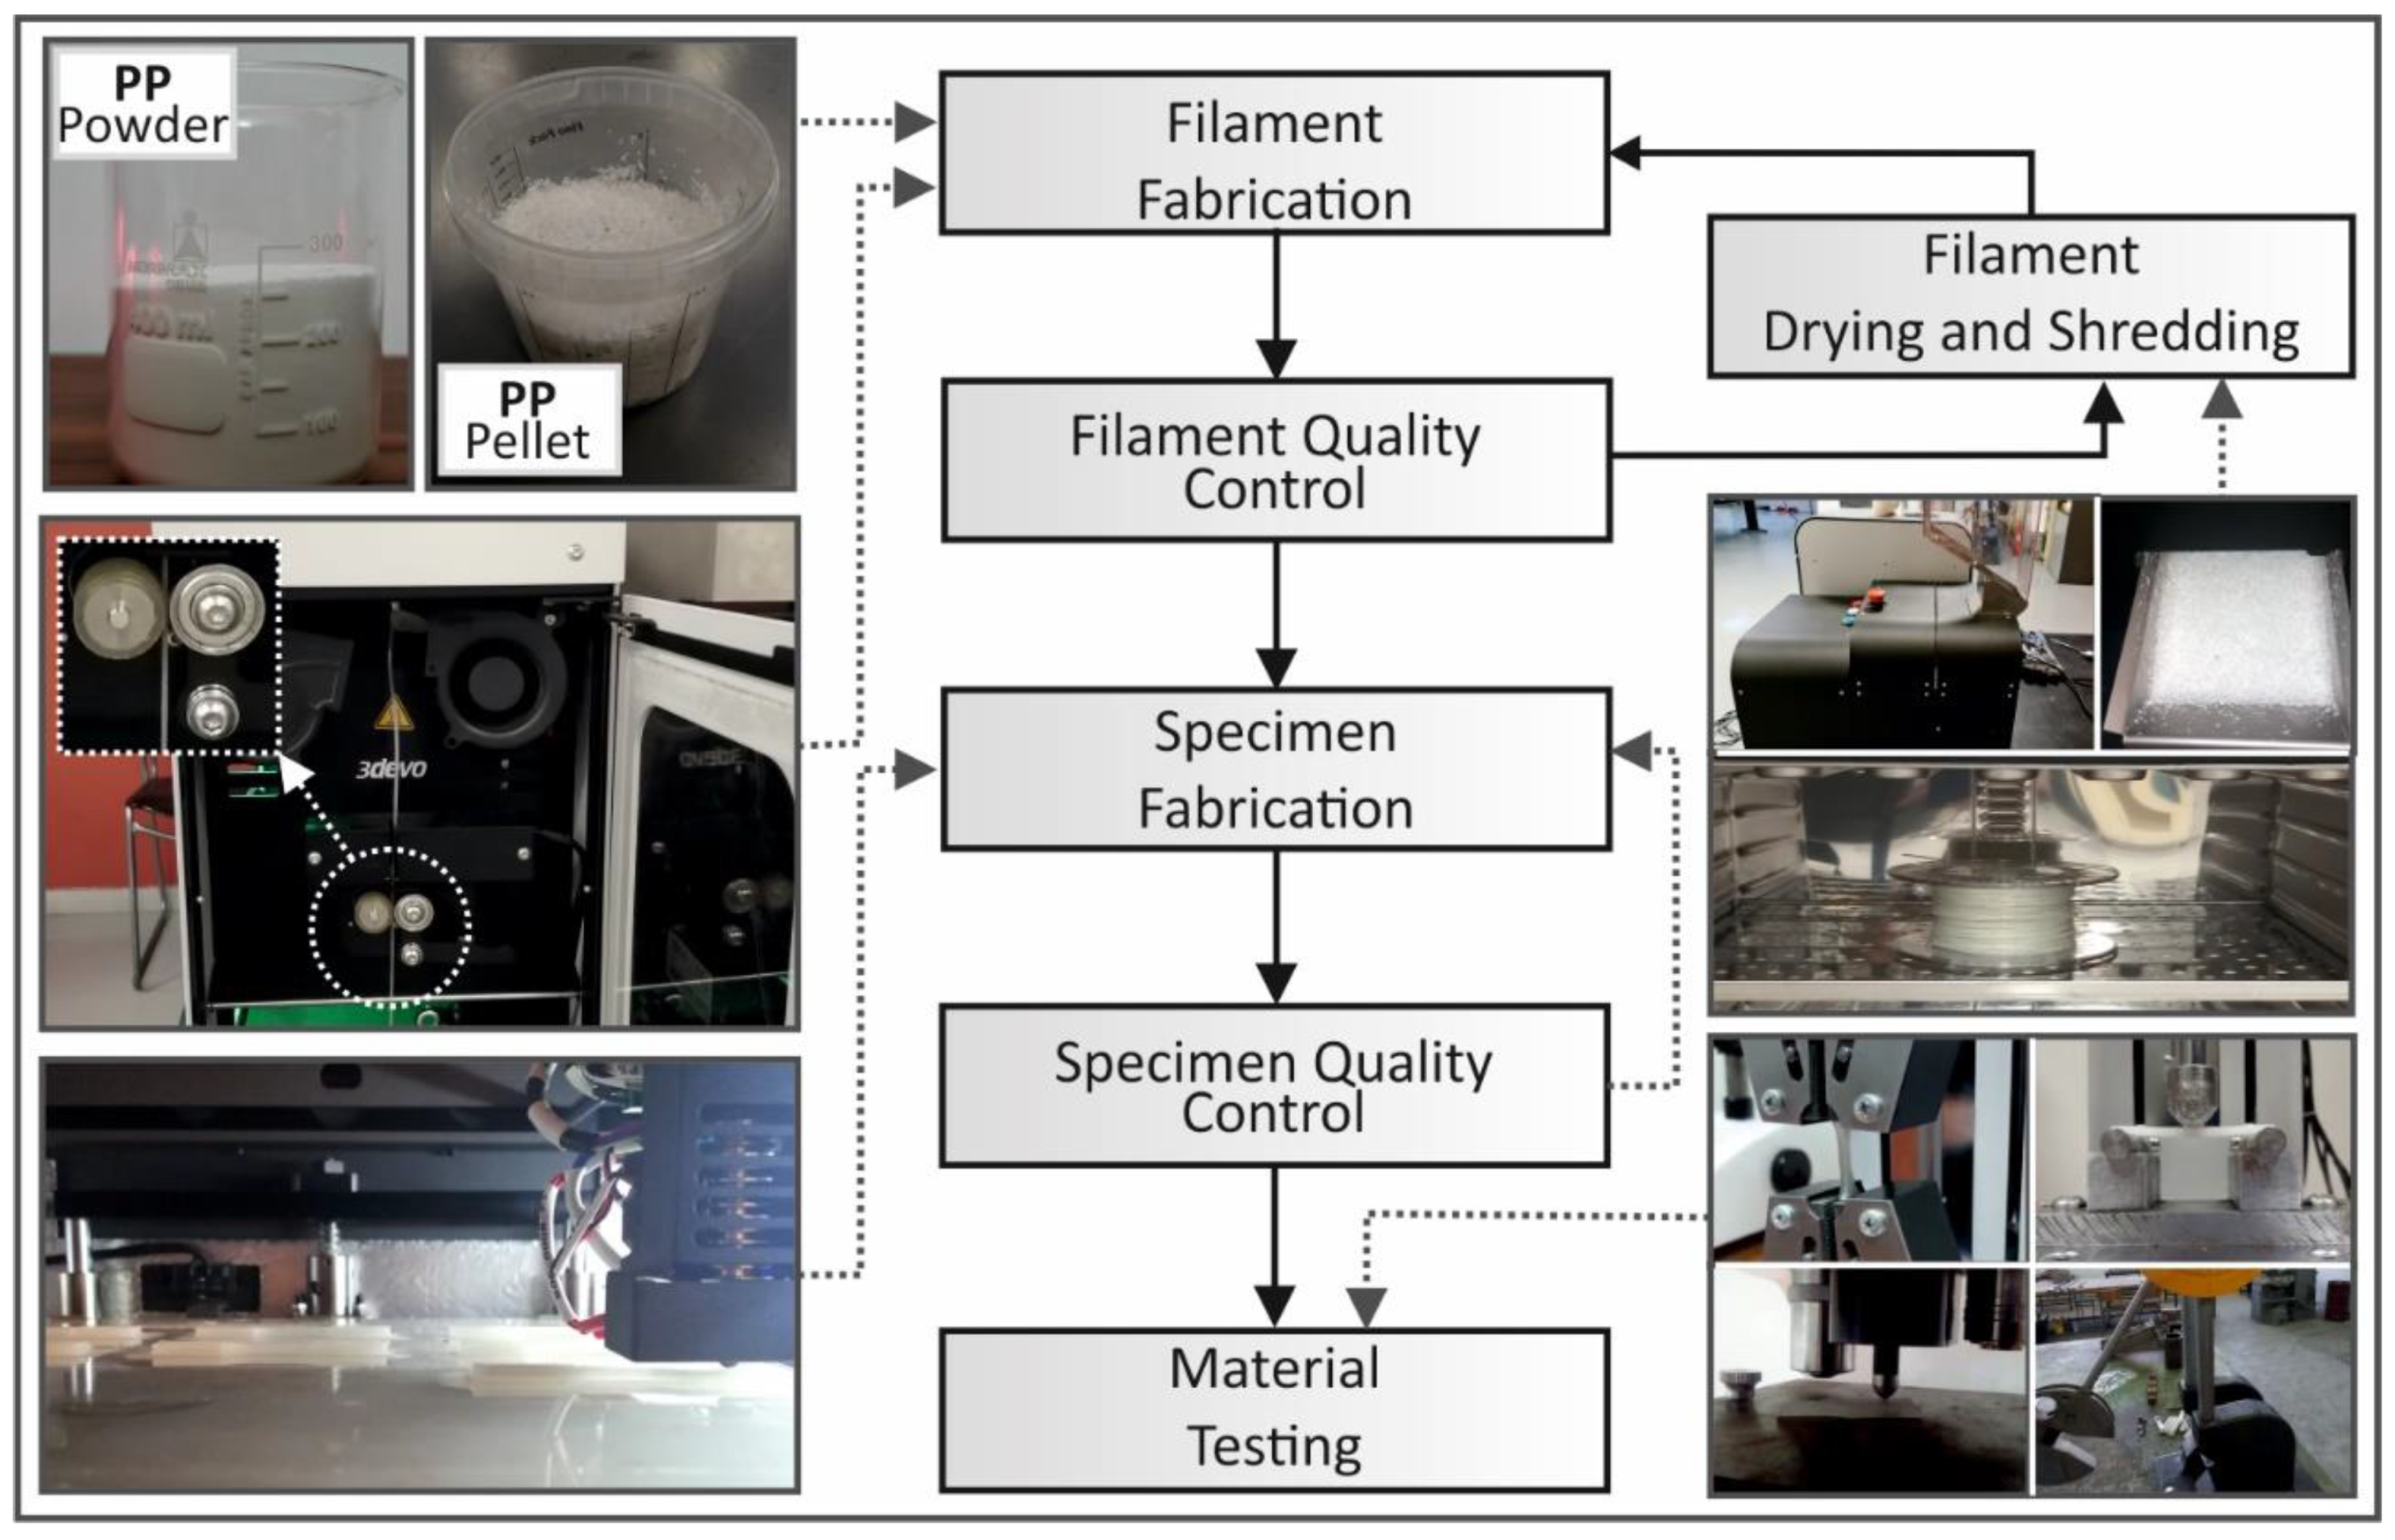
For this study, a recycling protocol under multiple thermal stress procedures was followed. Material was initially extruded from powder form to filament with 1.75 mm in diameter. Before its extrusion process, a drying procedure under constant 80 °C temperature for four (4) hours was performed. As shown in Figure 2, in which all the procedure followed in this study is presented, after the extrusion process, the filament was also dried under the same conditions. A quality control of the filament was conducted before each recycle course. For the extrusion process a 3D Evo Composer 450 extruder (3d evo B.V., NL) was used. After filament fabrication, filament drying and quality control inspection, a shredding procedure was executed in order to acquire PP in pellet’s form with 1–2 mm average size. For this procedure a Shreddit (3d evo B.V., NL) machine was employed. At each cycle, a portion of the filament was used to produce the requested specimens as described below and the remaining filament was shredded, in order to be used in the next recycle round.
Extrusion procedure through all cycles (from the 1st to the final 6th recycle round) was conducted under identical parameters. Extruder’s temperatures were set to 195 °C for the first heat zone, 210 °C for heat zones two (2) and three (3) and 205 °C at the final fourth (4th) heat zone before the nozzle. Extruder’s rotational speed was set to 3.5 rpm and an extra air duct was used in order to achieve a smooth cooling procedure and finally high-quality roundness of the filament. It should also be mentioned that this specific extruder has a sensor that constantly measures the produced filament diameter and micro-adjusts the extruding speed, in order to maintain a constant and accurate diameter in the produced filament.

2.2.2. Tensile Specimens’ Fabrication and Testing

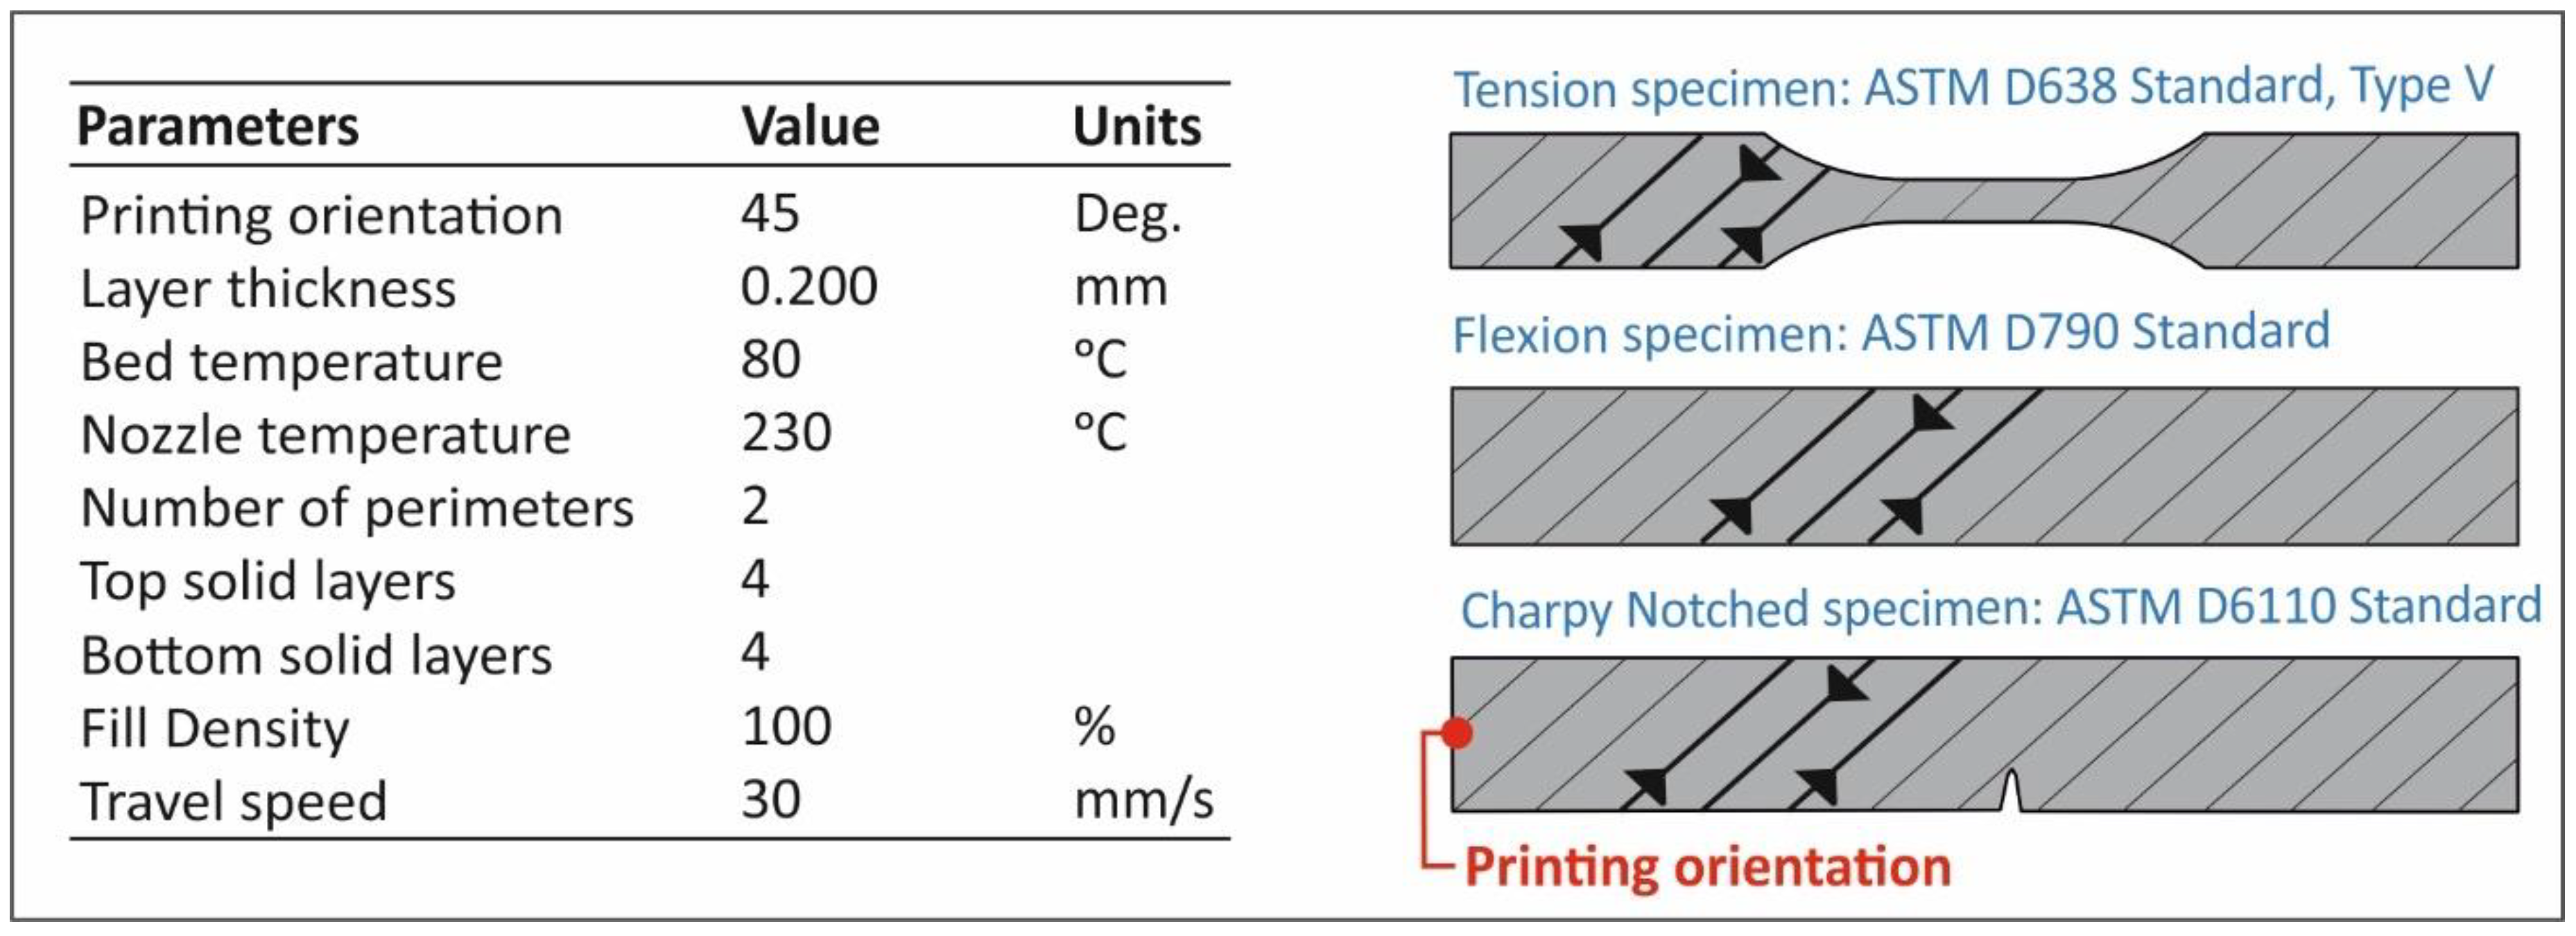
Tensile test specimens were manufactured according to the American Society for Testing and Materials (ASTM) D638-02a standard as shown in Figure 3. A Type V specimen of 3.2 mm thickness was produced with FFF. More specifically, an Intamsys HT 3D Printer (Intamsys Technology Co ltd, Shangai, China) was utilized. The FFF building parameters are shown in Figure 3. All other parameters regarding the 3D printing procedure (such as the extrusion speeds, retracts etc.) were set according to the Intamsuite (Intamsys’ Slicing Software) as for the PP material.
The tensile tests were performed by means of an Imada MX2 (IMADA, IL, USA) tensile test machine under room conditions (22 °C). Elongation speed was set to 10 mm/min. For each recycling round, five (5) specimens were tested, resulting in a total number of thirty (30) PP specimens investigated through quasi-static tensile test experiments in this study.

2.2.3. Flexion Specimens’ Fabrication and Testing

Flexural three-point bending tests were carried out on specimens according to the ASTM D790-10 standard, also in room conditions. Flexural test’s specimens were also manufactured with the same process parameters as for the tensile test specimens. An Imada MX2 machine in flexural mode was employed for the three-point bending tests. The same speed of 10 mm/min was set for the testing procedure. The flexural test was repeated five (5) times for each cycle of extrusion, making a total of thirty (30) specimens tested from the first to the sixth round of recycling.

2.2.4. Impact Specimens’ Fabrication and Testing

The impact specimens were produced according to the ASTM D6110-04 standard, using 3D printing as described above and according to the parameters shown in Figure 3. Notched specimens with 80 mm length, 8 mm width, and 10 mm thickness were manufactured for the Charpy’s impact tests. Notch shape and dimensions were according to the ASTM D6110-04 standard on the specimens (V shape type notch, with 45° angle). Thirty (30) specimens were tested for their impact resistance (at each cycle five (5) specimens were tested). A Terco MT220 device was utilized for the Charpy’s Impact Test procedure. Each test was conducted by setting the same starting angle for the apparatus’ hammer.

2.2.5. Micro-Hardness Measurements

The microhardness measurements were conducted according to the ASTM E384-17 standard. The applied force was set to 300 g and the indentation time was set to 10 s. The machine used was an Innova Test 400-Vickers, with the aid of a typical Vickers diamond pyramid (apex angle of 136°) as an intender. Indentations were performed on polished surfaces of the AM manufactured specimens. Surfaces were chosen carefully in order to be appropriate for microhardness testing, using an optical microscopy apparatus. Imprints were measured at different specimens in each recycle round, while at least five (5) measurements were taken in the 3D printed specimen of each recycling round.

2.2.6. Thermal Analysis

Thermogravimetric analysis (TGA) was carried out to depict the thermal stability of PP after the different recycling rounds. More specifically, all TGA runs were performed under oxygen atmosphere at a temperature range of ambient temperature (25 °C) up to 600 °C with a heating rate of 10 K/min using a Perkin Elmer Diamond TG/DTA (Waltham, MA, USA) instrument. With the aim to determine the glass transition temperature (Tg) and melting temperature (Tm) of PP after the different recycling cycles, DSC measurements were carried out using a DSC Q 1000 from TA Instruments at a 10 K/min heating rate in a nitrogen atmosphere.

2.2.7. Raman Spectroscopy

A Labram HR-Horiba (Kyoto Japan) scientific micro-Raman system with a 514.5 nm line of an Ar+ ion laser operating at 1.5 mW power at the focal plane was used to obtain the Raman spectra of PP after the different recycling rounds. All spectra have been acquired in the back-scattering geometry, while an optical microscope equipped with a 50× long working distance objective was used both for delivering the excitation light as well as collecting the back-scattering Raman activity.

2.2.8. Morphological Characterization

Scanning electron microscopy (SEM) was performed with the FEI NanoSem 200 (FEI, Eindhoven, The Netherlands) field-emission microscope in order to study the 3D printed samples’ side surface morphology and 3D printed layer thickness, as well as the samples fractured surfaces. The SEM images were acquired at an acceleration voltage of 1.0 kV on uncoated samples.

3. Results

3.1. Tensile Test Results

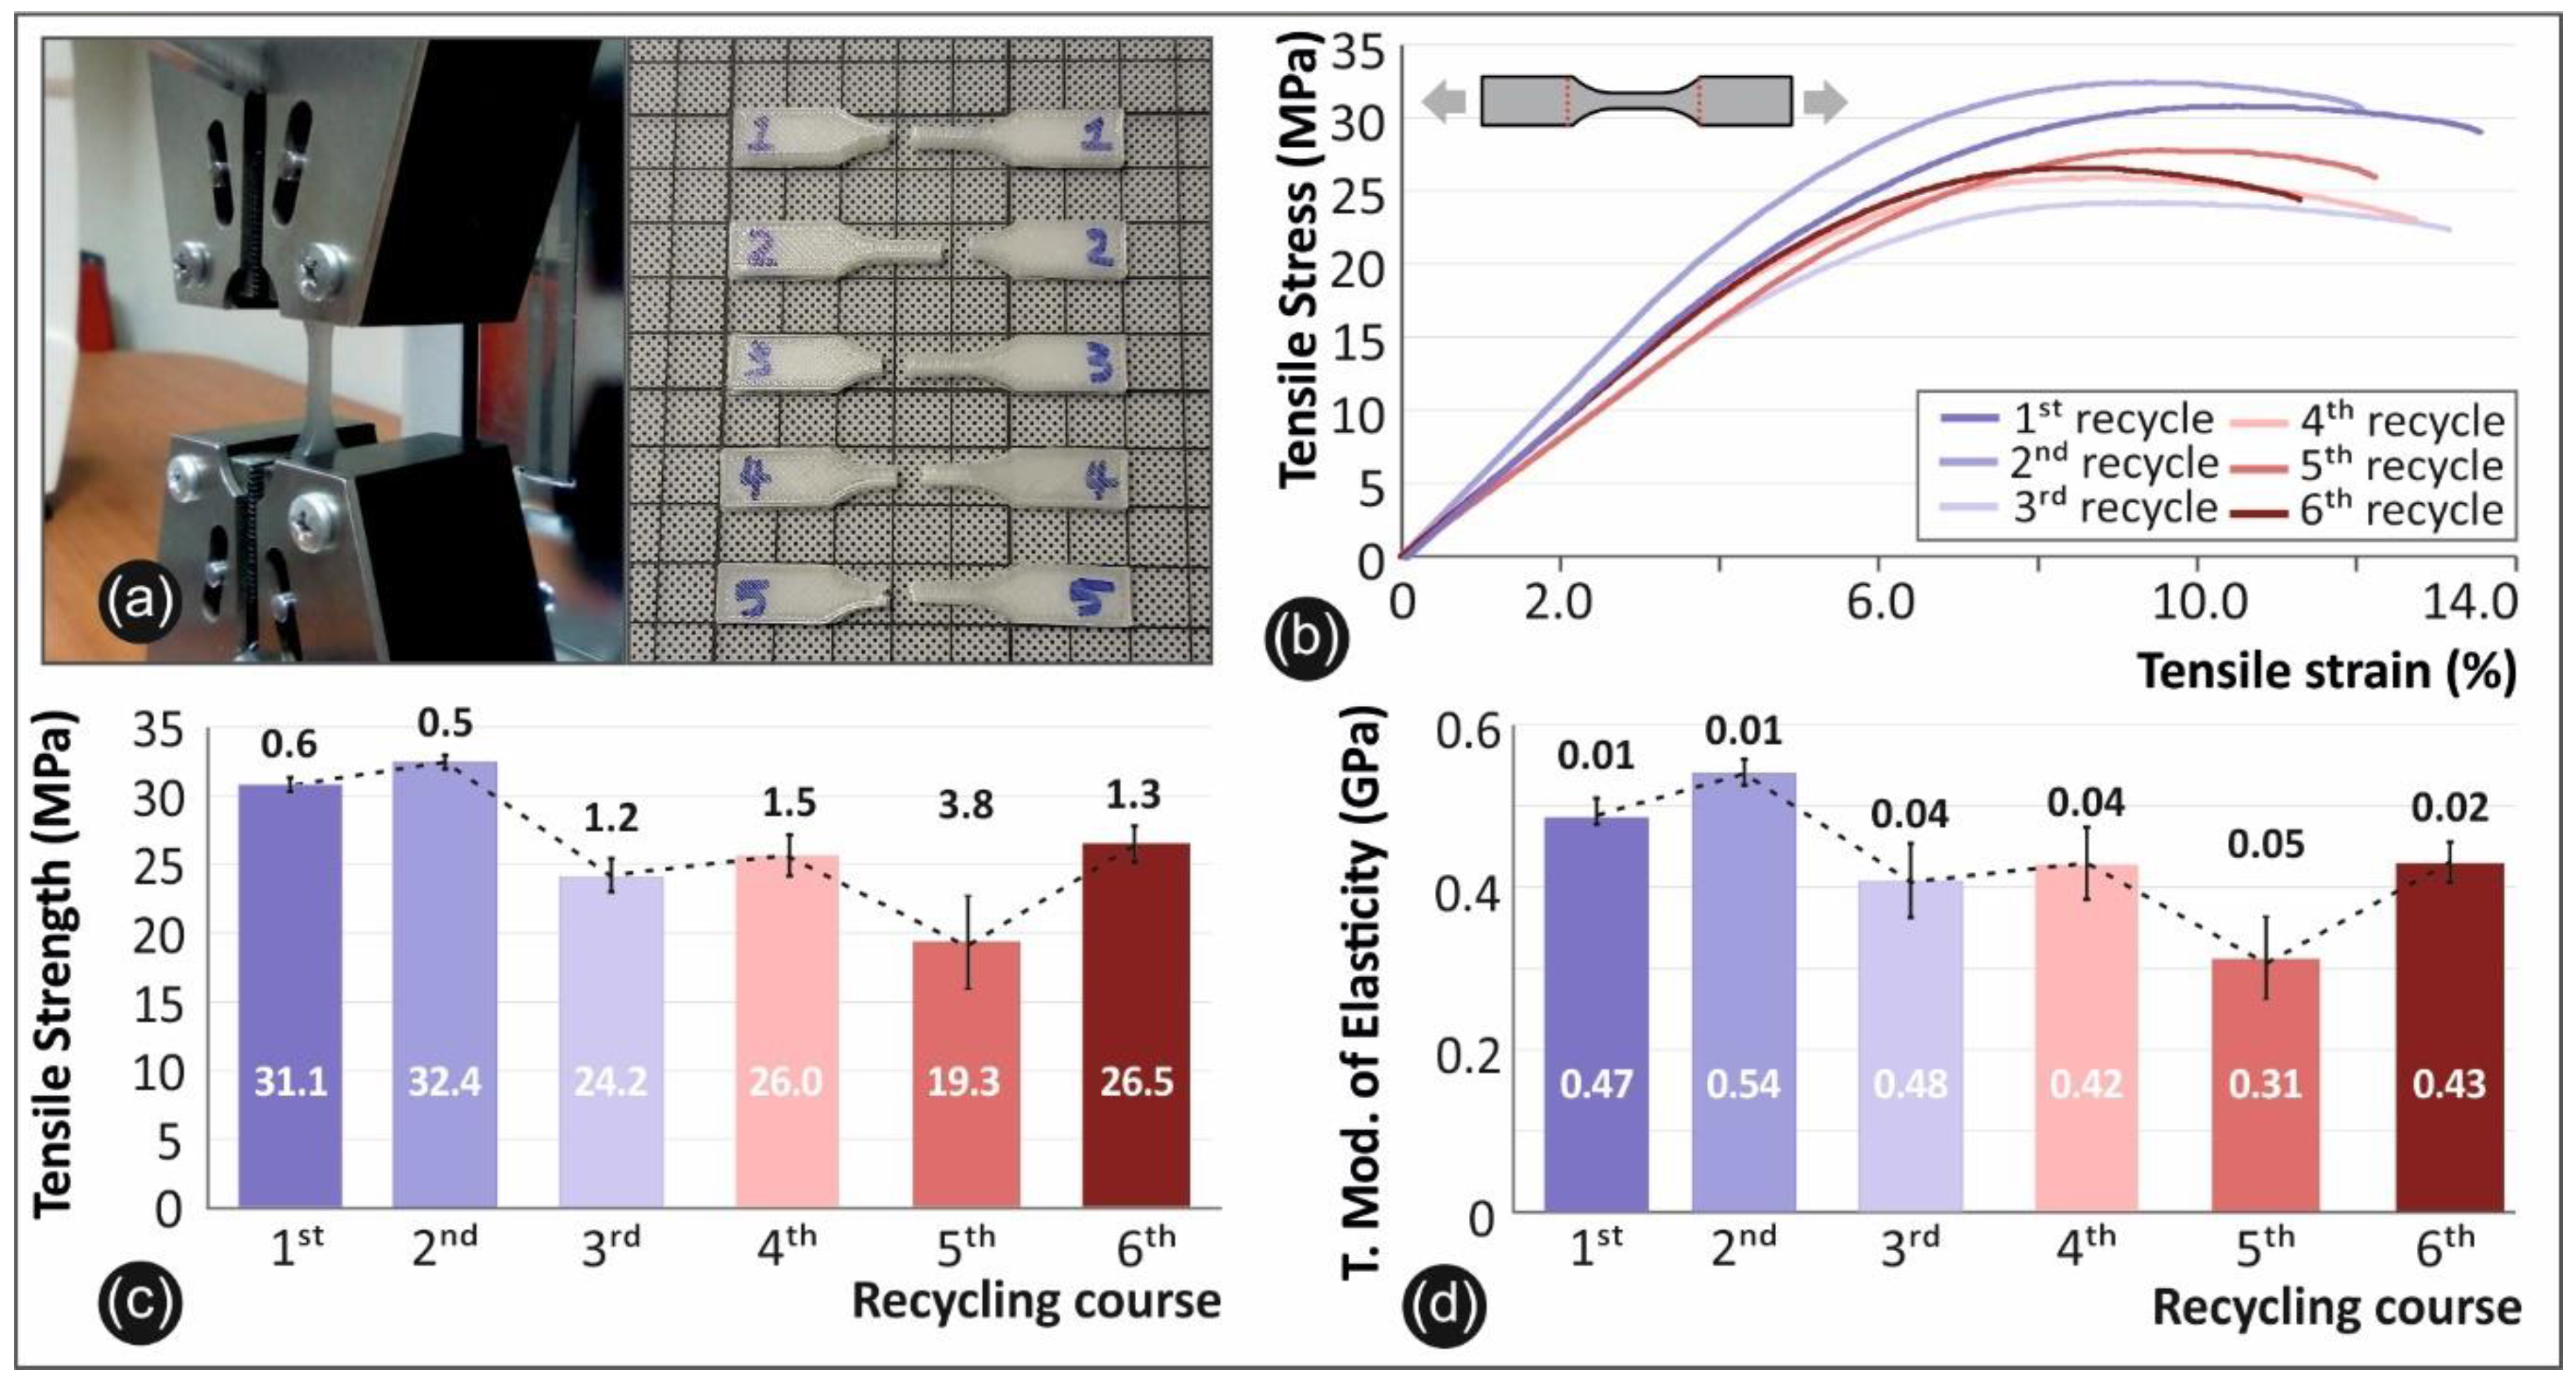
In Figure 4 comparative results are shown regarding tensile tests. In Figure 4a a standard tensile test setup is shown on the left and a series of specimens on the right. Figure 4b shows a characteristic stress to strain graph from one specimen from each recycle course. In Figure 4c average values and deviation for the tensile stress at break are shown for all tested recycling courses. Finally, Modulus of Elasticity average values and deviation are shown in Figure 4d for all tested cases of recycling study.

3.2. Flexural Test Results

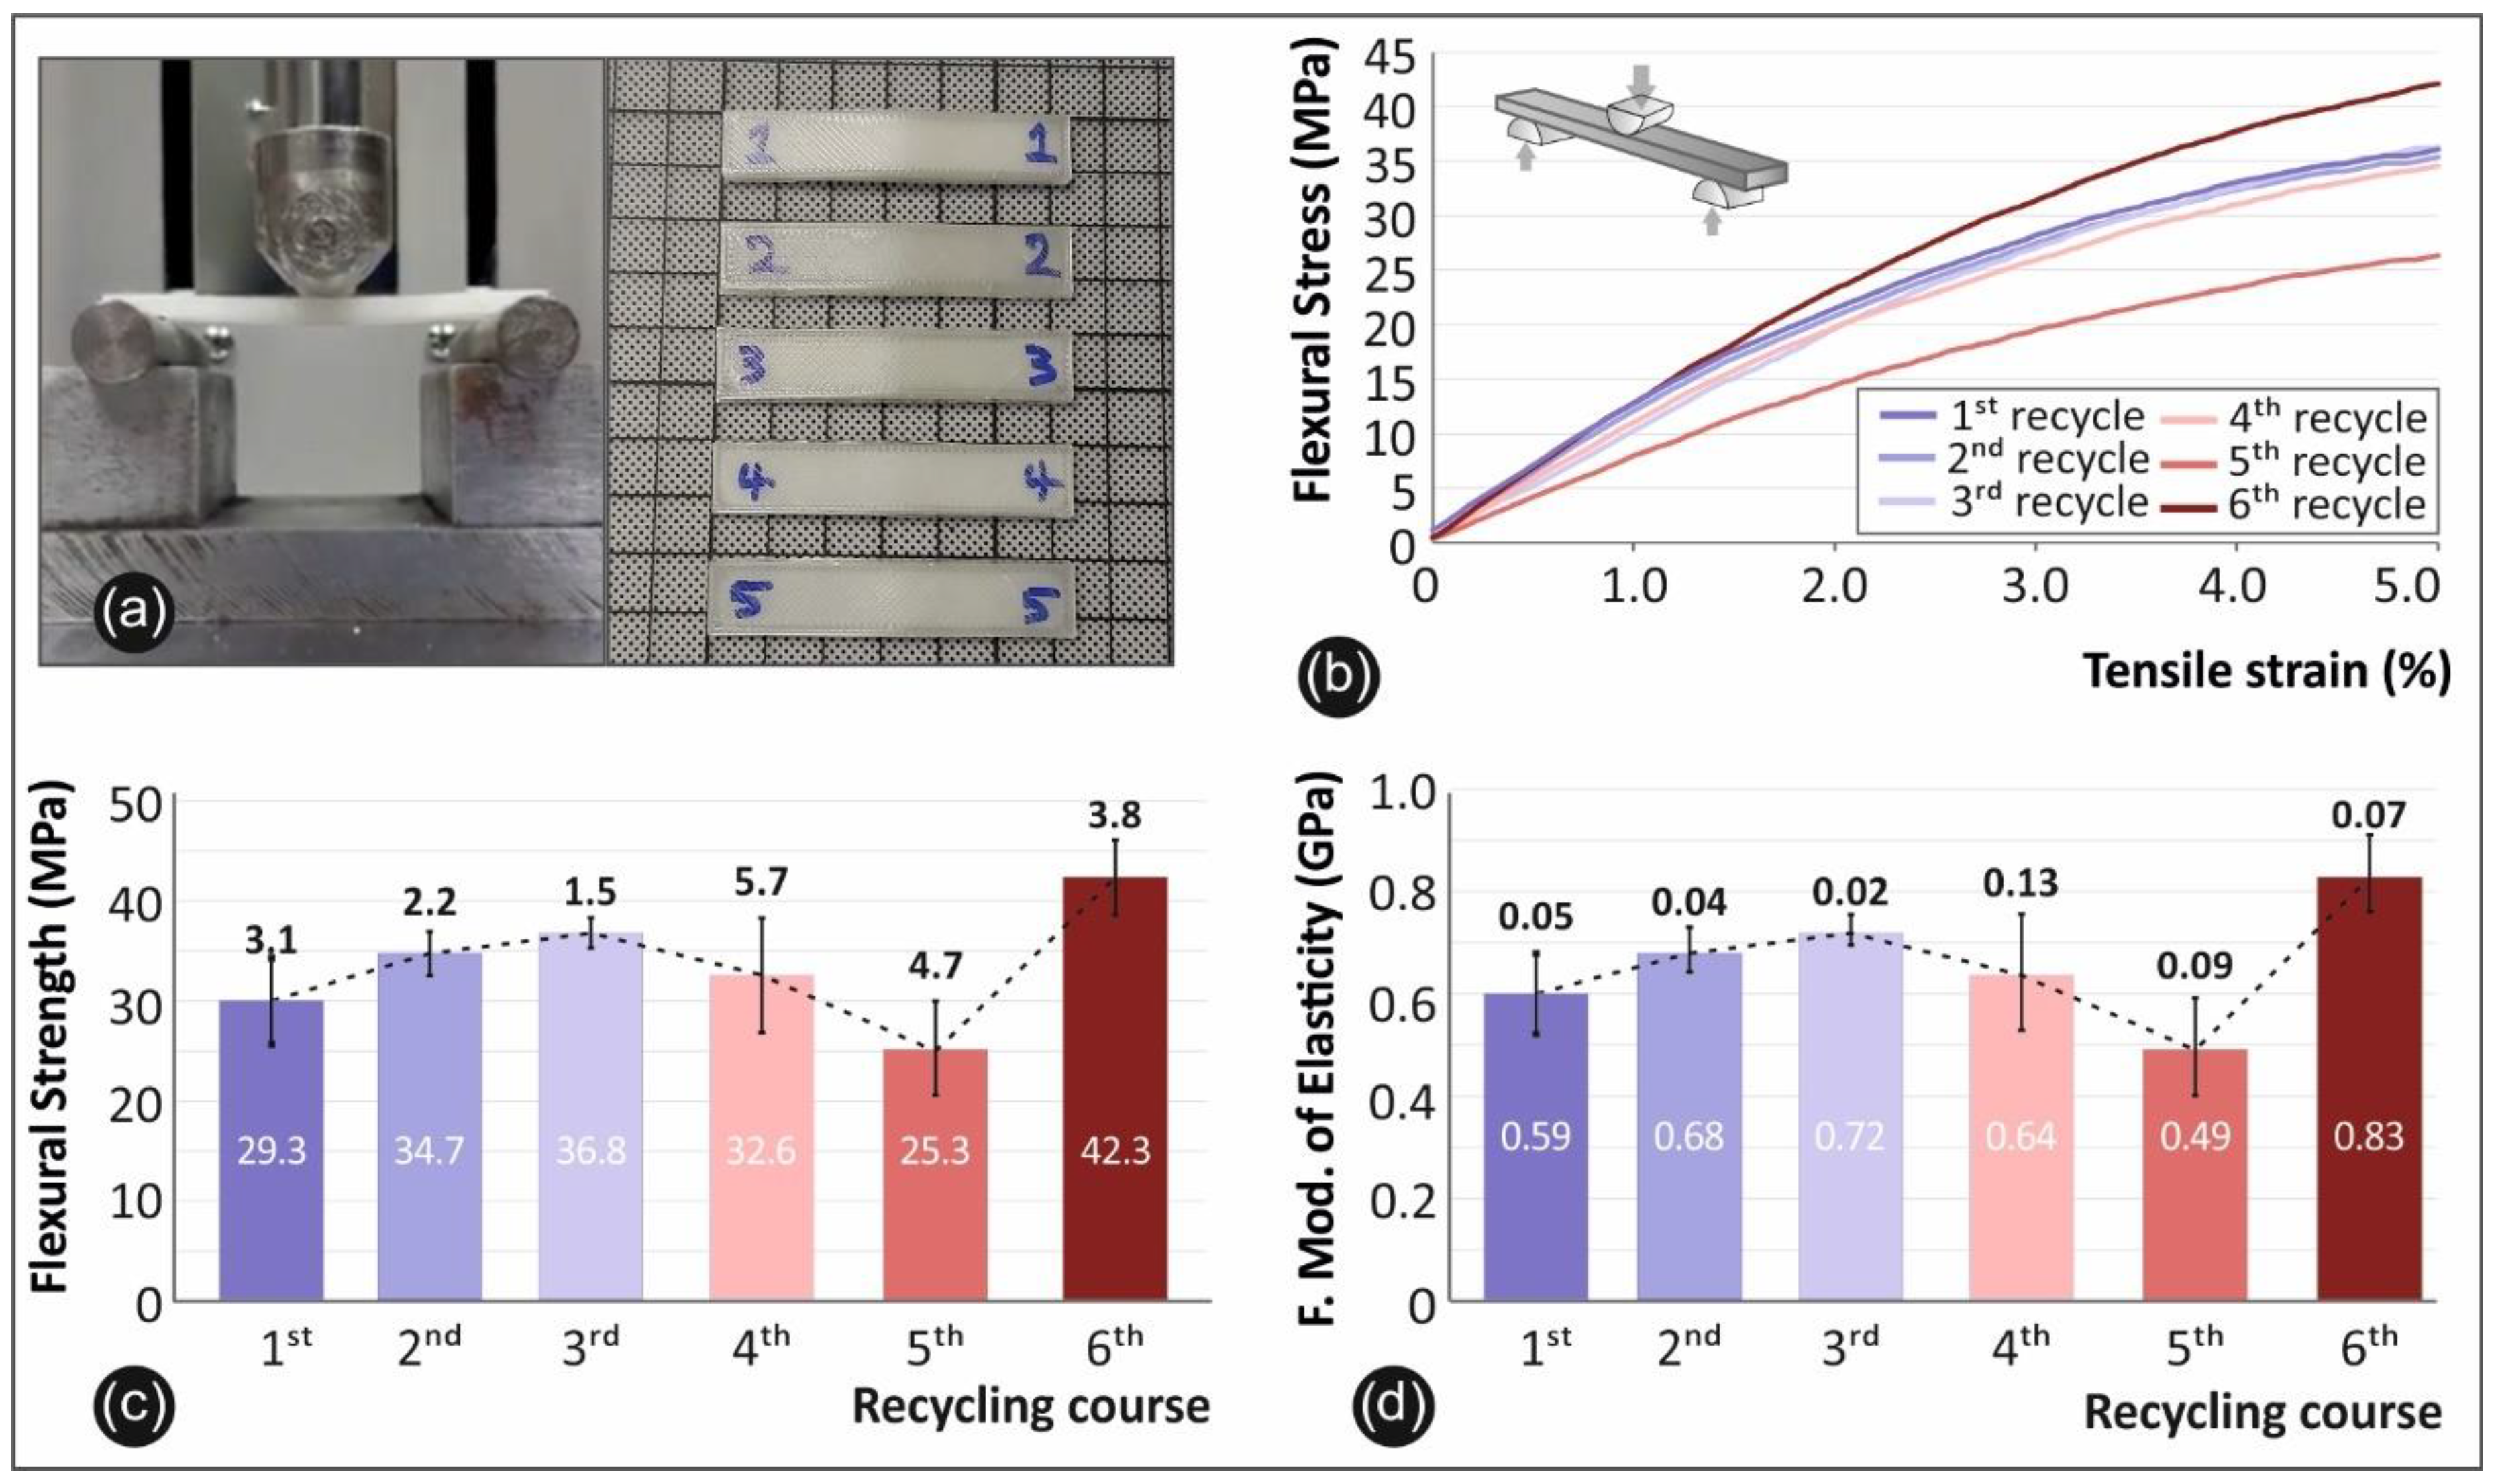
Figure 5 shows the results regarding the flexion tests conducted in all recycling courses. A standard procedure setup is shown in Figure 5a (left side) while on the right-side of the same figure (Figure 5a) a picture of five specimens after they were tested is shown. Through all cycles no specimen was driven to failure during the test procedure. Figure 5b shows flexural stress to strain (%) graphs up to 5% of one specimen from each recycle round. In Figure 5c,d average values and deviation of the maximum recorded flexural stress and calculated flexural modulus of elasticity are shown, respectively.

3.3. Impact Results

Figure 6a shows the average values and deviation of the calculated PP specimens Impact Strength (kJ/m2) of all six (6) recycle courses. Figure 6b shows a typical setup regarding the Charpy’s impact test procedure (left side). On the right side of same figure (Figure 6b) a batch of impact test specimens is shown before they are tested.

3.4. Microhardness Results

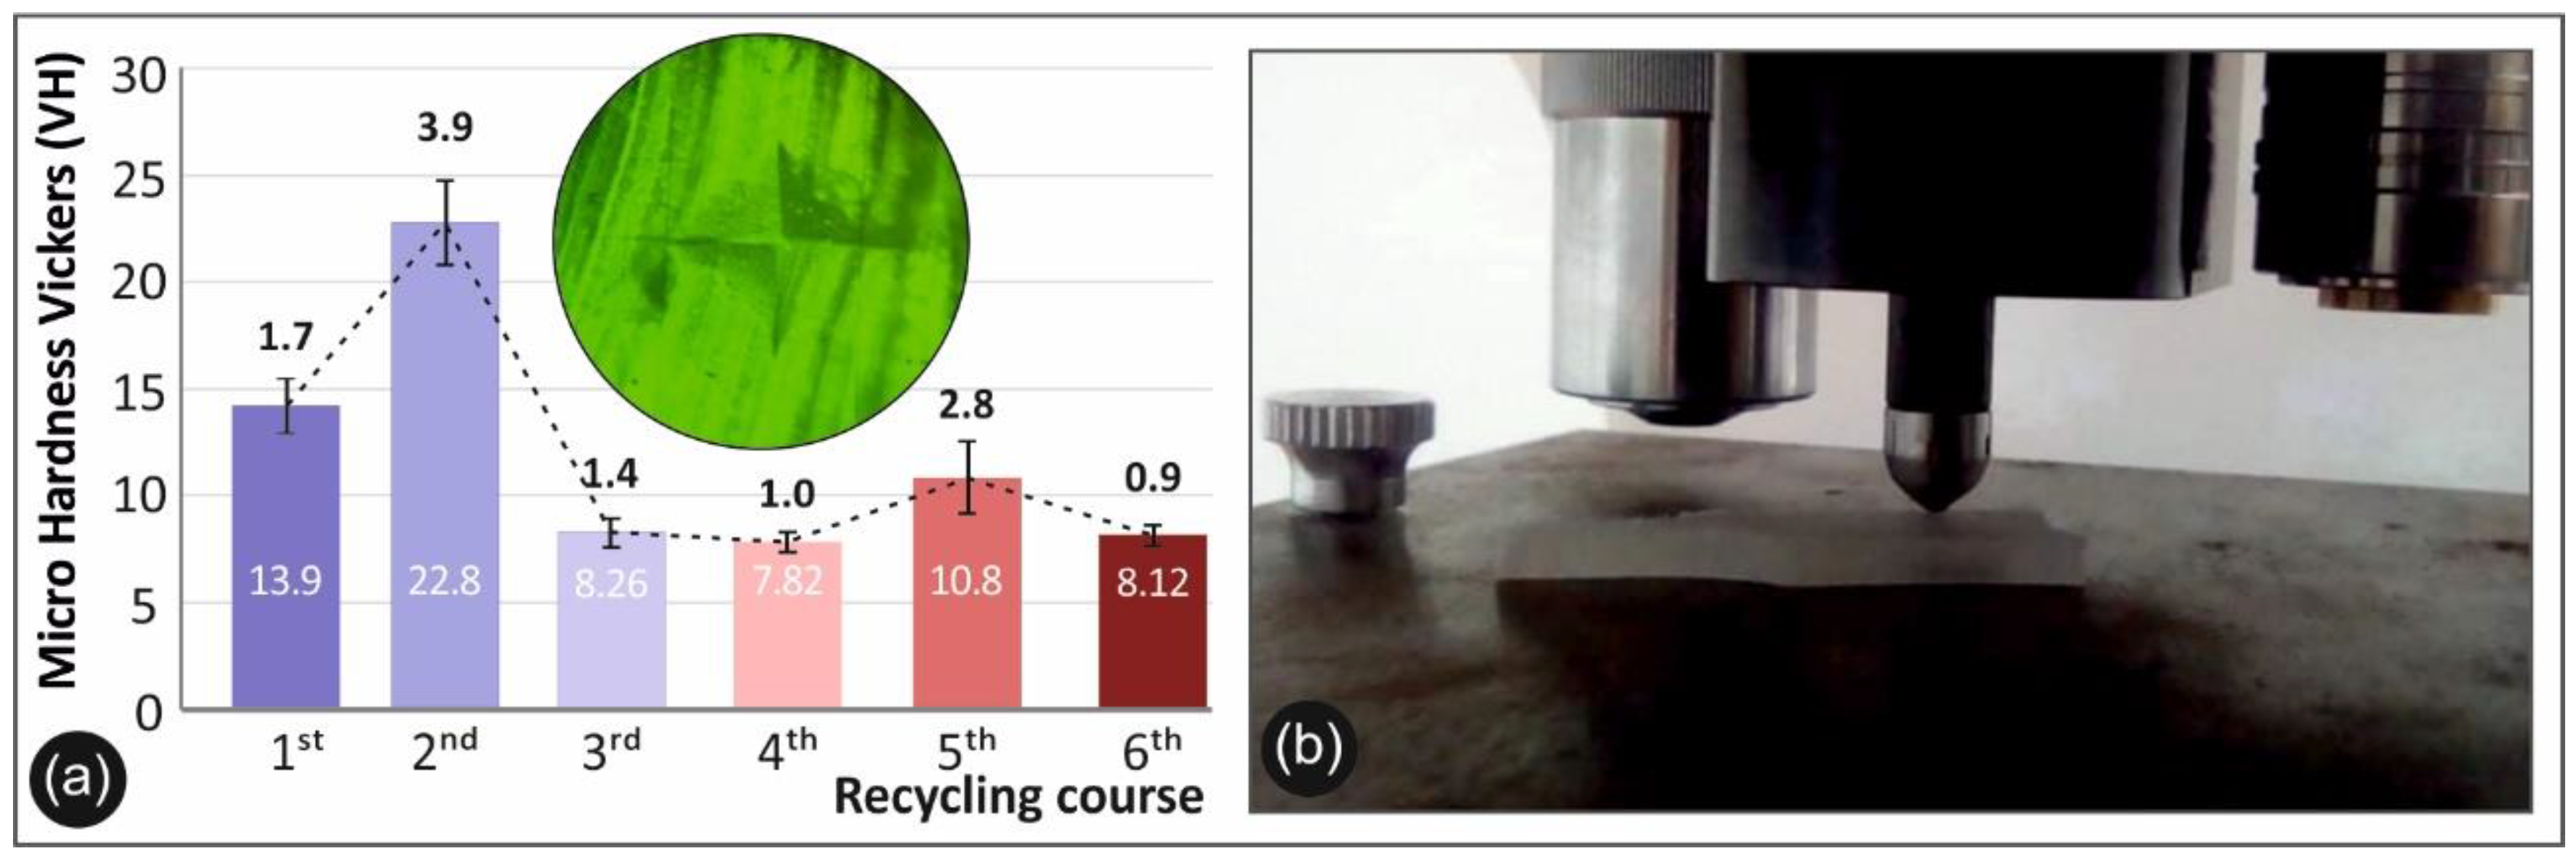
In Figure 7a average values and deviation of the Vicker’s microhardness measurements in each recycling round are shown. Figure 7b shows a standard microhardness test setup.

3.5. Thermal Analysis and Raman Spectroscopy Results

Thermal analysis experiments were carried out using thermogravimetric analysis (TGA) and differential scanning calorimetry (DSC). Figure 8a represents the TGA scans for PP after the 2nd recycle, as well as after the material has been recycled and 3D printed for the 3rd and 6th cycle, respectively. Figure 8b shows a magnification of the graph shown in 8a in an area of interest.
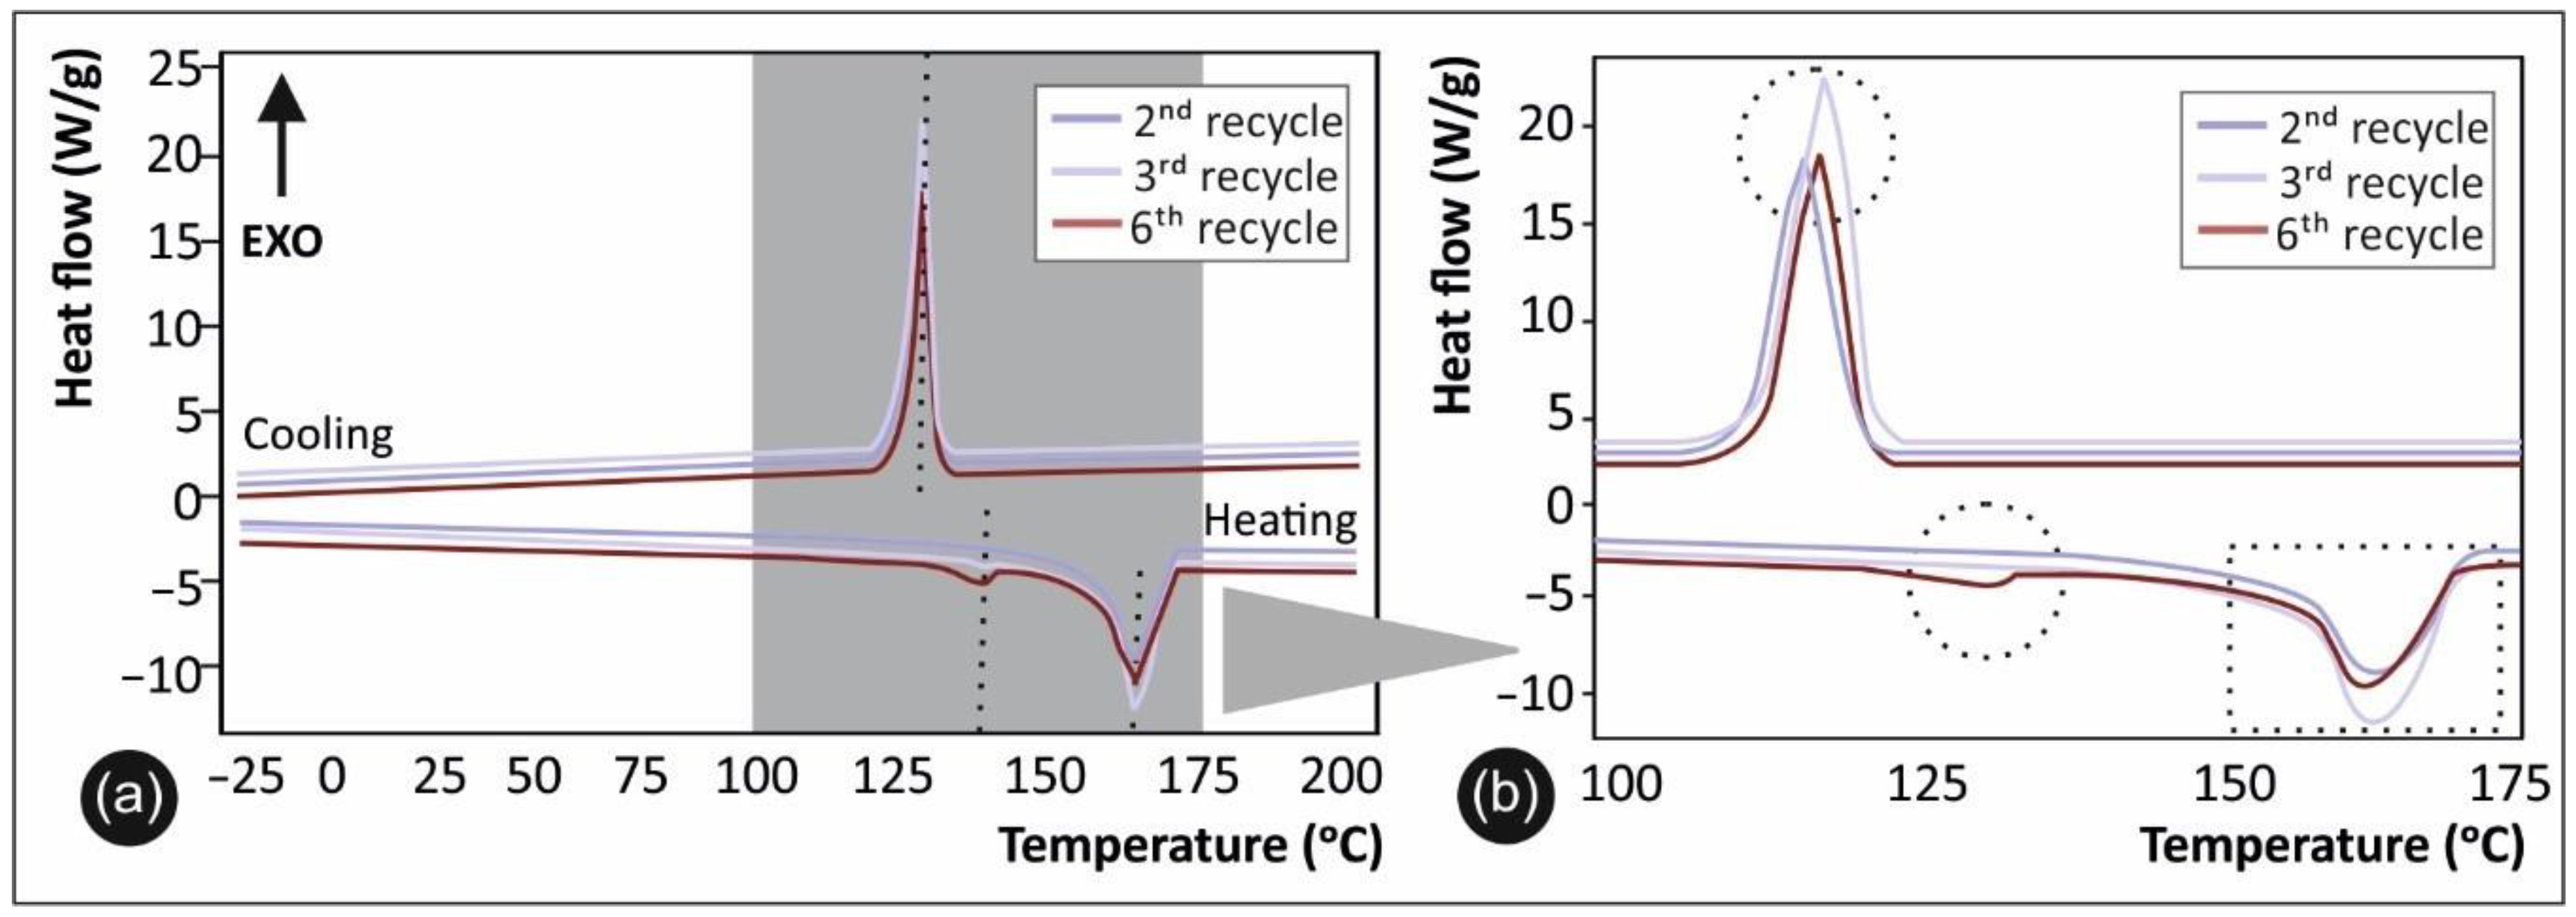
Figure 9a shows the DSC curves of PP after the 2nd, 3rd and 6th recycling cycle, while a zoom of the graph is depicted in Figure 9b.
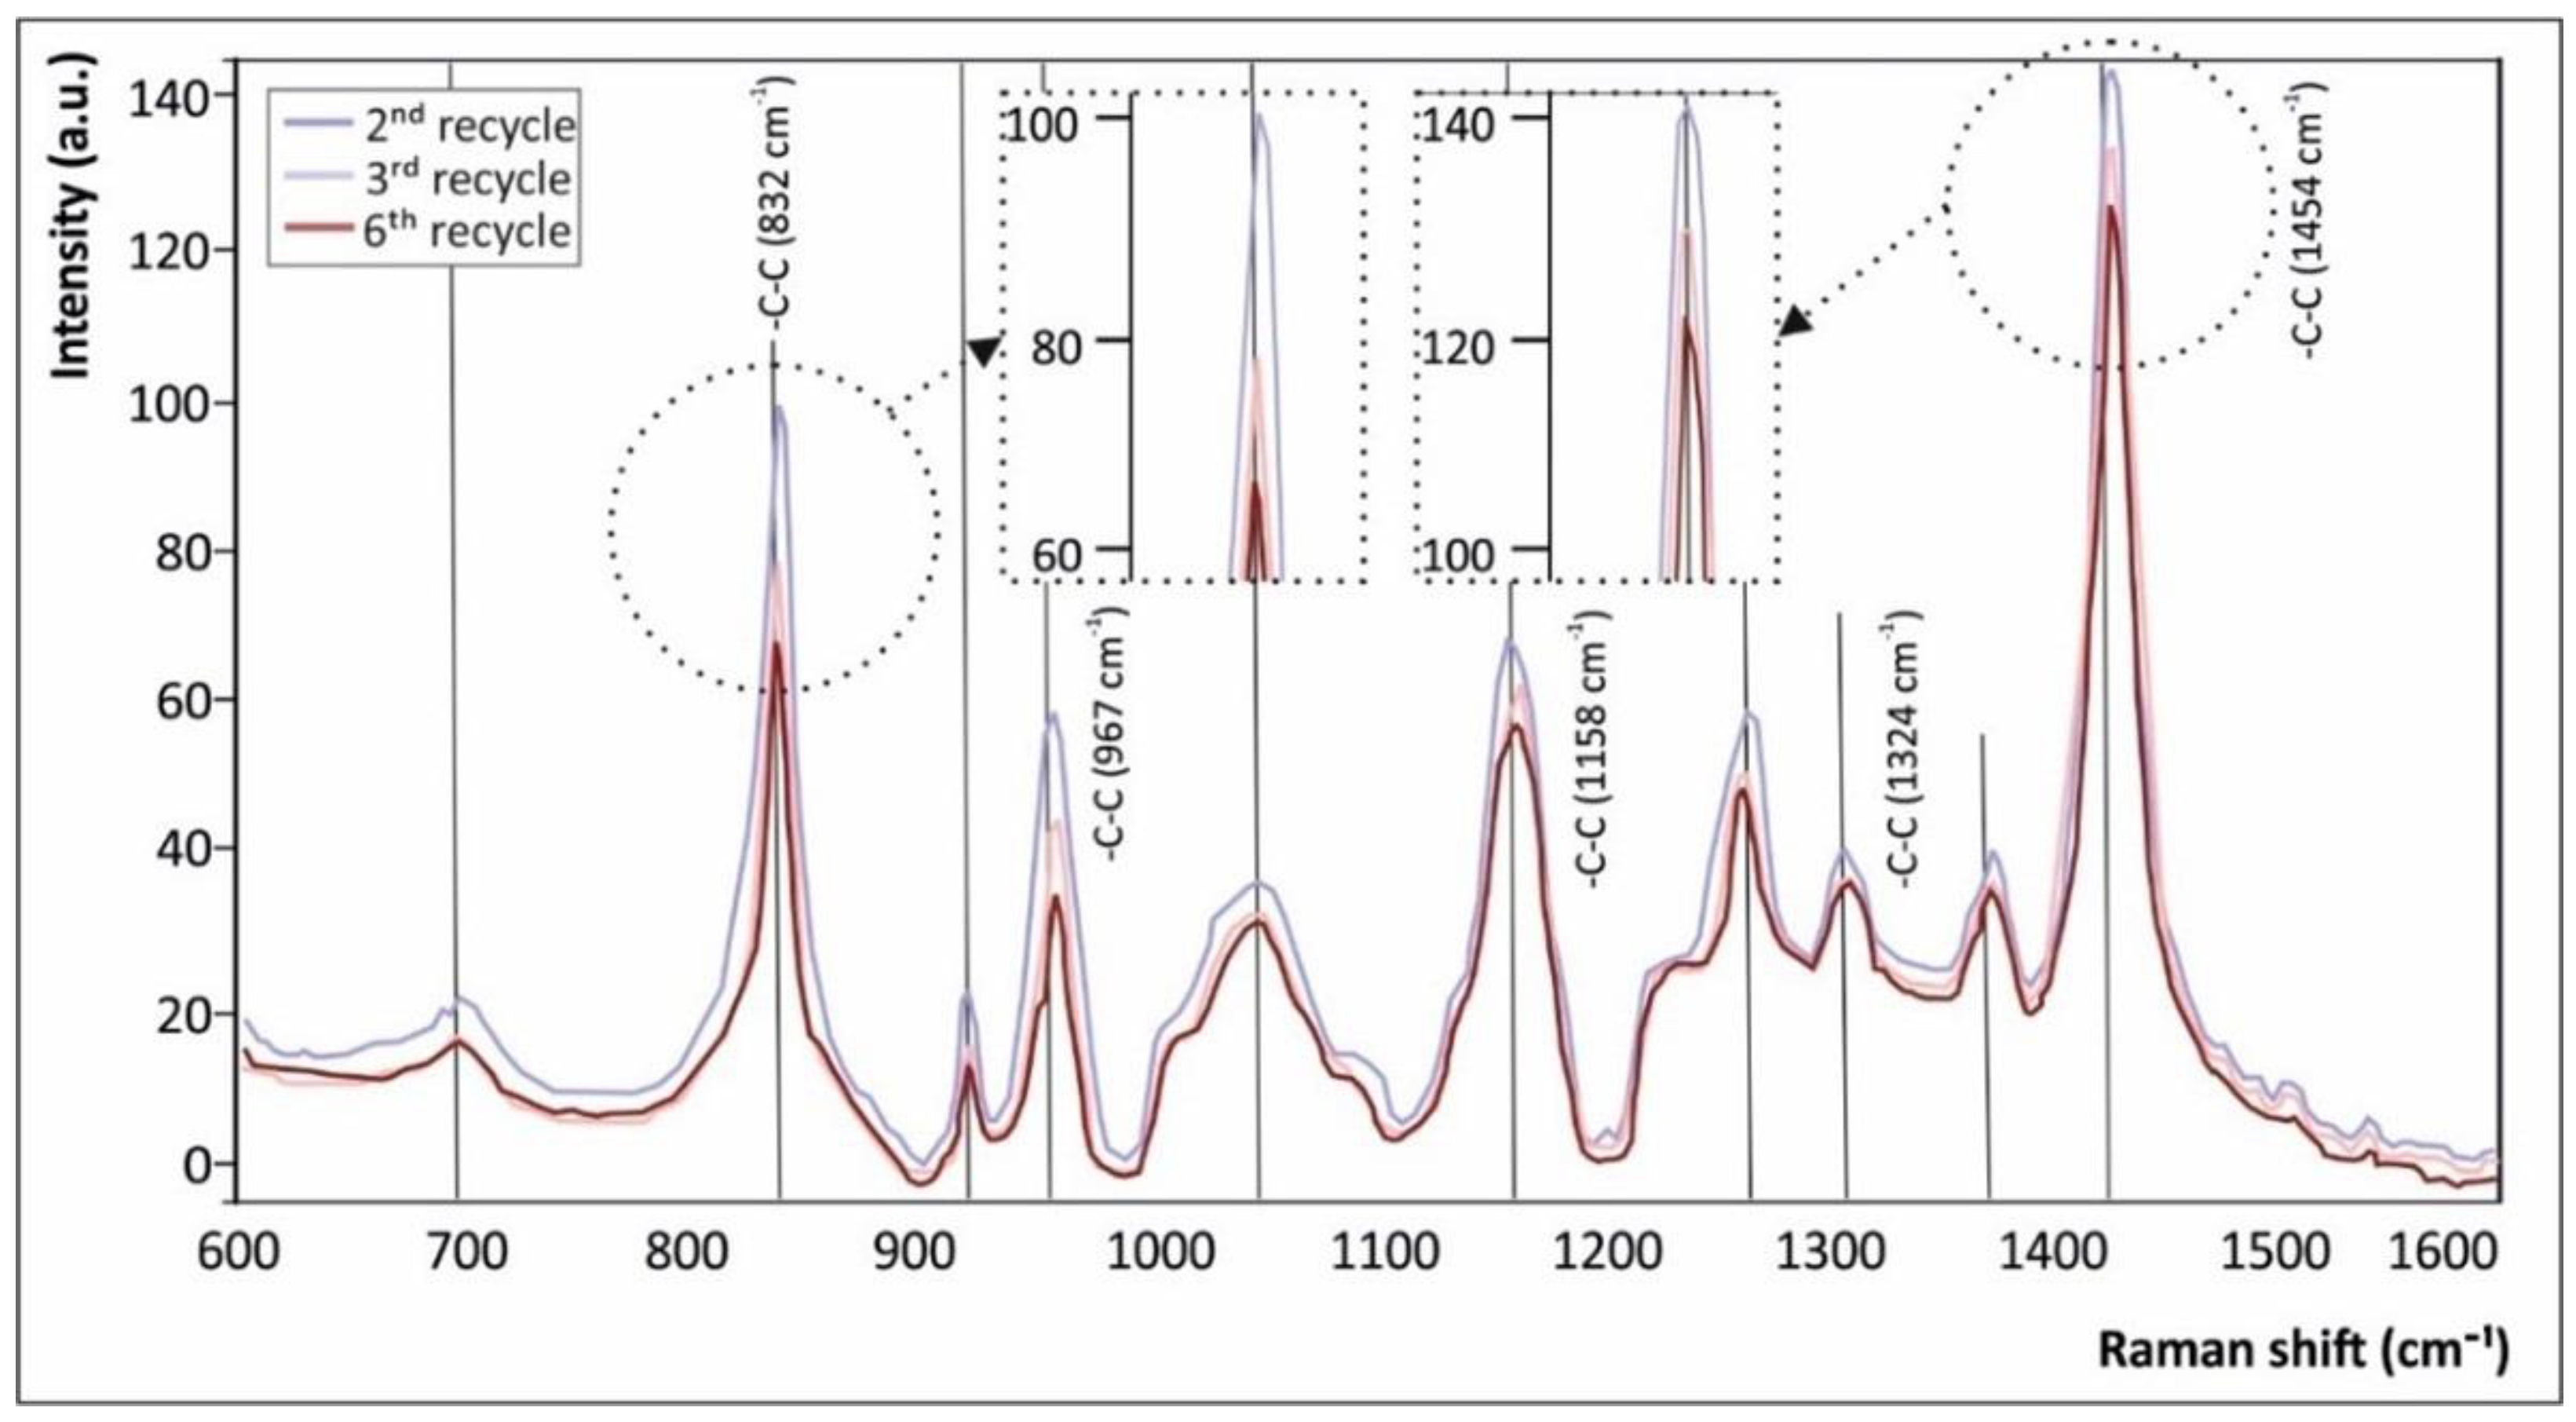
Figure 10 illustrates the Raman spectra of 3D Printed PP after the 2nd, 3rd and 6th cycle of recycling.

3.6. Morphological Characterization Results

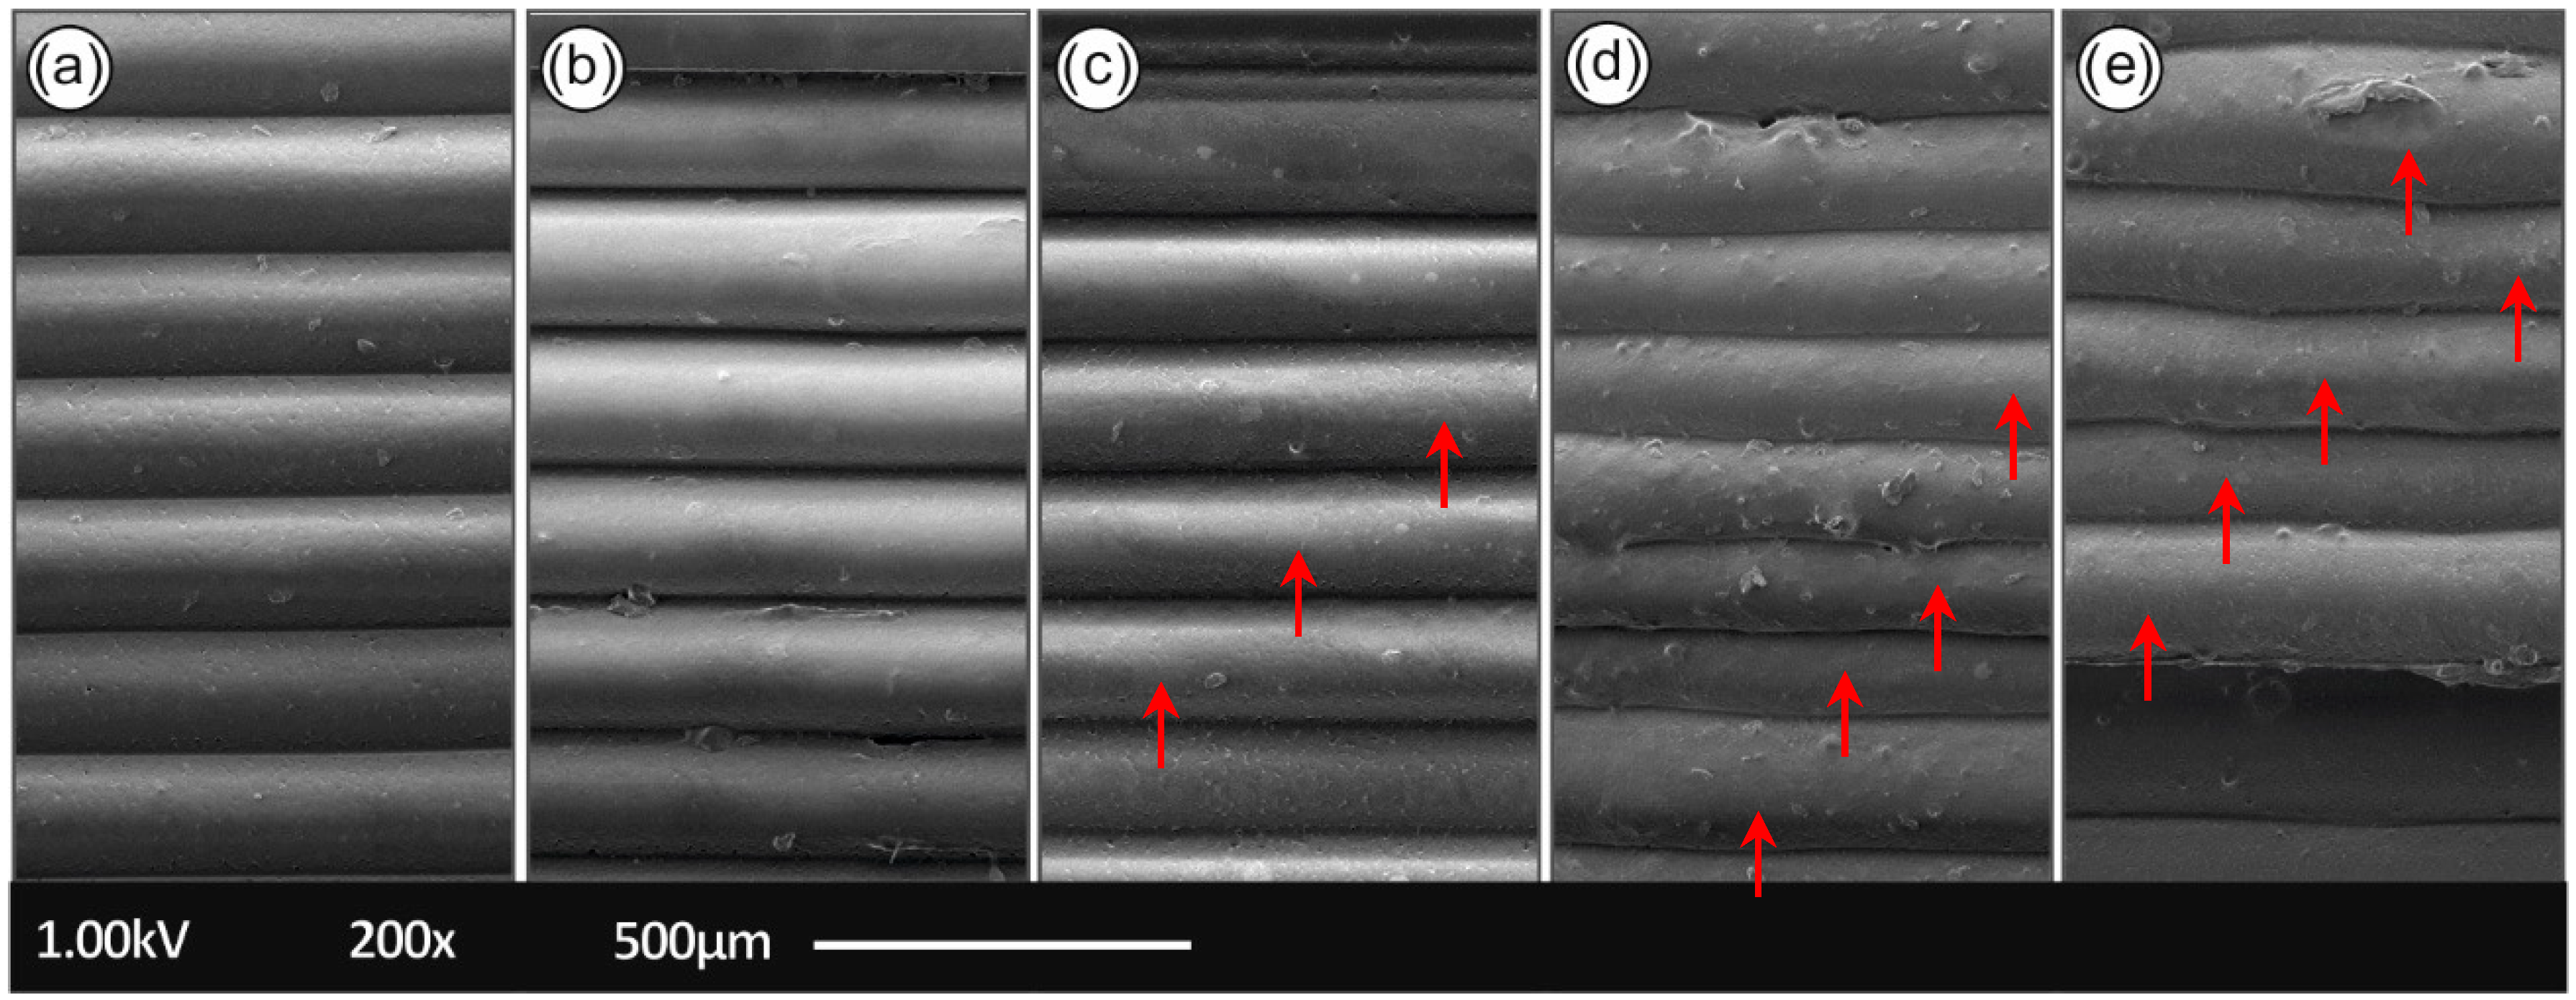
Figure 11 summarizes the SEM images of the 3D printed PP samples fabricated with 150 µm 3D printed layer thickness, after the (a) 2nd (b) 3rd (c) 4th (d) 5th and (e) 6th cycle of recycling. All images were acquired from 3D printed samples’ side surface and, as can be observed, the 3D printing layer thickness characteristics fully corroborate the resolution of the Intamsys Funmat HT 3D printer manufacturer’s technical specifications in terms of printer’s resolution.
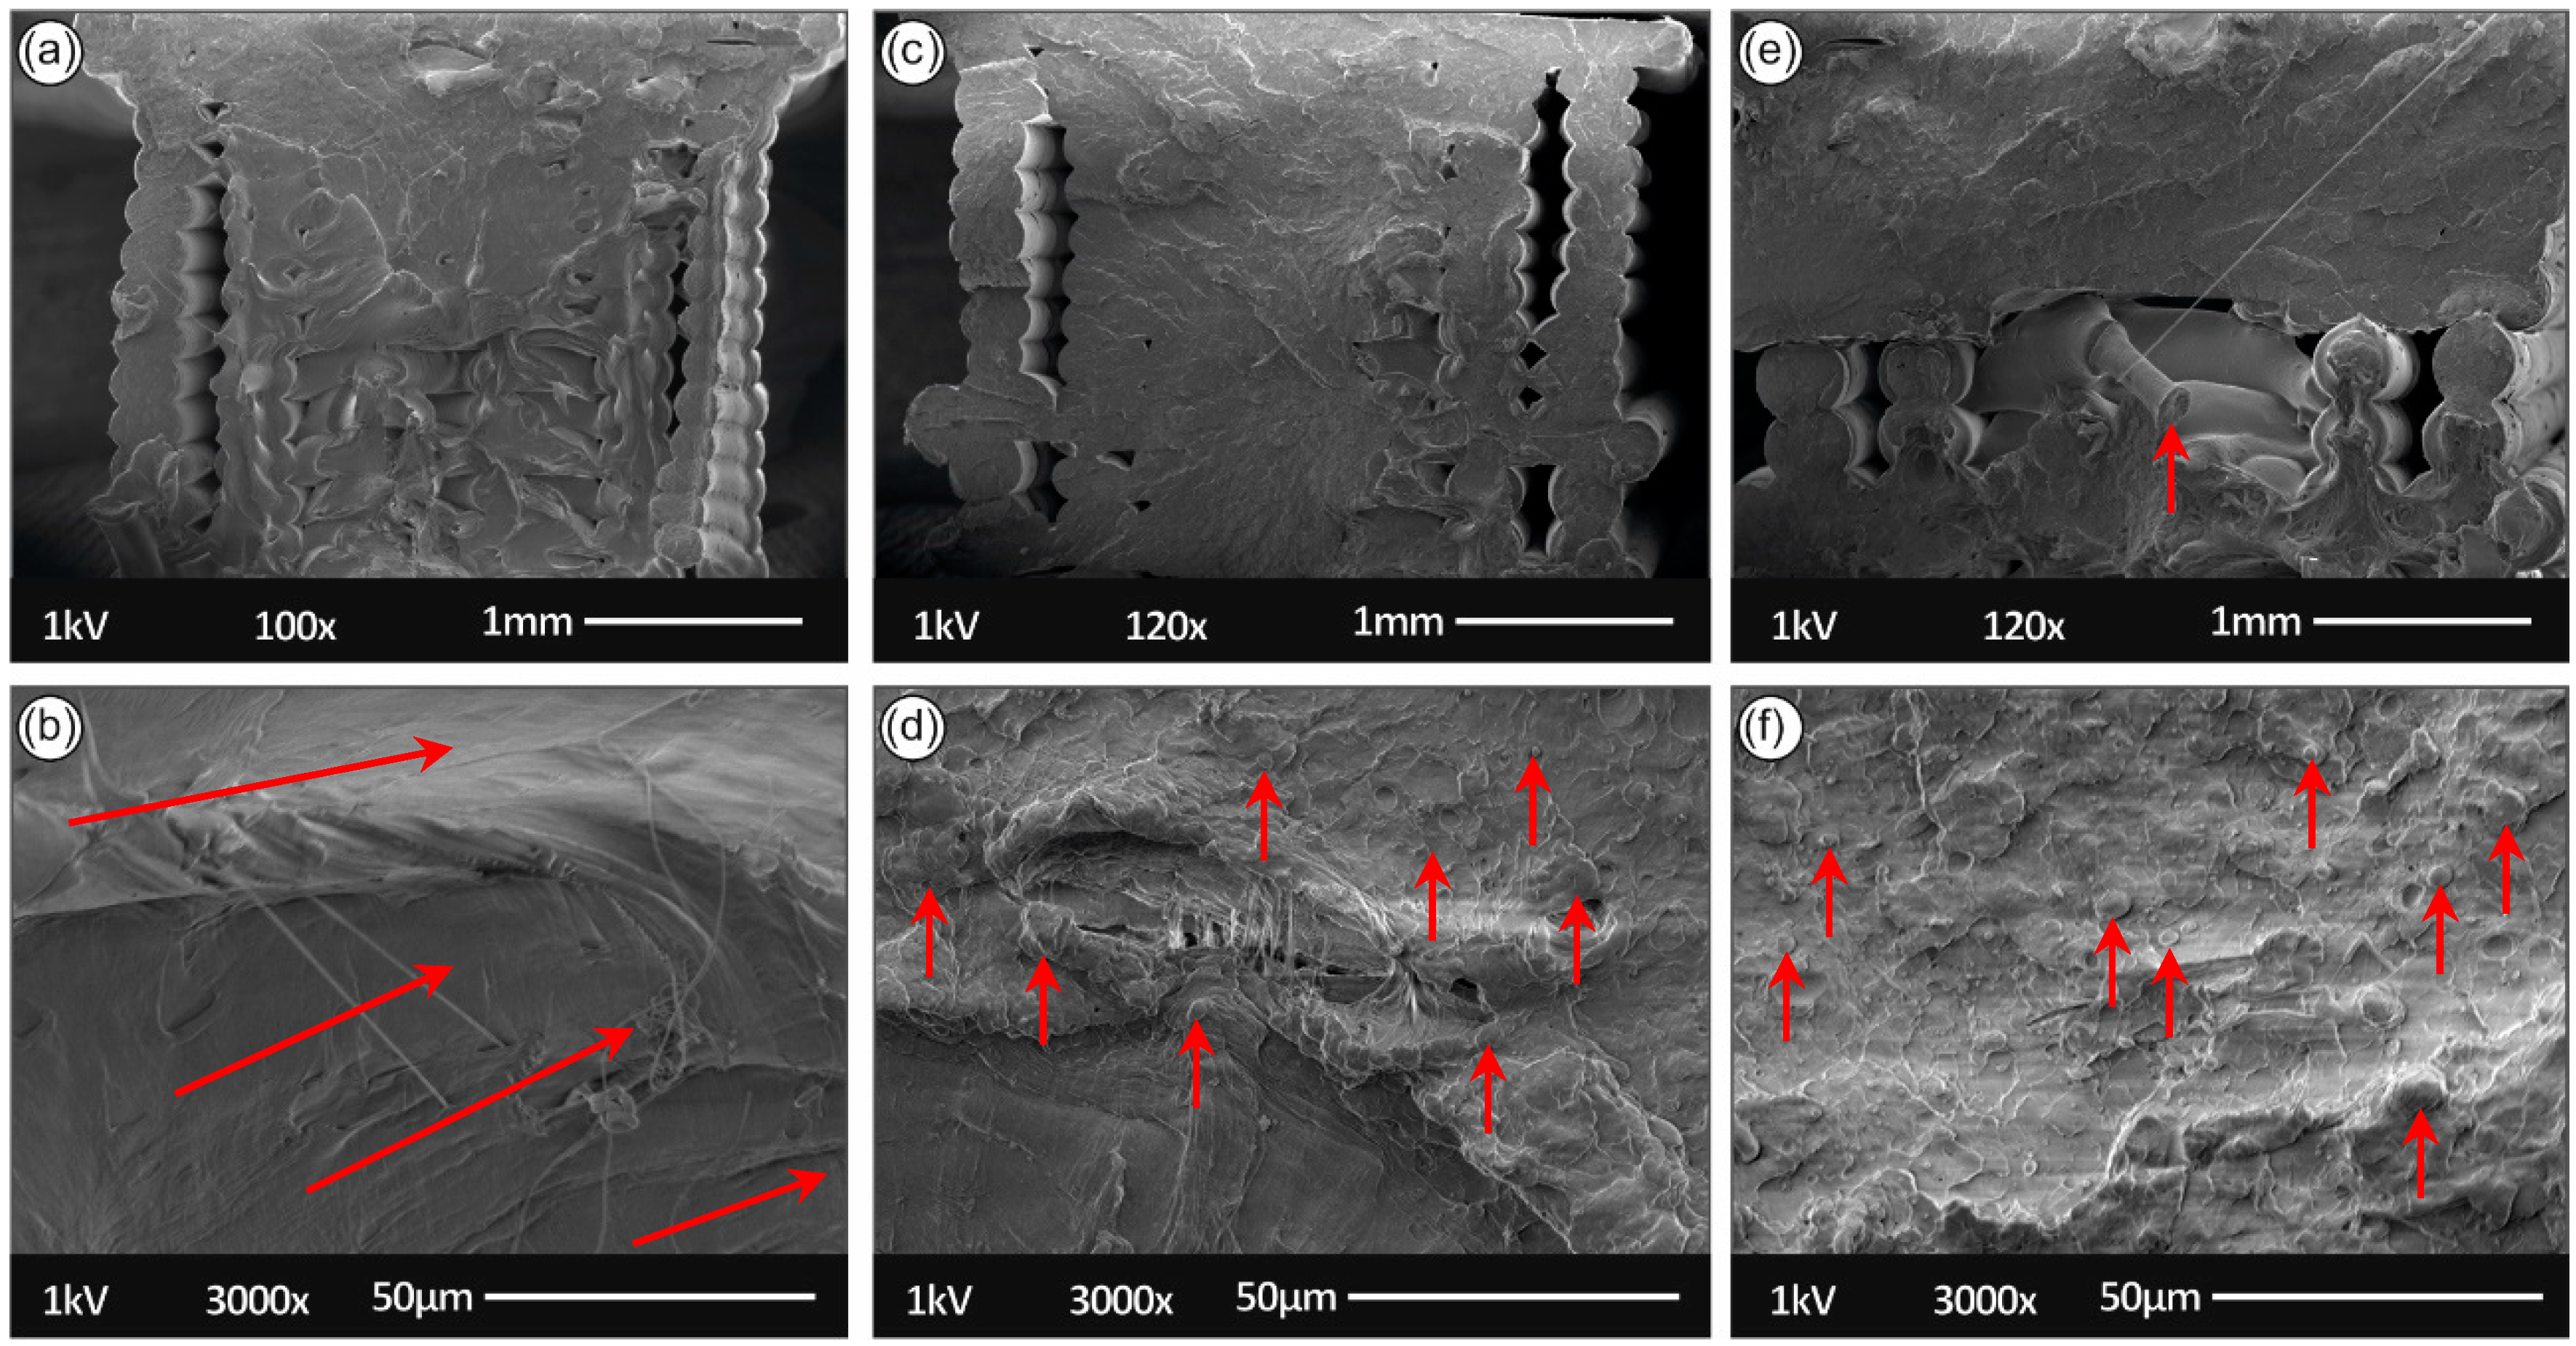
Figure 12 summarizes the SEM fractography images showing in detail the PP fractured surface microstructure characteristics.

4. Discussion

4.1. Mechanical Properties

Figure 13 summarizes the results of this study. Tensile test results show a slight reduction in the maximum tensile stress at break from 1st to 6th recycling course. Approximately 15% is the calculated reduction of the maximum tensile stress of the 1st in comparison to the 6th recycling course, while the highest difference is calculated between the 2nd and the 5th recycling courses. PP is a semi-crystalline material, and this makes it prone to different behavior regarding the percentage of crystallinity. The crystallinity percentage is affected by parameters, such as the temperature and the cooling rate of the material during the recycling procedure [27]. Polymeric chains are reoriented or shortened inside the material and this may cause a more brittle or ductile behavior. Crystallinity of PP polymer is affected from the repeated thermal stress procedures, but in general the reduction of the tensile strength and the tensile modulus of elasticity is less prone to changes of PP’s crystallinity. Spoerk et al. [10] have reported similar results regarding PP’s behavior in tension.
A rather different behavior was observed regarding the flexural strength and the flexural modulus of elasticity in the experiments conducted in this study. From 1st to 6th recycle course, a raise of approximately 45% was observed, owing probably to the changes in the polymer crystallinity due to the extrusion process and the size of the polymer’s chains [28]. From Figure 5b it can assumed that local distortions in polymeric chains start at lower stress values. This behavior is in agreement with findings from literature [29]. Impact resistance and microhardness are shown to have a rather stable behavior throughout the recycling courses.

4.2. Thermal Analysis Investigations

The TGA plots demonstrate the thermal stability and degradation temperature of PP after the different recycling rounds, revealing any plausible degradation of PP. Moreover, the TGA plots demonstrate the maximum operational temperature the 3D printed samples could be used as engineered thermoplastic materials [30]. Specifically, from the TGA curves information could be extracted about any potential thermal degradation may have occurred by the different recycling cycles, resulting thus into a knock-down effect on the material’s thermal stability and potentially mechanical properties [31]. Figure 8b shows accordingly a magnified temperature window of the area indicated in Figure 8a; namely from 205 °C to 435 °C.
As can be observed, all PP samples exhibited identical temperatures as the “onset of degradation” temperature (Ton), which was found to be ~207 °C. However, it is interesting to mention that from 207 °C to 443 °C all samples have been fully decomposed (shown in Figure 8a), and each sample followed a specific degradation trend with slight differences. The sample from the 2nd cycle exhibited the highest thermal stability, while the sample from the 6th cycle the lowest one. The main differentiation in the thermal degradation mechanism was observed from ~284 °C (Figure 8b), while the sample from the 2nd, 3rd, and 6th cycle decomposed fully at 436 °C, 425 °C, and 414 °C, respectively (known as the Td100% temperature, Figure 8b). Finally, the TGA curves show that the working temperature utilized in this study for all PP samples, both for recycling and 3D printing processes, are below the critical temperature of 284 °C, where PP in all cases starts rapidly to degrade with an abrupt weight loss.
The crystallization and melting characteristics of the 3D printed PP samples after the 2nd, 3rd, and 6th recycling cycles have been studied by DSC and shown in Figure 9. As it can be seen from Figure 9, all samples showed similar crystallization and melting patterns, indicating that the crystallinity of the samples has not been affected significantly as a result of the multiple processing cycles. The crystallization of PP was observed around 116 °C, while the melting of the α-crystals of PP can be seen at 161 °C. The crystallinity of the samples can be calculated from the ratio of the heat of fusion of the samples over that of a 100% crystalline polypropylene sample, which has been reported to be 207 J/g [32]. The degree of crystallinity of all three samples was in the order of 42%.
With regards to melting, the two samples after the 3rd and 6th cycle showed only one melting peak, while it is interesting to observe the small peak that has arisen in melting curves of the PP sample after the 2nd recycling round at around 130 °C. The specific peak can be attributed to the presence of β-polypropylene crystals that melt at this temperature range [33]. The multiple melt processing cycles that the PP samples have undergone means that they have been subjected to shear flows during extrusion and 3D printing; shear is known to affect the resulting morphology of PP, inducing this way the β-crystals into the crystalline structure of the polymer [34,35]. The increasing number of processing cycles’ leads to the development of melt shearing that induces both the growth of the β-modification of PP and the formation of oriented, thermodynamically stable α-crystals. The presence of β-crystals is expected to lead to higher energy dissipation during impact and enhanced impact strength.
However, it is worth mentioning that in this study this typical and theoretically expected behavior was not observed. Specifically, the percentage and fraction of β-crystals formed by the successive recycling cycles (shown by the corresponding DSC graphs; Figure 9a,b) is probably not enough to affect the materials impact resistance, as the main mechanism for enhancement. Namely, the average values and standard deviations of the calculated PP specimens’ impact strength (kJ/m2) were 4.70 ± 0.74 (1st recycling cycle), 6.15 ± 1.29 (2nd recycling cycle), 4.56 ± 1.37 (3rd recycling cycle), 4.29 ± 2.87 (6th recycling cycle), which reveals even a slight decrease in the samples’ impact properties.
This could be more specifically attributed to two main factors/ competitive mechanisms with the formation of the b-crystals that could finally affect the experimentally measured impact properties. These are the following, (i) the polymer chain’s shortening caused by the successive recycling cycles/ processing in air, supported also by the Raman and TGA results, as well as (ii) an increase in the polymer molecular weight polydispersity index (PDI), in other words polymeric chain lengths’ distribution, which results in a worse 3D printed sample quality with non-homogeneous layer thicknesses (Figure 11, SEM analysis), defects in consecutive layers, weak interfacial strength between the layers, etc., all of which are the consequence of the non-homogeneous melt viscosity that could be realized due to the co-existence of shorter and longer polymer chains. Therefore, all the above could yield a higher probability of crack formation (already existing cracks in the 3D printed samples structure) and crack initiation and propagation when the samples are exposed to the impact field, resulting further in a slight knock-down effect of the sample’s impact properties with the successive recycling cycles. A further analysis could be performed via XRD to highlight the changes that occur in the crystalline structure of PP after each recycling course and correlate it with the DSC results.

4.3. Raman Spectroscopic Analysis

Raman spectroscopy was utilized as a robust, rapid, and non-destructive analytical technique to demonstrate qualitatively any possible degradation of PP after the different multiple extrusions/recycling and 3D printing processes. Figure 10 illustrates the corresponding Raman spectra of 3D printed PP samples after the 2nd, 3rd and 6th recycling cycles, where it can be seen that Raman intensity of specific bands decrease with the increasing number of recycling cycles.
All acquired spectra have been treated with a baseline correction through subtraction of a linear or polynomial fit of the baseline from the raw spectra so as to remove tilted baseline variation caused by various noises, i.e., fluorescent background, etc. This is expected to ensure the accuracy of PP spectral characteristic bands as reported elsewhere in similar studies utilizing Raman to detect any possible degradation of PP by melt mixing consecutive processes [27].
As it can be observed in Figure 10, Raman intensities of 3D printed PP main characteristic bands vary after the 2nd, 3rd, and 6th recycling cycles. Specifically, Raman intensities of 1324 and 1454 cm−1 bands (attributed to -CH2 of the PP backbone macromolecular chains) gradually decrease with an increasing number of recycling cycles. Furthermore, similar changes/decrease in the spectral intensities could be observed also for the bands at 832, 967 and 1158 cm−1, suggesting the decrease of the C-C (stretching vibration), indicating a plausible PP chain shortening by the mechanical stress during consecutive recycling cycles. The same bands also are attributed to the -CH3 group rocking vibration [27].
Considering that the multiple extrusion process of PP is carried out in ambient conditions, the decrease of the -CH3 group band intensity indicates that free radicals may be terminated with oxygen-containing functional groups instead of -CH3 groups. As such, oxidative degradation may happen in the extrusion resulting into the shortening of the polymeric chains. The phenomenon PP polymer chains’ scission due to multiple extrusion processes has been previously also reported, resulting further in a decrease of the polymer molecular weight [28]. More specific the molecular weight, which represents the length of the PP macromolecular chains decreases as the degree of degradation increases. In other words, the number of chain scissions increases by the multiple 2nd, 3rd and 6th recycling cycles, which as expected is accompanied with a decrease of the material’s tensile properties [29]. Another interesting finding observed is that the Raman intensity of the above discussed bands sharply decreases from the 2nd to the 3rd recycling cycle, while the decrease is less pronounced after the 6th recycling cycle (specifically seen by the bands at 832 cm−1, 967 cm−1, 1158 cm−1 and 1324 cm−1).
In the current study, the multiple recycling cycles have shown that the decrease in the mechanical properties is not so intense, while in some cases there has even been observed an increase of the mechanical properties. This is more precisely deduced and attributed due to the fact that the occurring chain scission up to the 6th recycling cycle tested is not so prominent, while at the same time the induced crystallization that takes place by the shortened chains and the shear forces from the multiple extrusions and 3D printing (shown by the DSC analysis), counterbalances the knock-down effect of the mechanical properties.

4.4. AM. Samples’ Side Surface Morphology and Microstructure

All samples from the 2nd, 3rd, and 4th cycle of recycling exhibit homogeneous printed layer thickness without any observed micronized voids and/or discontinuities in the interlayers, most likely attributed to the optimum printing parameters used in our study, as well as the slight plausible degradation of the PP polymeric chains by the consecutive recycling cycles that can affect further the homogeneity of the polymer melt viscosity (affecting thus the 3D printing FFF process and the final quality of the 3D printed object.). It can be also further deduced that high quality 3D printed objects have been manufactured with good adhesion between the layers, which is likely to result further in high mechanical performance 3D printed components from recycled PP material. However, it is worth mentioning that the SEM images corresponding to the 3D printed PP sample after the 5th and 6th cycle of recycling show some inhomogeneity in the 3D printed layer thickness i.e., the thickness of each layer varies lengthwise, as well as some displacement of the additively printed sample’s layers could be observed, due to possibly some degradation that PP has undergone i.e., shortening of the polymeric chains that may affect the rheology of PP in the melt state [36]. Moreover, in both cases; 5th and 6th cycle of recycling (Figure 11d,e) the printed layers exhibit differences in the layer thicknesses for each sample, while all these observations are indicated in Figure 11d,e with the corresponding red arrows (inserted in each respective SEM image showing the sample’s side surface microstructure).

4.5. Fractography Microstructure Investigations

The fractography investigations of the tensile test specimen fractured surfaces could more precisely reveal the type of the underlying fracture mechanism [8]. Namely, Figure 12a,b at two different magnifications correspond to the PP fractured surface after the 2nd recycling course; while Figure 12c,d to the 3rd recycling cycle, and Figure 12e,f to the 6th recycling cycle, respectively. Each sample is shown at two different magnifications in order to elaborate the occurring macroscopic, as well as micron-scale failure, mechanisms, known to potentially follow in general a “brittle” or a “ductile” fracture failure mechanism [37].
As can be observed from the low magnification (100×) upper side images (Figure 12), there can be no significant differences in the samples’ fractured surface with a rather “brittle” fracture mechanism for all the samples exposed to quasi-static tensile loading conditions in the study at hand. Only in the case of PP, after the 3rd and 6th recycling cycle (Figure 12d,f respectively), the fractured surface appears with a slightly higher micro-roughness attributed potentially to a partially ductile and less brittle fracture mechanism, with an observed filament also appearing to be pulled out from the sample’s surface in Figure 12e (indicated with a red arrow). In the fractured surfaces, some polymer crystals could be also observed for the 3D printed PP samples after the 3rd and 6th recycling cycles in the high magnification images (Figure 12d,f respectively) indicated by red arrows, corroborating the findings from the DSC analysis.
This less brittle fracture mechanism observed by the SEM fractography for the 3D printed PP samples after the 3rd and 6th recycling cycles (Figure 12d,f respectively) is also in good agreement with the experimental stress- strain curves acquired in this work that demonstrate the stiffness and ductility of the different PP materials after each cycle of recycling. All the above could be more precisely attributed to the plausible chain scission occurring phenomena during the material’s recycling and reprocessing cycles, as have been well-documented by the corresponding DSC, TGA and Raman previous analyses in the current study.
From the high magnification fractography images, it can be seen that each sample shows some specific micron-sized characteristics, which is more precisely explained by the slight deterioration of the material’s stiffness after each recycling cycle. The surface in Figure 12b appears with some oriented lines (shown by the long red arrows), typical for a brittle fracture mechanism, where the energy that has been elastically stored in the macromolecular chains is abruptly released upon failure. However, this is not observed in Figure 12d,f with some polymer crystals observed in the fractured surfaces induced by the multiple melt processing and consecutive 3D printing cycles (shown by the inserted red arrows).

5. Conclusions

This research is focused on the effect of the thermomechanical treatment during the recycling process on the mechanical and thermal properties of virgin PP, over a specific number of recycling courses. In total six (6) recycling courses were conducted and tensile, flexural, impact, and microhardness properties were determined on FFF specimens after each recycling course. As for the mechanical properties, the fundamental conclusions could be the following:
  • Thermal stress has a negative effect on tensile properties of PP material when it comes to AM applications.
  • Flexural behavior of PP under repeated thermal reprocessing and used in AM processes seems to be improved.
  • Impact strength and microhardness show a rather neutral behavior under first six (6) thermal recycling processes.
Mechanical behavior of PP under repeatedly thermal stress shows a potential in a sustainable application in AM. PP displays a rather stable or improved mechanical behavior up to even six (6) thermal stressing courses. Potential further investigation and ongoing work could elucidate very specifically (i) the mechanism of induced PP crystallinity after the different reprocessing/ recycling cycles, and (ii) any potential crystals’ orientation due to the extrusion process. Specific experiments should be carried out thus during AM 3D printing, since the anisotropy of specimens in combination with the semi-crystalline PP seems to have a rather distinct effect on the samples’ mechanical performance.

Author Contributions

Conceptualization, N.V. and M.P.; methodology, M.P., E.V., L.T., N.M.; validation, M.P., L.T.; formal analysis, A.M., L.T., E.V.,N.M.; investigation, D.P., E.V., M.L.; resources, N.V., D.P., M.P.; data curation, N.V., M.P., E.V., M.L., A.M., N.M.; writing—original draft preparation, E.V., A.M.; writing—review and editing, M.P., A.M., L.T.; visualization, A.M., L.T., M.L.; supervision, N.V., V.M.; project administration, N.V., V.M. All authors have read and agreed to the published version of the manuscript.

Funding

This research received no external funding.

Institutional Review Board Statement

Not applicable.

Informed Consent Statement

Not applicable.

Data Availability Statement

The data presented in this study are available on request from the corresponding author.

Conflicts of Interest

The authors declare no conflict of interest.

References

  1. Barnes, J. Out of sight, out of mind: Plastic waste exports, psychological distance and consumer plastic purchasing. Glob. Environ. Change 2019, 58, 101943. [Google Scholar] [CrossRef]
  2. Bijaisoradat, O.; Luttapreecha, M.; Manuspiya, H. Eco composites with synergistic combinations of natural rubber latex and wood flour toughened recycled HDPE. Mater. Today Commun. 2020, 25, 101483. [Google Scholar] [CrossRef]
  3. Luedtke, J.; Gaugler, M.; Grigsby, J.; Krause, A. Understanding the development of interfacial bonding within PLA/wood-based thermoplastic sandwich composites. Ind. Crop. Prod. 2019, 127, 129–134. [Google Scholar] [CrossRef]
  4. Plastics—The Facts 2019 An Analysis of European Plastics Production, Demand and Waste Data 2019 23th April 2020. Available online: https://www.plasticseurope.org/application/files/1115/7236/4388/FINAL_web_version_Plastics_the_facts2019_14102019.pdf (accessed on 25 November 2020).
  5. Technavio. Global Recycled Plastics Market 2018–2022 (IRTNTR21968); Infiniti Research Limited: Toronto, ON, Canada, 2019. [Google Scholar]
  6. Diegel, O. 10.02 Additive Manufacturing. In Comprehensive Materials Processing; Hashmi, S., Batalha, G.F., van Tyne, C.J., Yilbas, B., Eds.; Elsevier: Oxford, UK, 2014; pp. 3–18. [Google Scholar]
  7. Vidakis, N.; Petousis, M.; Maniadi, A.; Koudoumas, E.; Vairis, A.; Kechagias, J. Sustainable additive manufacturing: Mechanical response of acrylonitrile-butadiene-styrene over multiple recycling processes. Sustainability 2020, 12, 3568. [Google Scholar] [CrossRef]
  8. Vidakis, N.; Petousis, M.; Maniadi, A.; Koudoumas, E.; Liebscher, M.; Tzounis, L. Mechanical properties of 3D-printed acrylonitrile-butadiene-styrene TiO2 and ATO nanocomposites. Polymers 2020, 12, 1589. [Google Scholar] [CrossRef] [PubMed]
  9. Vidakis, N.; Petousis, M.; Maniadi, A.; Koudoumas, E.; Kenanakis, G.; Romanitan, C.; Tutunaru, O.; Suchea, M.; Kechagias, J. The mechanical and physical properties of 3D-Printed materials composed of ABS-ZnO nanocomposites and ABS-ZnO microcomposites. Micromachines 2020, 11, 615. [Google Scholar] [CrossRef]
  10. Spoerk, M.; Arbeiter, F.; Raguž, I.; Holzer, C.; Gonzalez-Gutierrez, J. Mechanical recyclability of polypropylene composites produced by material extrusion-based additive manufacturing. Polymers 2019, 11, 1318. [Google Scholar] [CrossRef] [Green Version]
  11. Singh, S.; Ramakrishna, S. Recycling of Thermoplastic Wastes: A Route of Waste to Wealth via Three-Dimensional Printing; Elsevier Ltd.: Oxford, UK, 2020; ISBN 9780128203521. [Google Scholar]
  12. Spina, R.; Cavalcante, B. Preliminary analysis of extruded PP filaments for FFF. Procedia Manuf. 2020, 47, 915–919. [Google Scholar] [CrossRef]
  13. Khosravani, M.R.; Reinicke, T. On the environmental impacts of 3D printing technology. Appl. Mater. Today 2020, 20, 100689. [Google Scholar] [CrossRef]
  14. Grigorescu, R.M.; Ghioca, P.; Iancu, L.; David, M.E.; Andrei, E.R.; Filipescu, M.I.; Ion, R.M.; Vuluga, Z.; Anghel, I.; Sofran, I.E.; et al. Development of thermoplastic composites based on recycled polypropylene and waste printed circuit boards. Waste Manag. 2020, 118, 391–401. [Google Scholar] [CrossRef]
  15. Othman, M.H. Recycled Polypropylene-Nanoclay Composites—Mechanical Properties; Elsevier Ltd.: Oxford, UK, 2020; ISBN 9780128035818. [Google Scholar]
  16. Rokbi, M.; Khaldoune, A.; Sanjay, M.R.; Senthamaraikannan, P.; Ati, A.; Siengchin, S. Effect of processing parameters on tensile properties of recycled polypropylene based composites reinforced with jute fabrics. Int. J. Light. Mater. Manuf. 2020, 3, 144–149. [Google Scholar] [CrossRef]
  17. Stoof, D.; Pickering, K. Sustainable composite fused deposition modelling filament using recycled pre-consumer polypropylene. Compos. Part B Eng. 2018, 135, 110–118. [Google Scholar] [CrossRef]
  18. Zander, N.E.; Gillan, M.; Burckhard, Z.; Gardea, F. Recycled polypropylene blends as novel 3D printing materials. Addit. Manuf. 2019, 25, 122–130. [Google Scholar] [CrossRef]
  19. An Lin, T.; Lin, J.H.; Bao, L. Polypropylene/thermoplastic polyurethane blends: Mechanical characterizations, recyclability and sustainable development of thermoplastic materials. J. Mater. Res. Technol. 2020, 9, 5304–5312. [Google Scholar] [CrossRef]
  20. Souza Rosa, C.H.S.; Mothé, M.G.; Vieira Marques, M.F.; Mothé, C.G.; Monteiro, S.N. Steam-exploded fibers of almond tree leaves as reinforcement of novel recycled polypropylene composites. J. Mater. Res. Technol. 2020, 9, 11791–11800. [Google Scholar] [CrossRef]
  21. Dizon, J.R.C.; Espera, A.H.; Chen, Q.; Advincula, R.C. Mechanical characterization of 3D-printed polymers. Addit. Manuf. 2018, 20, 44–67. [Google Scholar] [CrossRef]
  22. Core, B. 3D Printing 2019–2029 Technology and Market Analysis; IDTechEx: Cambridge, UK, 2019. [Google Scholar]
  23. Jin, M.; Neuber, C.; Schmidt, H.W. Tailoring polypropylene for extrusion-based additive manufacturing. Addit. Manuf. 2020, 33, 101101. [Google Scholar] [CrossRef]
  24. Fischer, J. Handbook of Molded Part Shrinkage and Warpage; William Andrew: Oxford, UK, 2012. [Google Scholar]
  25. Saxena, P.; Stavropoulos, P.; Kechagias, J.; Salonitis, K. Sustainability Assessment for Manufacturing Operations. Energies 2020, 13, 2730. [Google Scholar] [CrossRef]
  26. Salonitis, K.; Stavropoulos, P. On the Integration of the CAx Systems Towards Sustainable Production. Procedia CIRP 2013, 9, 115–120. [Google Scholar] [CrossRef] [Green Version]
  27. Guo, X.; Lin, Z.; Wang, Y.; He, Z.; Wang, M.; Jin, G. In-Line Monitoring the Degradation of Polypropylene under Multiple Extrusions Based on Raman Spectroscopy. Polymers 2019, 11, 1698. [Google Scholar] [CrossRef] [Green Version]
  28. González-González, V.A.; Neira-Velázquez, G.; Angulo-Sánchez, J.L. Polypropylene chain scissions and molecular weight changes in multiple extrusion. Polym. Degrad. Stab. 1998, 60, 33–42. [Google Scholar] [CrossRef]
  29. da Costa, H.M.; Ramos, V.D.; de Oliveira, M.G. Degradation of polypropylene (PP) during multiple extrusions: Thermal analysis, mechanical properties and analysis of variance. Polym. Test. 2007, 26, 676–684. [Google Scholar] [CrossRef]
  30. Vidakis, N.; Petousis, M.; Velidakis, E.; Liebscher, M.; Tzounis, L. Three-Dimensional Printed Antimicrobial Objects of Polylactic Acid (PLA)-Silver Nanoparticle Nanocomposite Filaments Produced by an In-Situ Reduction Reactive Melt Mixing Process. Biomimetics 2020, 5, 42. [Google Scholar] [CrossRef] [PubMed]
  31. Tzounis, L.; Hegde, M.; Liebscher, M.; Dingemans, T.; Pötschke, P.; Paipetis, A.S.; Zafeiropoulos, N.E.; Stamm, M. All-aromatic SWCNT-Polyetherimide nanocomposites for thermal energy harvesting applications. Compos. Sci. Technol. 2018, 156, 158–165. [Google Scholar] [CrossRef]
  32. Gee, D.R.; Melia, T.P. Thermal properties of melt and solution crystallized isotactic polypropylene. Die Makromol. Chem. 1970, 132, 195–201. [Google Scholar] [CrossRef]
  33. Papageorgiou, D.G.; Bikiaris, D.N.; Chrissafis, K. Effect of crystalline structure of polypropylene random copolymers on mechanical properties and thermal degradation kinetics. Thermochim. Acta 2012, 543, 288–294. [Google Scholar] [CrossRef]
  34. Papageorgiou, D.G.; Chrissafis, K.; Bikiaris, D.N. β-Nucleated Polypropylene: Processing, Properties and Nanocomposites. Polym. Rev. 2015, 55, 596–629. [Google Scholar] [CrossRef]
  35. Wang, L.; Yang, M.-B. Unusual hierarchical distribution of β-crystals and improved mechanical properties of injection-molded bars of isotactic polypropylene. Rsc Adv. 2014, 4, 25135–25147. [Google Scholar] [CrossRef]
  36. Tzounis, L.; Gärtner, T.; Liebscher, M.; Pötschke, P.; Stamm, M.; Voit, B.; Heinrich, G. Influence of a cyclic butylene terephthalate oligomer on the processability and thermoelectric properties of polycarbonate/MWCNT nanocomposites. Polymer 2014, 55, 5381–5388. [Google Scholar] [CrossRef]
  37. Tzounis, L.; Petousis, M.; Grammatikos, S.; Vidakis, N. 3D Printed Thermoelectric Polyurethane/Multiwalled Carbon Nanotube Nanocomposites: A Novel Approach towards the Fabrication of Flexible and Stretchable Organic Thermoelectrics. Materials 2020, 13, 2879. [Google Scholar] [CrossRef]
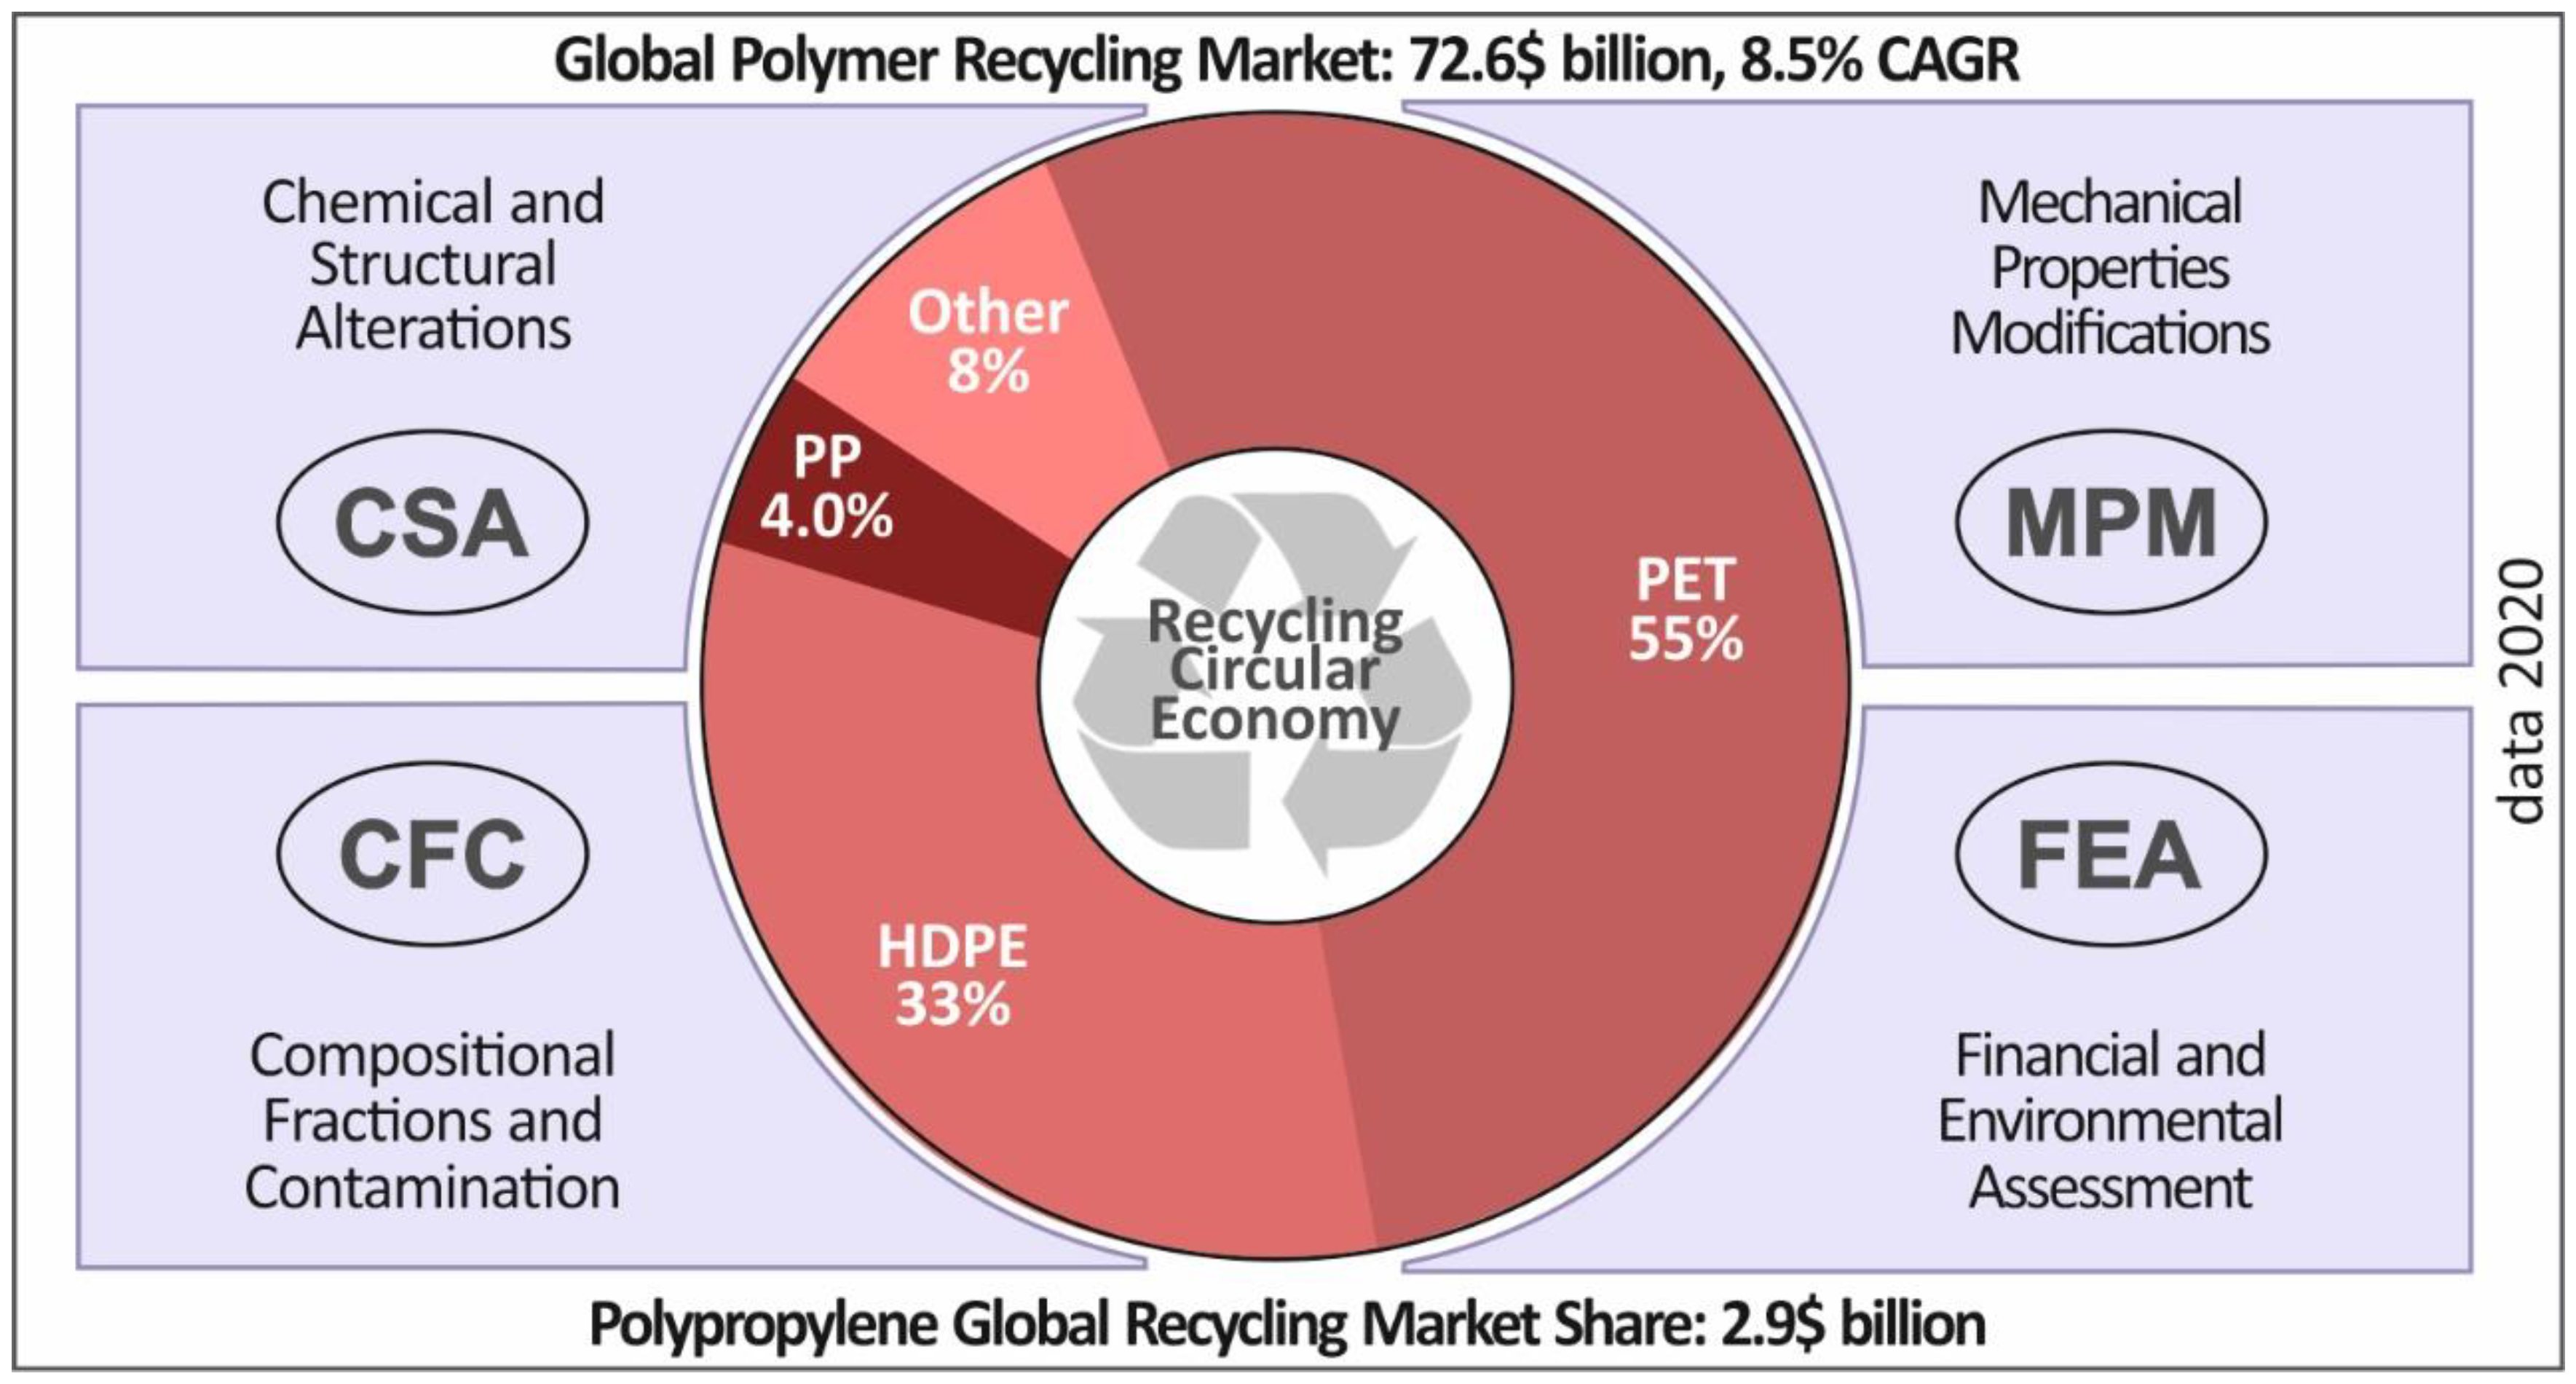
Figure 1. Global recycling circular economy critical parameters and global recycled plastics market volume in 2020 (market volume data source: Technavio. Global Recycled Plastics Market 2018–2022 (IRTNTR21968).
Sustainability 13 00159 g001
Figure 2. Recycling methodology flow chart followed in this work.
Sustainability 13 00159 g002
Figure 3. 3D printing parameters utilized for this work.
Sustainability 13 00159 g003
Figure 4. Recycling course comparative graphs (a) tensile experimental setup; (b) tensile stress vs strain graphs of a specific specimen from each recycling course (in all cases, specimen no 2 was selected); (c) average value and deviation of the tensile strength results for all the recycling courses studied; (d) and average value and deviation of the tensile modulus of elasticity values for the recycling courses studied.
Sustainability 13 00159 g004
Figure 5. Recycling course comparative graphs (a) flexion experimental setup; (b) flexural stress vs strain graphs of a specific specimen from each recycling course (in all cases, specimen no 2 was selected); (c) average value and deviation of the flexural strength results for all the recycling courses studied; (d) and average value and deviation of the flexural modulus of elasticity values for the recycling courses studied.
Sustainability 13 00159 g005
Figure 6. (a) Average values and deviation of the impact strength for all the recycling courses studied; (b) Charpy’s impact test experimental setup.
Sustainability 13 00159 g006
Figure 7. (a) Vickers microhardness average values and deviation for all the recycling courses studied; (b) microhardness Vickers experimental setup.
Sustainability 13 00159 g007
Figure 8. Experimentally determined TGA weight loss (wt.%) versus temperature curves for the 2nd recycle, as well as after the material has been recycled and 3D printed for the 3rd and 6th cycle, respectively, shown at temperature windows of (a) 50 °C to 550 °C and (b) 205 °C to 435 °C.
Sustainability 13 00159 g008
Figure 9. (a) DSC scans for 3D printed PP samples after the 2nd, 3rd and 6th recycling cycle, (b) zoom of the graph in the areas of interest.
Sustainability 13 00159 g009
Figure 10. Raman spectra of 3D printed PP samples after the 2nd, 3rd and 6th recycling cycle.
Sustainability 13 00159 g010
Figure 11. SEM images of the 3D printed PP samples’ side-surface microstructure and morphology fabricated at a 150 µm 3D printed layer thickness, after the (a) 2nd, (b) 3rd, (c) 4th, (d) 5th and (e) 6th cycle of recycling (all images acquired at 200× magnification).
Sustainability 13 00159 g011
Figure 12. SEM fractography images of PP fractured surface microstructure characteristics. (a,b): PP fractured surface after the 2nd recycling cycle; (c,d): PP fractured surface after the 3rd recycling cycle; (e,f): PP fractured surface after the 6th recycling cycle (all images shown at two different magnifications).
Sustainability 13 00159 g012
Figure 13. Overall results on the mechanical properties of PP in the 6 recycle courses studied.
Sustainability 13 00159 g013
Publisher’s Note: MDPI stays neutral with regard to jurisdictional claims in published maps and institutional affiliations.