Abstract
An early warning of a flash flood is essential to prevent the general public from the hazardous flooding events, however, the rapid variation of human activities has led to the uncertainty of risk in prone areas. The lack of a systematic record of flash flood events introduces challenges to flash flood-related research. Herein, we map spatial and temporal variations in flash floods in China from 1950 to 2015 and establish a general ordered logit model in a geographic information environment to estimate the association between the occurrence of flash flood events and natural conditions and the variation of human activities at the watershed level. The results showed that precipitation is an important cause of flash flooding, and demonstrate that anthropogenic intervention (heavy rainfall, density of villages, and vegetation cover) in the environment affect the likelihood of flash floods. We found that the likelihood of flash floods in China may increase with the air quality worsening and that the occurrence of flash floods is strongly correlated with vegetation cover. Our findings suggest a need for further investigation of the link between air quality and flash flooding in flood-prone areas.
1. Introduction
As a result of intensive human activities and climate change, floods have become increasingly frequent [1]. Floods cause 50 billion USD of economic losses on average each year and accounted for 25.6% of total economic losses from catastrophic events during 2007–2016 and one third of losses in 2016 [2]. In particular, flash floods—characterized by a rapid onset of flooding with a short duration and relatively high peak discharge—jeopardize people’s lives and cause severe damage to infrastructure and the environment [3,4,5]. Whether in rainy south Asia or arid Middle East, flash floods are an important threat to population and economy [6,7]. In China, nearly 70% of land is covered by mountains [8]. There are 560 million people living in mountainous areas, where flash floods are likely to be one of the most important hazards to mitigate or adapt to [9]. Flash flood scaused an average of 800 deaths or missing persons per year between 2010 and 2016, and in this respect, they have become the major cause of injuries and casualties in China [10].
A huge amount of effort has been made to estimate or forecast the risk of flash floods by advancing meteorological, hydrological, engineering, and geographical models [11,12,13]. However, the modelling of flash floods in mountainous areas is challenging, as pre-assumed space-dependent rainfall-runoff relations require rainfall forecasting, which is very hard to do for a small basin and makes hydrological models difficult to apply [14,15]. An especially important point is that flash floods are affected by various factors, and some factors of human activities are continuously evolving, such as population distribution, economic capacity, and changes in rainfall characteristics caused by air pollution [12]. It is necessary to consider the impact of spatiotemporal variation of human activities on flash floods, especially in China, which is undergoing rapid urbanization, economic restructuring, ecological restoration, and other important processes [16].
Research on the influence of various temporal and spatial factors on flash flood has been carried out all over the world, such as China, the United States, and other mountainous areas. However, there are differences in climate conditions and basin characteristics in different regions or countries, for example, in areas with heavy rainfall and frequent rainstorms, the rainfall pattern may be the main factor leading to flash floods [6], while in the arid Middle East, the hydrological characteristics of the basin may be the main factor affecting the flash floods [7]. Many factors related to natural conditions and human activities have been studied as influencing factors, such as local annual precipitation, average slope, vegetation coverage, population density, per capita GDP, etc. [10,17,18,19,20,21] Analysis models are also very rich, such as the logistic regression model, geographical detector model [10], Bayesian classification model [22], analytic hierarchy process model [23], vector machine model [19], and so on. Previous studies vary greatly in modelling potentially relevant factors but do reveal that flash floods are a composite result of climate variability, exposure, and vulnerability in flood-prone areas [24]. However, up to now, previous studies concentrated on static factors, such as topography, soil, etc., or dynamic factors in a certain period, such as population distribution, GDP, etc. [25] Few studies have focused on the impact of human activity variation rather than human activity indicators of a certain period on flash flood, as well as some indirect human activity impacts, such as climate pollution, which affects rainfall [26], the main cause of flash flood.
The interaction between global climate change and local anthropogenic stresses affects the precipitation and surface hydrological process, and then affects vegetation, phenology, water balance, and so on [27,28]. The evolution of earth’s surface related to flash flood in mountainous areas includes vegetation cover change, population density increase, economic growth, etc. There is no direct relationship between atmospheric environment and flash flood, but recent studies have claimed that aerosols [26] and air quality (PM2.5) [29] may increase the frequency of extreme precipitation. The spatial correlation between days of low visibility (caused mainly by PM2.5) and rainfall increased from 44% in the 1950s to 58% in the 2000s [30]. Serious urban waterlogging caused by increased rainfall is concerned, such as Wuhan, Nanjing, Guangzhou, and other cities [31]. However, the impact of increased rainfall in mountain areas is seldom noticed. The low population density in mountainous areas may be the main reason. Of course, the lack of a systematic record of these events also introduces challenges to flash flood-related research [32]. Therefore, it is worthwhile and interesting to establish whether there is a correlation between air quality and flash floods.
Considering the vast mountainous area of China, including tropical areas with heavy rainfall, such as Guangdong Province and Hainan Province, as well as arid northwest areas, such as Xinjiang and Gansu Province, the systematic analysis of flash floods in China is of great significance to the prevention and control of flash floods in different regions of the world. In order to cope with the influence of human activities variation on flash flood, this paper collected the records of flash floods in China from 1950 to 2015, and selected PM2.5 as the environmental pollution factor, due to data availability. Of course, the terrain, vegetation, population, and other direct factors are included. Firstly, we map spatial and temporal variations in flash floods in China from 1950 to 2015 using more than 60,000 records, then establish a general ordered logit model in a geographic information environment to estimate the association between the occurrence of flash flood events and natural and human activities at the watershed level in flood-prone areas.
2. Materials and Methods
2.1. Data Resources and Data Processing
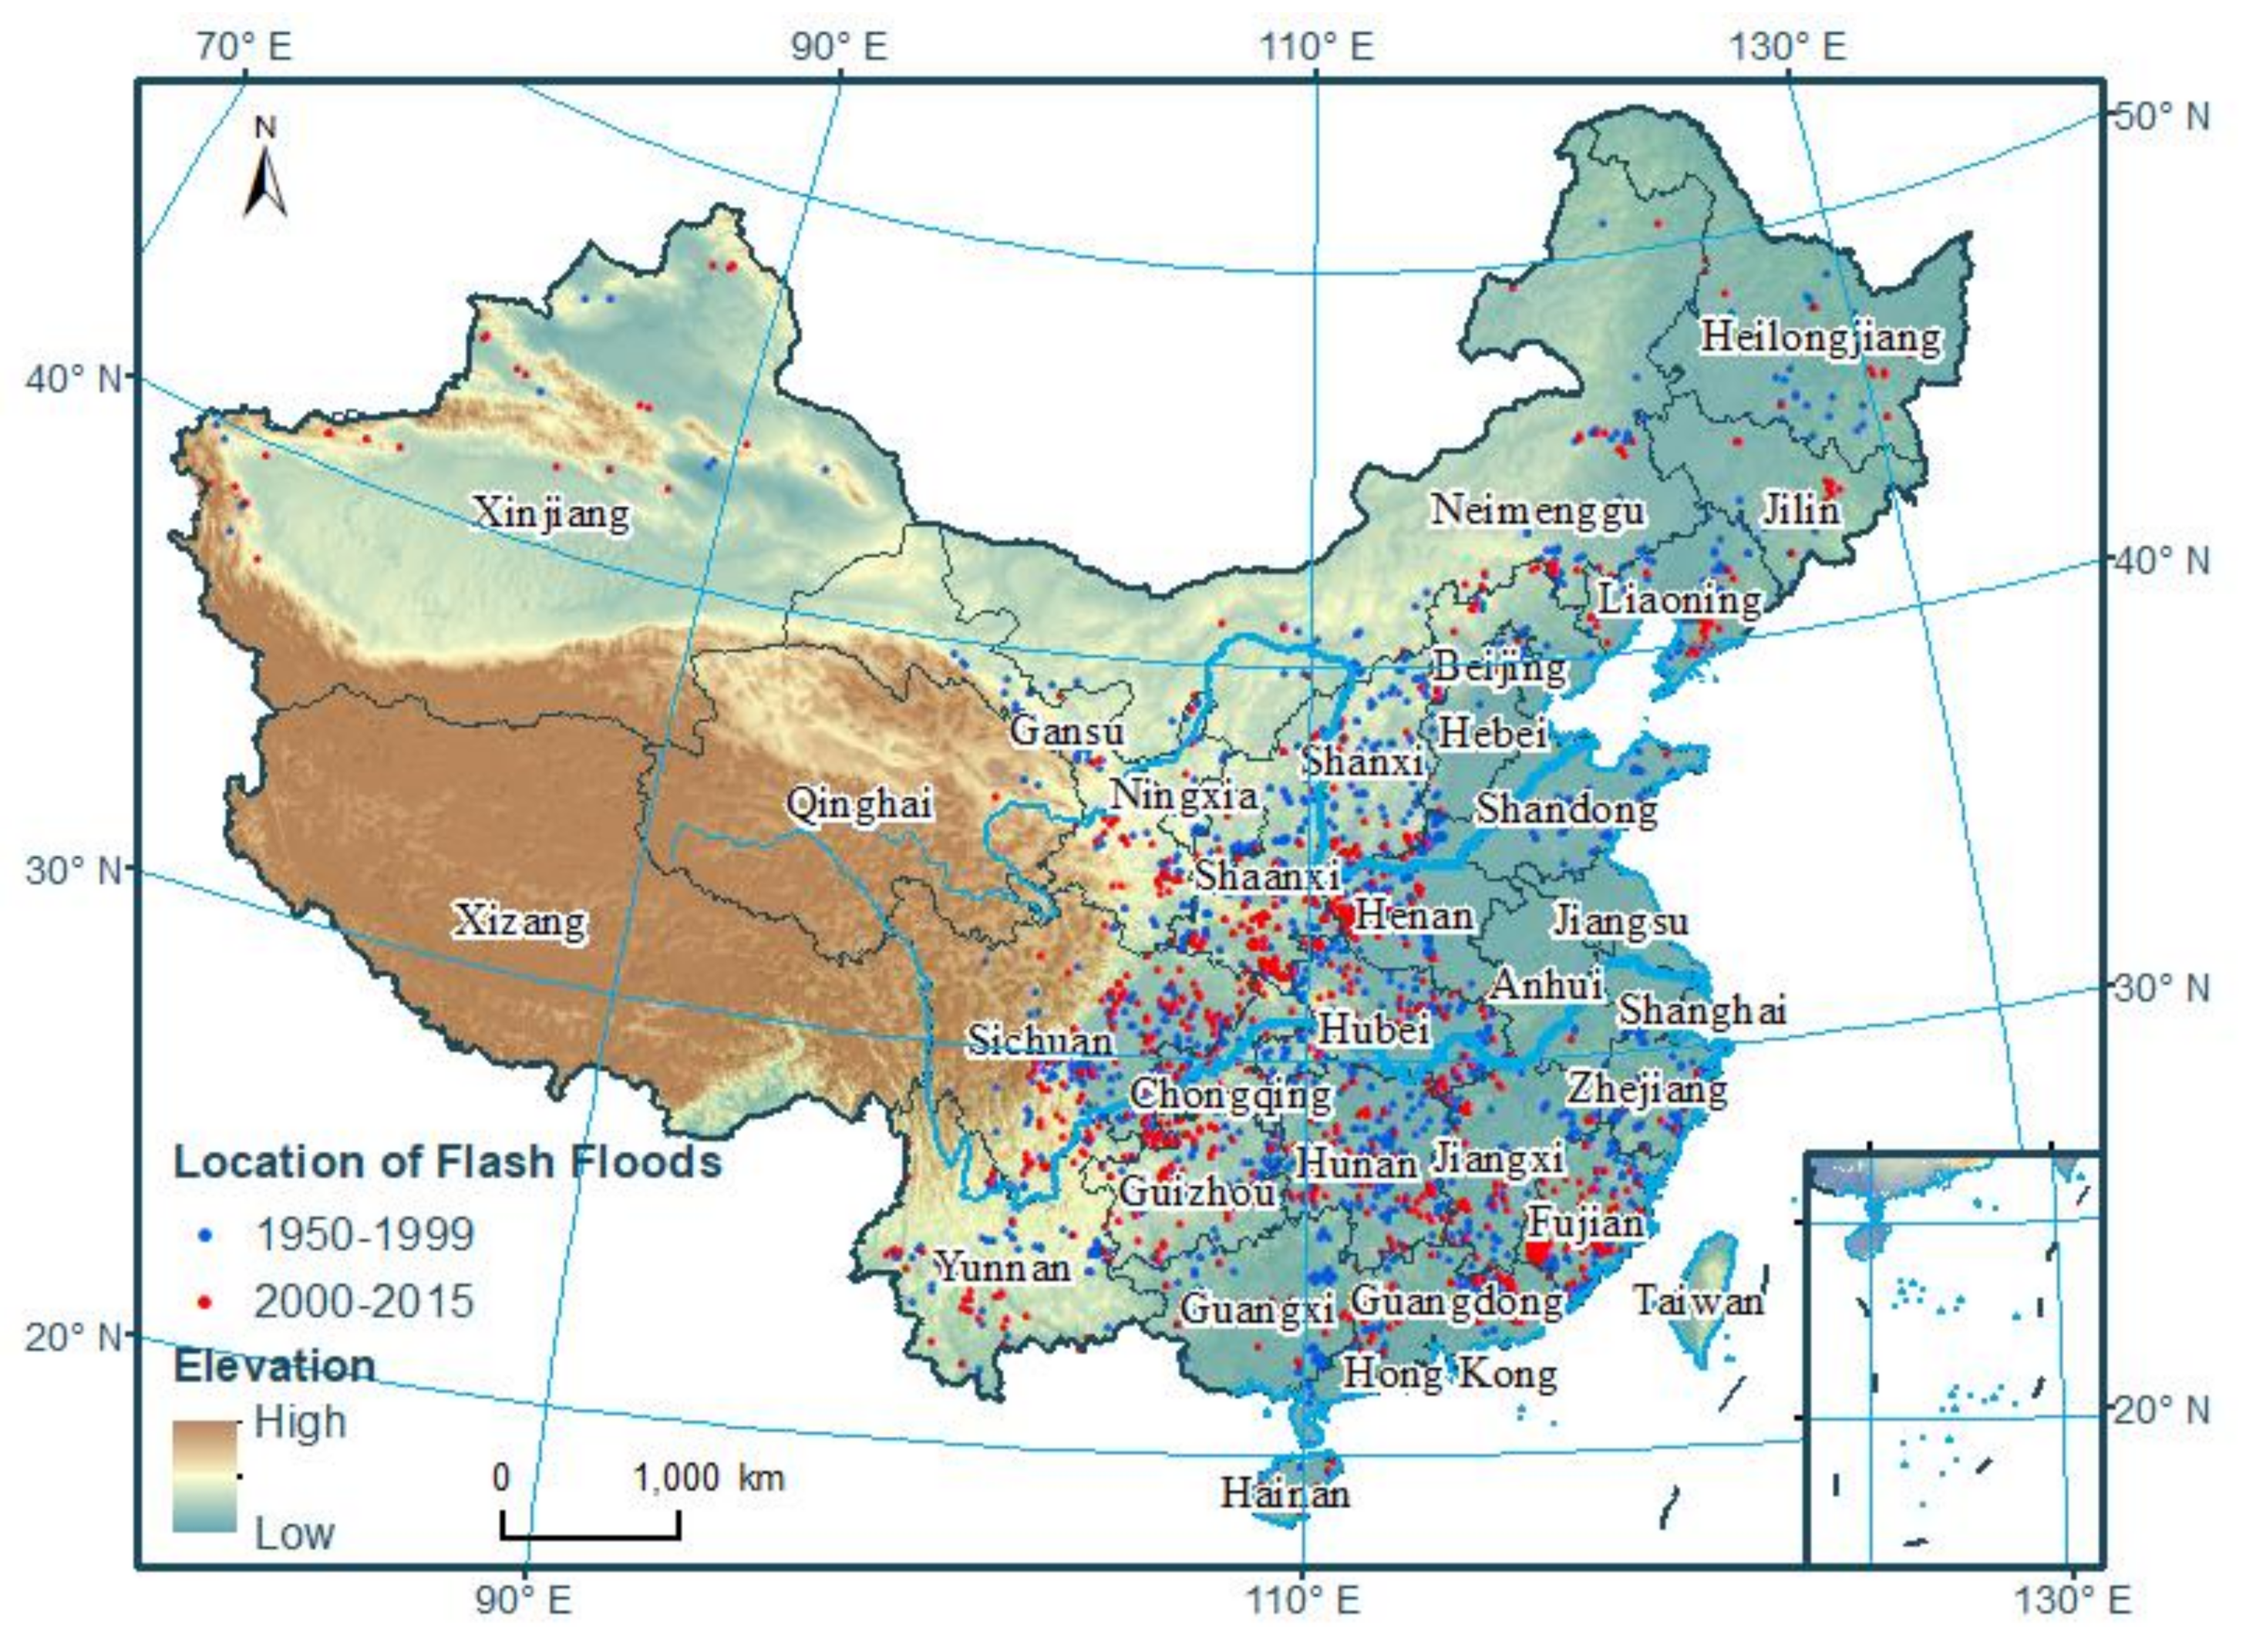
Since 2013, the Chinese government has worked to collect and compile all flash flood events from 1950 to 2015 across mainland China under the National Flash Flood Investigation and Evaluation Project (NFFIEP), making it perhaps one of the largest datasets of flash flood disasters worldwide [32]. The NFFIE Project was conducted in China on a countrywide scale from 2012 to 2015. The project covered30 provinces, 305 cities, and 2058 counties with a total land area of 7.55 million km2 and a total population of nearly 900 million. In each county, a team was responsible for collecting historical flash floods. Each team identified flash floods through local disaster records, records of disaster prevention and control departments, and casualty records. Compared to other existing studies, the project covered the widest scope in terms of spatial scale, time span, and the number of flash flood events. The project collected more than 60,000 flash flood events that have occurred from 1950 to 2015, which includes historical records and information (such as occurrence time and location) [33]. Various means are applied to ensure the consistency of data between different regions in the project [33]. Due to data availability constraints, events from 2000 to 2015 (involving 11,083 records collected from NFFIEP) were observed and pre-processed in a geographical information system (Figure 1).

Figure 1.
Spatial distribution of flash flood events in China (1950–2015).
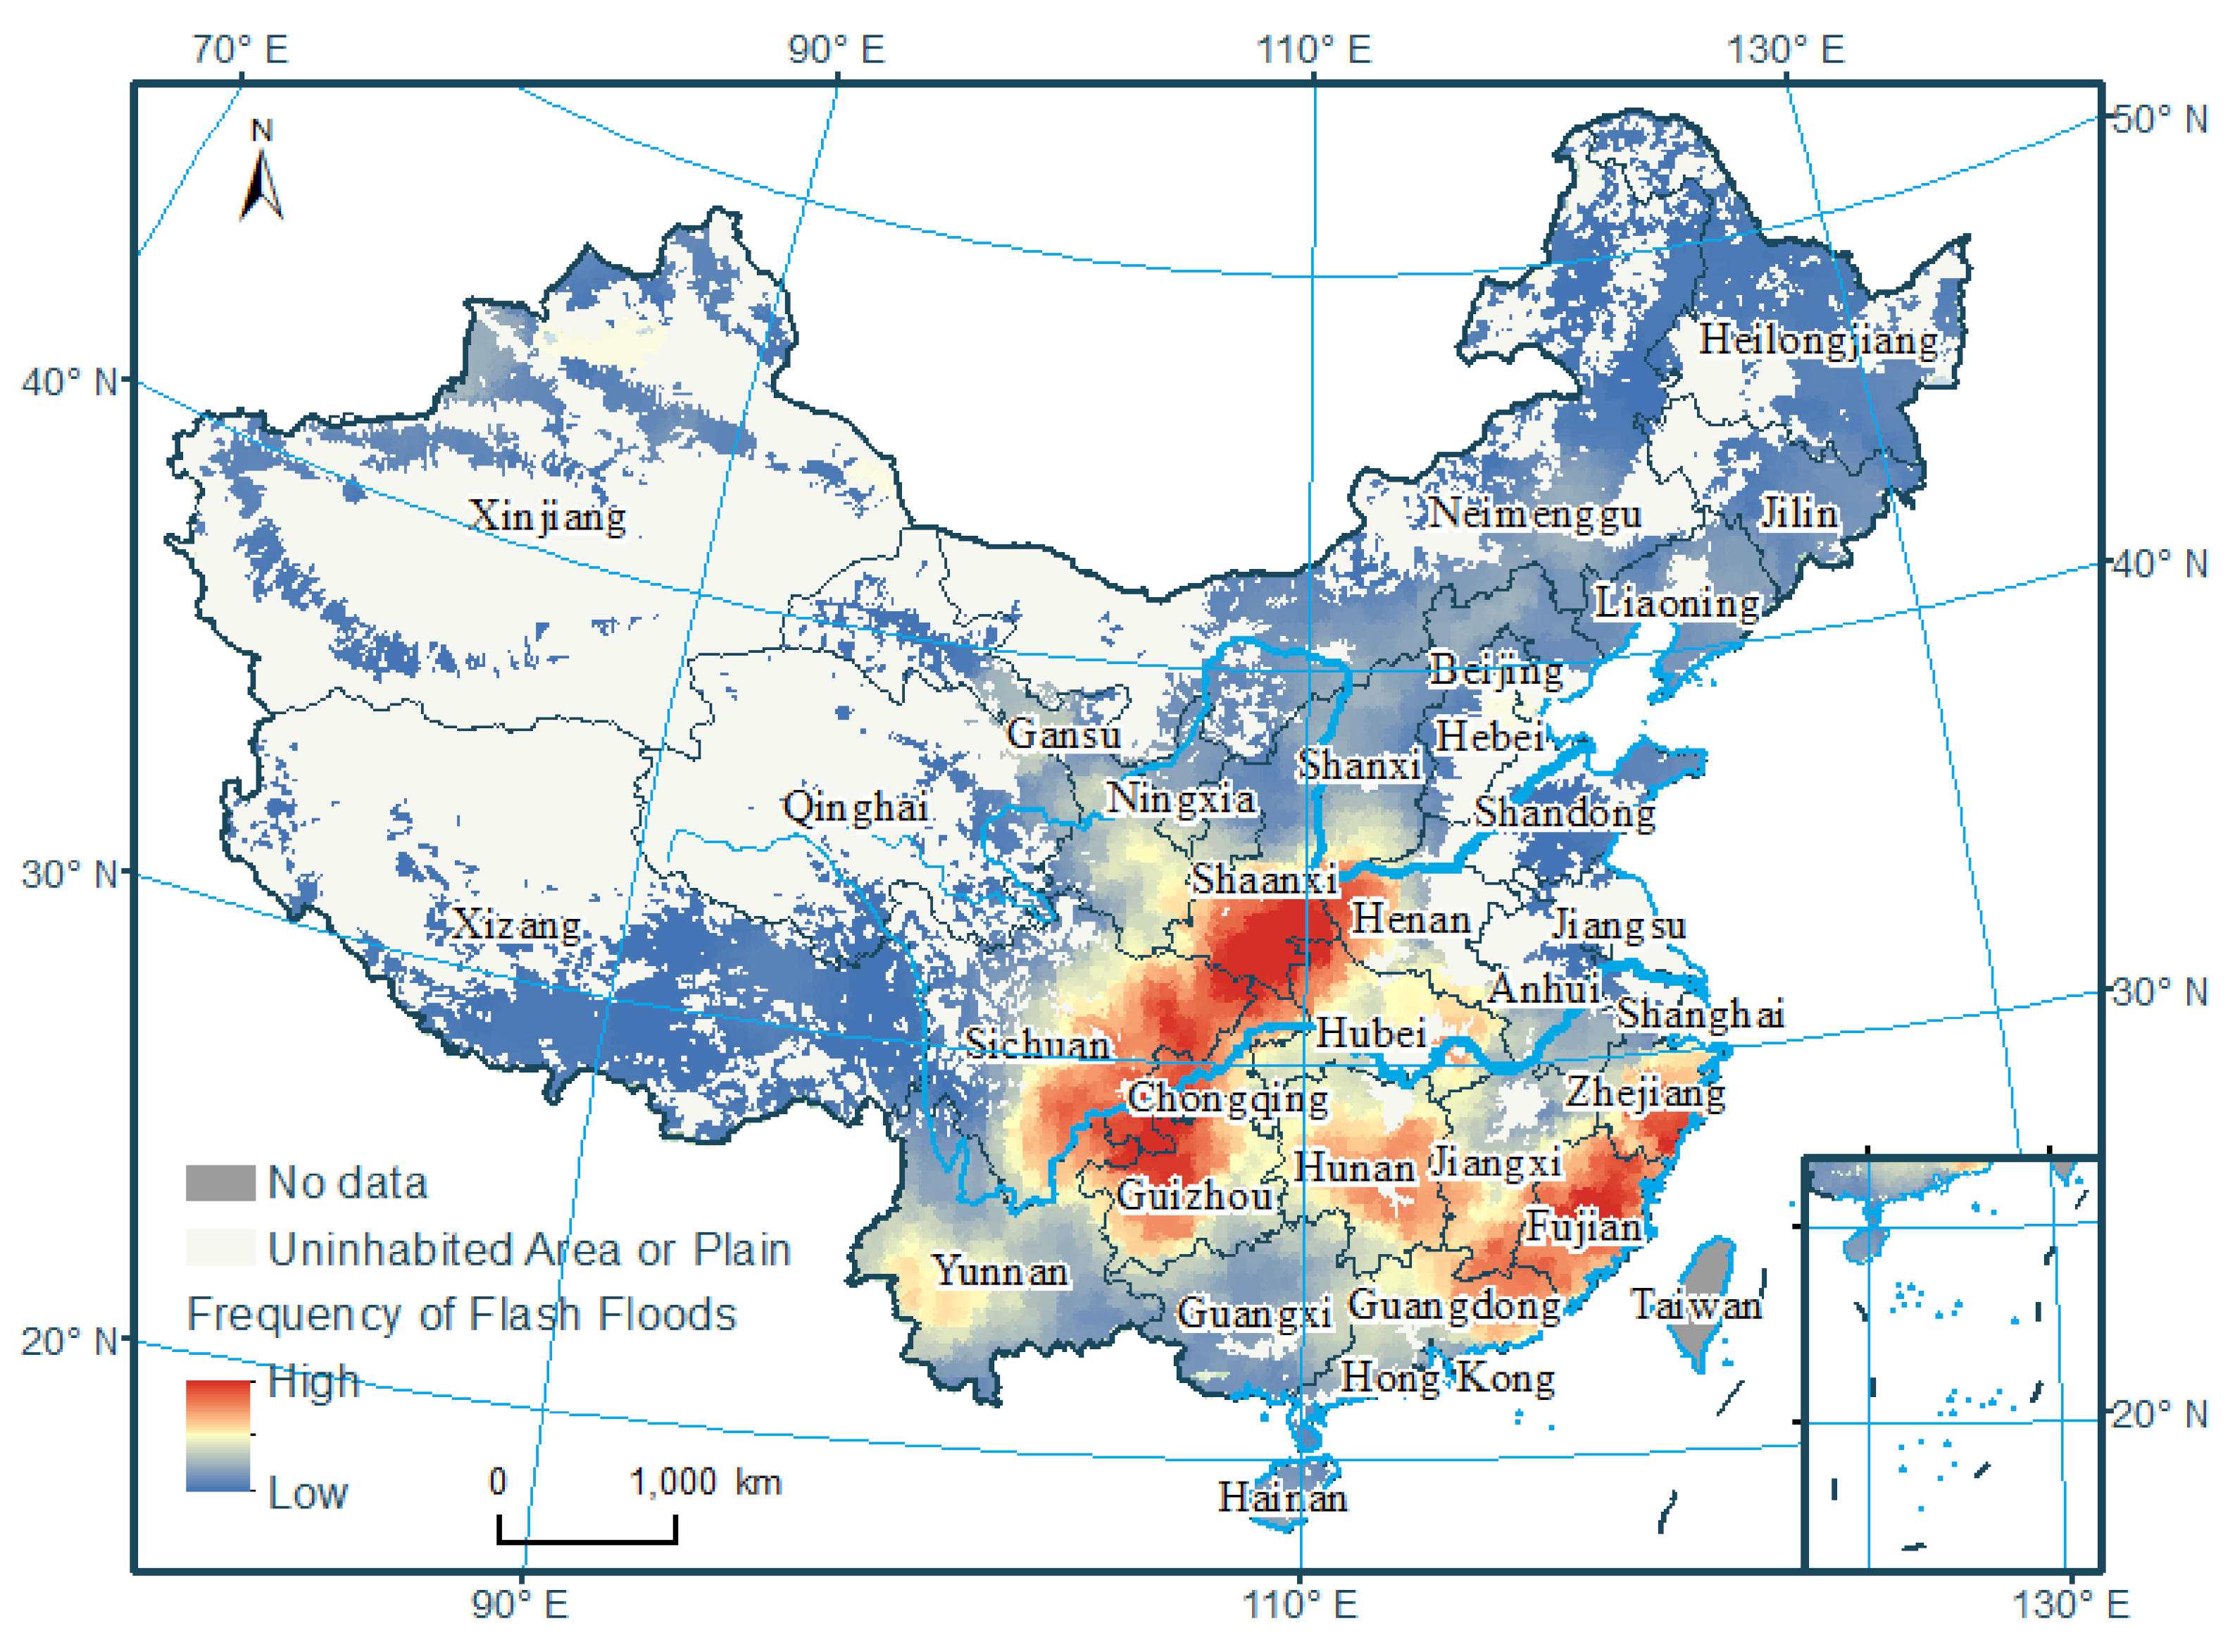
The association of flash flood occurrence and potential influential factors was analyzed by focusing on the period 2000–2015, when there were 11,083 flash flood events. Figure 2 illustrates the spatial distribution of the aggregated number of flash floods in this period by watershed polygons. The watersheds are the basic management units for flash flood control planning in China and are defined by the NFFIEP, whose area is from 10 km2 to 50 km2 [9]. The flash flood prevention area was divided into more than 250,000 watersheds, more than 110,000 of which are inhabited.

Figure 2.
Frequency of flash floods in China during 2000–2015.
The area with the highest frequency of flash floods includes south Gansu, east Sichuan, northwest Guizhou, southeast Zhejiang, Chongqing, west Hubei, and Fujian.
The data were collected from different sources with various scales and formats. For example, population density data are 1-km raster data, elevation data are 30-m raster data whose scale is 1:50,000. Table 1 describes the sources of other data used in the analysis. As shown in Table 1, the data are at different periods, including 2000, 2014, and 2015, on the one hand, due to the data availability, on the other hand, considering that some data in the analysis period (2000–2015) did not change much, we only collected data of one period, such as elevation, villages, etc.

Table 1.
Data sources and description.
Based on prior findings and data availability [10,21], fifteen factors influencing flash floods were determined by integrating all data into watershed polygons using area-weighted or aggregation methods (Table 2).

Table 2.
Latent factors.
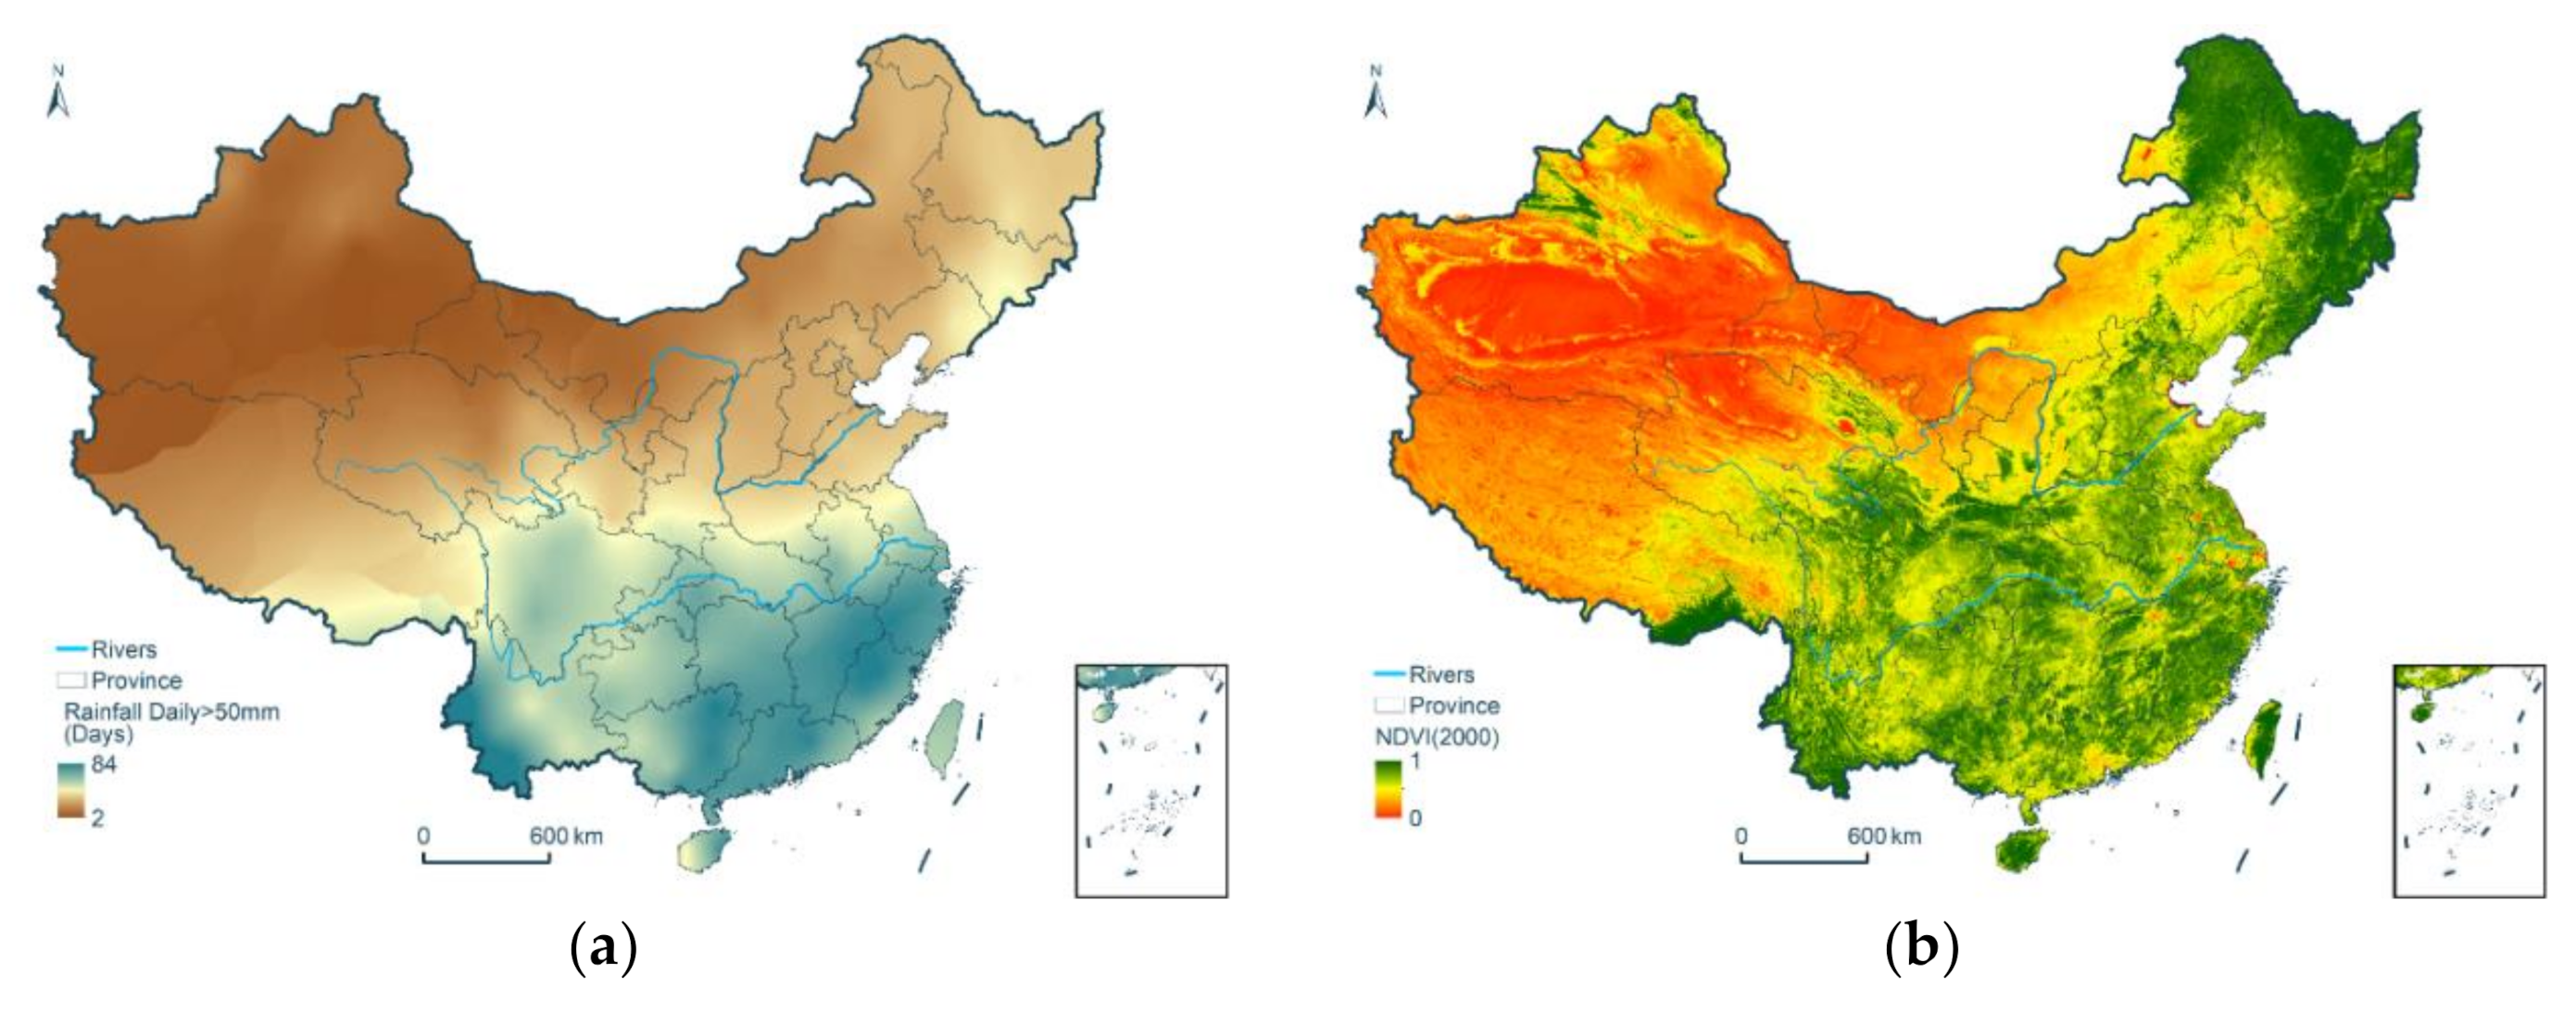
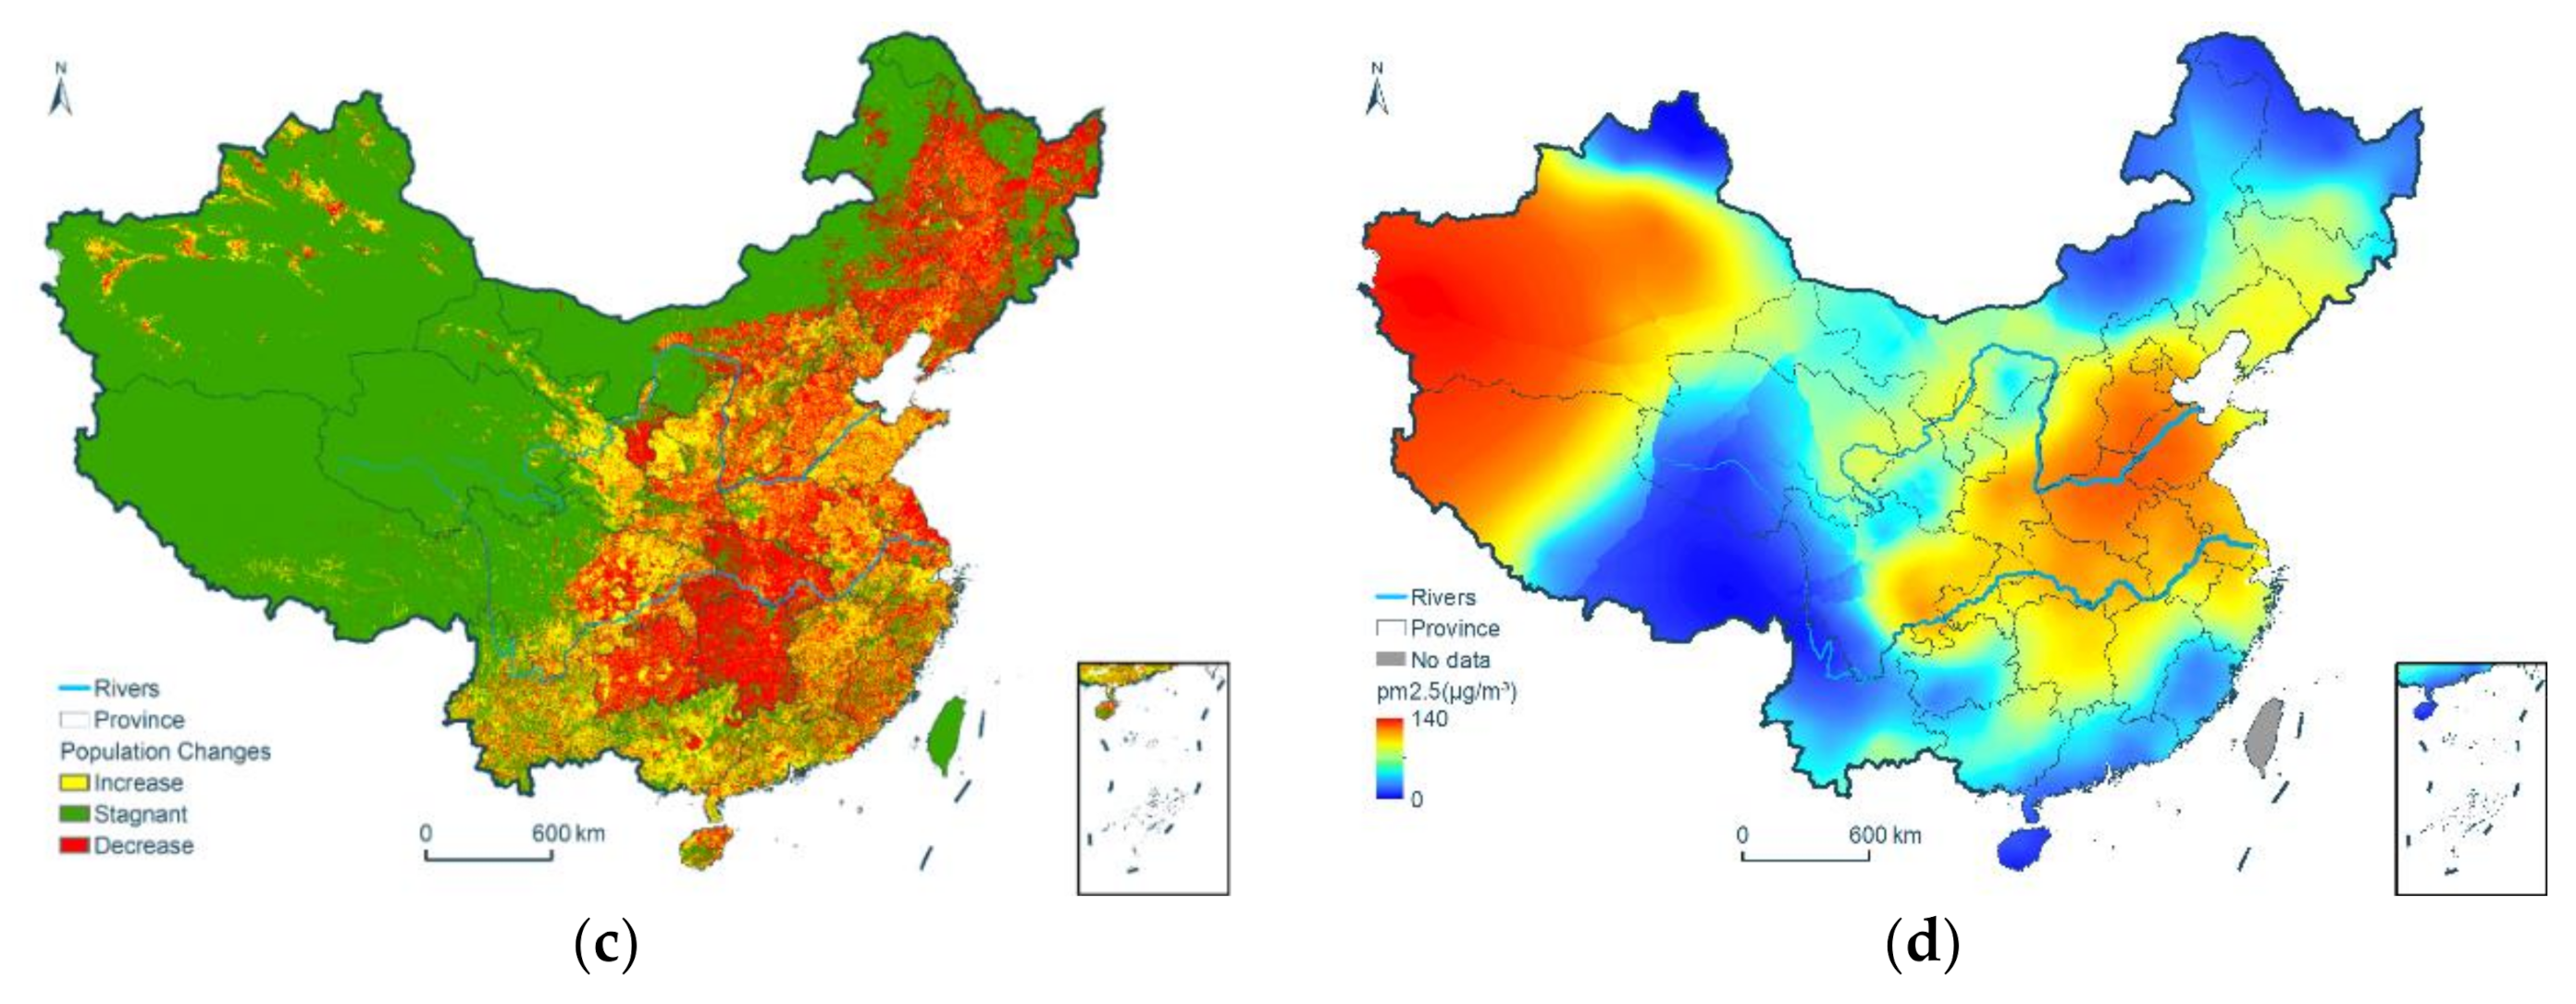
Figure 3 shows some key factors associated with the occurrence of flash floods.


Figure 3.
Key factors associated with the occurrence of flash floods in China. (a) Average number of days per year with rainfall greater than 50 mm in 2000–2015; (b) Normalized difference vegetation index (NDVI) in 2000;(c) Population changes during 2000–2015;(d) Air quality in 2015, represented as PM2.5.
2.2. Methodology
Preliminary analysis shows a potential strong correlation between natural, human activity, and air quality indicators (as shown in Figure 3). In order to avoid correlation between independent variables, factor analysis based on principal component analysis (PCA) was employed to reduce co-linearity and to reveal latent factors. Cumulative variances reached 91.1%.
Using the derived latent factors as explanatory variables, a generalized ordered logit model was used to estimate the cumulative probabilities of occurrence of flash floods. Suppose the proportions of the areas that would undergo no flood events (yj = 0), one flood event (yj = 1), and two or more flood events (yj = 2) are respectively p1, p2, and p3. The logarithms of the odds of responses are:
The ordered logit model can then be written in terms of the probability of occurrence of flash floods for a given status X of an area as:
where is the category of flash flood occurrence, X is a vector of observed explanatory variables, β is a vector of parameters to be estimated, and φj are cut-off points for the thresholds of the ordered model. In this model, dichotomous dependent variables allow for a number of (ordered) response levels. However, it depends for its validity on the proportional odds assumption, i.e., the similarity of the odds of the outcome occurring across all values of the ordinal variable (or each of the occurrence categories). This assumption may not be valid as the odds of occurrence for one and two more times may not be equal. To overcome this restriction, the proportional odds assumption was relaxed, thereby avoiding the risk of incorrect or misleading estimates, and a generalized ordered logit model was used:
where βj is a vector of parameters that vary according to the cut-off point of the ordered logit model. This model is widely used to test ordered responses [34], and was used in this study to estimate the ordered responses of cities in different situations and with different characteristics. To estimate the parameters β and the constant φj of the log-likelihood function, maximum likelihood methods were used:
where LL is the log-likelihood function, N is the number of cities (N = 11,083), and dnj is equal to 1 if the city falls in occurrence category j and 0 otherwise.
3. Results
3.1. Spatiotemporal Variations of Flash Floods
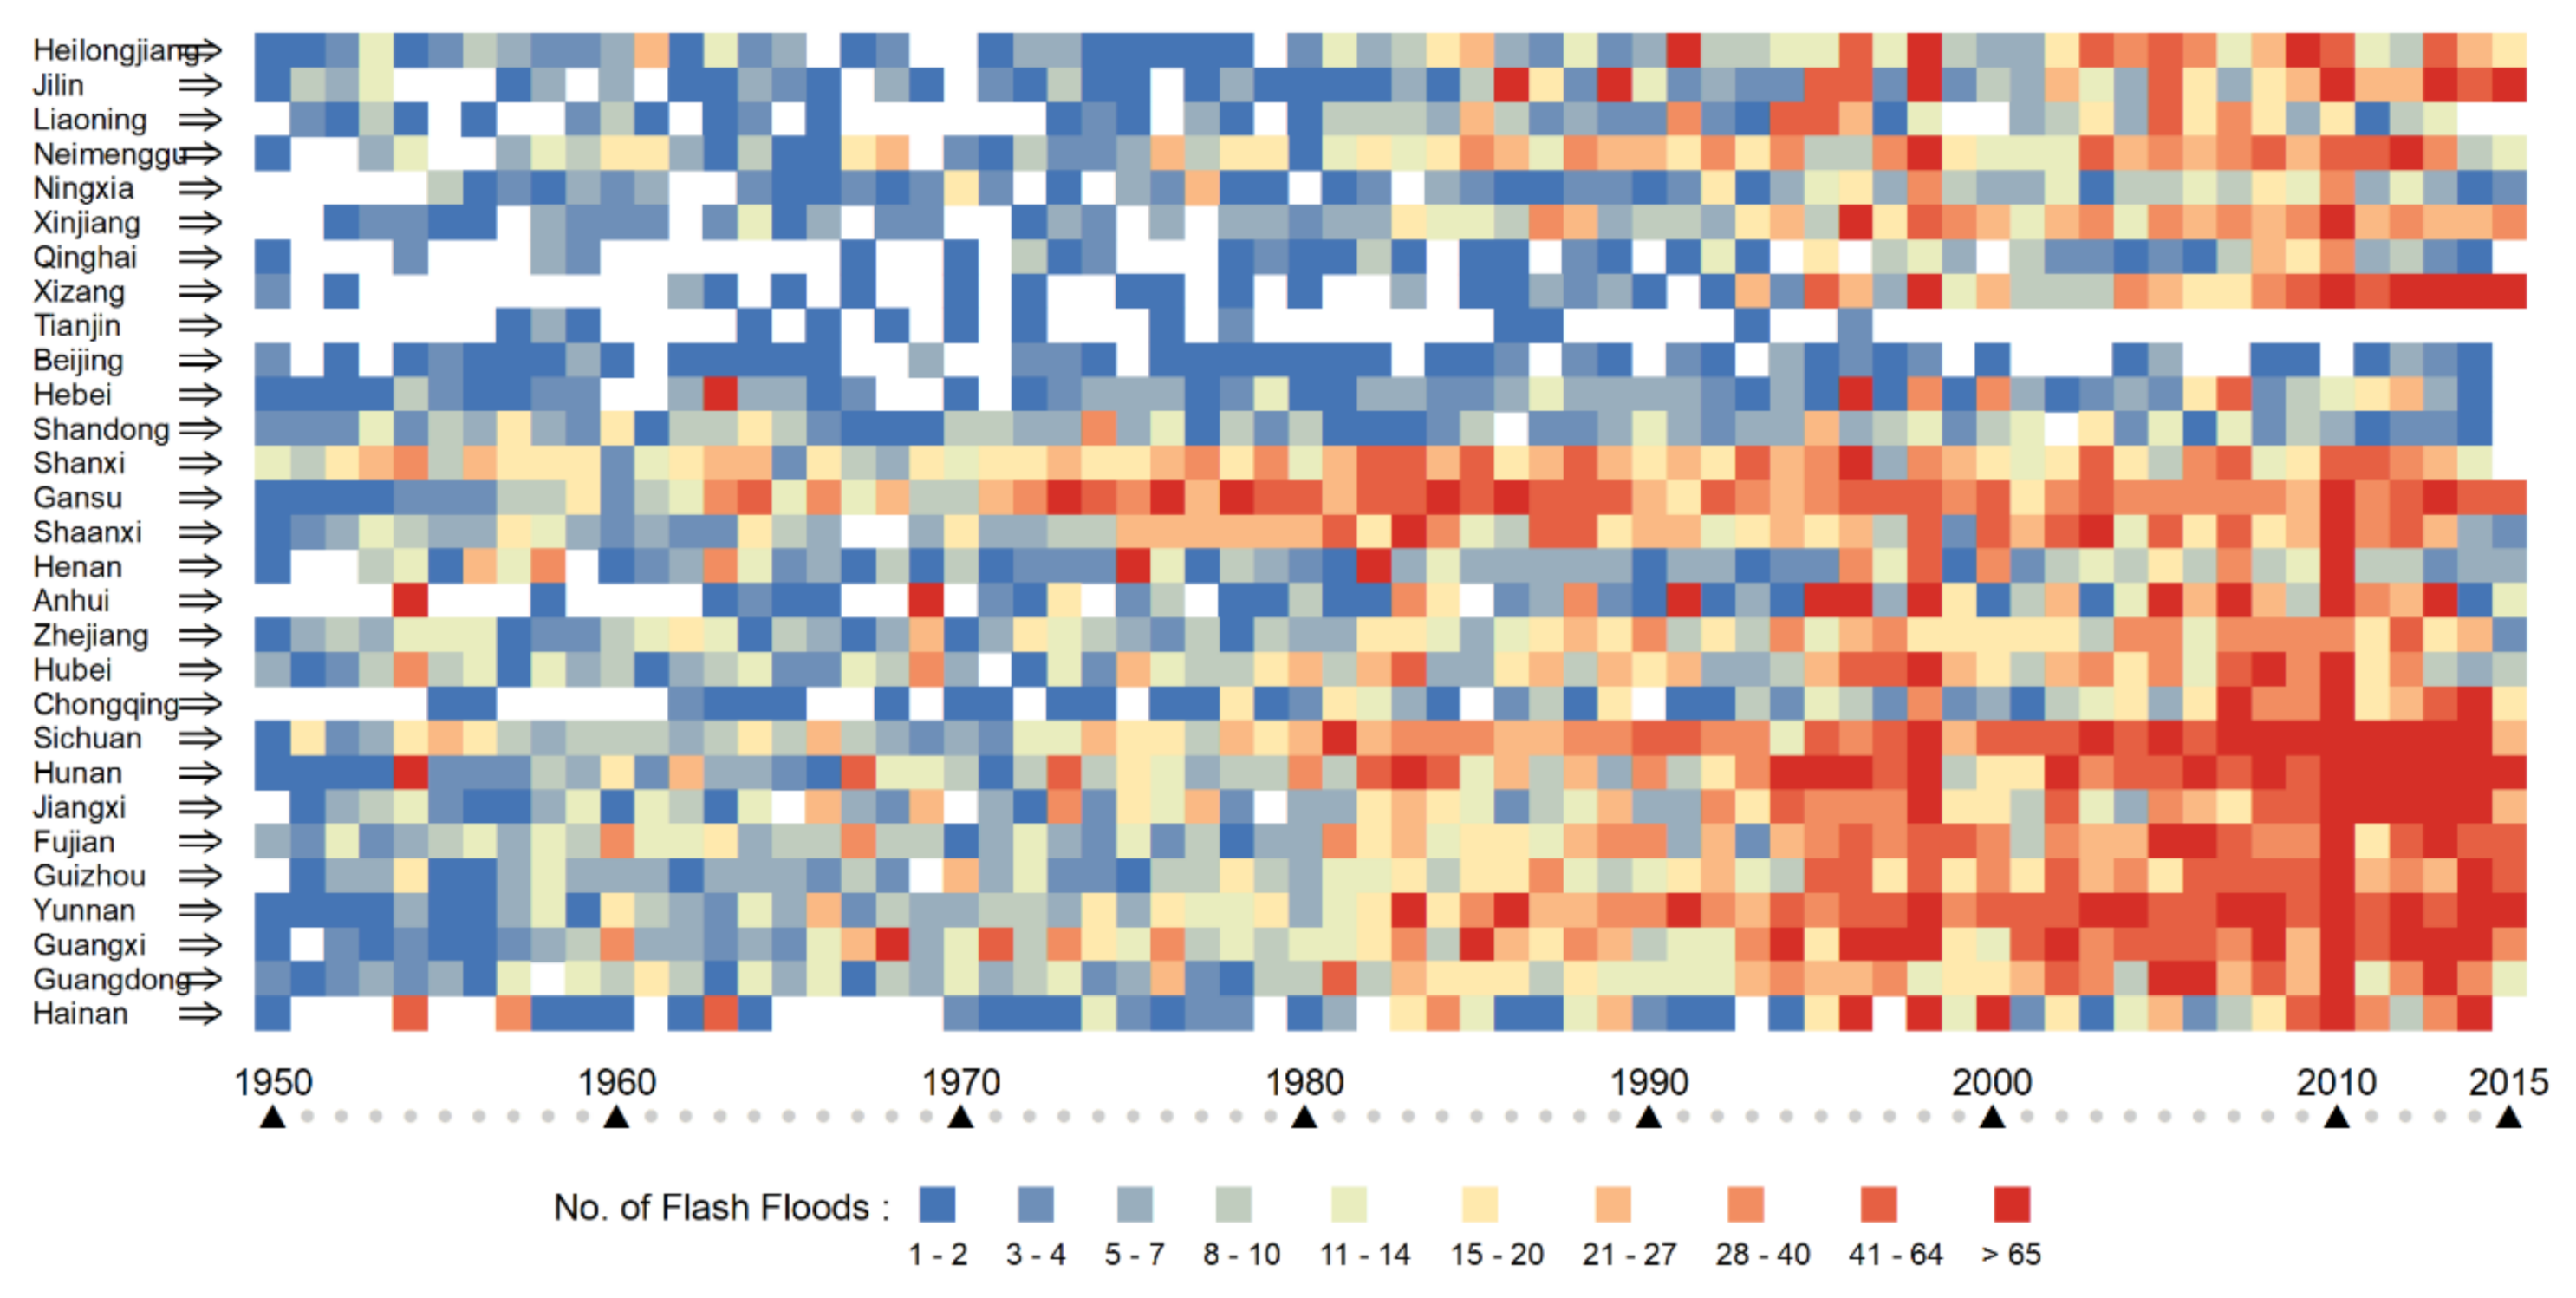
Flash flood maps reflecting spatial and temporal variations in flash floods in China from 1950 to 2015 were created from more than 60,000 records. Considering that flash floods with a long history may be missing, but there is a clear record of human death, the data in Figure 4 shows the number of flash floods that cause death.

Figure 4.
Spatial-temporal variations in flash floods in China grouped by province and ranging from 1950 to 2015; each square represents one year. (The blank grid indicates that there is no flash flood in the province in that year).
A dramatic increase in the number of flash floods was observed in southern provinces and, in general, after 1980, when China put full strength on economic development. This situation has been changing since 2010, when China more balance socioeconomic development and ecological protection, and statistics showed the occurrence of flash floods decreased from 647 during 2006–2010, to 356 during 2011–2015. Despite the temporal change, there is no big transformation spatially. Sichuan province is the area suffering the highest frequency of flash floods in China, about 10% of the total in China. Particularly in 1998, there were 22 flash floods in this area.
Abundant data is the advantage of this research, although the data has strict quality control measures, we should also notice there may be some errors in the data due to the large span of time.
3.2. Key Factors Associated with the Occurrence of Flash Floods in China
Preliminary analysis shows potentially strong correlations with natural, air quality and variation of human activities (Figure 3). Pre-processing using factor analysis based on principal component analysis (PCA) reduced co-linearity and revealed latent factors (Table 3 and Table 4).

Table 3.
Total variance explained of principal component analysis (PCA).

Table 4.
Rotated component matrix of PCA 1.
With cumulative variances reaching 91.11%, the main factors identified include: topographic environment, heavy rainfall, economic growth, density of villages, vegetation cover, increase in population, air quality, and increased agricultural activities (Table 3). The topographic environment comprises slope and changes in latitude. Heavy rainfall consists of the number of days with rainfall of 50 mm or more (Figure 3) and the normalized difference vegetation index (NDVI, Figure 3). Both the topographic environment and heavy rainfall factors indicate wet conditions with precipitation that favors plant growth but increases flood risk. The density of the villages is inferred by two key loaded factors, large agricultural land areas that had dense populations in 2000, reflecting the high concentration of people living by means of agricultural activities in that area. For instance, the Sichuan Basin is a main area of food production and has high population density (around 587 people per km2). Population growth did not occur in central China, including the Sichuan Basin, from 2000 to 2015 (Figure 3).
The results of the general ordered logit model are shown in Table 5.

Table 5.
Results of factors analysis and the general ordered logit model.
4. Discussion
Possible associations were estimated using the general ordered logit model on derived latent factors as explanatory variables (Table 2). The frequency of flash floods was measured on two levels: single occurrence and frequent occurrence (twice or more). The strongest factor affecting the probability of flash flood occurrence is heavy rainfall, with a coefficient of 1.146 (p < 0.001), indicating that areas with higher “heavy rainfall” values are more than twice as likely to suffer flash floods. This supports previous studies that claim precipitation is the main cause of floods. Eighty percent of the Fujian province, which frequently suffers flash floods, is hilly or mountainous, with a rainy season in May and June and typhoons in September. Other places with high frequencies of flash floods include south Shanxi, which experiences heavy rainfall, and the Qinling Mountains, which have steep valleys.
The second strongest factor is density of villages (with a correlation coefficient of 0.582, p < 0.001); people often choose to live in areas of high soil fertility, such as valleys and at the foot of mountains, despite high risks of flash flooding. In addition, conventional agricultural activities increase the flooding risk. Interestingly, vegetation cover may positively contribute to the occurrence of flash floods, because of the strong association between precipitation and the greening ratio of land cover [35]. This may be attributed to different types of plants. Normally, greening programs in China plant trees, which have lower resistance to floods than natural shrubs. On the contrary, agricultural activities may significantly reduce the occurrence of flash floods (correlation coefficient −0.094, p < 0.001). This is largely because run-off can be prevented by agricultural activities in hillside fields, such as terrace crops in Guizhou. The model shows that air quality is significantly associated with flash floods, making them 52% more likely to occur, which may be linked with increases in extreme precipitation or may reveal other impacts of anthropogenic activities.
The levelled model (frequent occurrence) found similar associations and ranked the factors in the same order, further implying a possible relationship between the occurrence of flash floods and latent influential factors (from most to least influential: heavy rainfall, density of villages, vegetation cover, air quality, economic growth, topographic environment, and increases in population).
There is obvious spatial heterogeneity in flash floods and its influencing factors, especially in China, where there are obvious differences in climate, natural conditions, and economic development. In a certain area, the dominant factor of flash flood is likely to rain, such as arid Xinjiang. In other areas, population distribution may be the main factor such as, in most areas of South China where often rains. In these areas, mainly in urban area, several mitigation solutions such as “sponge cities” could be applied to reduce the flash flood hazard [36,37]. Although we studied spatial heterogeneity in flash floods and its influencing factors, in fact, for a certain region or basin, the heterogeneity of a single factor may be the main uncertain factor affecting flood. For example, in Hue City, Vietnam, the temporary rainfall pattern is a major factor influencing spatial inundation conditions of urban floods [6]. Therefore, based on this study, a more in-depth analysis of a specific area may lead to some different conclusions.
5. Conclusions
Availing a unique dataset of flash flood records in China, we produced a spatial and temporal map of flash floods in China in the period from 1950 to 2015. Possible correlations between natural, exposure, and vulnerability indicators were identified and grouped to reveal latent factors, in order to better understand the complexity in flood-prone areas. Two levels of occurrence were distinguished and modelled, revealing various levels of associations of possible influential factors at significant levels. The results showed that precipitation is an important cause of flash flooding, and demonstrate that anthropogenic intervention in the environment, such as greening programs and encouragement of agricultural activities, can affect the likelihood of flash floods. A strong association between air quality and flash floods highlight the need for future research into the impact of climate change to consider additional influences on flooding. This study is limited by site observations between flash floods and human activities that are not yet established well, which necessitates the improvement of flood observation technology and data management.
Author Contributions
Methodology, Y.L. and Y.H.; formal analysis, Y.L. and J.W.; resources, Y.H. and X.Z.; writing—original draft preparation, Y.L. and Z.Y. All authors have read and agreed to the published version of the manuscript.
Funding
This research was supported and funded by the CRSRI Open Research Program (Program SN: CKWV2018484/KY), the National Key Research and Development Program of China (Grant No. 2017YFB0503005), the Strategic Priority Research Program of the Chinese Academy of Sciences (XDA19040402).
Institutional Review Board Statement
Not applicable.
Informed Consent Statement
Not applicable.
Data Availability Statement
The data presented in this study are available on request from the corresponding author.
Conflicts of Interest
The authors declare no conflict of interest.
References
- Dankers, R.; Feyen, L. Flood hazard in Europe in an ensemble of regional climate scenarios. J. Geophys. Res. Atmos. 2009, 114, 1–16. [Google Scholar] [CrossRef]
- Aerts, J.C.; Botzen, W.J.; Clarke, K.C.; Cutter, S.L.; Hall, J.W.; Merz, B.; Michel-Kerjan, E.; Mysiak, J.; Surminski, S.; Kunreuther, H. Integrating human behaviour dynamics into flood disaster risk assessment. Nat. Clim. Chang. 2018, 8, 193–199. [Google Scholar] [CrossRef]
- Hapuarachchi, H.A.P.; Wang, Q.J.; Pagano, T.C. A review of advances in flash flood forecasting. Hydrol. Process. 2011, 25, 2771–2784. [Google Scholar] [CrossRef]
- Gaines, J.M. Flooding: Water potential. Nature 2016, 531, S54–S55. [Google Scholar] [CrossRef] [PubMed]
- Gaume, E.; Bain, V.; Bernardara, P.; Newinger, O.; Barbuc, M.; Bateman, A.; Blaškovičová, L.; Blöschl, G.; Borga, M.; Dumitrescu, A.; et al. A Collation of Data on European Flash Floods. J. Hydrol. 2009, 367, 70–78. [Google Scholar] [CrossRef]
- Mu, D.; Luo, P.; Lyu, J.; Zhou, M.; Huo, A.; Duan, W.; Nover, D.; He, B.; Zhao, X. Impact of temporal rainfall patterns on flash floods in Hue City, Vietnam. J. Flood Risk Manag. 2020, e12668. [Google Scholar]
- Mohamed, S.A.; El-Raey, M.E. Vulnerability assessment for flash floods using GIS spatial modeling and remotely sensed data in El-Arish City, North Sinai, Egypt. Nat. Hazards 2020, 102, 707–728. [Google Scholar] [CrossRef]
- Peng, C.; Zhiling, Z.; Xiaolong, L. Progress and prospects in research on mountain hazards in China. Prog. Geogr. 2014, 33, 145–152. [Google Scholar]
- Sun, D.; Zhang, D.; Xiaotao, C. Framework of National Non-Structural Measures for Flash Flood Disaster Prevention in China. Water 2012, 4, 272–282. [Google Scholar] [CrossRef]
- Liu, Y.; Yang, Z.; Huang, Y.; Liu, C. Spatiotemporal evolution and driving factors of China’s flash flood disasters since 1949. Sci. China Earth Sci. 2018, 61, 1804–1817. [Google Scholar] [CrossRef]
- Saleh, A.; Yuzir, A.; Abustan, I. Flash Flood Susceptibility Modelling: A Review. In Proceedings of the IOP Conference Series: Materials Science and Engineering; IOP Publishing: Bristol, UK, 2020; Volume 712, pp. 1–6. [Google Scholar]
- Changzhi, L.; Zhang, X.; Zhang, M.; Sun, D.; Guo, L. Uncertainty on Design Critical Rainfall for Flash Flood Early Warning: A Case Study of South Branch Watershed of Censhui. Meteorol. Environ. Res. 2019, 10, 31–38. [Google Scholar]
- Liu, C.; Guo, L.; Ye, L.; Zhang, S.; Zhao, Y.; Song, T. A review of advances in China’s flash flood early-warning system. Nat. Hazards 2018, 92, 619–634. [Google Scholar] [CrossRef]
- Lay, M.L. Exploring the signature of climate and landscape spatial variabilities in flash flood events: Case of the 8–9 September 2002 Cévennes-Vivarais catastrophic event. Geophys. Res. Lett. 2007, 34, 1–5. [Google Scholar] [CrossRef]
- Corral, C.; Berenguer, M.; Sempere-Torres, D.; Poletti, L.; Francesco, F.; Rebora, N. Comparison of two early warning systems for regional flash flood hazard forecasting. J. Hydrol. 2019, 572, 603–619. [Google Scholar] [CrossRef]
- Liu, Y.; Yuang, X.; Guo, L.; Huang, Y.; Zhang, X. Driving Force Analysis of the Temporal and Spatial Distribution of Flash Floods in Sichuan Province. Sustainability 2017, 9, 1527. [Google Scholar] [CrossRef]
- Dan, W.; Xixia, M.; Changjun, L. Sensitivity Analysis of Influence Factors of Rainfall Warning Index for Flash Flood Disasters. J. China Hydrol. 2018, 38, 37–41. [Google Scholar]
- Terti, G.; Ruin, I.; Anquetin, S.; Gourley, J. Dynamic vulnerability factors for impact-based flash flood prediction. Nat. Hazards 2015, 79, 1481–1497. [Google Scholar] [CrossRef]
- Xiong, J.; Li, J.; Cheng, W.; Wang, N.; Guo, L. A GIS-Based Support Vector Machine Model for Flash Flood Vulnerability Assessment and Mapping in China. Int. J. Geo-Inf. 2019, 8, 297. [Google Scholar] [CrossRef]
- Diakakis, M. Types of Behavior of Flood Victims around Floodwaters. Correlation with Situational and Demographic Factors. Sustainability 2020, 12, 4409. [Google Scholar] [CrossRef]
- Adnan, M.S.G.; Dewan, A.; Zannat, K.E.; Abdullah, A.Y.M. The use of watershed geomorphic data in flash flood susceptibility zoning: A case study of the Karnaphuli and Sangu river basins of Bangladesh. Nat. Hazards 2019, 99, 425–448. [Google Scholar] [CrossRef]
- Boutkhamouine, B.; Roux, H.; Pérès, F. A Bayesian Network approach for flash flood risk assessment. In Proceedings of the Egu General Assembly Conference, Vienna, Austria, 23–28 April 2017. [Google Scholar]
- Zhao, G.; Pang, B.; Xu, Z.; Wang, Z.; Shi, R. Assessment on the hazard of flash flood disasters in China. J. Hydraul. Eng. 2016, 47, 1133–1142. [Google Scholar]
- Koks, E.E.; Jongman, B.; Husby, T.G.; Botzen, W.J.W. Combining hazard, exposure and social vulnerability to provide lessons for flood risk management. Environ. Sci. Policy 2015, 47, 42–52. [Google Scholar] [CrossRef]
- Wang, S.; Peng, P.; Qin, L.; Tian, C. Primary Analysis of Reducing Flooding Effects of Different Vegetation Cover in Small Watershed of Disaster Prone Area Based on GIS: A Case Study of Upper Minjiang River Basin. J. Catastrophology 2016, 31, 210–214. [Google Scholar]
- Li, Z.; Feng, N.; Fan, J.; Liu, Y.; Ding, Y. Long-term impacts of aerosols on the vertical development of clouds and precipitation. Nat. Geosci. 2011, 4, 888–894. [Google Scholar] [CrossRef]
- Ye, X.; Zhang, Q.; Liu, J.; Li, X.; Xu, C. Distinguishing the relative impacts of climate change and human activities on variation of streamflow in the Poyang Lake catchment, China. J. Hydrol. 2013, 494, 83–95. [Google Scholar] [CrossRef]
- Chen, X.; Niu, Z. The effects of projected climate change and extreme climate on maize and rice in the Yangtze River Basin, China. Agric. For. Meteorol. 2020, 282, 107867. [Google Scholar] [CrossRef]
- Kong, F.; Shi, P.; Fang, J.; Lu, L.; Fang, J.; Guo, L. Advances and Prospects of Spatiotemporal Pattern Variation of Extreme Precipitation and its Affecting Factors under the Background of Global Climate Change. J. Catastrophol. 2017, 32, 165–174. [Google Scholar]
- Shi, P.J.; Kong, F. Research on Related Factors to Decadal Accumulated Heavy Rainfall Spatio-temporal Patterns Change in China During 1951–2010. Sci. Geogr. Sin. 2016, 36, 1457–1465. [Google Scholar]
- Zhang, J.; Wang, Y.; He, R.; Hu, Q.; Song, X. Discussion on the urban flood and waterlogging and causes analysis in China. Adv. Water Sci. 2016, 27, 485–491. [Google Scholar]
- Guo, L.; Zhang, X.; Liu, R.; Liu, Y.; Liu, Q. Achievements and Preliminary Analysis on China National Flash Flood Disasters Investigation and Evaluation. J. Geo-Inf. Sci. 2017, 19, 1548–1556. [Google Scholar]
- Yuan, X.; Liu, Y.; Huang, Y.; Tian, F. An approach to quality validation of large-scale data from the Chinese Flash Flood Survey and Evaluation (CFFSE). Nat. Hazards 2017, 89, 693–704. [Google Scholar] [CrossRef]
- Agresti, A. Analysis of Ordinal Categorical Data, 2nd ed.; John Wiley & Sons: Hoboken, NJ, USA, 2010. [Google Scholar]
- Hou, M.; Zhao, H.; Zheng, W.; Yang, X. Vegetation responses to climate change by using the satellite-derived normalized difference vegetation index: A review. Clim. Environ. Res. 2013, 18, 353–364. [Google Scholar]
- Liang, X.; Liang, Y.; Chen, C.; Dijk, M.P.V. Implementing Water Policies in China: A Policy Cycle Analysis of the Sponge City Program Using Two Case Studies. Sustainability 2020, 12, 5261. [Google Scholar] [CrossRef]
- Liu, J.; Xue, B.; Yan, Y. The Assessment of Climate Change and Land-Use Influences on the Runoff of a Typical Coastal Basin in Northern China. Sustainability 2020, 12, 50. [Google Scholar] [CrossRef]
Publisher’s Note: MDPI stays neutral with regard to jurisdictional claims in published maps and institutional affiliations. |
© 2020 by the authors. Licensee MDPI, Basel, Switzerland. This article is an open access article distributed under the terms and conditions of the Creative Commons Attribution (CC BY) license (http://creativecommons.org/licenses/by/4.0/).

