Abstract
Given the environmental impacts produced by the growing increase in waste electrical and electronic equipment (WEEE) and their current inadequate management, this article proposes a mathematical model to define the best location for installing WEEE collection points. The objective is to minimize the cost of the reverse logistics system concerning transportation, installation, opportunity cost, and distance between points and demand. We used a heuristic created from the greedy randomized adaptive search procedure and genetic algorithm meta-heuristics to solve the model, with part of the model variables being defined by another heuristic or by the JuMP v.0.21.2 and CLP Solver v.0.7.1 packages, to guarantee an optimal response to a subproblem of these variables. The model and its solver were written in the Julia Programming Language and executed in two test scenarios. In the first, three vehicles with small loads must collect at five points. In the second, a vehicle with greater available capacity must collect at five points. The results obtained show that the mathematical model and the heuristic are adequate to solve the problem. Thus, we understood that the proposed method contributes to the literature, given the criticality of the current scenario concerning the management of WEEE, and it can assist managers and public policymakers when providing inputs for decision-making related to the choice of the best location for installing collection points.
1. Introduction
Waste electrical and electronic equipment (WEEE), also known as e-waste, has been recognized as a problem from the environmental point of view, as it contains substances that are harmful to human health and the environment [1,2]. The accumulation of e-waste presents an estimated growth rate of 3% to 5% per year [3].
The constant innovation of the technology of this equipment, together with its frequent replacement, can lead to large fluctuations in the generation of WEEE and significant environmental impacts [4]. The innovation of electronic devices is directly related to programmed obsolescence, which is a practice in which companies, to avoid competition, “kill” used products, introducing a new version of them, which makes used items economically obsolete [5]. The special attention given to WEEE is mainly due to two factors: the existence of toxic substances in the discarded material that can cause damage to the environment and human health if improperly disposed of and the presence of metals of high economic value in their composition, such as silver, gold, and platinum [6].
Because of the increase in WEEE, [1] highlights the problem of the lack of proper places for their disposal; the lack of awareness of the majority of the population about the need to properly dispose of this waste; and also, the increase in globalization, population growth, and development of technological sectors, which intensify their growth.
Thus, even though the management of this type of waste is a challenging task for all stakeholders, on the other hand, they have a high potential for recycling raw materials, bringing benefits to the environment and the revenues of recycling companies [7]. Companies benefit because the returned products can provide cheaper components and materials, also resulting in savings in energy, production, and transportation costs. The environmental benefits are in the recovery of materials and components, reducing the need for new (virgin) resources and avoiding waste landfill [8].
Brazil has an increasing rate of generation of electronic waste. The increase in waste generated was higher than the rise in the Brazilian population, which in two years (2014–2016) grew by approximately 1.97% [9]. To treat this waste, measures were taken in the form of laws, among them, the Brazilian Policy of Solid Waste (BPSW), structured to compel the establishment of reverse logistics for the reuse of WEEE and Law No. 15,084, of 6 September 2013, which obliges companies that sell batteries and small electronic devices, in the state of Pernambuco, to install electronic waste collectors [10,11]. In other countries, such as those from European Union, United Kingdom, Japan, and Canada, among others, there are already consolidated guidelines and legislation on the reverse logistics of WEEE, with several points of collection and reverse channels [9].
However, in Brazil, there are still few adequate management systems in operation, with the largest share of WEEE going to landfills or entering informal chains [12]. There are practically no collection points or sufficient information available to start a process of collection and proper disposal of WEEE nor are there agreements signed between governments, companies, cooperatives, and consumers related to this commitment [1].
This situation will change with the Sectorial Agreement for the implementation of the Reverse Logistics System for Electrical and Electronic Products, and their Components, which was signed on 31 October 2019 and had its extract published in the Diário Oficial da União (D.O.U.) (Official Diary of the Union) on 19 November 2019. Based on the Sectorial Agreement, the members of the production chain of household electrical and electronic products will carry out several actions to promote the reverse logistics of WEEE; the management will take place through Green Eletron, which is a WEEE waste manager [13]. The Sectorial Agreement is an instrument of the Law 12,305/2010 related to the Brazilian Policy of Solid Waste. In this year, many partnerships between the management company of WEEE (Green Eletron, São Paulo, Brazil), manufacturers, resellers, and recyclers have been formed to operationalize the reverse logistics of WEEE in Brazil. The agreement is still in its initial implementation phase, with the implementation of points of collection of WEEE and awareness campaigns. The purpose is to reach a recycling goal of 17% of the total amount of EEE produced and marketed in the country.
In this context of reverse logistics, which deals with the return of waste to the business or productive environment, several issues are addressed, which are classified into seven areas: the problem of routing the waste collection vehicles, the design of the logistics network (which involves the selection of facility locations, the capacity of these facilities, etc.), location and allocation (which aims to find the best location for the facilities), production planning, assembly and disassembly (which involves maintenance, remanufacturing, recycling, or disposal), returns management, and inventory management [14]. Thus, adding to the fact that several issues are involved in waste management, together with the imposition of the aforementioned laws, there is a motivation for the development of a decision-support tool aimed at optimizing the reverse logistics network, and decision-makers must work to reduce the cost of this network to be competitive [15].
For this, we used operational research tools, highlighting, among them, the mathematical models, multicriteria decision-support methods (MCDA), and heuristics and meta-heuristics for solving problems. Therefore, this article aims to propose a mathematical model for the problem of locating WEEE collection points, focusing on minimizing the cost of the reverse logistics system concerning transportation, installation of points, opportunity cost, and distance between points and demand, with a consequent reduction in environmental impact, in addition to formulating a heuristic, written in the Julia Programming Language, which was created from the hybridization of the genetic algorithm with the greedy randomized adaptive search procedure. For part of the variables present in the problem, a heuristic or JuMP v.0.21.2 and CLP (COIN-OR Linear Programming) Solver v.0.7.1 packages were used to guarantee an optimal solution for a subproblem of these variables [16].
We divided this article into five sections. After the introductory section, Section 2 summarizes the concept of WEEE, some aspects of its management, and also shows the heuristics commonly used in solving mathematical models related to WEEE management. Section 3 presents the proposed mathematical model and the methods created to solve it. In Section 4, we exposed the results of applying the model and heuristics in two test situations. Finally, Section 5 contains the final considerations of the work.
2. Theoretical Framework
2.1. Eletro Electronic Residues (e-Waste)
The electronic equipment is “equipment whose operation depends on electric currents or electromagnetic fields, as well as the equipment for the generation, transmission, transformation, measurement of these currents and fields, which can be for domestic or industrial use” [17], p. 13. According to the Brazilian Agency for Industrial Development [18], Electrical and Electronic Equipment (EEE) is divided into four broad categories:
- White Line: refrigerators and freezers, stoves, washing machines and dishwashers, dryers, air conditioners.
- Brown Line: tube, plasma, LCD and LED monitors and televisions, DVD and VHS devices, audio equipment, camcorders.
- Blue Line: mixers, blenders, electric irons, drills, hairdryers, juicers, vacuum cleaners, coffee makers.
- Green Line: desktop computers and laptops, computer accessories, tablets, and cell phones.
At the end of its useful life, this equipment is considered waste, commonly called WEEE [18] or e-waste. WEEE is one of the most critical waste streams with high recycling potential. They have more than 1000 different substances, many of which are toxic, such as cadmium, lead, mercury, and selenium, among others. If properly recycled, they could lead to significant economic and environmental benefits [7,19,20,21].
The world generates 44.7 million tons of WEEE according to the Global e-Waste Monitor 2017 report prepared by the United Nations University (UNU), the International Telecommunications Union (ITU), and the International Solid Waste Association (ISWA). In the year 2016, only 20% of this waste was documented as having been collected and recycled. We estimated that in the year 2021 this quantity should increase to 52.2 million tons. The study also shows Brazil as the second-largest producer of electronic waste in the Americas in 2016, with 1.5 million tons, second only to the United States of America [22].
In Brazil, however, there are still few adequate management systems in operation to treat WEEE, which is an environmental problem due to the presence of substances harmful to human health and the environment [1,2,12,19]. There are few and insufficient environmental education programs, and there is not enough infrastructure for citizens to return the waste properly [23]. It is worth mentioning that with the signing of the Sectorial Agreement for the Reverse Logistics of Electrical and Electronic Equipment and its components in 2019, it is expected that the infrastructure will be improved, however, due to its recentness, little can still be evaluated of the reverse logistics actions.
One of the main critical processes to be designed to avoid environmental impacts and damages caused by incorrect management of e-waste is collection services. Nevertheless, most legislation and guidelines on e-waste management focus on collection targets [24]. However, this waste collection must be efficient [7,21] so that its benefits are fully utilized.
There are two methods used to perform WEEE collection: the stationary method and the mobile method, each with different variants. Stationary collection of WEEE takes place mainly at municipal collection centers or EEE stores. The collection of materials, in the mobile system, is made directly from homes or businesses. The local collection schedule, such as selective collection, is responsible for that [7,21].
Different tasks and stages characterize the collection and transport of waste. One of them is the planning of the location of collection centers and treatment facilities concerning the ideal distances of its users [7]. The collection center must be close to demand, as this is a determining factor for customers’ willingness to return the equipment [25]. This location must also happen to provide a reduction in operating costs, which, according to [7], can be optimized by minimizing the collection vehicle routes, by selecting the appropriate type and number vehicles and by maximizing the use of the vehicle’s load compartment.
2.2. Electro Eletronic Residues (e-Waste) in Pernambuco State
In the state of Pernambuco, Law No. 15,084, of 6 September 2013 is in force, which requires the installation of electronic waste collectors by companies that sell batteries and small electronic devices. These companies must also arrange to send the collected material to the collection points made available by the government, manufacturers, or other members of organized civil society. If they fail to do so, they are subject to a warning and a fine on the second offence [11].
However, a large part of e-waste is still disposed of incorrectly, because, with the disposal being done together with ordinary garbage, the waste goes to landfills or informal chains [12,19]. Therefore, there is a need to install more collection points and for the collection to take place efficiently [1,7]. Furthermore, this efficiency depends not only on industry, distributors, and the government but also on people’s education and cooperation [17]. However, despite the positive intention of the Brazilian population concerning recycling electronic waste, only a minority adopts appropriate recycling practices [26], since consumers are in the habit of donating or selling electronic products to the secondary market rather than returning them to the manufacturer. This situation is also fostered, in addition to the lack of public awareness and environmental education, by the absence of e-waste collection points [23].
The Brazilian Association of the Electrical and Electronics Industry (ABINEE) proposes the operationalization of the reverse logistics of its associated companies, in the entire state of Pernambuco. According to ABINEE, there are only 53 collection points for batteries from Green Eletron, an entity created by ABINEE to manage the reverse logistics of WEEE. When it comes to collection points for electronics in general, there are no Green Eletron points in the state [27,28].
In one of the most critical cities in Pernambuco, Caruaru, there are only three Green Eletron points for the exclusive collection of batteries [27]. Furthermore, according to the city, there are no general WEEE collection points. The waste collection is only made through the user’s direct contact with the city, requesting the waste collection. However, due to the lack of awareness of a large part of the population about the need for proper disposal of waste [1], this may not be the best choice. On the other hand, the presence of collection points close to the demand stimulates a behavior more inclined to the correct disposal of the materials [25].
2.3. The Use of Operational Research in Electro Electronic Residue Management
WEEE management uses many operations research tools for support, such as mathematical, heuristic, and meta-heuristic models. A survey on the use of operational research tools in the context of electronic waste management was carried out by [29] which highlight the frequency of using several mathematical optimization models found in the literature, resolved through the use of heuristics, in the context of reverse logistics. The authors also show some of the techniques used to solve them, among them: linear programming, mixed-integer linear programming, multiple-objectives linear programming, taboo search, and ant colony optimization.
The JuMP package is a domain-specific modeling language for mathematical optimization, with various solvers, from open-source to commercial. It supports linear programming, integer programming, and non-linear programming, among others. CLP is an open-source solver, written in C++ and supported by JuMP, for linear programming, which uses the simplex primal and dual algorithm.
Several authors, when dealing with different perspectives on the WEEE management problem, classify it as an NP-hard (non-deterministic polynomial time hard) problem. The NP-hard problem is a class of problems that, according to [30], makes the exact solution methods highly time-consuming, as instances of the problem increase in size. Thus, the use of the same algorithms to solve this type of problem (NP-hard) becomes impracticable due to the high computational cost, requiring a very long time to find an optimal solution. Thus, heuristics are used, which are tools that ensure relatively good solutions in sufficient computational times, although they do not guarantee an optimal solution [31]. Some heuristics are called meta-heuristics, which are procedures capable of escaping from great locations, and perform a robust search in the problem–solution space, to produce high-quality solutions [32,33].
Several heuristics and meta-heuristics can be found in the literature to solve NP-hard problems, including in the context of reverse logistics. The methods commonly used in the literature for the seven areas of reverse logistics [14] are shown in Table 1.

Table 1.
Meta-heuristics by areas of reverse logistics.
In addition to the methods shown in Table 1, others are used, such as the work of [34], which presents an algorithm based on greedy randomized adaptive search procedures (GRASP) to solve a problem of routing and scheduling vehicles for the collection of waste. Reference [35] uses a heuristic based on genetic algorithm (GA) for the vehicle routing problem. Furthermore, reference [7] applies a local and greedy search algorithm, in addition to Tabu Search (TS). Thus, a combination of heuristics can also be explored, as is the case in [31].
The meta-heuristic GA is based on Darwin’s theory of evolution of species to search for an adequate solution to the problem presented [36,37]. GA is a method that uses a population of individuals (solutions to the problem), being submitted to the operators of selection, in which a way is established in which the most apt individuals will be selected for reproduction; reproduction, defining how the child will receive genetic information from the selected individuals; and mutation, which stipulates the way that the mutation of the children will occur.
The GRASP meta-heuristic is divided into two stages: the construction of the solution and the local search. The construction of the solution occurs in a semi-rigorous way, in which the candidate variables to enter the solution are grouped in a restricted candidate list (RCL), which in some way limits the number of variables, or gives preference to some of them. The variable that will enter the solution is chosen within the RCL either random or randomized. Finally, in the second stage, a local search process is carried out to intensify the search.
The heuristic formulated to solve the mathematical model presented by the article is made from GA, with the initial population being constructed using GRASP. For some of the variables, another heuristic or CLP Solver v.0.7.1 is used, associated with the JuMP v.0.21.2 package, to find an optimal answer for a subproblem of these variables.
3. The Mathematical Model for the Location of WEEE Collection Points
The mathematical model proposed in this article seeks to define the best location for installing points where users will be able to deposit WEEE, in such a way that this location allows minimizing the cost of the reverse logistics system. It also integrates the question of routing the vehicles that will carry out the collection. The costs to be minimized are the opportunity cost (associated with the unmet demand, that is, the value lost when the waste is not collected); the transportation cost of the vehicles that will carry out the collection; the cost of installing the points; and the cost of the distance from demand to the collection point.
In other words, the model can determine the number of collection points needed, where they will be located, and the route to be taken by the collection vehicles, considering that they must have their trajectory in a less costly way, and at the same time, the points must be relatively close to the demand. For this, installation costs and costs of not meeting demand are also considered.
3.1. Proposition of the Mathematical Model
At first, the following sets are used in the model: D: set of demand nodes, that is, the main points where there is a significant amount of WEEE; I: set of potential points (locations) for the installation of a collection point; K: set of collection vehicles; Q: set that, in addition to containing the points of the set I, also includes 0 and n, which respectively represent the point of origin, from where the vehicle will leave, and the endpoint of the vehicle’s route, that is, the treatment station for waste. The model also uses U, which represents all combinations of points on a given sub-route with |U| points.
The decision variables are as follows: xijk: the binary variable that takes the value 1 if the collection vehicle k moves from point i to point j, and 0 otherwise; ri: the estimated amount of WEEE to be collected (in kg) at collection point i. This can be obtained by adding the quantities of WEEE collected by all vehicles at that point, according to Equation (1), where rik is the estimated amount of WEEE to be col-lected (in kg) at collection point i by vehicle k. The model also has the auxiliary variable yik, which is obtained through Equation (2). This model assumes a value of 1 if vehicle k visits point i, and 0 otherwise. If at least one vehicle k visits point i, the auxiliary decision variable (zi) will assume a value of 1, thus indicating that at point i there will be a collection point. The variable zi is obtained through Equation (3).
The model parameters are CI: the average cost of installing a collection point; CO: cost of opportunity (per kg) of WEEE; CVk: capacity of vehicle k load (in kg); TD: total demand, that is, the amount of WEEE generated at all points of demand (in kg); CPi: maximum capacity of collection point i (in kg); Sid: cost of the distance from demand node d to point i; Tijk: transport cost of vehicle k between i and j. The objective function and costraints are presented below.
Objective function:
Constraints:
Equation (4) is the objective function to be minimized, which is divided into four parts. The first refers to the transport costs of the vehicles, which must travel between the collection points located by the model with the best trajectory in terms of cost. The second instalment is the opportunity cost referring to the WEEE not collected; that is, the amount lost when not collecting a certain amount of waste. The difference between the total demand and the quantities collected at each collection point results in the amount of e-waste not collected. Thus, the more waste collected, the lower the cost. The opportunity cost per kg is taken as the value that would be gained by collecting and reusing waste. However, as there are many types of e-waste, this value is considered, for simplification purposes, as an average of the values earned in the collection and reuse of all types of waste. The third part of the objective function refers to the cost of installing the collection points; its consideration is important to not allow the solution that the points must be installed indefinitely. The fourth plot shows the cost of the distance from the demand nodes to the point of collection; it is important that they are located relatively close to demand.
Constraints (5) ensures that the vehicle leaves the collection point once visited, making it possible to continue the route, that is, if the vehicle goes to a given point, it needs to go from that point to another location. Except for this restriction, the points of origin and the treatment plant (note that the restrictions are for every i ∈ I, this set does not contain 0 and n), that is, after reaching n, the vehicle does not need to go further to another point. Moreover, the vehicle also does not travel from any points to the origin, as will be shown shortly below in constraints (13) and (14).
The set of constraints in (6) ensures that the vehicle, when leaving a node (point), can only go to one node, that is, the vehicle will go to only one place at a time. The exception for this restriction is treatment station n, because when arriving at this location, the vehicle must end its journey. Constraint (7) ensures that the route taken by all collection vehicles starts at the origin. Inequality occurs because more than one vehicle may be needed to perform the collection. Constraint (8) ensures that the route taken ends at the waste treatment plant. Once again, inequality occurs, since we can use more than one vehicle and all of them must reach the waste treatment plant.
As the model seeks to increase the amount of waste collected to minimize the opportunity cost according to the second instalment of Equation (4), Constraint (9) prevents this quantity from exceeding demand, which is realistically impractical; that is, it is impossible to collect more than is deposited in the points. Constraint (10) prevents the amount of e-waste collected at the collection points by each vehicle from exceeding the vehicle’s loading capacity. The set of restrictions in (11) means that the estimated amount of waste collected at each collection point does not exceed the capacity of these points; this capacity may exist due to restrictions in physical space, among other factors. For example, there may be little space for installing a large collection point. Thus, this restriction prevents more waste from being collected than the collection point supports.
Constraint (12) makes it impossible to form sub-routes, guaranteeing the continuity of the route from the source to the treatment plant; in this constraint, U represents all combinations of points on a given sub-route with |U| points. These restrictions were proposed by [38] to eliminate sub-routes.
Constraint (13) ensures that the vehicle does not return to the starting point. Constraint (14) guarantees the vehicle’s final destination as treatment plant n. Finally, constraints from (15) to (18) deal with the nature of the decision variables.
3.2. Presentation of the Heuristics Created
The heuristic used to solve the proposed WEEE model was based on the meta-heuristics GA and GRASP, which was used for the generation of the initial population of the GA.
Following the publication by [35] for the representation of the solutions of the vehicle routing problem, and [36] for the traveling salesman problem, in this article, the xijk variables of the solutions are depicted in a simplified way. The variable x is symbolized by a matrix, with the number of lines corresponding to the number of vehicles, and that of columns, to collection points. Each line corresponds to the route that one of the vehicles will follow, the matrix is made up of whole numbers that represent the collection points to be visited; the value 0 within the matrix means that there is no point to be visited after the last value other than 0. To exemplify x, in a scenario with two vehicles and four collection points:
As you can see from the example, routes can have different sizes. The purpose of the solutions having this format is to reduce the number of restrictions in the model by automatically addressing them.
The variables yik and zi are defined by equations, according to the model itself, by the value of x. The variables Ri need to respect the restrictions (8)–(10), in addition to those of non-negativity; therefore, their value is defined according to the heuristic described in the pseudo code of Algorithm 1, after defining the value of the other variables.
| Algorithm 1 Variables |
| 01: Read data entry and variables y and z |
| 02: Determine used_vehicles and set K_valid ⊆ K of the used_vehicles, through of the variable y |
| 03: Maximum_possible_demand_to_be_met ← min(∑i∈I zi∗PCi, DM, ∑k∈K used_vehicles k∗CVk |
| 04: i ← 1, Remaining_demand ← Maximum_possible_demand_to_be_met |
| 05: While i ≤ size(I) and Remaining_demand ≠ 0 |
| 06: Define as the lower value between the capacity of collection point i, the total of the available capacity of the vehicles going trough the point i and Remaining_demand |
| 07: Allocate between the vehicles going through the point i |
| 08: Remaining_demand ← Remaining_demand— |
| 09: I ← I + 1 |
| 10: End_While |
| 11: If Remaining_demand = 0, then return to |
| 12: Otherwise, define values of determining with JuMP and CLP Solver and return to |
The general idea is to define R as the highest possible value of waste according to restrictions (9)–(11). The distribution of waste among the vehicles used in this article is to allocate as much as possible to vehicle k in the order of set K. Finally, the variable of the pseudocode used_vehicles is a binary vector, of size equal to K, in which each position receives 1 if the vehicle is used by the solution or 0 otherwise.
If it is not guaranteed that the heuristic part of the algorithm has not generated an optimal response for Ri, a linear programming model is created that has only rij as a variable and receives the data and the other variables of the problem as a parameter, under restrictions (9)–(11) and (18), in order to maximize the expression ∑I ∈ I ri*zi of the objective function of the proposed model. For this, the JuMP v.0.21.2 and CLP Solver v.0.7.1 packages are used to model and solve the problem, respectively. Using this method to define r requires a greater computational effort than the heuristic passed for the executed scenarios, but simplex is still considered a very efficient algorithm to solve linear programming problems [36].
In building the population, the idea proposed by the GRASP meta-heuristic is used. All collection points possible to enter the route of all vehicles are analyzed, the quality of which is measured by the objective function which is the criterion of choice for the construction of the solution. The RCL is limited by the restriction by the upper limit expressed in Equation (19), where M is the set of all candidate variables, c is the objective function, cmin is the quality of the best solution in the set M, cmax, the worst solution, and α will define the amplitude of the variables accepted in the RCL.
RCL = {e∈ M┤ | c (e) ≤ cmin + α (cmax − cmin)}
The variables are added to the solution as long as the upper limit of the RCL, generated in the iteration, is better than the best solution found so far, described in the pseudo code of Algorithm 2 as shown below.
| Algorithm 2 Solution Generation |
| 01: Read data entry |
| 02: Initialize solution , best_solution_found |
| 03: a_better_solution_is_possible ← 1 |
| 04: While a_better_solution_is_possible ≠ 0 |
| 05: Determine superior_limit for the selection of candidate variables for the RCL |
| 06: If superior_limit < f(best_solution_found) |
| 07: Determine the variable t for the best solution x U {t}, t ∈ RCL |
| 08: best_solution_found ← x U {t} |
| 09: Select randomly one element s ∈ RCL |
| 10: x ← x U {s} |
| 11: Otherwise do a_better_solution_is_possible ← 0 |
| 12: End_if |
| 13: End_while |
For the proposed heuristic, the population is generated with individuals that were constructed with α equal to 0.4; this value is increased for each new individual until it reaches 1. The defined population size is 30. After that, the GA is executed, and 500 iterations were performed. The chosen operators were as follows:
Tournament selection. Population individuals are randomly grouped into groups of n individuals, with one individual belonging to more than one or no group. Within each group, the most suitable individual is chosen. In the heuristic presented in the article, n = 3.
Uniform crossing adaptation. The individuals selected by the previous operator will perform a crossing where the son receives the genetic inheritance from father 1, with a 50% chance of the son changing his genes to that of father 2. In the present article, the number of children generated is equal to the number of individuals in the population.
Mutation. For each vehicle, there is a 30% probability that a random position on the route will be changed by a value corresponding to one of the collection points or by 0.
Both the mutation and the crossing used in the heuristic can generate solutions with routes where the value 0 does not correspond to its end. For this situation, the solution is corrected by transferring all points with a value other than 0 to the beginning of the route in the order they were.
The population is updated in order to maintain the elite elements of both the past and the new generation, with no change in the size of the population. The percentage of the best individuals of the past generation kept is p. If there is no improvement in the quality of the population after n iterations, the population update occurs generating a new population, maintaining 1 − p of the best solutions of the past generation. For the proposed heuristic, p = 0.6, n = 20. The pseudo code of Algorithm 3 is detailed below.
| Algorithm 3 Genetic Algorithm |
| 1: Initializing population, k ← 0 |
| 2: Determine population_ suitability |
| 3: While k < 500 |
| 4: parents ← Select(population, adequation_of_population) |
| 5: children ← Crossing (parents) |
| 6: Mutation(children) |
| 7: Updating(population, children, adequation_of_population) |
| 8: End_While |
4. Execution of the Proposed Model
To execute the model shown, the proposed heuristic written in programming language Julia was used in addition to the JuMP v.0.21.2 and CLP Solver v.0.7.1 packages. GAs are beneficial for dealing with complex problems in supply chain design and site selection for collection facilities and can even be combined with other methods to mitigate some of their limitations [14].
The model was executed as a test in the city of Caruaru, Pernambuco, in the Maurício de Nassau neighborhood, in a conjectured scenario with five potential points for the installation of a collection point, five demand nodes, and three vehicles available to perform the collection of waste. Figure 1 shows the district in a prominent way and also highlights the points of demand (A, B, C, D, E) and candidate places to be collection points (1, 2, 3, 4, 5). It should be noted that the demand nodes were empirically positioned, as, according to [17], there is no generic solution to contemplate the task of finding the demand points. The author points out that this task will always depend on the individual characteristics of each context, and that would yield another separate research topic.
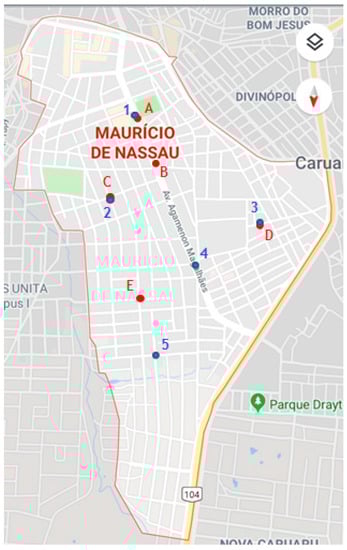
Figure 1.
District Maurício de Nassau, Caruaru, Pernambuco. Source: adapted from Google Maps (2019).
It was considered that the vehicle fleet is homogeneous, that is, the vehicles used are of the same nature, having basically the exact transport costs and capacity. The transport costs between the candidate points (Tijk) and the distance costs between the demand nodes and the points (Sid) are shown in Table 2 and Table 3, respectively.
Table 2.
Costs of transportation between the candidate points ().
Table 3.
Costs of the distance between the demand nodes and the candidate points for collection points (Sid).
The other parameters used were as follows: total demand (DM): 250 kg; average cost of installing a collection point (CI): R$500.00; opportunity cost (per kg) of WEEE (CO): R$60.00; vehicle load capacity (CVk): 100 kg; maximum capacity of all collection points i (PCi): 100 kg. A computer with an Intel Core i7 processor, 8 GB of RAM, was used to run the model.
The heuristic provided the solution that collection points should be installed in 1, 2, and 5, where, at each point, a different vehicle must collect the waste, totaling a cost of R$1544.09. The route that each vehicle follows is to go directly from the origin to the collection point, ending at the endpoint, except the vehicle responsible for point 5, which will go from the origin to point 1, and from 1 to 5. In a real situation, however, the distribution of total demand among the points to be installed is not known in advance, that is, the quantity that will be collected at each point is not known. However, this model freely estimates the amount of WEEE to be collected at each collection point. In this scenario, the amount to be collected at the three points is 100, 100, and 50 kg of waste, respectively. Thus, it is possible to know how much of the total demand has been satisfied. In this case, the entire demand for 250 kg of e-waste is satisfied, with a surplus of 50 kg of the total vehicle load. This result was found with an execution time of approximately 12 s.
For the construction of a second scenario, the parameters remain the same but with the following exceptions: vehicle availability has been reduced to just one transport with a load capacity equal to 200 kg and the total demand has been increased to 300 kg. If the capacity of each collection point is still reduced (considered 60 kg), it is assumed that the points must be more distributed, as the vehicle will need to travel to more points so that its transport load can be completed, and not just one unique, as in the previous case.
This last case was also tested using the heuristic in Julia language and resulted, as expected, in more collection points, totaling four points located in 1, 2, 4, and 5, with an estimated amount to collect of 60, 60, 60, and 20 kg, respectively. In this case, 100 kg of e-waste will no longer be collected due to the limited load capacity of the vehicle. The cost totals approximately R$8030.00. The route to be taken by the vehicle was also obtained by the software and is shown in Figure 2, below, and it should be noted that the routes with respect to 0 and n are not shown, as it is considered that their locations are outside the neighborhood under analysis. In this second scenario, this result was found more quickly, in approximately 0.14 s. This time difference occurs because, in scenario 1, the simplex is sometimes used to define the variable r, while in scenario 2, the value of r is always defined by the heuristic, as it is always guaranteed that the maximum value for r is achieved.
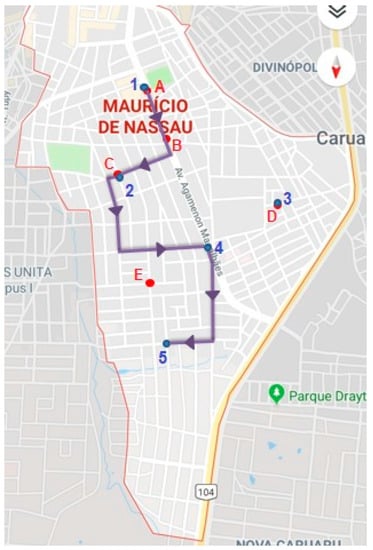
Figure 2.
Route to be travelled by the vehicle. Source: adapted from Google Maps (2019).
Thus, the proposed mathematical model shows where each collection point should be located and what are the estimated quantities to be collected at the points, which is also important, since aspects such as vehicle capacity and demand are considered. In contrast, the model considers that all demand must faithfully deposit waste at the nearest points. This, however, can be stimulated by the very proximity of the collection points to demand and through public policies to encourage proper disposal. Thus, this mathematical model may become an important tool to support decision-making by the public authorities in view of the criticality of the current situation regarding the destination of e-waste.
5. Final Considerations
This article proposed a mathematical model for the location of WEEE collection points. The objective was to minimize opportunity, transportation, installation, and distance costs between demand and collection point. The mathematical model was solved using a heuristic suggested in the article, written in Julia language, in two test scenarios with five potential points. In the first scenario, three vehicles must collect at three points. In the second, a vehicle (this time with a larger load) must collect at four points. The results, moreover, show the sensitivity of the number of collection points in relation to the demand and capacity of the facilities and other parameters. Thus, the model was considered satisfactory in terms of its proposal and can become an accessory for better decision-making.
On the other hand, the model considers as simplification the fact that all disposers must deposit the waste at the closest points, which is not practical in reality. However, environmental education campaigns can be used to raise the population’s awareness of proper waste disposal. In addition, the breadth of application of the model was reduced with conjectured data.
The article has limitations in terms of presenting the context of choosing the best locations for the WEEE collection points in the state of Pernambuco, other states may have particularities that can alter the results. However, it is worth noting that although the model is being used in the context of WEEE, there are no restrictions on its use being limited to this type of waste, requiring only a few adjustments to adapt to another context.
Author Contributions
Í.R.B.d.A. conducted the protocol of the systematic literature review and the development of the mathematical model, in addition to analysis and, writing of the original draft preparation. J.F.d.S.J. contributed to the implementation of the mathematical model. P.G. contributed in the analysis of the results and the writing-review. L.C.e.S. contributed to the formal analysis of the results, writing and, supervision of the study. All authors have read and agreed to the published version of the manuscript.
Funding
This research was funded in part by the Coordenação de Aperfeiçoamento de Pessoal de Nível Superior—Brasil (CAPES)—Finance Code 001.
Acknowledgments
The Foundation for the Support of Science and Technology of Pernambuco (FACEPE) and the National Council for Research and Technological Development (CNPq) supported this study, for which the authors are grateful. This study was financed in part by the Coordenação de Aperfeiçoamento de Pessoal de Nível Superior—Brasil (CAPES)—Finance Code 001.
Conflicts of Interest
The authors declare no conflict of interest.
References
- Sigrist, C.S.L.; Fonseca, L.F.B.; Veiga, J.M.; Paiva, J.M.F.; Moris, V.A.S. Desenvolvimento de ponto de coleta de resíduos eletroeletrônicos. Rev. Eletrôn. Gest. Educ. Tecnol. Ambient. 2015, 19, 1423–1438. [Google Scholar]
- Walther, G.; Steinborn, J.; Spengler, T.S.; Luger, T.; Herrmann, C. Implementation of the WEEE-directive-economic effects and improvement potentials for reuse and recycling in Germany. Int. J. Adv. Manuf. Technol. 2010, 47, 461–474. [Google Scholar] [CrossRef]
- Cucchiella, F.; D’Adamo, I.; Koh, S.L.; Rosa, P. Recycling of WEEEs: An economic assessment of present and future e-waste streams. Renew. Sustain. Energy Rev. 2015, 51, 263–272. [Google Scholar] [CrossRef]
- Lu, B.; Liu, J.; Yang, J.; Li, B. The environmental impact of technology innovation on WEEE management by Multi-Life Cycle Assessment. J. Clean. Prod. 2015, 89, 148–158. [Google Scholar] [CrossRef]
- Iizuka, T. An empirical analysis of planned obsolescence. J. Econ. Manag. Strategy 2007, 16, 191–226. [Google Scholar] [CrossRef]
- Achillas, C.; Vlachokostas, C.; Moussiopoulos, N.; Banias, G. Decision support system for the optimal location of electrical and electronic waste treatment plants: A case study in Greece. Waste Manag. 2010, 30, 870–879. [Google Scholar] [CrossRef]
- Nowakowski, P.; Król, A.; Mrówczyńska, B. Supporting mobile WEEE collection on demand: A method for multi-criteria vehicle routing, loading and cost optimisation. Waste Manag. 2017, 69, 377–392. [Google Scholar] [CrossRef]
- Habibi, M.K.K.; Battaïa, O.; Cung, V.-D.; Dolgui, A. An efficient two-phase iterative heuristic for Collection-Disassembly problem. Comput. Ind. Eng. 2017, 110, 505–514. [Google Scholar] [CrossRef]
- De Oliveira Vieira, B.; Guarnieri, P.; e Silva, L.C.; Alfinito, S. Prioritizing Barriers to Be Solved to the Implementation of Reverse Logistics of E-Waste in Brazil under a Multicriteria Decision Aid Approach. Sustainability 2020, 12, 4337. [Google Scholar] [CrossRef]
- Brasil. Lei n. 12.305, de 2 de agosto de 2010. In Política Nacional de Resíduos Sólidos, 3rd ed.; Câmara dos Deputados, Edições Câmara: Brasília, Brazil, 2017. [Google Scholar]
- Pernambuco. Lei n° 15.084, de 06 de setembro de 2013. Dispõe Sobre a Obrigatoriedade de Instalação de Coletores de Lixo Eletrônico Pelas Empresas que Comercializam Pilhas, Baterias e Aparelhos Eletrônicos de Pequeno Porte. 2013. Available online: http://legis.alepe.pe.gov.br/texto.aspx?id=2912 (accessed on 19 April 2020).
- De Souza, R.G.; Clímaco, J.C.N.; Sant’anna, A.P.; Rocha, T.B.; Do Valle, R.; De, A.B.; Quelhas, O.L.G. Sustainability assessment and prioritisation of e-waste management options in Brazil. Waste Manag. 2016, 57, 46–56. [Google Scholar] [CrossRef]
- Sinir-Sistema Nacional De Informações Sobre A Gestão Dos Resíduos Sólidos. Sistema de Logística Reversa de Produtos Eletroeletrônicos de Uso Doméstico e Seus Components. Available online: https://sinir.gov.br/component/content/article/2-sem-categoria/474-acordo-setorial-de-eletroeletronicos (accessed on 16 July 2020).
- Rachih, H.; Mhada, F.Z.; Chiheb, R. Meta-heuristics for reverse logistics: A literature review and perspectives. Comput. Ind. Eng. 2018, 127, 45–62. [Google Scholar] [CrossRef]
- Achillas, C.; Vlachokostas, C.; Aidonis, D.; Moussiopoulos, N.; Iakovou, E.; Banias, G. Optimising reverse logistics network to support policy-making in the case of Electrical and Electronic Equipment. Waste Manag. 2010, 30, 2592–2600. [Google Scholar] [CrossRef] [PubMed]
- JuMP. Available online: https://github.com/JuliaOpt/JuMP.jl (accessed on 19 April 2020).
- De Oliveira, M.G. Sistema de localização de facilidades: Uma abordagem para mensuração de pontos de demanda e localização de facilidades. 2012. 88 f. Master’s Thesis, Universidade Federal de Goiás, Goiânia, Brazil, 2012. [Google Scholar]
- Abdi-Agência Brasileira De Desenvolvimento Industrial. Logística Reversa de Equipamentos Eletroeletrônicos: Análise de Viabilidade Técnica e Econômica; Abdi-Agência Brasileira De Desenvolvimento Industrial: Brasília, Brazil, 2013; 179p. [Google Scholar]
- Dias, P.; Machado, A.; Huda, N.; Bernardes, A.M. Waste electric and electronic equipment (WEEE) management: A study on the Brazilian recycling routes. J. Clean. Prod. 2018, 174, 7–16. [Google Scholar] [CrossRef]
- Puckett, J.; Smith, T. Exporting harm: The high-tech trashing of Asia. In Silicon Valley Toxics Coalition; The Basel Action Network: Seattle, WA, USA, 2002. [Google Scholar]
- Nowakowski, P.; Mrówczyńska, B. Towards sustainable WEEE collection and transportation methods in circular economy-Comparative study for rural and urban settlements. Resour. Conserv. Recycl. 2018, 135, 93–107. [Google Scholar] [CrossRef]
- Baldé, C.P.; Forti, V.; Gray, V.; Kuehr, R.; Stegmann, P. The Global E-waste Monitor—2017; United Nations University (UNU): Tokyo, Japan; International Telecommunication Union (ITU) & International Solid Waste Association (ISWA): Bonn, Germany; Geneva, Switzerland; Vienna, Austria, 2017. [Google Scholar]
- Guarnieri, P.; E Silva, L.C.; Levino, N.A. Analysis of electronic waste reverse logistics decisions using Strategic Options Development Analysis methodology: A Brazilian case. J. Clean. Prod. 2016, 133, 1105–1117. [Google Scholar] [CrossRef]
- Elia, V.; Gnoni, M.G.; Tornese, F. Improving logistic efficiency of WEEE collection through dynamic scheduling using simulation modeling. Waste Manag. 2017, 72, 78–86. [Google Scholar] [CrossRef] [PubMed]
- Hosseini, M.B.; Dehghanian, F.; Salari, M. Selective capacitated location-routing problem with incentive-dependent returns in designing used products collection network. Eur. J. Oper. Res. 2019, 272, 655–673. [Google Scholar] [CrossRef]
- Echegaray, F.; Hansstein, F.V. Assessing the intention-behavior gap in electronic waste recycling: The case of Brazil. J. Clean. Prod. 2017, 142, 180–190. [Google Scholar] [CrossRef]
- Gmcons. Maps. Available online: http://www.gmcons.com.br/gmclog/admin/VisualizarPostosMapaCliente.aspx (accessed on 7 March 2019).
- Green Eletron. Available online: https://www.greeneletron.org.br (accessed on 7 March 2019).
- Silva EF, V.; Almeida, G.O.; Guarnieri, P.; Silva, L.C. Uma analise sobre o uso da Pesquisa Operacional no suporte ao gerenciamento de resíduos eletroeletrônico. In Proceedings of the XXXVIII Encontro Nacional de Engenharia de Produção, XXXVIII ENEGEP, Maceió, Brazil, 6–19 October 2018. [Google Scholar]
- Tasan, A.S.; Gen, M. A genetic algorithm based approach to vehicle routing problem with simultaneous pick-up and deliveries. Comput. Ind. Eng. 2012, 62, 755–761. [Google Scholar] [CrossRef]
- Junqueira, L.; Morabito, R. Heuristic algorithms for a three-dimensional loading capacitated vehicle routing problem in a carrier. Comput. Ind. Eng. 2015, 88, 110–130. [Google Scholar] [CrossRef]
- Glover, F.; Kochenberger, G.A. Handbook of Metaheuristics; Kluwer Academic Publishers: Boston, MA, USA, 2003. [Google Scholar]
- Voss, S.; Woodruff, D.L. Introduction to Computational Optimization Models for Production Planning in a Supply Chain; Springer Science & Business Media: Berlin, Germany, 2006. [Google Scholar]
- Mar-Ortiz, J.; González-Velarde, J.L.; Adenso-Díaz, B. Designing routes for WEEE collection: The vehicle routing problem with split loads and date windows. J. Heuristics 2013, 19, 103–127. [Google Scholar] [CrossRef]
- Masum AK, M.; Shahjalal, M.; Faruque, F.; Sarker, I.H. Solving the Vehicle Routing Problem using Genetic Algorithm. Int. J. Adv. Comput. Sci. Appl. 2011, 2, 126–131. [Google Scholar]
- Goldbarg, M.C.; Goldbarg, E.G.; Luna, H.P.L. Otimização Combinatória e Meta-Heurísticas: Algoritmos e Aplicações, 1st ed.; Elsevier: Rio de Janeiro, Brazil, 2016. [Google Scholar]
- Hillier, F.S.; Lieberman, G.J. Introdução à Pesquisa Operacional, 8th ed.; McGraw-Hill: São Paulo, Brazil, 2006. [Google Scholar]
- Dantzig, G.; Fulkerson, R.; Johnson, S. Solution of a large-scale traveling-salesman problem. J. Oper. Res. Soc. Am. 1954, 2, 393–410. [Google Scholar] [CrossRef]


Publisher’s Note: MDPI stays neutral with regard to jurisdictional claims in published maps and institutional affiliations. |
© 2020 by the authors. Licensee MDPI, Basel, Switzerland. This article is an open access article distributed under the terms and conditions of the Creative Commons Attribution (CC BY) license (http://creativecommons.org/licenses/by/4.0/).