Article

Potential Techno-Economic Feasibility of Hybrid Energy Systems for Electrifying Various Consumers in Yemen

1
State Key Laboratory of Alternate Electrical Power System with Renewable Energy Sources, School of New Energy, North China Electric Power University, Beijing 102206, China
2
School of Economics and Management, North China Electric Power University, Beijing 102206, China
*
Author to whom correspondence should be addressed.
These authors contributed equally.
Sustainability 2021, 13(1), 228; https://doi.org/10.3390/su13010228
Submission received: 9 December 2020 / Revised: 22 December 2020 / Accepted: 24 December 2020 / Published: 29 December 2020
(This article belongs to the Section Energy Sustainability)

Abstract

:
Global warming and climate change are becoming a global concern. In this regard, international agreements and initiatives have been launched to accelerate the use of renewable energy and to mitigate greenhouse gas (GHG) emissions. Yemen is one of the countries signed on these agreements. However, Yemen is facing the problem that the structure of the power grid is fragile and the power shortage is serious. Accordingly, this paper aims to study the potential for renewable energy in Yemen and assess the technical and economic feasibility of hybrid energy systems. Firstly, this paper introduces the status and challenges of Yemen’s electricity sector, the status of renewable energy, and the status of GHG emission. Secondly, this study proposes the method of optimizing different configurations of off-grid hybrid (solar/wind/diesel engine) energy systems for electrifying various consumers in Taiz province, Yemen under three scenarios of energy strategies. The objective function is to seek the most optimal hybrid energy system that achieves the least cost and most advantageous technical performance, while instigating the best economic scenario of energy strategies. Finally, Homer pro software is used for simulation, optimization, and sensitivity analysis of the designed energy systems. The results found the best economically feasible scenario, the hybrid PV/wind/diesel energy system, among the other scenarios. A photovoltaic (PV)/wind energy system achieved the best technical performances of 100% CO2 reduction, with a 54.82% reduction in the net present cost (NPC) and cost of energy (COE); while the hybrid energy system (PV/wind/diesel engine) achieved the best economic cost of 61.95% reduction in NPC and COE, with a 97.44% reduction of CO2 emission.

1. Introduction

A recent statistics review of world energy 2020 reported that 84% of global energy is still supplied by fossil fuel, while renewable energy merely supplies 11% of global primary energy consumption. Burning fossil fuels for energy production results in a major amount of GHG emission that harms the environment and causes global warming, while renewable energy sources have less GHG emission [1,2]. In this context, accelerating the development of renewable energy has become an essential concern of many countries and organizations around the world. Renewable energy is expected to grow up to 63% of the global total energy supply by the year 2050, and the combination of renewable energy with high-energy efficiency can decline 94% of GHG emission. The International Energy Agency (IEG) Sustainable Development Scenario (SDS) has stated that to attain long-term climate aims, the renewable energy needs to grow over 300 GW average capacity each year up to 2030. A total of 181 GW renewable power was installed by 2018, which reached 200 GW by 2019. The rate of renewable energy has grown up to 27.3% of the global electricity production by the end of the year 2019, and was expected to grow up to 85% by 2050 and decline 85% of carbon dioxide emission across the electricity generation sector [3,4,5,6].
Several international conventions and initiatives have been launched for renewable energy promotion. The Paris agreement on climate change (December, 2015) is a well-known convention that belonged to the Framework Convention on Climate Change organized by the UN and approved by 196 countries. The core outcome of the Paris agreement is to keep the global temperature below 2 degrees Celsius above pre-industrial levels. Countries have responded to reduce more than 80 percent of greenhouse gas emissions [7]. As well, the Kyoto protocol is historically extended to the United Nations Framework Convention on Climate Change (UNFCCC). It was adopted in 1997 and entered as international law in 2005. The protocol committed the developed countries group to reduce 25–40% of greenhouse gas emission compared to the 1990 level by 2020, and for developing countries to reduce it 15–30% by 2020, till a new policy Agreement is started in 2020 [8,9]. The United Nations Environment Program Finance Initiative (UNEP FI) has launched for the 47 countries of sub-Saharan Africa. The initiative is to install 7 GW new power generation per year to meet increasing demand and attain economic stability [10]. The Beijing International Renewable Energy Conference (BIREC) was participated by ministers and government representatives from 78 countries around the world. All attendees declared their commitment to implement the outcomes of the Earth Summit, the World Summit on Sustainable Development (WSSD) [11]. The UN Refugee Agency (UNHCR) has established a global strategy for sustainable energy to promote using clean energy to the refugee camps, hosting sites, and support facilities [12]. Sustainable Energy for All (SE4All) is an international initiative created by the UN in 2011. Now it has become an organization that cooperates with UN agencies, governments, and civil societies. It aims to access global energy, double the share of renewable energy from the current rate to 36%, improve energy efficiency and minimize energy intensity growth rate to −2.6%. These goals have to be attained by 2030 [13]. The China ‘Belt and Road’ initiative has also adopted a vision of green development [14].
In the context of the influences of global warming and climate change, a lot of studies have been carried out to assess renewable energy (RE) potential in different locations in the world. These studies are served for various applications which may achieve the electrification of the remote area [15,16], island [17,18], telecommunication [19], and water desalination [20]. RE’s potential was studied in the U.S [21] which took into account socio-economic factors. The study found that with the increasing ratio of renewable energy the GHG emission reductions could reach 40% and 17% by 2050. China, the world’s largest country in energy consumption and CO2 emission, had its RE potential assessed in [22]. The study indicated that wind and hydropower are on the priority of development at the present time and near future, due to more mature technology and low cost. Solar will rapidly develop with national strategic support, while biomass and geothermal power will hopefully grow fast on the condition of well-guaranteed resources.
In Algeria, solar energy shows great potential with a 93% renewable fraction in the hybrid energy system (photovoltaic (PV)/diesel/battery) for electrifying remote Saharan regions in southern Algeria; the cost of energy (COE) was 0.37 dollars/kWh [23]. The potential of a solar and wind hybrid energy system for electrifying the island Kavaratti in India is found to be the best choice among current existing power systems, the system supplied energy with 0.10995 dollars/kWh [24]. In Indonesia, the study in [25] assessed RE feasibility by considering the current state of the renewable energy market, estimation cost, switching to renewable energy sources and their implantation. The study found that renewable energy is promising. Different configurations of off-grid hybrid energy systems (solar/biomass/diesel) have been projected for none electrified areas of northern Bangladesh. The result exposed that the COE of an off-grid optimum energy system is much higher than the grid-connected tariff. Whereas, it is more economical than the diesel-based power generation. The analysis also found that the CO2 emission could be reduced by 75% comparatively [26].
In Colombia, solar PV energy is found to be a promising solution for electrifying Colombian Caribe island. While, the study confirmed that the wave, tidal energy and wind do not have the potential [27]. The RE potential for powering the Mediterranean islands is represented to be best cost-effective energy provider. Replacing diesel power systems with a renewable energy capacity can not only add environmental protection, but also at the same time save amounts of transport costs [28]. In this context, replacing diesel power plants with renewable energy power generation in the Philippines Island can reduce huge economic expenses and environmental risk prevention [29]. Akuru, U.B. et al. [30] concluded that 100% RE is possible in Nigeria, due to the absence of government policy to utilize these resources. The study suggested that individuals/communities can drive this 100% RE transition instead of unexpected government attention.
In terms of the Middle East region, that occupies more than half the world’s crude oil production and more than a third natural gas service [31]—from the perspective of commitment to the regional countries restriction of carbon emission and stopping environmental damage—the RE potential is rapidly being assessed. It has been found that the Middle East has a great potential for solar and wind sources [32]. Many countries have carried out a lot of research on investigating the renewable energy potential in their lands, such as studies conducted in Turkey [33,34], Iran [35,36], Egypt [37], and Morocco [38]. The gulf countries are the major Middle East countries of crude oil and gas production—in the top 25 of the world’s countries CO2 emissions. The energy consumption growth, with an 8% rate each year, means that they have doubled energy production [39]. The six gulfs cooperation council (GCC) countries have already started considered these issues, by including renewable energy sources as the best alternative option toward sustainable energy that would reduce CO2 emission. Various studies have been implemented to evaluate RE potential in different Gulf countries, such as studies in [40,41,42] for the kingdom of Saudi Arabia (KSA), others studies for the United Arab Emirates (UAE) [43,44], Qatar [45,46], and Kuwait [47,48]. The conducted studies in Kuwait have shown that the PV power is not suitable in the states of Kuwait, due to environmental conditions. However, wind energy is the best alternative.
Yemen is one of the Middle East countries. Its regional location is in southwest Asia, the southern Arabian Peninsula, and located at 15.5527° N, 48.5164° E. Yemen shares a border with Saudi Arabia from the north, Oman from the east, the Red Sea from the west, and Aden gulf from the south. It is overlooked on Bab-el-Mandeb Strait, which is one of the most important trade lines in the world. The geographical characteristics of Yemen consist of three major zones: the mainland, highland, and island. The total area is approximately 536,869 km2. In terms of renewable energy sources, Yemen has been invited by several international organizations to investigate renewable energy potential. The results are reported that Yemen has abundant renewable energy and can play a vital role to drive up the energy sector. The annual average solar radiation is in the range of 18–26 MJ/m2/day over 3000 h each year of clear blue sky. The wind speed is in the range of 4–15 m/s and 60 mw/cm2 heat flow rate. The theoretical potential of renewable energy is referred to in [49] as 2,446,000 MW solar energy, 3014 MW solar thermal, 308,722 MW wind energy, and 304,000 MW geothermal energy. Some studies have examined the RE potential. For example, studies in [50,51,52] assessed the challenges in the energy sector, indicators of energy efficiency, and policy of adopting renewable energy. The renewable data is analyzed in [53,54,55]. Furthermore, influences of the public’s awareness, attitudes, behavior on the accelerated development of renewable energy are also studied in [56,57]. A few related studies have applied renewable energy for power applications [58,59,60,61].
According to the current problems of the hybrid energy system, its applications in Yemen, we studied the potential techno-economic feasibility of hybrid energy systems. The significance and contribution of our study are as follows:
(1) The status of the electricity sector, renewable energy, GHG emission, and mitigation strategies in Yemen are reviewed. Based on the status, the study on the potential techno-economic feasibility of hybrid energy systems is specified. This paper proves that renewable energy has the potential to restore the energy sector in Yemen, and suggests a series of procedures that should be started from a decentralized aspect (sub national grid) to a centralized aspect (official national grid). Then, the paper provides an estimation of GHG emission reduction.
(2) In this study, different configurations of hybrid renewable energy systems (HRES) with conventional power generation systems are considered, and the technical and economic performances of each configuration are assessed. Many previous studies [58,59,60,61] have reviewed the feasibility of renewable energy applications. However, those studies have their drawbacks, such as not having dealt with various configurations of renewable energy sources and not considering a wide range of parameters worthy of discussing. Furthermore, other studies have just focused on either studying the obstacles, drawing up strategies [50,51,52], or data analysis [53,54,55]. This study offers a wide range of technical and economic choices to enable the making of decisions in which the energy system is the best choice for the region under study.
(3) The studies of the optimal design and techno-economic assessment of stand-alone HRES are very important—particularly in Yemen—while these kinds of studies do not obtain enough research, owing to the reasons of economy and war. As reported in [62,63], most of renewable energy systems are unreliable and inefficient in terms of inappropriate design and sizing. This is due to the lack of consideration of various factors of renewable energy or energy storage, the lack of renewable energy institutes to play a key role of raising the level of trainees, and the lack of conducting studies on related systems. Whereas, this study can answer whether renewable energy is technically feasible and economically competitive or not, and encourage the country and the private sector to switch to alternative renewable energy.
(4) The study could introduce a road map forecasting the potential of renewable energy in Yemen, providing new acknowledgment and answers to achieve the goals of the United Nations Framework Convention and Climate Change (UNFCCC) that is represented by the Paris agreement and Kyoto protocol. In the Paris agreement of climate change, Yemen committed to reducing 14% of GHG emission by 2030, and has shown a positive response in the Kyoto protocol through submitting its own national communications drafts.
The rest of this paper is organized as follows: Section 2 and Section 3 introduce the status of the electricity sector, renewable energy, GHG emission and mitigation strategies in Yemen. Section 4 is the configuration and design of HES. Section 5 introduces the data and software. Section 6 is the results and discussion. Section 7 is the conclusions.

2. The Status of Yemen’s Electricity Sector and Renewable Energy

2.1. The Status before 2015

Yemen is the least developed country, but over the last three decades, the electricity demand has rapidly increased due to population increase and economic growth. The electricity is mainly generated by fossil fuel, at the rate of 99.91%, with a 0.09% share from renewable energy. The fossil fuel is constituted of 79.91% heavily fuel oil (HFO) and diesel, and 20% natural gas. The total generation capacity is 1.67 GW. It is one of the lowest among Middle East countries and it is just enough to satisfy 40% of electricity demand with 200 kWh/capita/year. In an attempt to address the gap between electricity generation and demand, the yearly demand growth is 9.6%. By 2012, the Government of Yemen (GOY) and China National Corporation have reached an agreement to construct three natural gas power plants, each one is more than 400 MW. The Turkish government has funded Yemen to construct a 263 MW power plant that can be operated by petroleum and natural gas. Unfortunately, none of the stated projects has materialized due to the 2015-fired conflict. Additionally, Yemen and Ethiopia still negotiate to buy electricity from hydropower south of the country [49,62,63].
On the other side, the Yemen Ministry of Electricity and Energy (YMOEE) has established renewable energy departments by 2002 to encourage environmentally friendly renewable energy and rely on its sustainable sources [64]. The GOY has launched many strategies to exploit renewable energy sources and share them in the energy sector within the collaboration of international agencies. The GOY representatives of the Environment Protection Authority in cooperation with the United Nation Development Program (UNDP) have created the National Biodiversity Strategy and Action Plan II(NBSAP2) vision called “Productivity and Sustainably Socio-Ecosystem by 2050”. The strategy is promoted for adopting green technology in the industry, manufacturer, and energy sectors [65]. The GOY Ministry of Electricity and Energy (MOEE) has set the national strategy of renewable energy and energy efficiency by 2009, that aims to increase the share of renewable energy up to 15% by the year 2025.
Moreover, Yemen has entered into political instability since 2011. All Yemen’s parties and civil organizations have committed to a national dialogue conference by the year 2013. The purpose is to reset all country affairs—to discuss a process toward putting Yemen on the path of peace. The increasing contribution of renewable energy in the energy sector has been discussed and approved by the sustainable development committee in the conference [66,67]. The GOY adopted reforms on the power sector through the launch of the power sector development strategy of 1997, that was updated in 2006. From this emerged the Rural Electrification and Renewable Energy Development Project (REREDP), which was approved by Cabinet in 2008, that aims to increase access to electricity for over 520,000 new rural households, to increase access from the current rate of 23% to around 46% for rural households, to the benefit of 3.5 million people [68].

2.2. The Status after 2015

In the middle of 2015, Yemen witnessed widely military operations, that are ongoing until the time of writing this paper. The electricity sector is significantly affected, where the percentage of the population’s access to public electricity reduced from 60% in 2014 to 10% by the end of 2017. The impacts were devastating. Some of the power plants have been totally destroyed and others were partially destroyed, causing the reduction of generation capacity, and even difficulties of fuel delivery from the electricity generation plants [49]. Currently, the average power supply is around 200–250 MW. For example, the capital Sana’a’s demand is around 500 MW, but it was only supplied by 40 MW for a few hours each day. Aden governorate has also encountered an electricity shortage, which demands 390 MW but is only covered by 190 MW. The Al buraydah and Ibb governorates, which both required 280 MW total demand, have not been covered at all. The Taiz governorate, which is the largest population in Yemen, requires 111 MW of electricity service, but it seems that the public electricity grid has not provided for it at all.
As long as the conflict continues, the transmission lines are periodically under attack, which means it is useless to maintain power plants. The World Bank [69] proposed a feasible approach that is to shift the electricity sector from centralization to decentralization. First, the electricity system is re-built from the ground (solar), both technically and institutionally. Then, extend the solution from small off-grid systems and increase toward the urban grids, municipal grids (sub-national), and last gradually up to the national grid. This proposed solution takes a long time in parallel with the conflict hopefully reaching the end.
The shortage of electricity supply has extended to have effect on the health services, food supply, water and sanitation, banking facilities, etc., in the absence of the national electricity grid and diesel fuel supply. Therefore, the combined efforts of individuals, private sectors, and a little government contribution are invested in solar PV as an alternative power supply for the public and private sector. The solar PV systems are witnessing a huge penetration in Yemen’s market and approximately 1–2 billion (dollars) has been invested in them. It could be able to supply power to 75% of households in urban areas and 50% in rural areas. Indeed, Yemen’s solar revolution was born by necessity when fuel shortage and public grid damages have become unfeasible. Therefore, stakeholders and households have been unable to find other options. Whatever solar PV energy systems are recently used in Yemeni urban and rural, it is still unreliable and inefficient in terms of inappropriate design and configuration due to the lack of renewable energy experts and renewable energy institutes to play a key role in raising the level of trainees and conducting studies on related systems [62,63].

3. The Status of GHG Emission and Mitigation Strategies in Yemen

Yemen is not an industrial country. Thereby, industrial activities have not produced a significant amount of GHG emission. Energy-based GHG emission is mainly dominated, occupying about 69.3% of total GHG emission. The remaining 30.7% is contributed from non-energy sectors, such as agricultural activities, waste recycling, and industrial process at rates corresponding to 23.1%, 3.7%, and 2.9%, respectively. While GHG emissions are generated by the energy sector, the majority of emissions caused by fossil fuel combustion for electricity generation, transportation, and other sectors contributes to 19.3%, 19.2%, and 16.6%, respectively. The remainder is caused by using kerosene and diesel for residential, agricultural, and commercial sectors [65]. The total amount of GHG emission has not had a major effect on the global climate. It merely contributes to about 0.08% of global emission, at the rank of 130 out of 188 countries of GHG emission per capita [70].
In the background of global efforts to preserve the temperature from rising and to reduce greenhouse gas emissions, Yemen has always conducted positive actions of cooperation with the UNFCCC; it ratified the UN convention of biological diversity. Yemen prepared a National Biodiversity Strategy and Action Plan 1 (NBSAP1) in 2005 for a sustainable and better standard of living through the use of sustainable resources and the stabilizing of consumption [71]. Additionally, Yemen released NBSAP2 in 2017 for achieving a resilient socio-ecosystem, to be productive and sustainable by the year 2050 [65]. In terms of the Paris agreement of climate change, Yemen has signed it in September 2016 without ratifying the agreement. It drafted its Intended Nationally Determined Contribution (INDC) in Nov 2015, committed to reducing 14% of GHG emission by 2030, below a business as usual (BAU) scenario [72].
Furthermore, Yemen worked on adopting a clean development mechanism in 2007 to attain the goals of the Kyoto protocol, that were ratified by September 2004 [73]. Articles 4 and 12 of UNFCCC stated that all countries that have participated in the convention should prepare national communication to describe their inventories of GHG emission and to decrease emission. Accordingly, Yemen drafted its Initial National Communication (INC) in 2002 and submitted the second national communication (SNC) to the UNFCCC by 2013. As well, the 3rd national communication was submitted in 2018. The letters reported the implemented projects, which were already initiated in several different fields: water resources conservation and rational usage, coastal zone management, agricultural reforms, and renewable energy assessment [74,75]. The low emission development strategy emerged in 2008 under the UNFCCC and Yemen prepared its national low emission development strategic (LEDS) in 2003 with the support of the UNDP. The strategy illustrated the emission reduction options and their prospective cost, it presenting a roadmap toward low GHG emission. Additionally, it identified mid-term and long-term mitigation objectives [76].

4. Configuration and Design of Hybrid Energy System

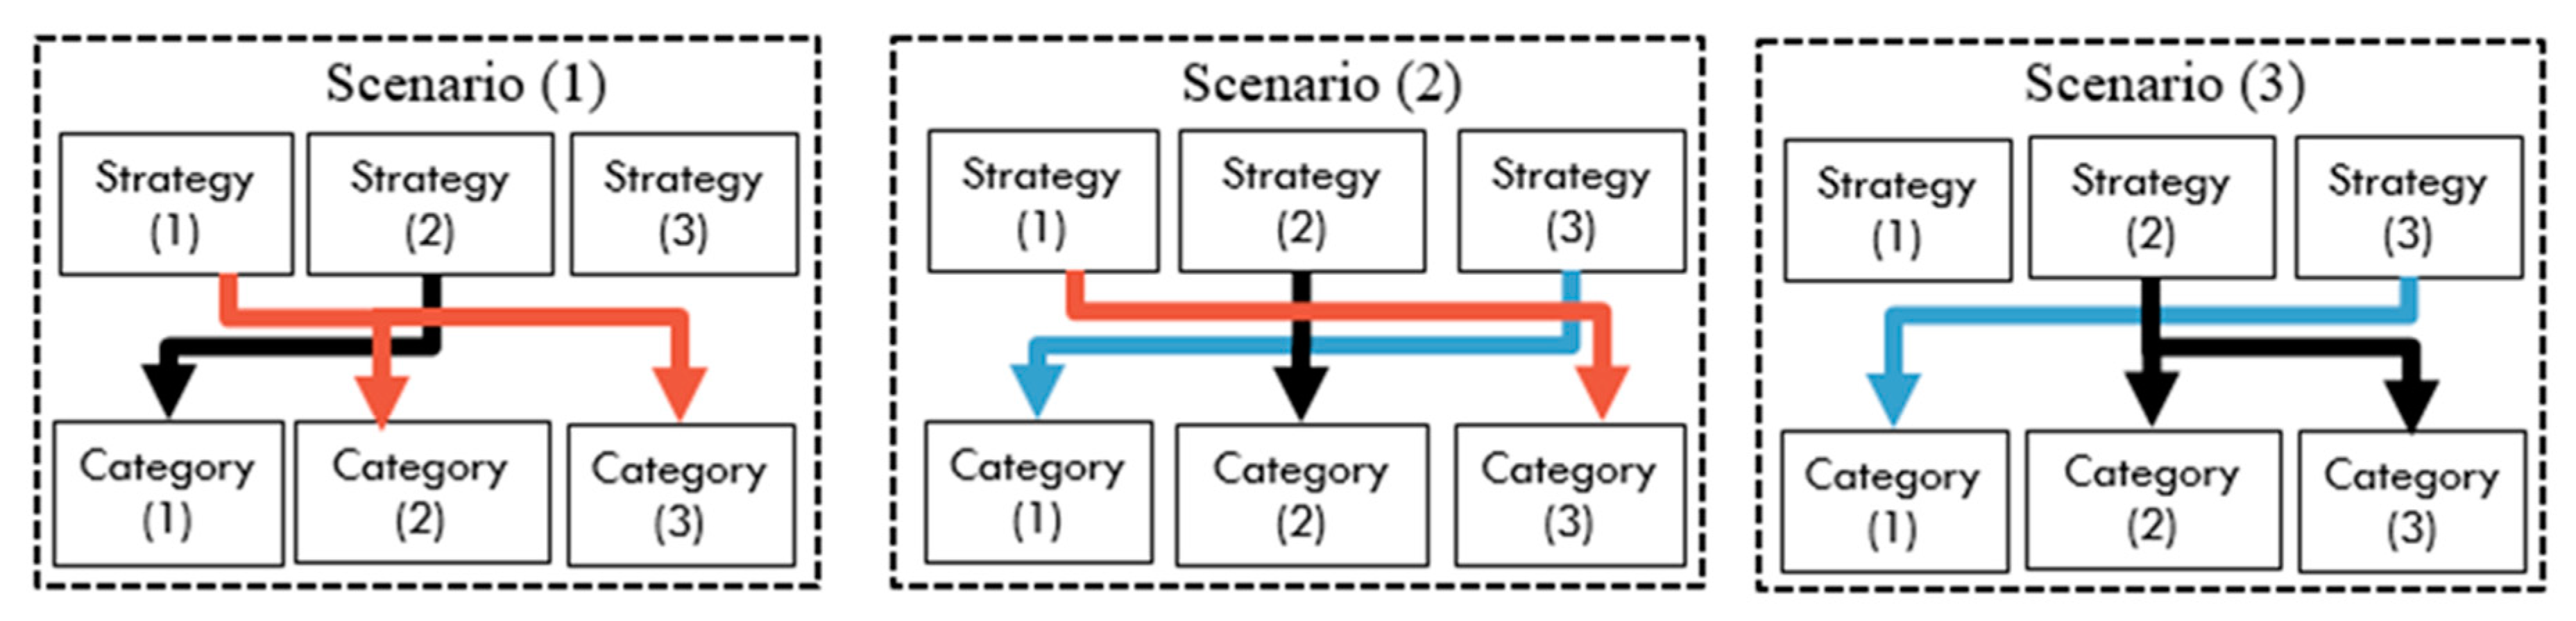
4.1. Energy Strategies and Classification of Electricity Consumers in Yemen

The Government of Yemen (GOY) has established long-term strategies in the energy sector, considering the hypothesis that the economic and the GDP increase slowly [49]. The strategy (1) is to supply 1.10 kWh/day/capita. The strategy (2) is to supply 2 kWh/day/capita, which is 50% of the average electrical energy/capita of other Arab countries. The strategy (3) is to electrify 4 kWh/day/capita, which is about 50% of the world average electrical energy/capita.
A total of 25% of the population in Yemen is in urban areas, and 75% is rural [77]. Yemen has low electricity access, which about 85% urban and 23% rural population can access [62]. The government classifies those people who live in the rural area into four types based on the ability to access the national electricity grid [49]. The first type easily accesses the grid, the second can access the grid with a slightly increased cost, the third can access the grid with high increased cost, and the fourth is high cost and difficult to access the grid.

4.2. The Topology and Components of the System

The study is developed to design different configurations of micro-grid energy systems including PV, wind turbine (WT) and diesel engine (DE) for electrifying diversity of consumers in the Taiz province, Yemen, under consideration of three scenarios of energy strategies. Five configurations of energy systems are suggested for design, as follows: DE power system (Case I), PV/DE (Case II), WT/DE (Case III), PV/WT/DE (Case IV) and PV/WT (Case V), as presented in Figure 1.
The PV, wind and DE are the main power sources. PV and WT are dependent on renewable energy, while DE is dependent on fossil fuel. The battery storage system is used to store excess power in case the generated power is beyond the energy demand, to supply the load when the energy demand excesses the generated power. The direct current (DC) supplied from PV and battery power systems needs to be changed to alternative current (AC) through a DC-AC converter to accommodate an AC load. The cycle charging energy management strategy is considered for energy dispatching among power sources, energy storage, and demand of power. In this strategy, in case the deficit of supply of the load happens, Homer Pro (hybrid optimization model of electric renewable energy) assesses the best economical energy to switch from either battery storage or DE. The DE operates at full capacity to support the load deficit and charge the batteries.
The allowed maximum annual capacity shortage of the designed system is zero percent and the allowed minimum renewable energy fraction is zero percent too. For creating a more practical and dynamic load, the random variability of the load is considered as 5% a day, 10% sampling time. The minimum load ratio of the diesel engine is 15%. The economic paraments settings are relative to the economic status of Yemen. The nominal interest rate is 27% [78], the inflation rate is 26.7% [79], and accordingly Homer Pro can calculate the real interest rate 0.24%. The diesel fuel price is 1.38 dollars dollars [80]. The minimum value of the state of charge (SOC) of the battery is 40% and the maximum is 80%. The project lifetime is considered as 25 years.
Homer Pro is used to simulate, optimize, and assess the economic cost of different scenarios of energy strategies, and examine the technical and economic aspects of different configurations of energy systems. The sensitivity analysis takes into account variation of load scale (population growth) for the upcoming ten years, the variation of real interest rate, and diesel price.
This study seeks for the least cost scenario of energy strategies, and a typical energy system that achieves the least cost and advantageous technical performances. The studies on cloud energy [81] and energy-efficient routing [82] are focused on more efficient energy composition and applications, which are meaningful concerning the utilization of energy and inspiring for the techno-economic feasibility analysis. The technical characteristics and economic costs of system components are collected from manufactories datasheets and explained in detail in the following subsections.

4.3. Components Configuration

This subsection mainly discusses the technical characteristics and economic cost of each energy systems’ components. The components technology is available in the Homer Pro library, the technical and economic specifications are brought from manufactories data sheets related to the technology used. Based on these technical characteristics and the economic cost, the configuration of each component can be obtained.

4.3.1. Solar PV

PV power is based on solar radiation energy. In this study, the PV model capacity is chosen by the Homer optimizer, dependent on solar radiation density, energy demand, and system constraints, such as the allowed maximum capacity shortage and minimum renewable energy fraction. For the configuration of PV, it should be able to supply the load and offer excess energy to be stored in the battery. In Homer, the PV model mathematical expression is presented in Equation (1) [83]:
P P V = γ P V f P V ( G T G T , S T C ) [ 1 + P   ( T C T C , S T C ) ]
where, P P V is the PV array output power in [kW]. γ P V   is the PV array capacity in [kW]. f P V is the derating factor in [%]. G T is the time step solar irradiation in [kW/m2]. G T , S T C is the standard solar irradiation [1 kW/m2]. P   is the temperature effect on the power [%/ ]. T C is the nominal cell temperature in the current time step [ ], and T C , S T C is the standard cell temperature [ 25   ].
The PV that is chosen is the flat plate Sun Power E20–327, manufactured by Sun Power manufactory [84]. The lifecycle of the model is 25 years, the derating factor is 88%, the model efficiency is 20.4% and the ground reflectance is 20%. In our study, the effect of ambient temperature on PV power is taken into account. The operating temperature of the cell is 45 , and the temperature effect on the PV model power is −0.360%/ . The capital cost of PV models is 2180 dollars/kW, the O&M and replacement cost are considered as zero due to the PV model lifecycle is the same project lifetime.

4.3.2. Wind Turbine

In this paper, AC wind turbine technology EnerconE-82E4 is used and the capacity of a single turbine is 3 MW. The Homer optimizer is used to determine the wind farm capacity. The capital cost of a single turbine is 2,895,000 dollars, the replacement cost is 2,695,000 dollars, and O&M cost is 100 dollars [85]. The high O&M cost is due to the lack of trained awareness of wind turbines in Yemen.
The technical specifications of the wind turbine are brought from the manufactory [86]. The lifetime is 20 years, the hub height is 84 m, the number of wind turbine blades is 3, and the rotor diameter is 82 m.

4.3.3. Diesel Engine Generator

The CAT-3500kVA-50Hz-PP diesel engine manufactured by Caterpillar manufacture is used in the proposed systems. The sizing search range is set from 100 to 800 MW and the Homer optimizer is used to seek the optimal configuration within this range. The economic and technical specifications of the diesel engine are brought from the manufactory datasheet [87]. The capacity is 2000 kW, the capital cost is 258,750 dollars, the replacement cost is 240,750 dollars and the O&M cost is 0.2 dollars/h. For the technical performances, the lifetime is 90,000 h and the minimum load ratio is 15%.

4.3.4. Battery

Due to the intermittent output characteristics of renewable power systems, to smooth the intermittent supply and deliver continuous power to the demand load, energy storage is necessary. In the hybrid system, the energy storage unit is the Surrette 6 CS 25P, due to its availability in different scales, appropriate cost, durability recognized in solar applications, and mobility endurance in remote applications [88]. The technical and economic specifications are collected from the manufactory related sheet [89,90]. The single battery is 6 V, 1156 mAh and 6.91 kWh rated capacity. The lifetime is about 10 years, which may be different based on charging cycles. Four batteries are configured in a single string that totals to 24 V DC bus voltage. The Homer optimizer has optimally configured the numbers of strings required to attain the best technical properties of the system. The capital cost of a single battery is 1180 dollars, the replacement cost is 1098 dollars, and O&M cost is 10 dollars. The roundtrip efficiency is 80% and the minimum state of charge (SOC) is 40%.

4.3.5. Converter

In the hybrid energy system, a power converter is an essential part to convert from direct current (DC) to alternative current (AC) or AC to DC. In our model, the converter is used to convert DC power from the PV and batteries to AC and accommodate it to the AC bus bar to be used by the AC load. ABB converter is chosen in this model due to some advantages, such as improved energy efficiency and minimized energy consumption [91]. The configuration is optimally processed by the Homer optimizer. The technical and economic characteristics are obtained from the manufactory data sheet [92]. The capital cost is 210 dollars/kW, the replacement cost is 190 dollars/kW, and the O&M cost is 5 dollars/year. The lifecycle is 20 years and the conversion efficiency is 96%.

4.4. Financial Criteria in Homer Software

This section discusses the economic formulas used to calculate economic indexes such as net present cost (NPC), and the levelized cost of energy (COE). The NPC is defined that the entire system costs (capital costs, replacement costs, and O&M costs) through the system lifecycle minus the salvage costs (revenues earned), which are the remaining costs of the components at the end of system lifecycle [83]. In order to calculate NPC, annualized total system costs needed to be estimated first, which is the annualized costs of the systems’ components minus any miscellaneous costs. By using the formulas in [93], the NPC can be calculated within Equation (2).
N P C = C A N N , T O T C R F ( i , N )
where C A N N , T O T is the annualized total system cost. i is the annual real interest rate (the discount rate). N is the numbers of system lifecycle years. C R F ( i , N ) is the recovery factor, that can be calculated by Equation (3):
C R F ( i , N ) = i ( 1 + i ) N ( 1 + i ) N 1
The real interest rate i can be estimated by the formula written in Equation (4), as follows:
i = i o f 1 f
where i o is the nominal interest rate in [%], which is the profit rate you can gain against the deposit before the effect of inflation. f is the annual inflation rate in [%] through the project’s lifetime.
The levelized cost of energy (COE), which is the average cost of one unit of energy, (kWh) can be calculated in the Homer program by dividing the total entire system cost of one year by the total energy generated by the system within that year. It can be expressed by Equation (5):
C O E   ( dollar k w h ) = C A N N , T O T E l o a d   s e r v e d  
where E l o a d   s e r v e d   is the actual load served by the energy system per year.

5. Input Data and Simulation Software

5.1. Location of Study

The Taiz province in Yemen is selected to be studied. Its global location is 13.192° N latitude, 43.148° E longitude. The location is in the south-west of the Republic of Yemen on the border of the Red Sea, as shown in Figure 2. It is located in highlands of Yemen with an approximate elevation of 1400 m and with a total area of 10,462 km2. It is the 3rd largest city after the national capital Sana’a and port city Aden. Taiz has been assigned as the cultural capital of Yemen for a long time, it is divided into 23 districts, 3 urban districts, and 20 rural. A total of 19% of the population lives in urban areas and 81% in the mountains, hills, plains and valleys [94,95].

5.2. Resources Assessment

The renewable energy sources (solar, wind) are available in nature and the density of renewable is different in different places. By determining the geographical position of the specific region, Homer Pro can access NASA to obtain the meteorological database and download the weather data required to perform a simulation. Solar radiation and ambient temperature are required for PV input to determine the output energy and wind speed is required by the wind turbine to determine the output characteristics. For this study, Homer can use the altitude and longitude of the location and collected solar radiation, ambient temperature, and wind speed. The three weather variables estimations are discussed in the followed parts. The main climate of Yemen is tropical desert climate, hence the problem of water resource shortage is serious. Unlike the Poland [96], it is almost impossible for Yemen to develop hydropower.

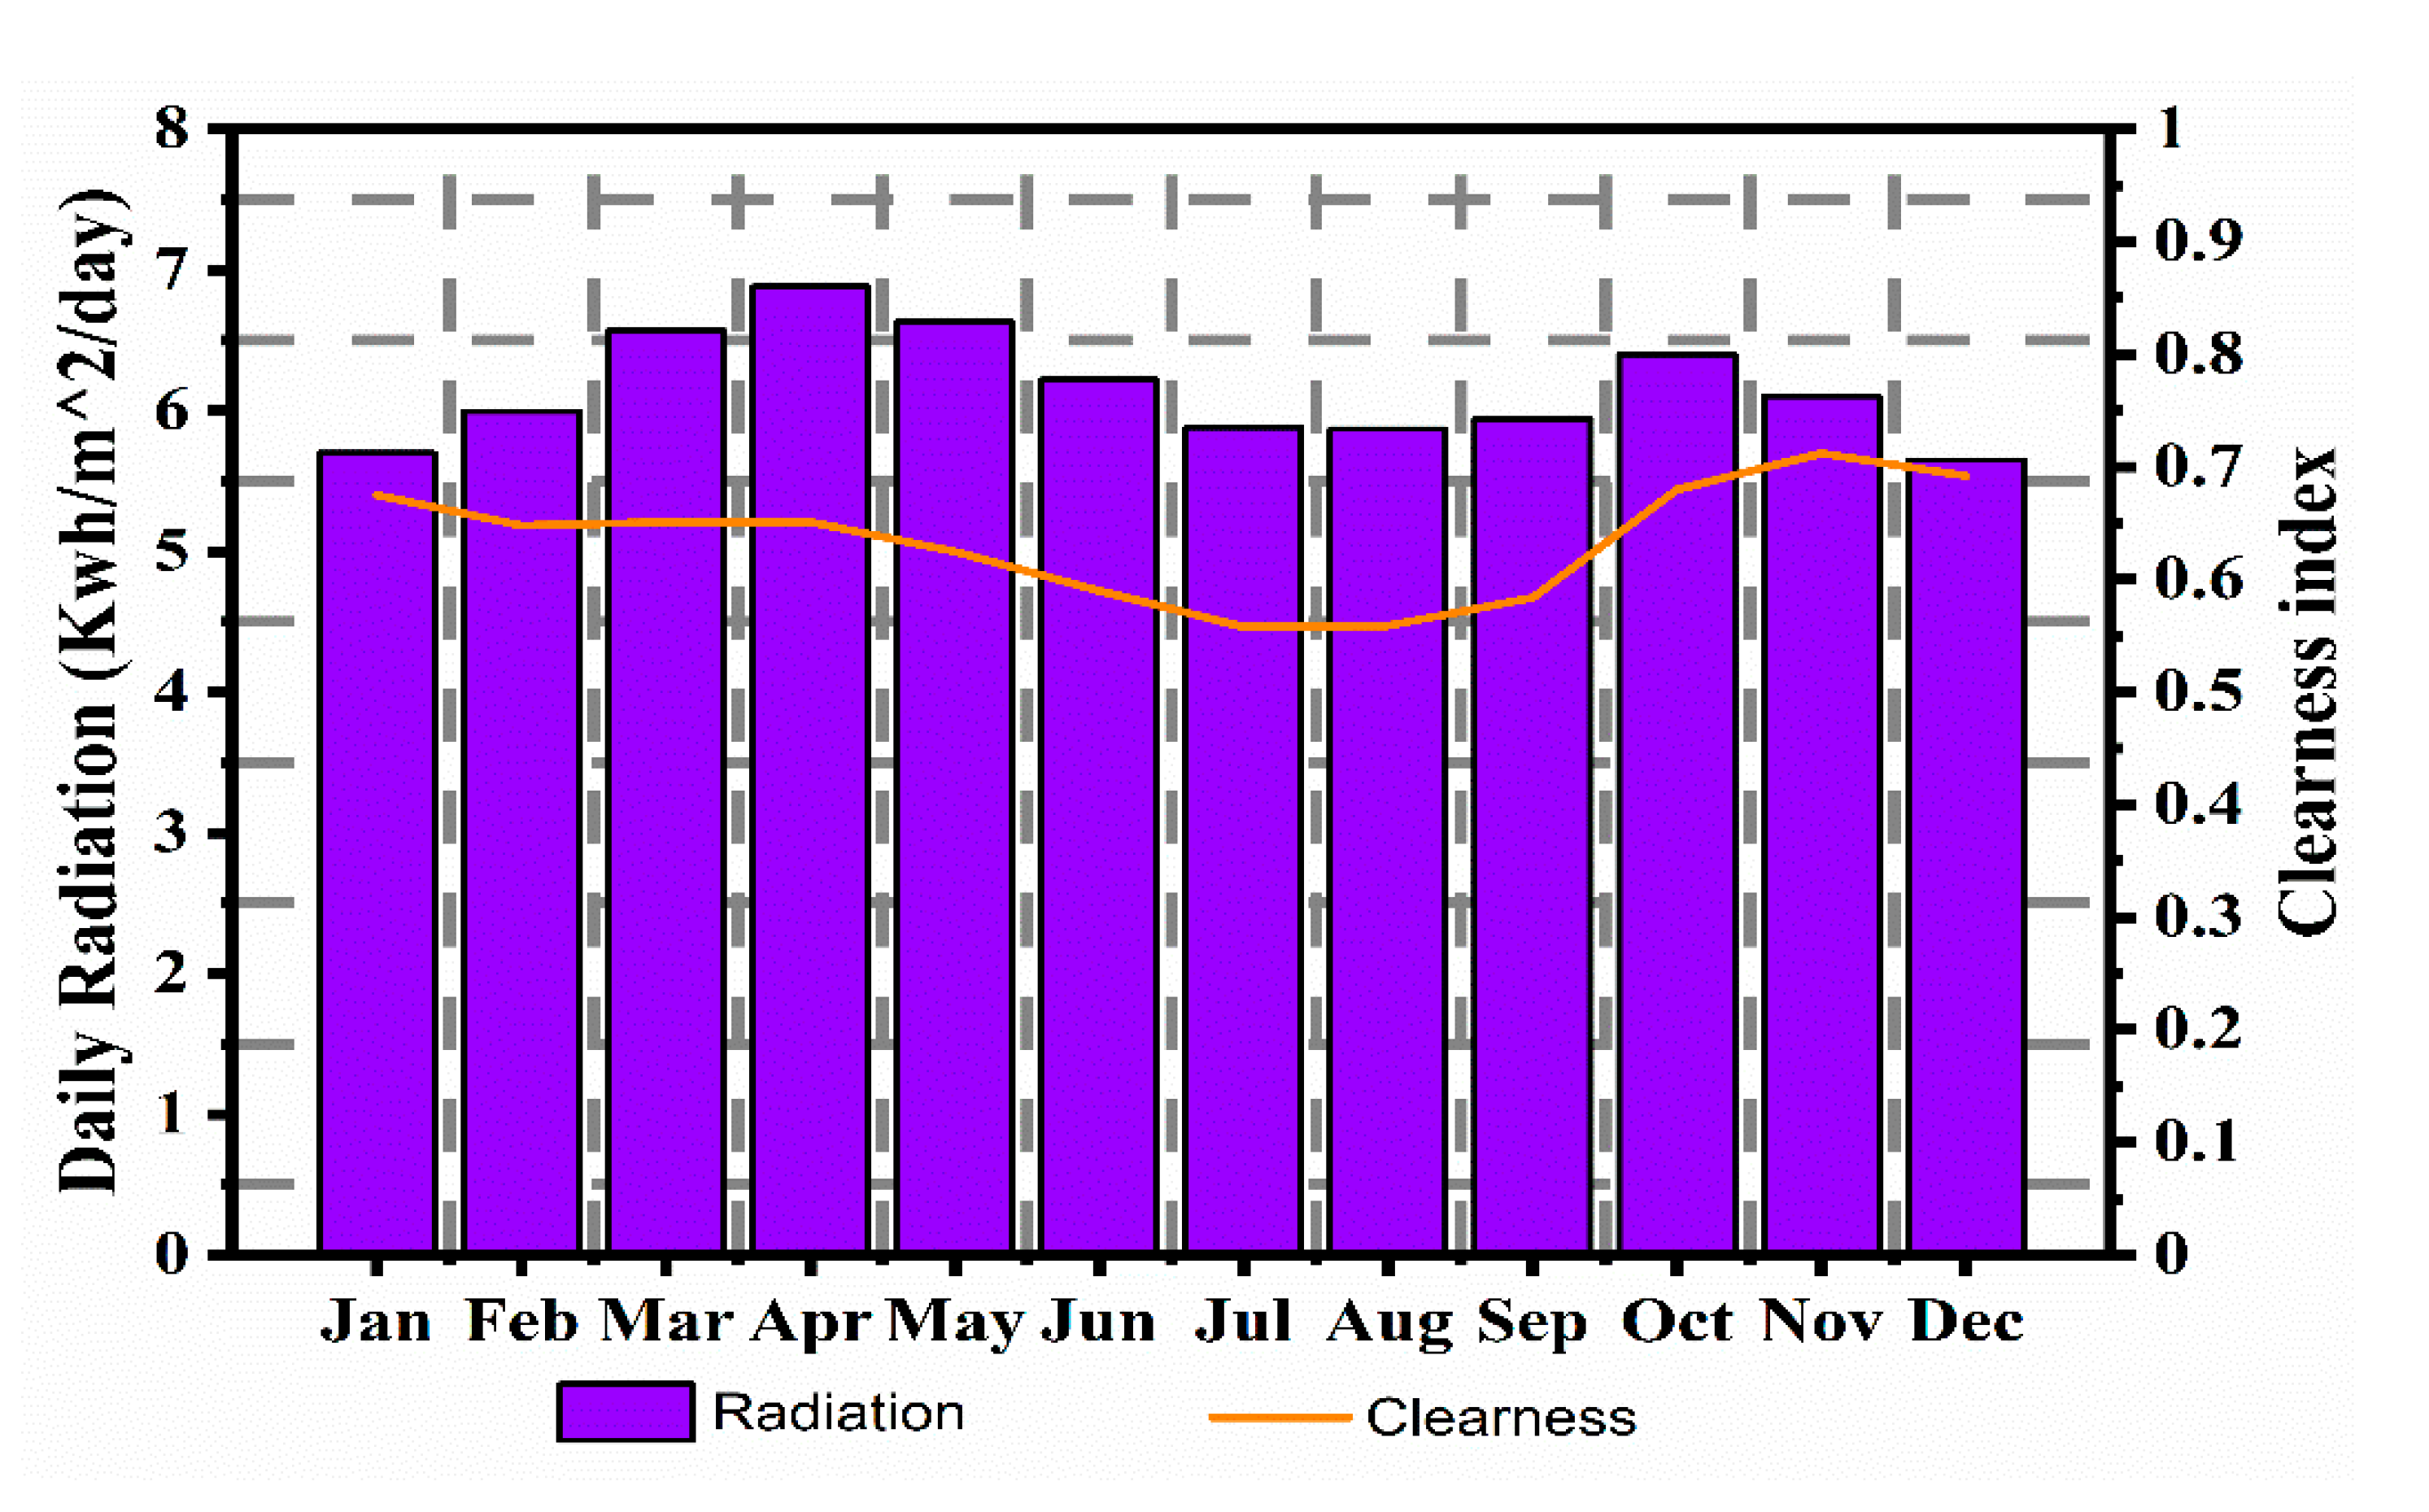
5.2.1. Solar Radiation

The downloaded solar radiation for Taiz province is displayed in Homer resource inputs, as shown in Figure 3. The figure shows the monthly average solar radiation, the annual average is estimated at 6.15 kWh/m2/day. From the figure, it can be seen that March, April, May, June, and October show high potential solar radiation above the annual average. The highest value of 6.88 kWh/m2/day is recorded in April. Other months show lower than annual average and the lowest value of 5.65 kWh/m2/day is in December. It is worthy to say that solar radiation shows great potential and can be considered as a promising alternative energy for electricity generation in Taiz province. Additionally, other provinces in Yemen have a similar climate.

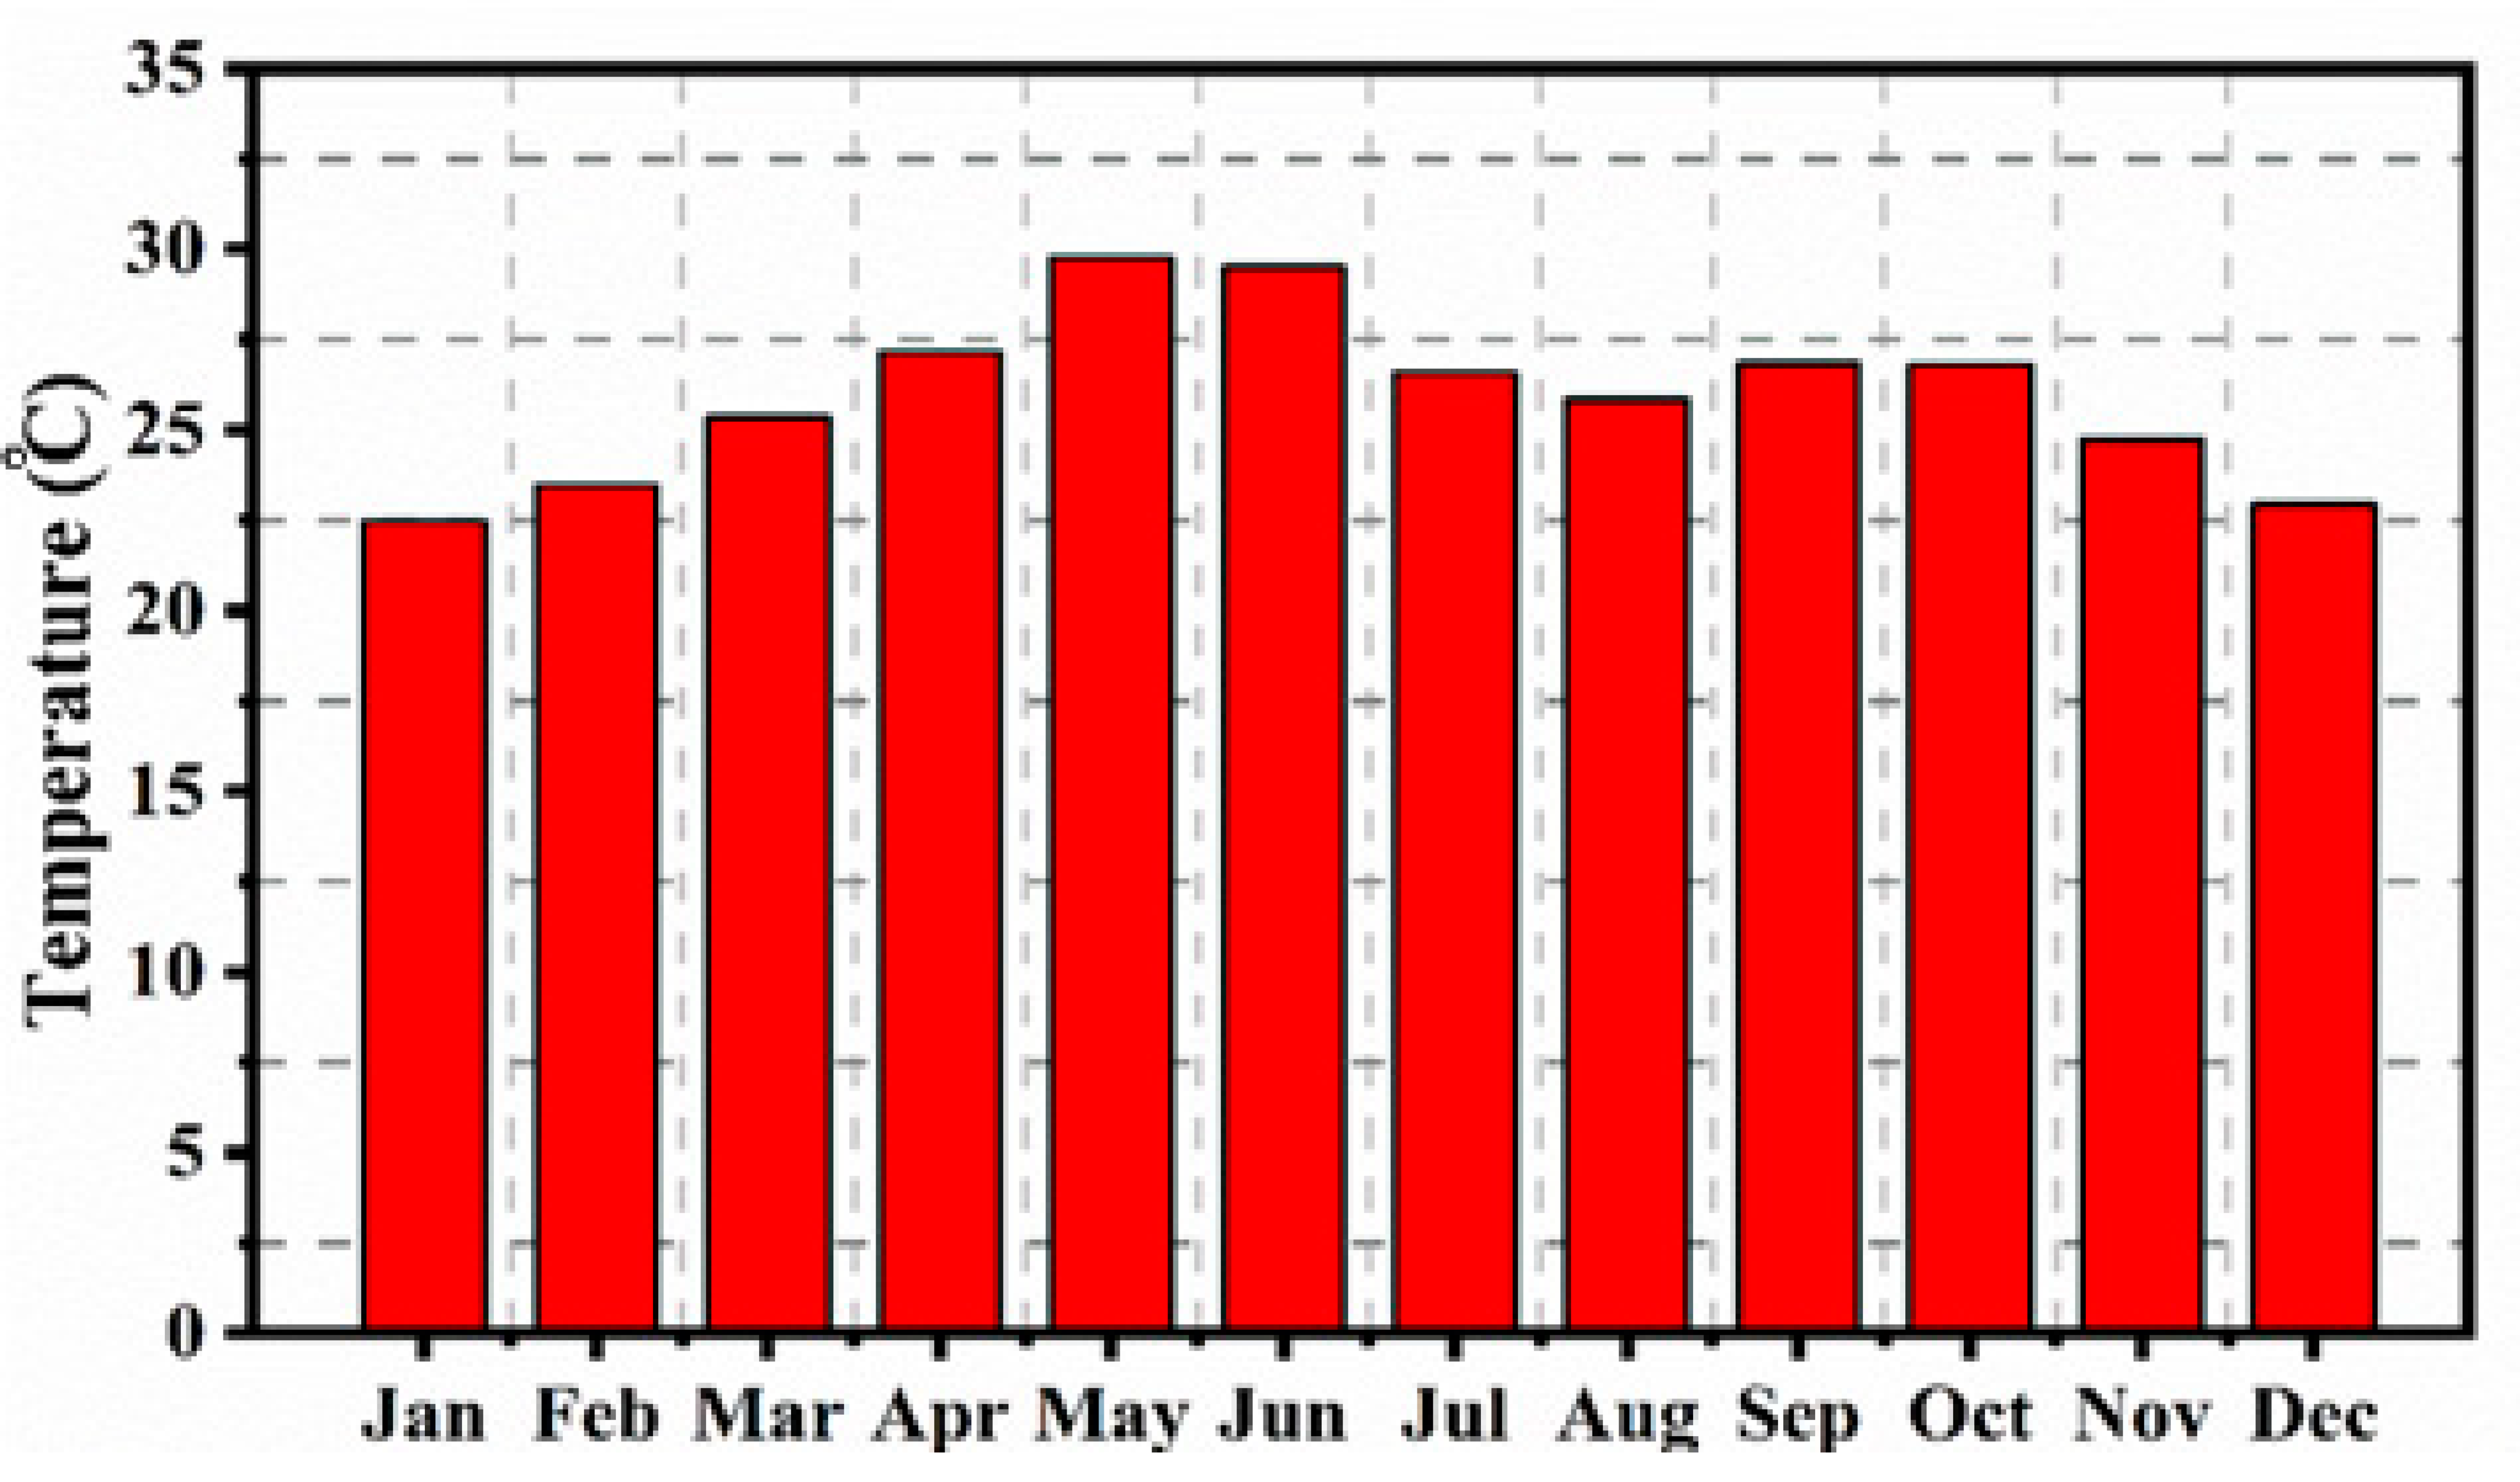
5.2.2. Ambient Temperature
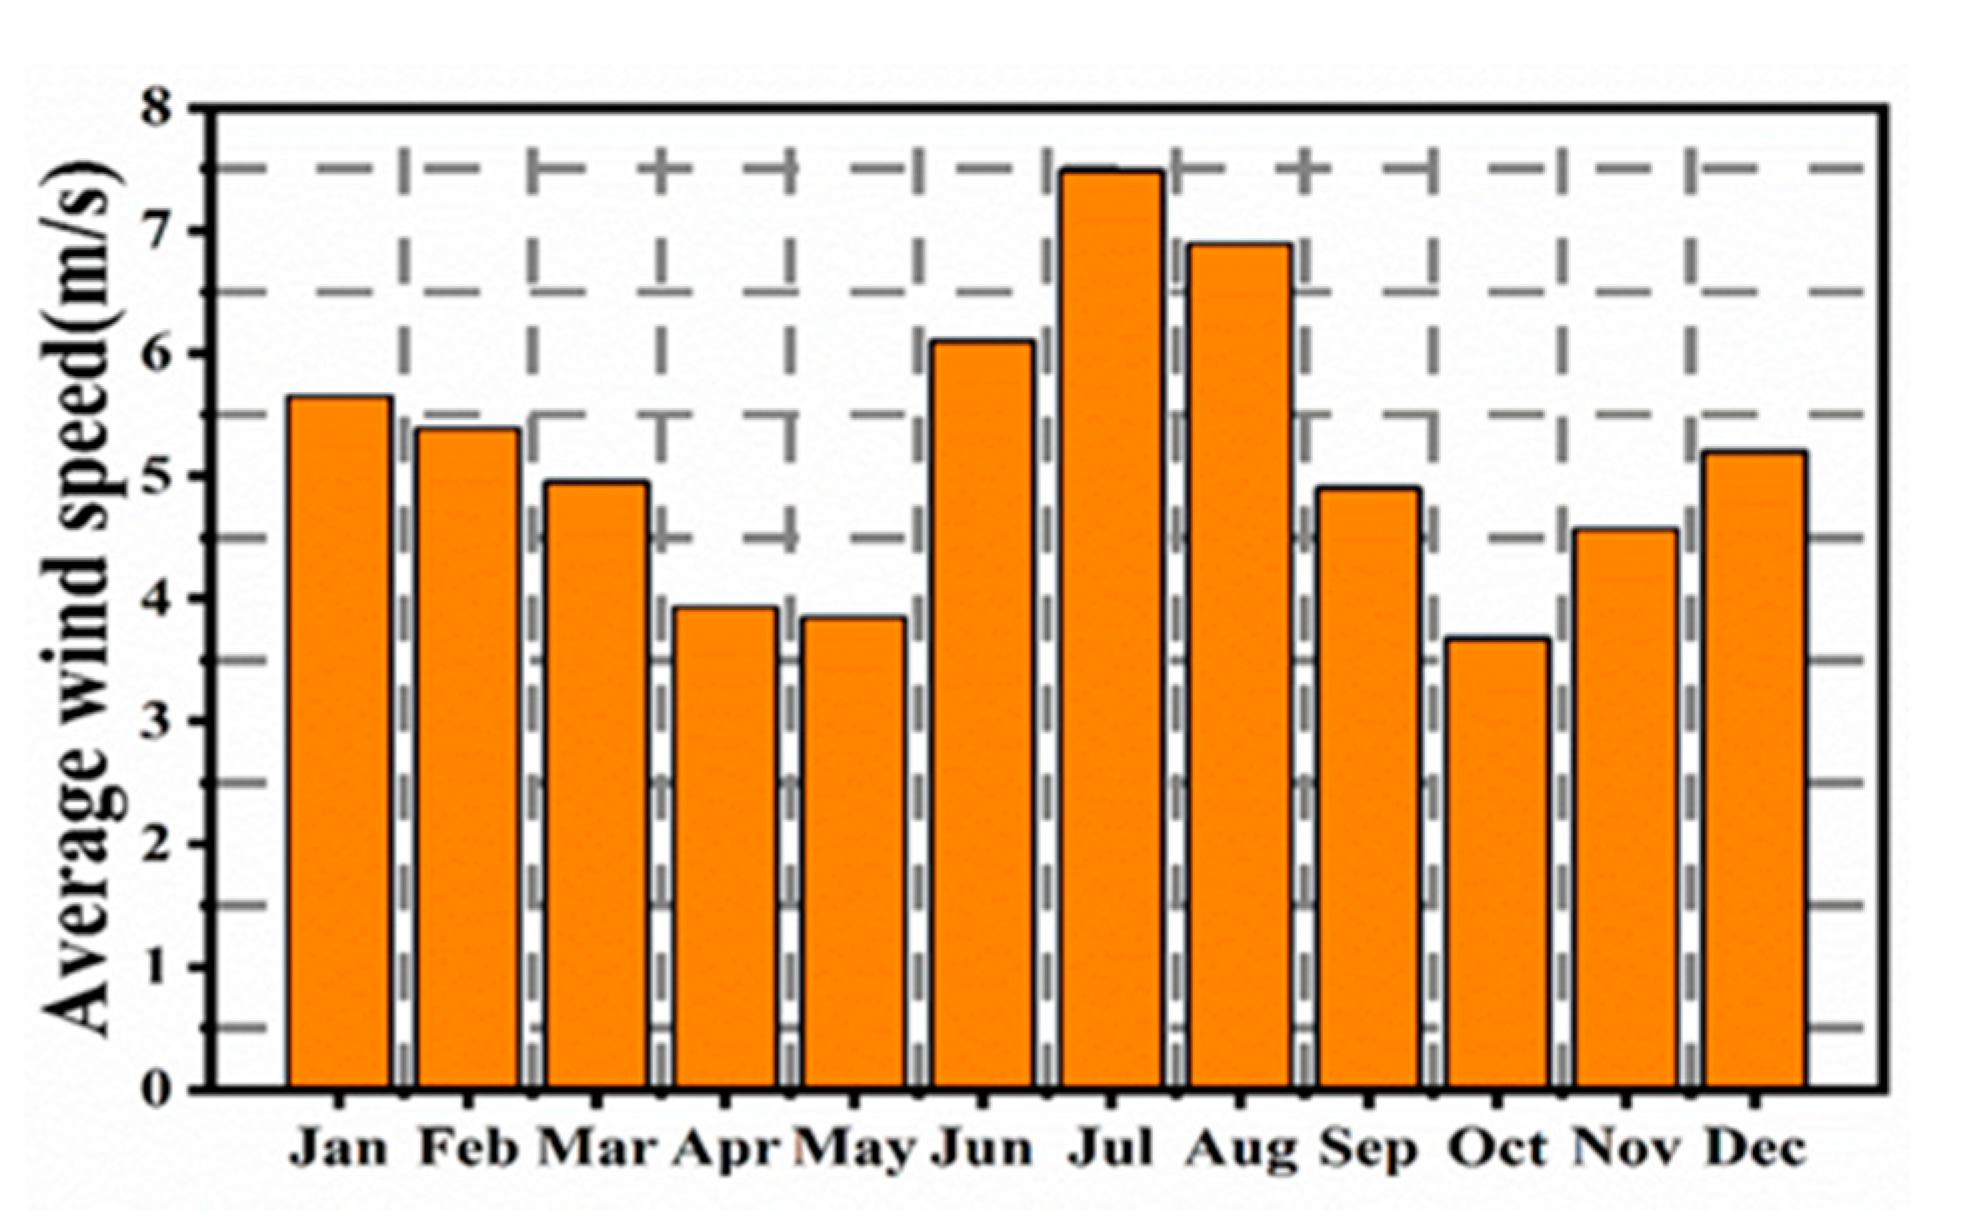
Except for the solar radiation, the ambient temperature is taken into account for PV inputs. It has an opposite influence on PV output characteristics. For Taiz province, the ambient temperature displayed at Homer inputs resources is as shown in Figure 4. It is found that the annual average ambient temperature is 25.96 , the temperature of April, May, June, July, September, and October are higher than the annual average value. The highest value is 29.77 in May and the lowest value is 22.49 in January. Taiz province has an appropriate temperature for PV power plants. In the summer, it has not recorded a very high value, which can have a negative impact on PV output.

5.2.3. Wind Speed

For the Taiz province, the wind speed is estimated at 50 m elevation. The monthly average wind speed is illustrated in Figure 5. It is found that the annual average wind speed is 5.22 m/s and the wind speed is showed great potential in January, February, June, July, and August, which are higher than the annual average. The highest wind speed is 7.49 m/s in July and the lowest value is 3.85 m/s in May.

5.3. Load Energy Estimation

This study’s target is to electrify the Taiz province, which is the third main province in terms of population and occupies 12.15% population of Yemen. The population is estimated as 3,250,084 and about 19% live in urban and 81% in rural areas [94]. Studies show that 38% of the rural population in Yemen cluster in small communities in the mountains [49]. They can neither access the electricity grid nor obtain the provided electricity grid infrastructure at very high cost.
This study tries to rearrange the population of Taiz province into three categories, based on the ability to access the power grid. Urban people are classified in category (1), rural people who easily and at slightly increased cost access the power grid are classified in category (2), and rural people who cannot burden the high cost and have difficulty accessing the electricity grid are classified in category (3).
Furthermore, this study proposed three scenarios of energy strategies for electrifying different consumer categories. Scenario (1) is proposed to electrify consumers of the category (1) by energy strategy (2), and categories (2 and 3) by energy strategy (1). Scenario (2) is proposed to electrify consumers of the category (1) by energy strategy (3), category (2) by energy strategy (2) and category (3) by energy strategy (1). Scenario (3) is proposed to electrify consumers in category (1) by energy strategy (3), and categories (2 and 3) by energy strategy (2), as shown in Figure 6. In the three scenarios, the required energy is 4130.85 MWh/day for scenario (1), 6834.85 MWh/day for scenario (2), and 7735.19 MWh/day for scenario (3). The profile of daily energy required for the three scenarios is shown in Figure 7.

5.4. Diesel Fuel Price

Diesel fuel is the lifeblood in Yemen. It is the source of electricity generation, agriculture activities, and industries. The diesel price was slight fluctuation from 2000 to 2010 with an average price of 0.155 dollars/L. Since 2010, Yemen began to have internal instability, which led to a war at the beginning of 2015. In this period, the diesel price has significant fluctuation with the average price of 0.54 dollars/L [97]. At present, the diesel price is 1.38 dollars/L [80].

5.5. Homer Software

Homer Pro is an energy modeling software developed by the national renewable energy laboratory in the U.S. It is developed for design hybrid renewable energy systems (HRES) combined with conventional generators, batteries, and hydrogen energy systems, for heating, electric power and hydrogen production. It contains powerful tools for the user for designing, simulation, optimization sizing, as well as sensitivity analysis of different combinations of energy systems [98].
Homer fundamentally optimizes hybrid energy systems through reliable and accurate optimization algorithms. This study simulates optimal configuration for one year, evaluates technical performances and economic costs through a lifetime of the system [99]. For performing optimization and simulation, it has to identify information of climate such as solar radiation, wind speed, ambient temperature, as well as technical specifications and cost of system components.
In the simulation process, Homer can run the model, evaluate the technical performances of different hybrid energy systems, and determine the technical feasibility and entire system cost during the lifecycle. During the simulation process of different hybrid energy systems, Homer can obtain the optimal configurations of systems, which also attains the technical systems constrains at the lowest total net costs. In the sensitivity analysis, Homer implements multiple optimizations under various values of different variables to see the output related to input change or abnormal condition in the model [100]. Homer has been used by many scholars around the world, carried out lots of studies of optimization and techno-economic analysis of renewable system [101,102], grid-connected system [83,103], and served multi types of load [99,104].

6. Result and Discussion

6.1. Discussing Result

This section discusses the technical and economic performances of each microgrid energy system configuration for different consumers’ categories under three scenarios of energy strategies. The technical and economic indexes, such as the potential of renewable power generation, percent of renewable energy fraction, fuel consumption, GHG mitigation, net present cost and cost of energy have been considered assessment. The microgrid energy system that achieved the lowest cost and advantageous technical performances are highlighted. The result is as follows.

6.1.1. Projected the Five Configurations of PV/Wind/Diesel Engine for Different Consumers’ Categories under Three Scenarios of Different Energy Strategies

For different configurations under the specified three scenarios of energy strategies, the economy is assessed based on net present cost (NPC), which is the summation of individual costs through the lifecycle of the system minus salvage cost that is the remaining cost at the end of the project lifecycle. As shown in Table 1, it is easy to notice that there is one majority cost among various individual costs that has a significant ratio of NPC for each energy system configuration under the different energy scenarios. The costs in the table are expressed in percentage rate as in Figure 8.
From Figure 8, it can be seen that the fuel cost of the energy system in Case I occupies approximately 98% of NPC for the three scenarios of the energy strategies, due to this kind of energy system consumes diesel fuel every single time of system operation. While the initial capital cost of the energy system in Case II is constituted of a majority cost around 58–59% of NPC, due to this kind of system it requires a lot of expenses at the beginning of investment, represented by the PV section. On the other hand, for the energy system in Case III, the replacement cost is dominated by a large part of NPC with approximately 43–45% in the energy scenarios (1, 3) due to the lifecycle of all components of the energy system being less than the project lifetime. For the same energy system, there is no big difference in fuel cost. Concerning the other two energy systems in case IV and case V, the initial capital cost occupied large a part of NPC with around 59–60%, 66–70%, respectively. This is due the PV component being included in these configurations and which has a one-time only cost during the project lifecycle.
In this context, the NPC is considered an index for the economic assessment of three energy scenarios. As shown in Table 1, it can be noticed that the NPC of all hybrid microgrid energy system in scenario (1) of energy strategies are the lowest cost. The scenario (2) is coming next, and scenario (3) is the highest. Taking the NPC in all hybrid microgrid energy systems in scenario (1) as a reference, the percent of reduction compared to the other two scenarios are illustrated in Figure 9. From the figure, it can be seen that for the energy system in case I, the NPC in scenario (1) reduces 36.6%, 44.12% compared with scenarios (2) and (3), respectively. Regarding hybrid energy systems in other cases, the NPC reduced approximately 38.29–38.72% and 45.16–45.40% compared to scenarios (2) and (3), respectively. It is worthy to say that scenario (1) of the energy strategy is economically feasible and can be considered as an urgent solution to attain the energy demand in urban areas, rural consumers are categorized in the region too. According to the above discussion, this study highlights energy scenario (1) as the best scenario that can achieve the lowest investment cost, the best technical performances, and economic competitiveness for all microgrid energy systems under this scenario.

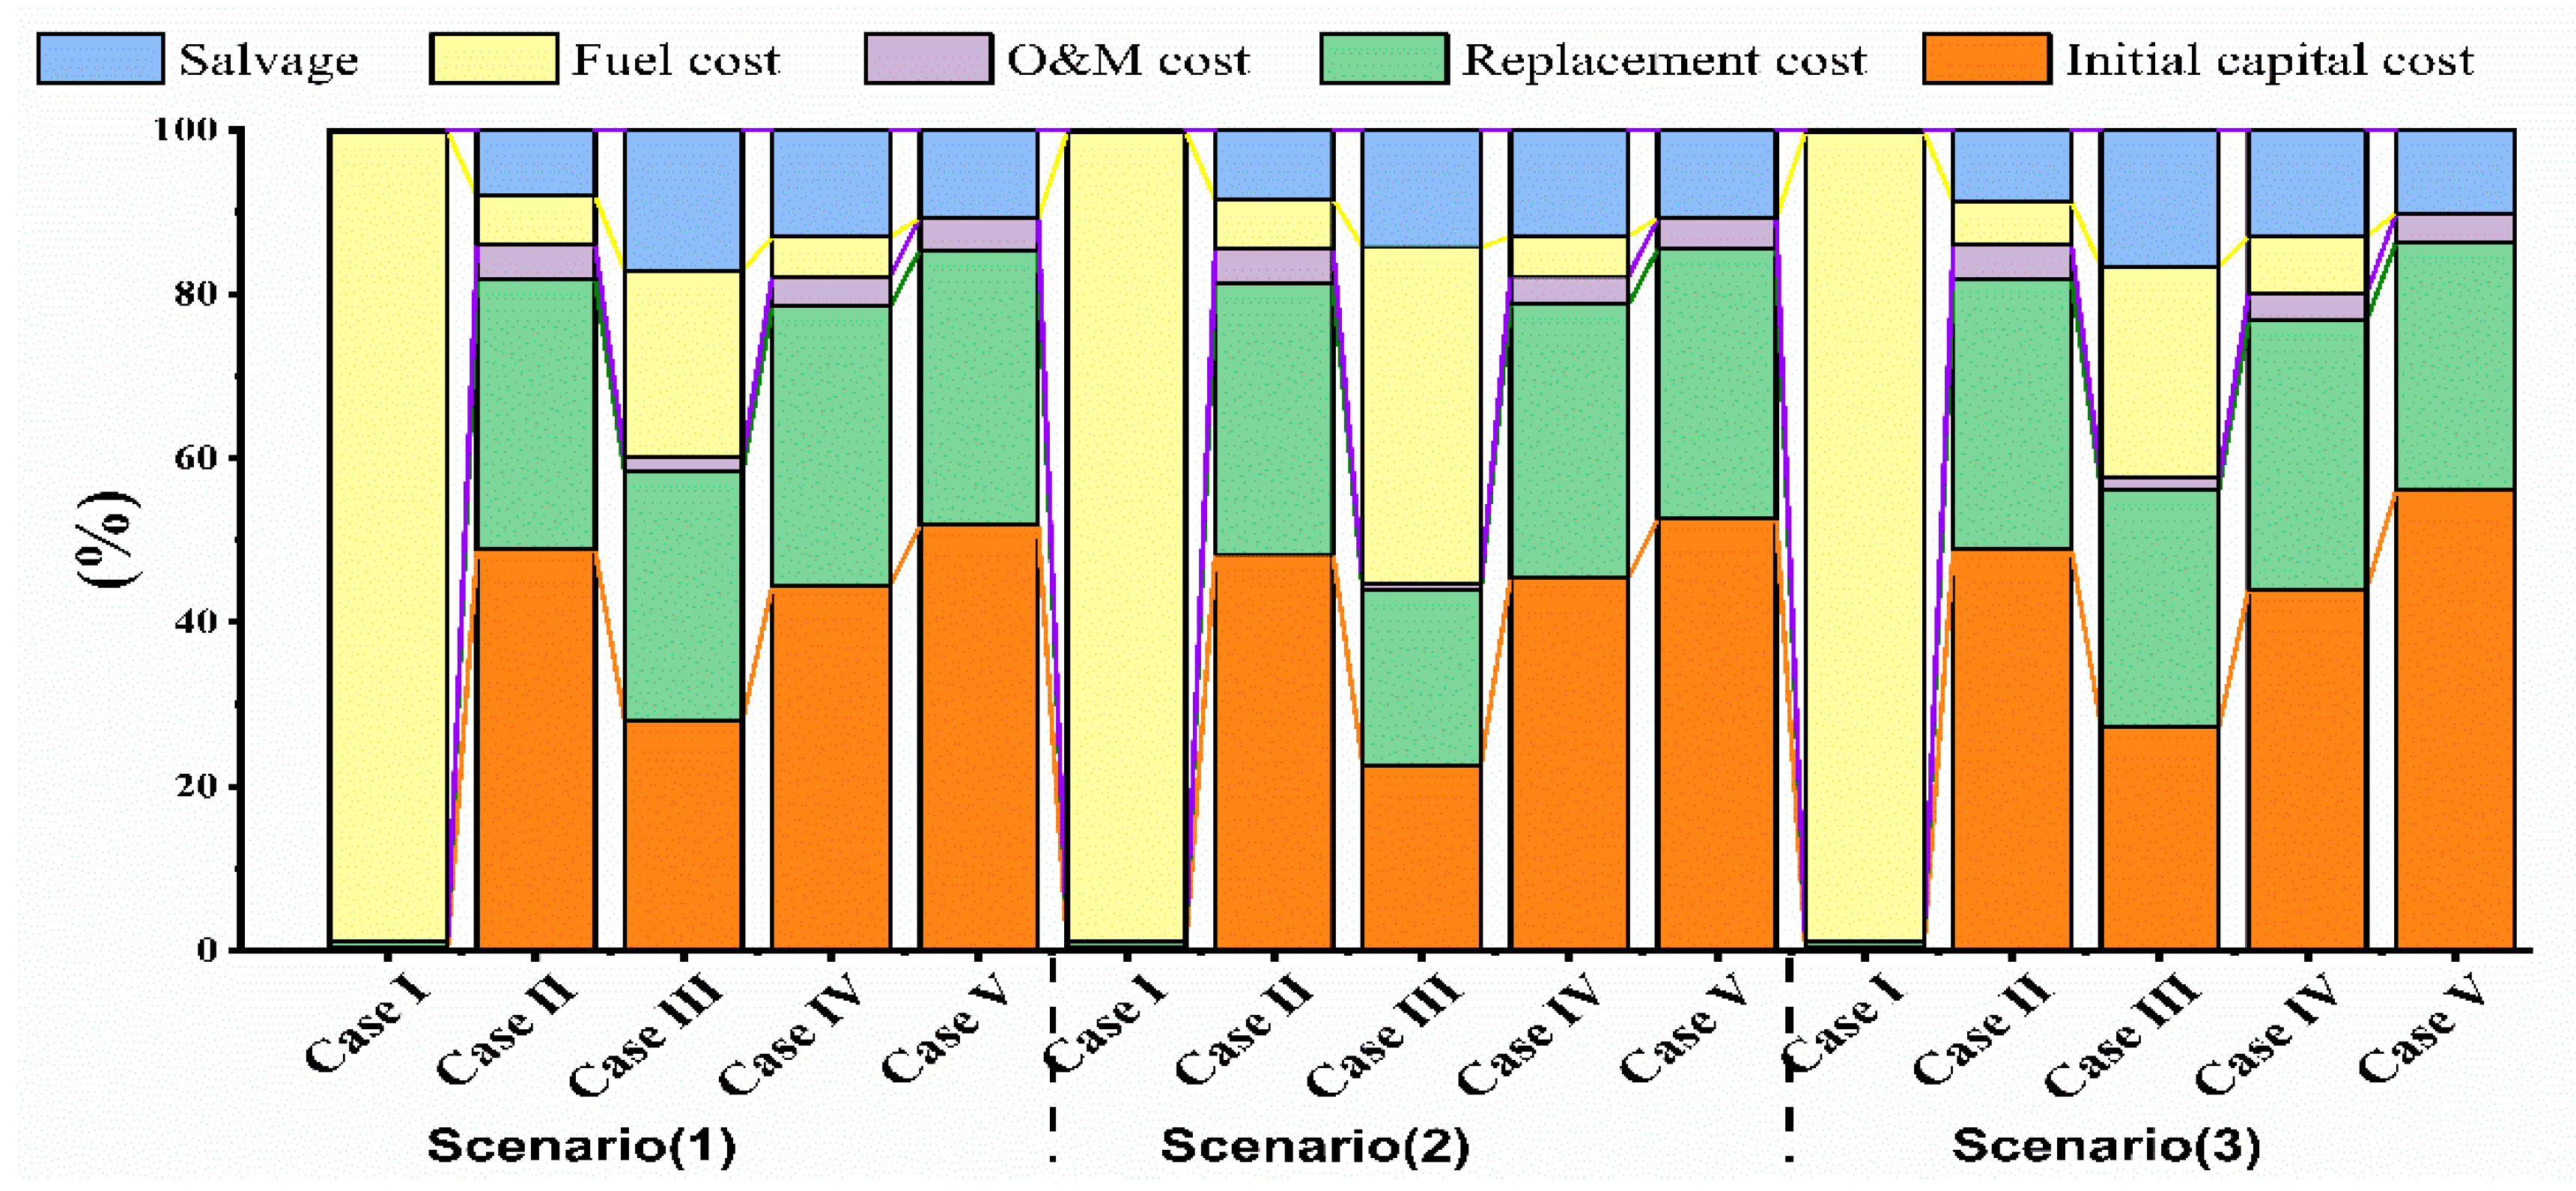
6.1.2. Comparative Analysis of Technical and Economic Feasibility for the Designed Systems in All Cases under Scenario (1) of Different Energy Strategies

The optimal technical performances and economic indexes of the five microgrid systems are discussed in this section. Among the five microgrids, Case I is selected as the comparative reference. Case I generates 100% power based on fossil fuel, as presented in Table 2. It can additionally be seen from Table 2 that Case II generates 97.5% renewable energy by PV and 2.5% energy by fossil fuel DE. While Case III generates 91.8% renewable energy by wind turbines and 8.2% energy by fossil fuel. Case IV produces 98.3% renewable energy by PV and WT, which 57.5% is from PV and 40.8% is from WT, the other 1.71% is provided by fossil fuel. Case V has 100% renewable energy, of which 79.9% is from PV and 20.1% is from WT.
In terms of renewable energy fraction, the energy system in Case I does not include renewable energy sources at all, so all the energy is generated by fossil fuel. While Case II includes PV power and the renewable fraction is 96.1%, which reduces 96.72% fuel consumption and CO2 emission. Replacing the PV power system by WT in Case III, the renewable energy fraction is 78.6%, which reduces 82.13% fuel consumption and CO2 emission. It is worth concluding that PV is more potential than wind to supply the load, due to abundant solar and limited wind in the area of study. On the other hand, Case IV includes both PV and wind power, the renewable fraction is 97.1%, which reduces 97.44% fuel consumption and CO2 emission. In Case V, conventional fossil fuel power system is excluded and PV and wind power system are included, which reduces 100% fuel consumption and CO2 emission. From the discussion above, taking a system in Case I as the reference, it can be summarized that for the highest renewable energy fraction, the fuel consumption and CO2 emission are the lowest. The system in Case V is ranked the first, the systems in Case IV follows, then Case II, and Case III is ranked at final.
The optimal economic indexes for all designed cases show that the system in Case IV offers the lowest NPC, 61.95% COE reduction compared with Case I. The system in Case V is the second highest with a 54.82% reduction. The lowest reduction of NPC and COE is in Case III with 49.04%, and Case II is 53.42% reduction. This is due to that solar energy is rich and wind energy is poor in the area of study. For future investment, the PV system can be considered as an alternative promising of electricity generation specifically in Taiz province, and generally in Yemen.
According to the comparative analysis of technical and economic aspects of all the designed cases, it is worth noticing that the system in Case V achieves the best technical performances. Case IV achieves the best economic properties. However, it demonstrates relatively poor technical performance. The system in Case IV is selected as the best hybrid microgrid system, which achieves the lowest economic cost and acceptable technical performances that can effectively help the government so Yemen to achieve its commitment to the Paris agreement on climate change and Kyoto protocol.

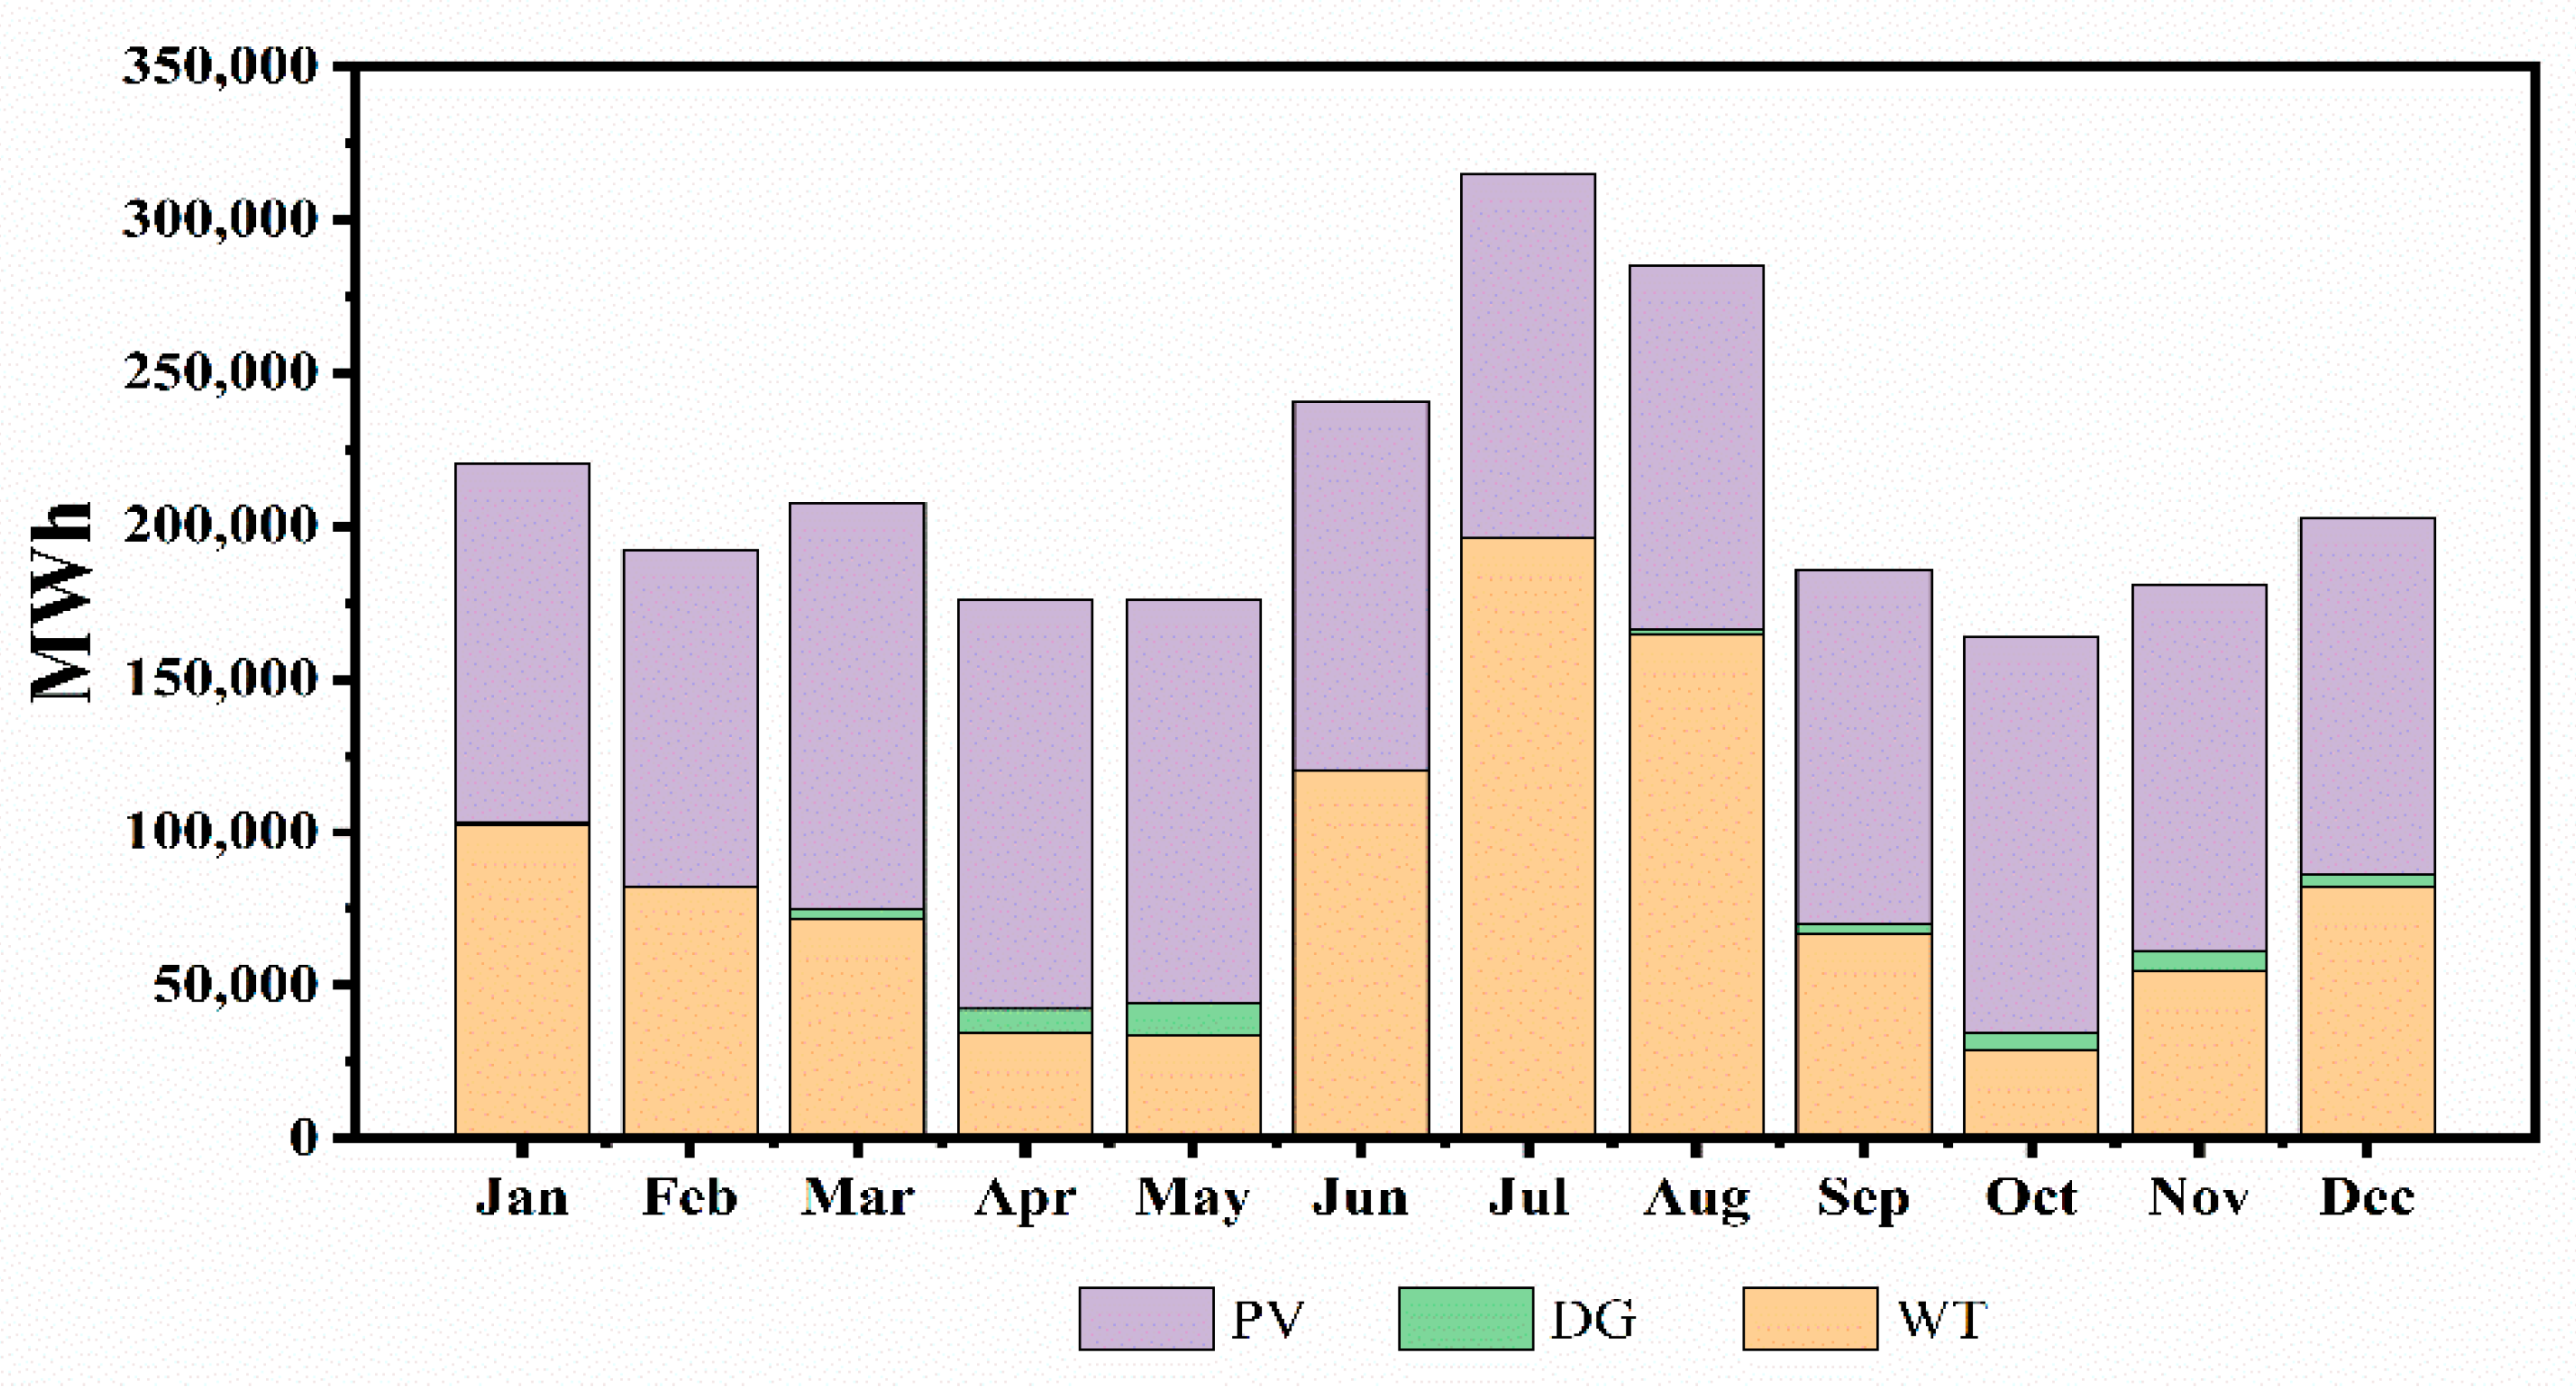
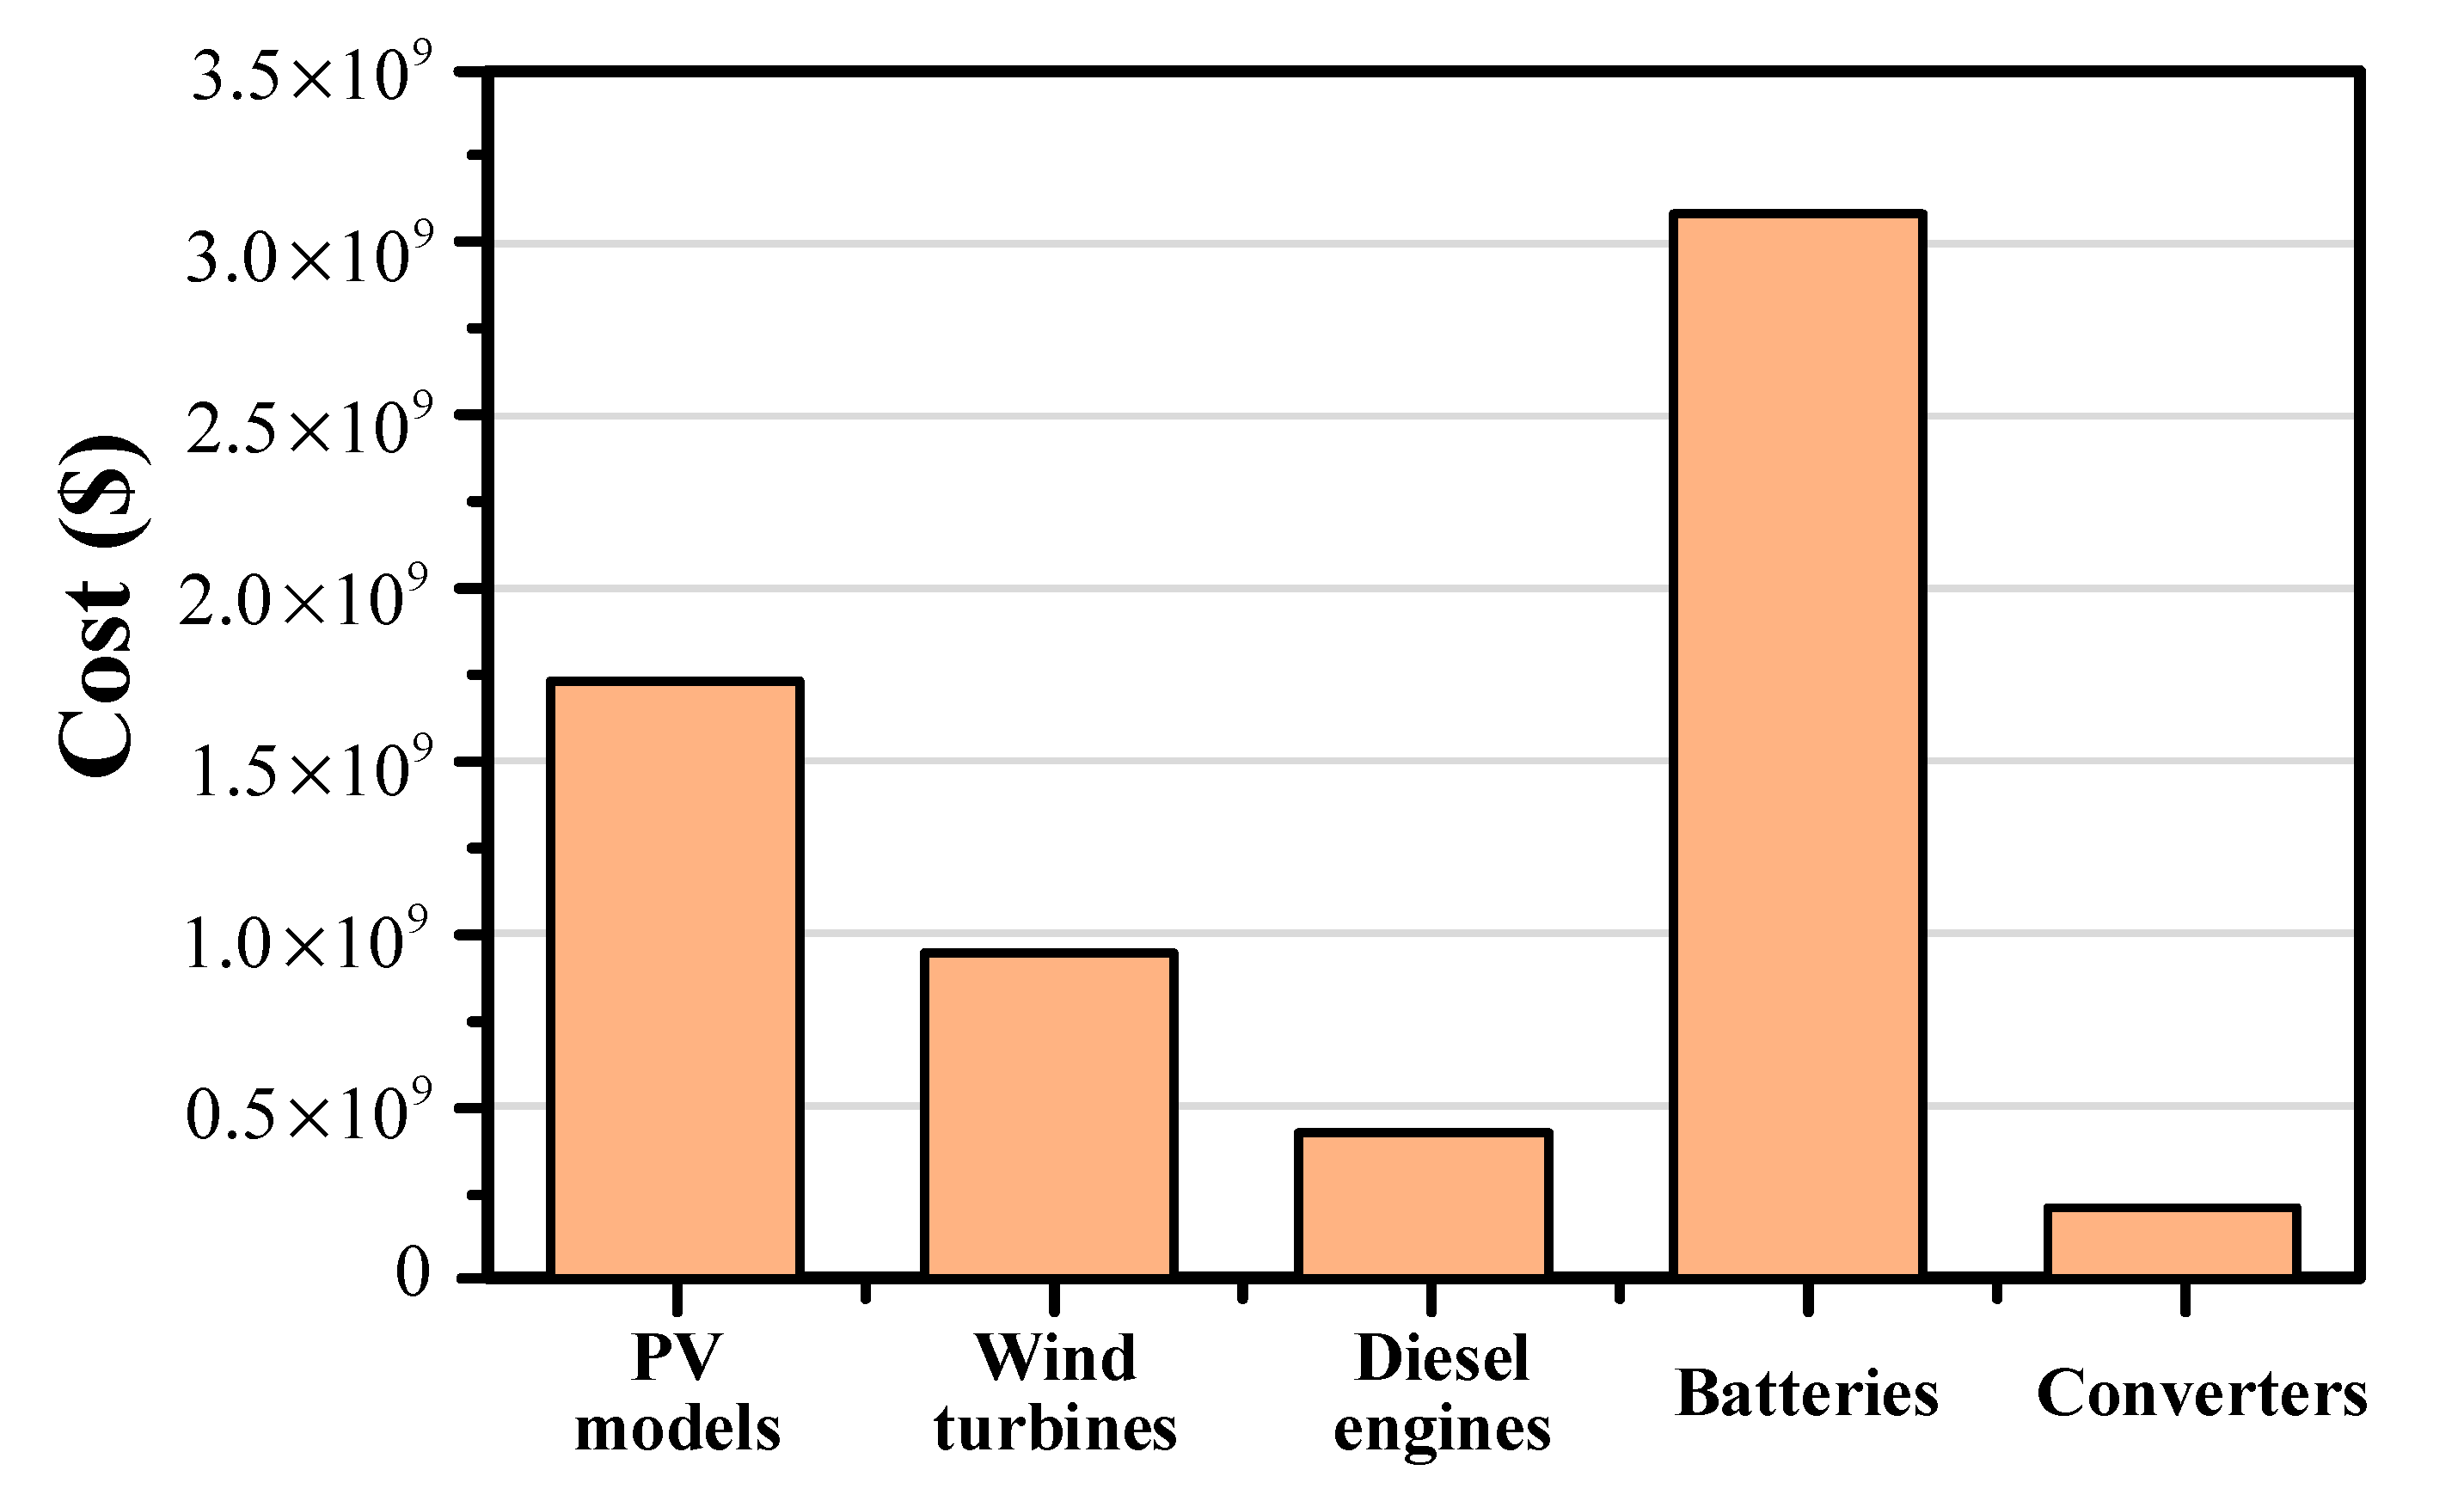
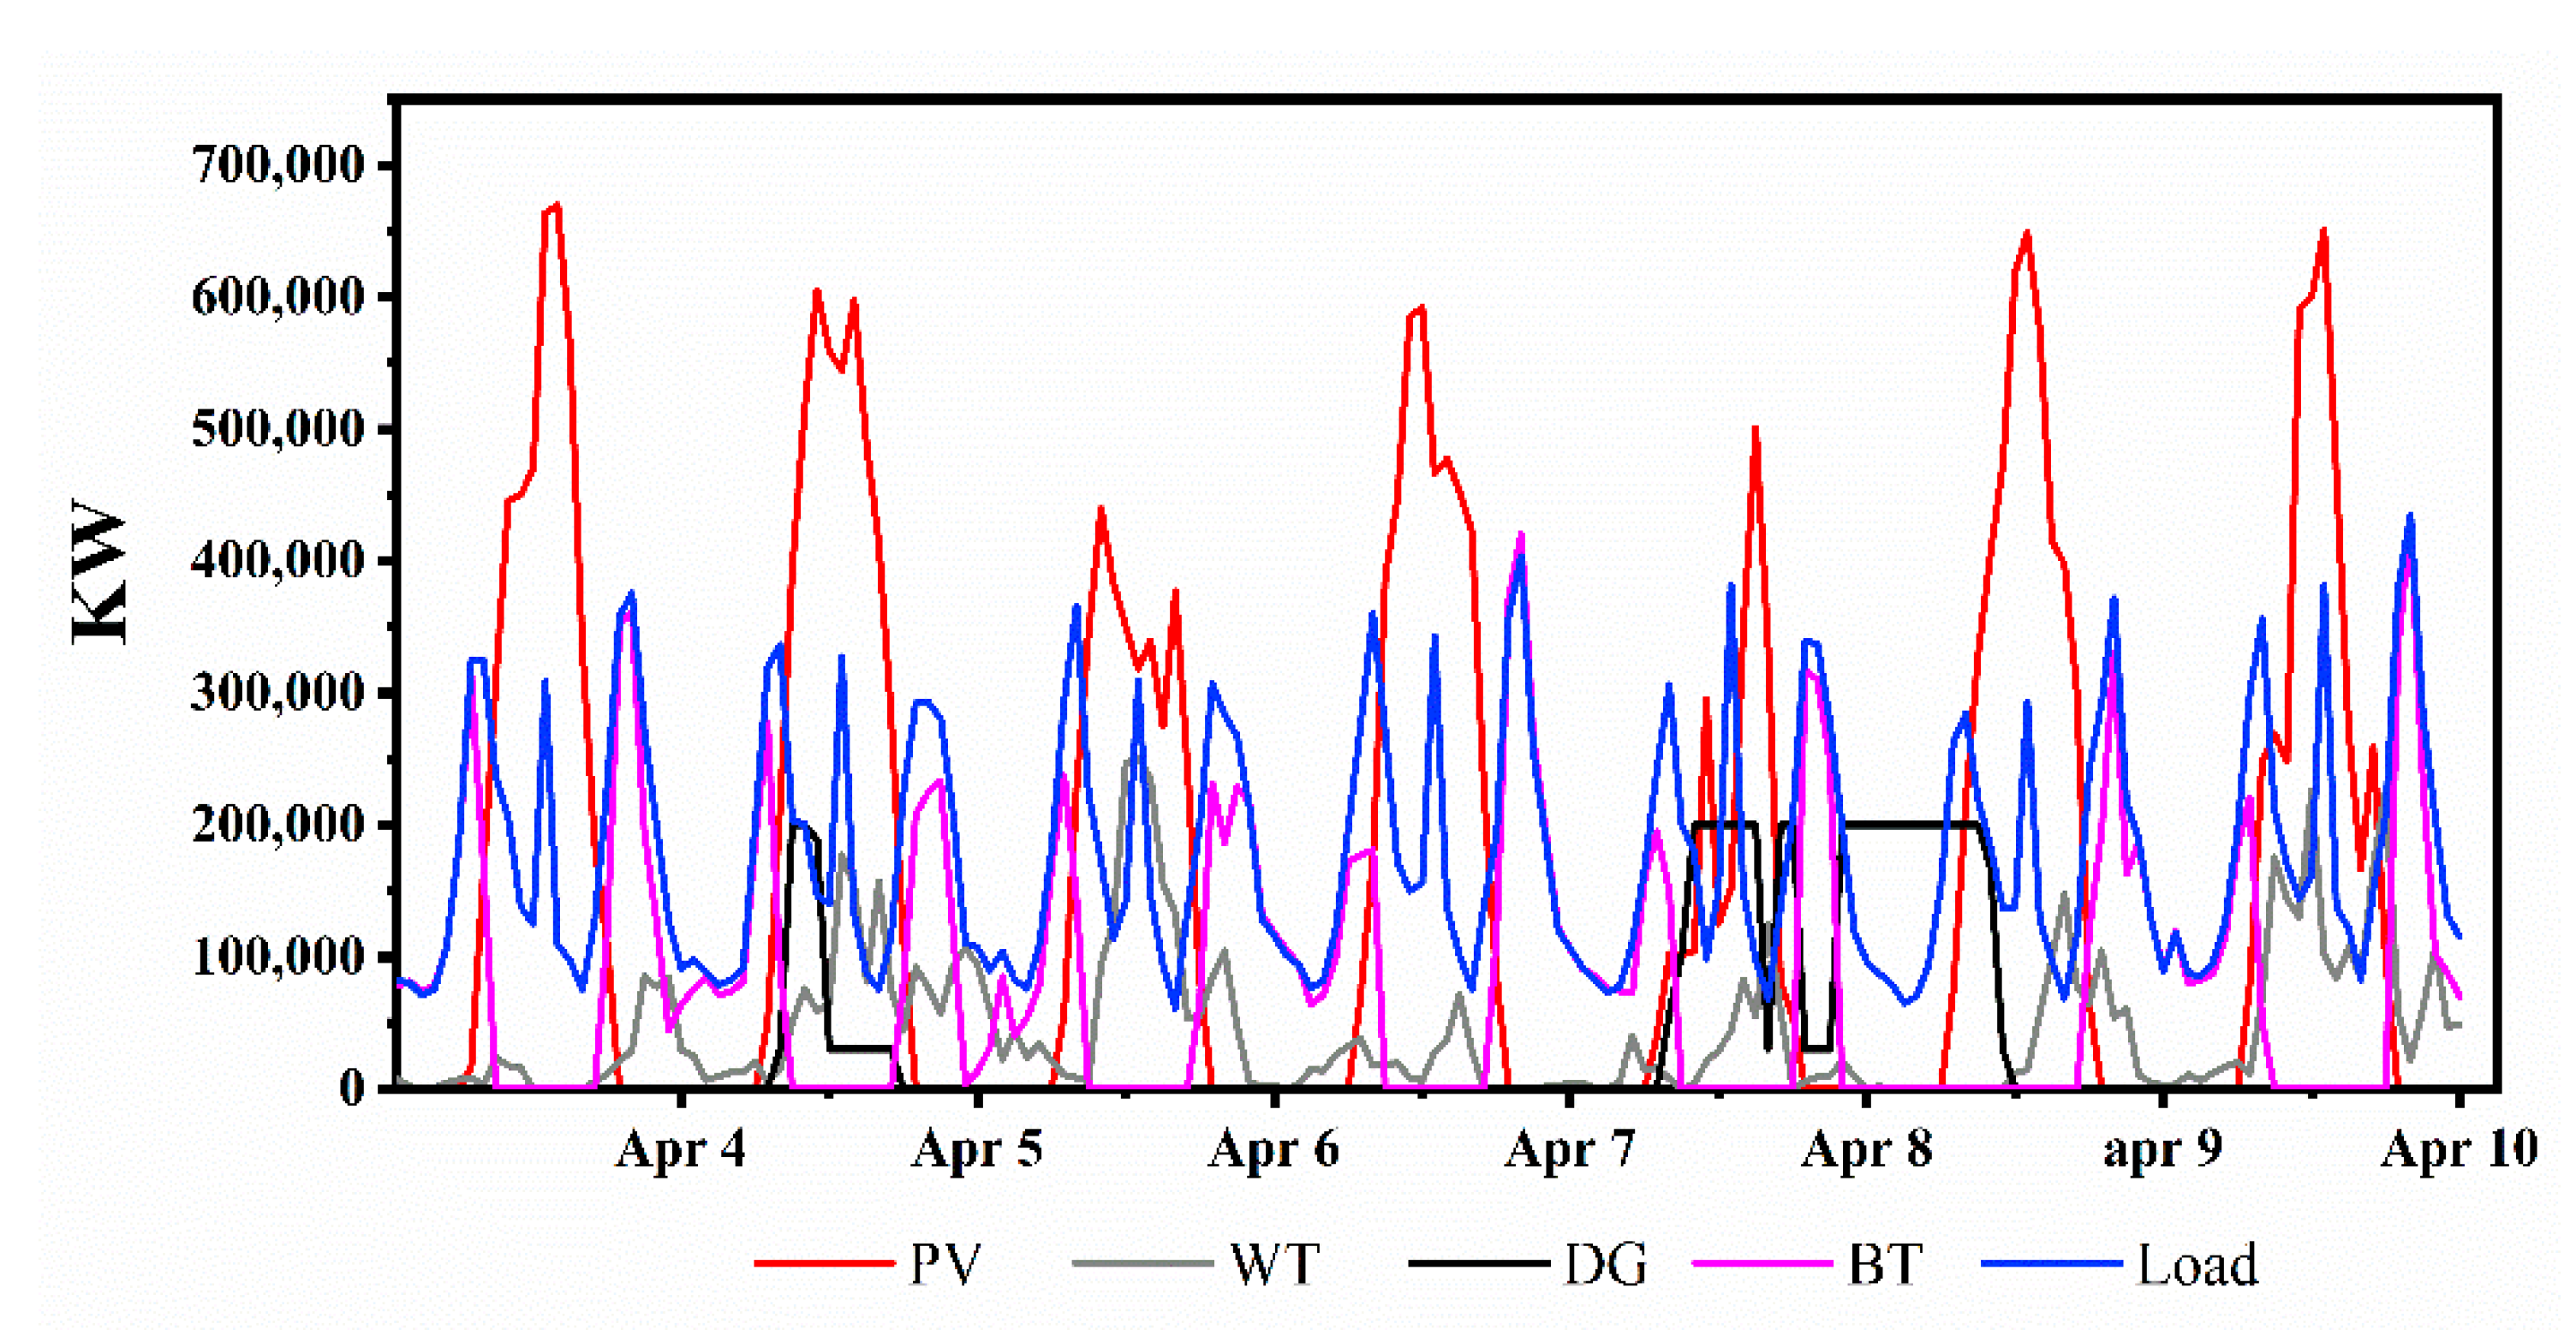
6.1.3. The Operation Status of the Best-Selected Optimal Energy System in Case IV under Scenario (1) of Different Energy Strategies

For scenario (1), the energy system in Case IV is selected as the best energy system, which achieves the competitive economic indexes and acceptable technical performances. For the energy system in Case IV, further technical and economic details are discussed and operation status is demonstrated in this section.
The optimal configuration is as follows. The PV generation is 793,931 kW, the wind power generation is 795,000 kW (265 turbines), the diesel engine is 200,000 kW, the battery energy storage is 1,020,540 kW distributed in 255,135 strings, and converter power is 535,152 kW, as shown in Table 3. The PV, WT, and DE are the main power sources that complement each other. The monthly produced energy is illustrated in Figure 10. The annual energy produced by the system is 2,545,226.007 MWh, of which 1,463,783.467 MWh is generated by PV models, 1,037,909.813 MWh is generated by wind turbines, 43,532.729 MWh is generated by diesel engines. The annual net production of batteries is 575,390.9 MWh, as shown in Table 3. The system is effective to supply power to the large-scale load (1,507,685.642 MWh/year), while it has 0.0049% unmet load, 0.092% capacity shortage and 33.6% excess energy.
The economic aspect is discussed above, in which the NPC of the entire system is 6.39B (dollars) and COE is 0.175 dollars/kWh. The entire system cost is the individual cost of each component in the system lifecycle, as shown in Figure 11. From the figure, it is noticeable that the storage batteries occupied the highest cost of the entire system cost. This is due to renewable energy having great potential, and a huge amount of renewable energy is needed to be stored so that the scale of storage capacity increases and the batteries need to be replaced early. The rest of the system cost is distributed among other components, where the PV system occupies the second highest cost, followed by wind turbines, diesel engines and power converters.
Homer software can show hourly data of one year for any system simulation. For a better perspective, we just show samples of seven random days from April 4 to April 10, as shown in Figure 12. From the Figure, it can be noticed that the load is preferentially fed by batteries when solar energy is not available at night and wind power was not sufficient. However, on the cloudy day when the PV generates less and wind power was not sufficient, the load and batteries are supplied by diesel engines, as happened on April 8 and early next day.

6.2. Sensitivity Analysis of Optimal the Best-Selected Microgrid Energy Systems under the Best Scenario of Energy Strategy

The sensitivity analysis is helpful to assess the abnormal situation of the system, understand the riskiness and the relationship between output and input. For the best selected optimal system in Case IV under scenario (1) of the energy strategy, the sensitivity analysis is investigated based on a prospective variation of unstable variables. The system outcomes are checked based on the prospective change of load scale, real interest rate and fuel price.
The literature predicts a 2.74% population growth rate in Taiz Province [94]. Accordingly, the prospective population growth is estimated for the upcoming ten years up to 2030. It has been discussed previously, under scenario (1) of energy strategy, that the population in the rural area are supplied by energy strategy (1), and the population in the urban area are supplied by strategy (2), taking into account 7% immigration rate from rural to urban [105]. It means some people will leave energy strategy (1) and register in energy strategy (2) which will supply 2 kWh/day/capita. Considering these issues, the prospective total energy consumption is estimated for the upcoming ten years. As shown in Table 4, it can be seen the influence of an increase in total energy consumption on the NPC and COE. The NPC rises gradually with the increase of the load, and this is due to the expansion of system capacity to meet increased demand energy led to expenditure more investment. Whereas, the COE stays constant for all years, and this is due to the increase in system capacity that led to a rise in energy production.
The finance system in Yemen is not stable due to the conflict. The variation of the real interest rate is selected to check the system outcomes. When the actual real interest rate is 0.24%, the result shows that the NPC and COE were 6.39 billion dollars and 0.175 dollars/kWh, respectively. As shown in Table 5, when the real interest rate increases by 5%, the NPC decreases and the COE rises. On the other hand, when the real interest rate decreases by 5%, the NPC increases and the COE declines.
Furthermore, the diesel fuel price is also selected as one of the sensitivity variables to examine its influence on the economic indexes. As shown in Table 6, when the actual diesel price is 1.38 dollars/L, the NPC and COE are 6.39 (billion dollars) and 0.175 dollars/kWh, respectively. When the price increases 50% to 2.07 dollars/L, the NPC and COE accordingly increase. When fuel price decreases 50% to 0.69 dollars/L, the NPC and COE accordingly decline. From the above discussion, it can be deduced that the system demonstrates normal behavior to the sensitive input variables and the outcomes.

7. Conclusions

The study is developed to design different configurations of hybrid energy systems including PV, WT, diesel engine for supply power to various consumer categories in Taiz province, Yemen under three scenarios of energy strategies. The purpose of this study is to look for the best scenario to achieve the lowest investment cost. The following conclusions can be obtained from this paper.
(1) The scenario (1) of the energy strategies is economically feasible and is the best choice for urgently restoring electricity services to diverse consumer categories in Taiz province, Yemen, and scenario 2 and 3 can be considered in the future for economic development.
(2) In terms of technical performances of the designed systems, in all cases scenario (1) is the best of energy strategies. For renewable energy generation, the unique PV system in Case II shows more potential than the unique WT source in Case III.
(3) From the technical aspect, compared with Case I, the energy system in Case V with zero fuel consumption and CO2 emission is a superior energy system.
(4) In terms of the economic aspect, the energy system in Case IV is the best economical system, which its NPC and COE reduce 61.95%.
(5) Case IV is most economically feasible and has advantageous technical performances with 97.44% CO2 reduction. Therefore, the study recommends it as the best choice for Yemen’s investment.
For future work, we will investigate deeply the real situation of the application of renewable energy, the consumers’ ability to access the power grid, and the policy of the electricity sector or government. Furthermore, we will continue to study the techno-economic feasibility of the hybrid energy systems in a more accurate way and take more factors into account. We hope our study can be used in the real application and will study the techno-economic feasibility of the proposed method that extends to all provinces in Yemen.

Author Contributions

Conceptualization, S.M. and D.Z.; methodology, S.M., D.Z. and J.L.; software, S.M., D.Z. and J.L.; validation, S.M., D.Z., J.L. and Y.C.; formal analysis, L.W. and S.A.Z.; investigation, L.W. and S.A.Z.; resources, Y.Z. and M.L.; data curation, R.Y. and J.W.; writing—original draft preparation, S.M., D.Z. and J.L.; writing—review and editing, S.M., D.Z., J.L., Y.C., L.W., S.A.Z., R.Y., J.W., Y.Z. and M.L.; visualization, J.L. and Y.C.; supervision, Y.Z. and M.L.; project administration, Y.Z. and M.L.; funding acquisition, Y.Z. and M.L. All authors have read and agreed to the published version of the manuscript.

Funding

This work is supported partially by National Natural Science Foundation of China (Grant nos. 71974055). This work is supported partially by Natural Science Foundation of Beijing Municipality (L172036), National Natural Science Foundation of China (Grant nos. 51772096), Science and Technology Project of SGCC(SGJX0000KXJS1900321), Beijing Science and Technology Project (Z181100005118002), Joint Funds of the Equipment Pre-Research and Ministry of Education(6141A020225), Par-Eu Scholars Program, Science and Technology Beijing 100 Leading Talent Training Project, the Fundamental Research Funds for the Central Universities (2017ZZD02) and the NCEPU “Double First-Class” Program.

Data Availability Statement

The data presented in this study are available on request from the corresponding author. The data are not publicly available due to the project is not completed.

Conflicts of Interest

The authors declare no conflict of interest.

Notations

P P V The PV array output power in [kW]
γ P V The PV array capacity in [kW]
f P V The derating factor in [%]
G T , S T C The standard solar irradiation [1 kW⁄m2]
P The temperature effect on the power [%/ ]
T C The nominal cell temperature in the current time step [ ]
T C , S T C The standard cell temperature
C A N N , T O T The annualized total system costs
i The annual real interest rate (the discount rate)
N The numbers of system lifecycle years
C R F ( i , N ) The recovery factor
i o The nominal interest rate in [%]
f The annual inflation rate in [%]
E l o a d   s e r v e d   The actual load served by the energy system per year

References

  1. Statistical Review of World Energy. Available online: https://www.bp.com/en/global/corporate/energy-economics/statistical-review-of-world-energy.html (accessed on 26 December 2020).
  2. REN21. Why Is Renewable Energy Important. Available online: https://www.ren21.net/why-is-renewable-energy-important/#:~:text=Thecombustionoffossilfuels,noorlowairpollutants (accessed on 26 December 2020).
  3. Gielen, D.; Boshell, F.; Saygin, D.; Bazilian, M.D.; Wagner, N.; Gorini, R. The role of renewable energy in the global energy transformation. Energy Strateg. Rev. 2019, 24, 38–50. [Google Scholar] [CrossRef]
  4. REN21. Renewables 2020 Global Status Report. 2020. Available online: https://www.ren21.net/wp-content/uploads/2019/05/gsr_2020_full_report_en.pdf (accessed on 26 December 2020).
  5. IEA. Renewable Capacity Growth Worldwide Stalled in 2018 after Two Decades of Strong Expansion. Available online: https://www.iea.org/news/renewable-capacity-growth-worldwide-stalled-in-2018-after-two-decades-of-strong-expansion (accessed on 26 December 2020).
  6. IRENA. Global Energy Transformation: A Roadmap to 2050. 2018. Available online: https://www.irena.org/publications/2018/Apr/Global-Energy-Transition-A-Roadmap-to-2050 (accessed on 26 December 2020).
  7. Climate Focus. The Paris Agreement Summary. Available online: https://climatefocus.com/sites/default/files/20151228COP21briefingFIN.pdf (accessed on 26 December 2020).
  8. Unitied Nations. Kyoto Protocol Reference Manual. 2008. Available online: https://unfccc.int/resource/docs/publications/08_unfccc_kp_ref_manual.pdf (accessed on 26 December 2020).
  9. European Union. Subject: Information on the Quantified Emission Limitation or Reduction Objectives (QELROs) for the Second Commitment Period under the Kyoto Protocol. 2012. Available online: https://unfccc.int/files/meetings/ad_hoc_working_groups/kp/application/pdf/awgkp_eu_19042012.pdf (accessed on 26 December 2020).
  10. UNEP. Financing Renewable Energy in Developing Countries. 2012. Available online: https://www.unepfi.org/fileadmin/documents/Financing_Renewable_Energy_in_subSaharan_Africa_02.pdf (accessed on 26 December 2020).
  11. National Development and Reform Commission (NDRC) People’s Republic of China. 2005; Beijing Declaration on Renewable Energy for Sustainable Development. Available online: https://en.ndrc.gov.cn/newsrelease_8232/200511/t20051109_1193869.html (accessed on 26 December 2020).
  12. UNHCR. UNHCR Launches Sustainable Energy Strategy, Strengthens Climate Action. 2019. Available online: https://www.unhcr.org/en-us/news/press/2019/10/5db156d64/unhcr-launches-sustainable-energy-strategy-strengthens-climate-action.html (accessed on 26 December 2020).
  13. ESMAP. Sustainable Energy for All (Se4all). Available online: https://www.esmap.org/node/55539 (accessed on 26 December 2020).
  14. Belt and Road Portal. Guidance on Promoting Green Belt and Road. 2020. Available online: https://eng.yidaiyilu.gov.cn/zchj/qwfb/12479.htm (accessed on 26 December 2020).
  15. Mandal, S.; Das, B.K.; Hoque, N. Optimum sizing of a stand-alone hybrid energy system for rural electrification in Bangladesh. J. Clean. Prod. 2018, 200, 12–27. [Google Scholar] [CrossRef]
  16. Mekonnen, Y.; Sarwat, A.I. Renewable energy supported microgrid in rural electrification of Sub-Saharan Africa. In Proceedings of the IEEE PES-IAS PowerAfrica Conference Harnessing Energy, Information and Communication Technolology for Affordable Electrification of Africa, PowerAfrica, Accra, Ghana, Africa, 27–30 June 2017; pp. 595–599. [Google Scholar]
  17. Surroop, D.; Raghoo, P. Renewable energy to improve energy situation in African island states. Renew. Sustain. Energy Rev. 2018, 88, 176–183. [Google Scholar] [CrossRef]
  18. Weir, T. Renewable energy in the Pacific Islands: Its role and status. Renew. Sustain. Energy Rev. 2018, 94, 762–771. [Google Scholar] [CrossRef]
  19. Khan, M.J.; Yadav, A.K.; Mathew, L. Techno economic feasibility analysis of different combinations of PV-Wind-Diesel-Battery hybrid system for telecommunication applications in different cities of Punjab, India. Renew. Sustain. Energy Rev. 2017, 76, 577–607. [Google Scholar] [CrossRef]
  20. Padrón, I.; Avila, D.; Marichal, G.N.; Rodríguez, J.A. Assessment of Hybrid Renewable Energy Systems to supplied energy to Autonomous Desalination Systems in two islands of the Canary Archipelago. Renew. Sustain. Energy Rev. 2019, 101, 221–230. [Google Scholar] [CrossRef]
  21. Kelly, C.; Onat, N.C.; Tatari, O. Water and carbon footprint reduction potential of renewable energy in the United States: A policy analysis using system dynamics. J. Clean. Prod. 2019, 228, 910–926. [Google Scholar] [CrossRef]
  22. Zhang, D.; Wang, J.; Lin, Y.; Si, Y.; Yang, J.; Huang, B.; Li, W. Present situation and future prospect of renewable energy in China. Renew. Sustain. Energy Rev. 2017, 76, 865–871. [Google Scholar] [CrossRef]
  23. Fodhil, F.; Hamidat, A.; Nadjemi, O. Potential, optimization and sensitivity analysis of photovoltaic-diesel-battery hybrid energy system for rural electrification in Algeria. Energy 2019, 169, 613–624. [Google Scholar] [CrossRef]
  24. Singh, G.; Baredar, P.; Singh, A.; Kurup, D. Optimal sizing and location of PV, wind and battery storage for electrification to an island: A case study of Kavaratti, Lakshadweep. J. Energy Storage 2017, 12, 78–86. [Google Scholar] [CrossRef]
  25. Nugroho, H.; Fei-Lu, S.; Firmansyah. Developing renewable energy in developing countries: A lesson from Indonesia. Energy Sources Part B Econ. Plan. Policy 2017, 12, 318–325. [Google Scholar] [CrossRef]
  26. Islam, M.S.; Akhter, R.; Rahman, M.A. A thorough investigation on hybrid application of biomass gasifier and PV resources to meet energy needs for a northern rural off-grid region of Bangladesh: A potential solution to replicate in rural off-grid areas or not? Energy 2018, 145, 338–355. [Google Scholar] [CrossRef]
  27. Aguirre-Mendoza, M.; Díaz-Mendoza, C.; Pasqualino, J. Renewable energy potential analysis in non-interconnected islands. Case study: Isla Grande, Corales del Rosario Archipelago, Colombia. Ecol. Eng. 2019, 130, 252–262. [Google Scholar] [CrossRef]
  28. Kougias, I.; Szabó, S.; Nikitas, A.; Theodossiou, N. Sustainable energy modelling of non-interconnected Mediterranean islands. Renew. Energy 2019, 133, 930–940. [Google Scholar] [CrossRef]
  29. Ocon, J.D.; Bertheau, P. Energy transition from diesel-based to solar photovoltaics-battery-diesel hybrid system-based island grids in the Philippines—Techno-economic potential and policy implication on missionary electrification. J. Sustain. Dev. Energy Water Environ. Syst. 2019, 7, 139–154. [Google Scholar] [CrossRef]
  30. Akuru, U.B.; Onukwube, I.E.; Okoro, O.I.; Obe, E.S. Towards 100% renewable energy in Nigeria. Renew. Sustain. Energy Rev. 2016, 71, 1–11. [Google Scholar] [CrossRef]
  31. El-katiri, L. A Roadmap for Renewable Energy in the Middle East and North Africa; Oxford Institute for Energy Studies: Oxford, UK, 2014. [Google Scholar]
  32. Nematollahi, O.; Hoghooghi, H.; Rasti, M.; Sedaghat, A. Energy demands and renewable energy resources in the Middle East. Renew. Sustain. Energy Rev. 2016, 54, 1172–1181. [Google Scholar] [CrossRef]
  33. Bulut, U.; Muratoglu, G. Renewable energy in Turkey: Great potential, low but increasing utilization, and an empirical analysis on renewable energy-growth nexus. Energy Policy 2018, 123, 240–250. [Google Scholar] [CrossRef]
  34. Kaya, M.N.; Aksoy, M.H.; Kose, F. Renewable energy in Turkey: Potential, current status and future aspects. Ann. Fac. Eng. Hunedoara 2017, 15, 65. [Google Scholar]
  35. Aghahosseini, A.; Bogdanov, D.; Ghorbani, N.; Breyer, C. Analysis of 100% renewable energy for Iran in 2030: Integrating solar PV, wind energy and storage. Int. J. Environ. Sci. Technol. 2018, 15, 17–36. [Google Scholar] [CrossRef]
  36. Khojasteh, D.; Khojasteh, D.; Kamali, R.; Beyene, A.; Iglesias, G. Assessment of renewable energy resources in Iran; with a focus on wave and tidal energy. Renew. Sustain. Energy Rev. 2018, 81, 2992–3005. [Google Scholar] [CrossRef]
  37. Shouman, E.R. International and national renewable energy for electricity with optimal cost effective for electricity in Egypt. Renew. Sustain. Energy Rev. 2017, 77, 916–923. [Google Scholar] [CrossRef]
  38. Azeroual, M.; El Makrini, A.; El Moussaoui, H.; El Markhi, H. Renewable energy potential and available capacity for wind and solar power in Morocco towards 2030. J. Eng. Sci. Technol. Rev. 2018, 11, 189–198. [Google Scholar] [CrossRef]
  39. IRENA. Renewable Energy in the Gulf: Facts and Figures. Available online: https://www.irena.org/-/media/Files/IRENA/Agency/Factsheet/Renewable-Energy-in-the-Gulf.pdf (accessed on 26 December 2020).
  40. Demirbas, A.; Kabli, M.; Alamoudi, R.H.; Ahmad, W.; Basahel, A. Renewable energy resource facilities in the Kingdom of Saudi Arabia: Prospects, social and political challenges. Energy Sources Part B Econ. Plan. Policy 2017, 12, 8–16. [Google Scholar] [CrossRef]
  41. Blazquez, J.; Hunt, L.C.; Manzano, B. Oil subsidies and renewable energy in Saudi Arabia: A general equilibrium approach. Energy J. 2017, 38, 29–45. [Google Scholar] [CrossRef] [Green Version]
  42. Caldera, U.; Bogdanov, D.; Afanasyeva, S.; Breyer, C. Role of seawater desalination in the management of an integrated water and 100% renewable energy based power sector in Saudi Arabia. Water 2017, 10, 3. [Google Scholar] [CrossRef] [Green Version]
  43. Lim, X.Y.; Foo, D.C.Y.; Tan, R.R. Pinch analysis for the planning of power generation sector in the United Arab Emirates: A climate-energy-water nexus study. J. Clean. Prod. 2018, 180, 11–19. [Google Scholar] [CrossRef]
  44. Eveloy, V.; Gebreegziabher, T. Excess electricity and power-to-gas storage potential in the future renewable-based power generation sector in the United Arab Emirates. Energy 2019, 166, 426–450. [Google Scholar] [CrossRef]
  45. Martín-Pomares, L.; Martínez, D.; Polo, J.; Perez-Astudillo, D.; Bachour, D.; Sanfilippo, A. Analysis of the long-term solar potential for electricity generation in Qatar. Renew. Sustain. Energy Rev. 2017, 73, 1231–1246. [Google Scholar] [CrossRef]
  46. Mendez, C.; Bicer, Y. Qatar’s Wind Energy Potential with Associated Financial and Environmental Benefits for the Natural Gas Industry. Energies 2019, 12, 3329. [Google Scholar] [CrossRef] [Green Version]
  47. Al-Nassar, W.K.; Neelamani, S.; Al-Salem, K.A.; Al-Dashti, H.A. Feasibility of offshore wind energy as an alternative source for the state of Kuwait. Energy 2019, 169, 783–796. [Google Scholar] [CrossRef]
  48. Al-Dousari, A.; Al-Nassar, W.; Al-Hemoud, A.; Alsaleh, A.; Ramadan, A.; Al-Dousari, N.; Ahmed, M. Solar and wind energy: Challenges and solutions in desert regions. Energy 2019, 176, 184–194. [Google Scholar] [CrossRef]
  49. Sufian, T.; International Energy Charter. Post Conflict Reconstruction Strategy Study for the Electricity and Energy Sector of Yemen. 2019. Available online: https://www.energycharter.org/fileadmin/DocumentsMedia/Occasional/2019-Yemen_paper_final.pdf (accessed on 26 December 2020).
  50. Al Asbahi, M.H.; Fang, Z.G.; Chandio, Z.A.; Tunio, M.K.; Ahmed, J.; Abbas, M. Assessing barriers and solutions for Yemen energy crisis to adopt green and sustainable practices: A fuzzy multi-criteria analysis. Environ. Sci. Pollut. Res. 2020, 27, 36765–36781. [Google Scholar] [CrossRef]
  51. Rawea, S.; Urooj, S. Strategies, current status, problems of energy and perspectives of Yemen’s renewable energy solutions. Renew. Sustain. Energy Rev. 2019, 82, 1655–1663. [Google Scholar] [CrossRef]
  52. Al-Ashwal, M. Energy efficiency and conservation indicators in Yemen. Futur. Cities Environ. 2016, 2, 3. [Google Scholar] [CrossRef]
  53. Al Buhairi, M.H. A Statistical Analysis of Wind Speed Data and an Assessment of Wind Energy Potential in Taiz-Yemen Abstract: Nomenclature: Introduction. Ass. Univ. Bull. Environ. Res. 2006, 9, 21–33. [Google Scholar]
  54. Abdul-Aziz, J.; Abdo, A.; Zumailan, A. Global solar radiation estimation from relative sunshine hours in Yemen. Renew. Energy 1993, 3, 645–653. [Google Scholar] [CrossRef]
  55. Al-Fakih, R.; Li, K. Study of geothermal energy resources of Yemen for electric power generation. Trans. Geotherm. Resour. Counc. 2018, 42, 777–795. [Google Scholar]
  56. Baharoon, D.D.; Rahman, H.A.; Fadhl, S.O. Personal and psychological factors affecting the successful development of solar energy use in Yemen power sector: A. case study. Renew. Sustain. Energy Rev. 2016, 60, 516–535. [Google Scholar] [CrossRef]
  57. Baharoon, D.A.; Rahman, H.A.; Fadhl, S.O. Publics’ knowledge, attitudes and behavioral toward the use of solar energy in Yemen power sector. Renew. Sustain. Energy Rev. 2016, 60, 498–515. [Google Scholar] [CrossRef]
  58. Hadwan, M.; Alkholidi, A. Solar power energy solutions for Yemeni rural villages and desert communities. Renew. Sustain. Energy Rev. 2016, 57, 838–849. [Google Scholar] [CrossRef]
  59. Alganahi, H.S.; Kamaruzzaman, S.; Mohamed, A.; Haidar, A.M.A.; Abdalla, A.N. Experimental study of using renewable energy in Yemen. Aust. J. Basic Appl. Sci. 2009, 3, 4170–4174. [Google Scholar]
  60. Al-Barashi, M.M.; Ibrahim, D.K.; El-Zahab, E.E.-D.A. Evaluating Connecting Al-Mukha New Wind Farm to Yemen Power System. Int. J. Electr. Energy 2015, 3, 57–67. [Google Scholar] [CrossRef]
  61. Al-Shetwi, A.Q.S. Design and Economic Evaluation of Electrification of Small Villages in Rural Areas in Yemen Using Stand Alone Photovoltaic System. Ph.D. Thesis, Yarmouk University, Irbid, Jordan, 2013. [Google Scholar]
  62. WB. Assessment of the Status of Solar Pv in Yemen. 2017. Available online: https://www.rcreee.org/content/assessment-status-solar-pv-yemen (accessed on 26 December 2020).
  63. Ansari, D.; Kemfert, C.; Al-Kuhlani, H. Yemen’s Solar Revolution: Developments, Challenges, Opportunities; DIW Berlin: Berlin, Germany, 2019. [Google Scholar]
  64. Sufian, P.D.T.; Öğütçü, M.C.; Barra, M.M.; International Energy Charter. Energy Investment and Business Climate Report for Observer Countries. 2016. Available online: https://www.energycharter.org/fileadmin/DocumentsMedia/Occasional/Yemen_Investment_Report.pdf (accessed on 26 December 2020).
  65. UNDP. National Biodiversity Strategy and Action Plan II. 2017. Available online: https://www.cbd.int/doc/world/ye/ye-nbsap-v2-en.pdf (accessed on 26 December 2020).
  66. Mahmud, D.; Deb, A. Prospects of Solar Energy in Yemen. IOSR J. Electr. Electron. Eng. 2013, 4, 46–57. [Google Scholar] [CrossRef]
  67. National Dialogue Conference. Available online: http://www.ndc.ye/issue.aspx?show=10 (accessed on 26 December 2020).
  68. The World Bank. Habitat III: The 3rd United Nations Conference on Housing and Sustainable Urban Development – World Bank Participation. Available online: https://www.worldbank.org/en/events/2016/10/17/world-bank-at-habitat-iii-conference (accessed on 26 December 2020).
  69. World Bank. Republic of Yemen Restoring and Expanding Energy Access. 2017. Available online: https://documents.worldbank.org/en/publication/documents-reports/documentdetail/655811496412539032/republic-of-yemen-restoring-and-expanding-energy-access-power-sector-reengagement-note (accessed on 26 December 2020).
  70. Ministry of Foreign Affairs of the Netherlands. Climate Change Profile: Yemen. Available online: https://reliefweb.int/report/yemen/climate-change-profile-yemen (accessed on 26 December 2020).
  71. Ministry of Water and Environment. National Biodiversity Strategy and Action Plan. 2005. Available online: https://www.cbd.int/doc/world/ye/ye-nbsap-01-en.pdf (accessed on 26 December 2020).
  72. Republic of Yemen. Intended Nationally Determined Contribution (INDC). 2015. Available online: https://www4.unfccc.int/sites/submissions/indc/SubmissionPages/submissions.aspx (accessed on 26 December 2020).
  73. Ministry of Water and Environment. Clean Development Mechanism. 2007. Available online: https://www.carbon-mechanisms.de/fileadmin/media/dokumente/Publikationen/Studie/Studie_2008_CDM_Yemen_eng.pdf (accessed on 26 December 2020).
  74. Republic of Yemen. Second National Communication. Available online: https://www.adaptation-undp.org/projects/trust-yemen-second-national-communication (accessed on 26 December 2020).
  75. Republic of Yemen. Third National Communication to the Conference of the Parties of UNFCCC. 2018. Available online: https://www4.unfccc.int/sites/SubmissionsStaging/NationalReports/Documents/3089651_Yemen-NC3-BUR1-1-Yemen_TNC_2018.pdf (accessed on 26 December 2020).
  76. UNDP. Republic of Yemen. Strategy Roadmap. Development of National Low-Emission Development Strategy (LEDS) in Yemen. 2013. Available online: www.undp.org (accessed on 26 December 2020).
  77. Yemen. Country Strategic Paper. 2006. Available online: http://www.eeas.europa.eu/archives/docs/yemen/csp/02_06_en.pdf (accessed on 26 December 2020).
  78. Trading Economic. Yemen—Economic Forecasts—2020–2022 Outlook. 2020. Available online: https://tradingeconomics.com/yemen/forecast (accessed on 26 December 2020).
  79. International Monetary Fund. World Economic Outlook. 2020. Available online: https://www.imf.org/external/datamapper/PCPIPCH@WEO/WEOWORLD/VEN/YEM (accessed on 26 December 2020).
  80. Yemen Diesel Prices. Available online: https://www.globalpetrolprices.com/Yemen/diesel_prices/ (accessed on 26 December 2020).
  81. Baker, T.; Aldawsari, B.; Asim, M.; Tawfik, H.; Maamar, Z.; Buyya, R. Cloud-SEnergy: A bin-packing based multi-cloud service broker for energy efficient composition and execution of data-intensive applications. Sustain. Comput. Inform. Syst. 2018, 19, 242–252. [Google Scholar] [CrossRef] [Green Version]
  82. Safara, F.; Souri, A.; Baker, T.; Al Ridhawi, I.; Aloqaily, M. PriNergy: A priority-based energy-efficient routing method for IoT systems. J. Supercomput. 2020, 76, 8609–8626. [Google Scholar] [CrossRef]
  83. Alharthi, Y.Z.; Siddiki, M.K.; Chaudhry, G.M. Resource Assessment and Techno-Economic Analysis of a Grid-Connected Solar PV-Wind Hybrid System for Different Locations in Saudi Arabia. Sustainability 2018, 10, 3690. [Google Scholar] [CrossRef] [Green Version]
  84. Solar Reviews. Sunpower. Available online: https://www.solarreviews.com/buyers-guide/solarpanels/sunpower/sunpo19768eseriesspre20327 (accessed on 26 December 2020).
  85. Renewable Energy. How Much Does a Wind Turbine Cost. Available online: https://www.renewablesfirst.co.uk/windpower/windpower-learning-centre/how-much-does-a-wind-turbine-cost/ (accessed on 26 December 2020).
  86. ENERCON. ENERCON Product Overview. Available online: https://www.enercon.de/fileadmin/Redakteur/Medien-Portal/broschueren/pdf/en/ENERCON_Produkt_en_06_2015.pdf (accessed on 26 December 2020).
  87. Equipment Trader. Caterpillar Equipment. Available online: https://www.equipmenttrader.com/Caterpillar-Generators-Industrial/equipment-forsale?make=CATERPILLAR%7C2322422&category=Generators%7C2000258 (accessed on 26 December 2020).
  88. MATRIX ENERGY. Rolls Surrette Batteries: 6CS-25PS. Available online: https://www.matrixenergy.ca/batteries/rolls-surrette-flooded-6cs25ps.html (accessed on 26 December 2020).
  89. Flooded Deep Cycle Batteries 6 CS 25 P. Available online: https://www.rollsbattery.com/wp-content/uploads/batteries/6CS25P.pdf (accessed on 26 December 2020).
  90. Surrette Rolls 6-CS-25PS1150Ah, 6V Deep Cycle Battery. Available online: https://webosolar.com/product/surrette-rolls-6-cs-25ps-1150-ah-6-volt-deep-cycle-battery/ (accessed on 26 December 2020).
  91. Electric Drive Technology, Frequncey Converters. Available online: https://www.ghv.de/en/products/electric-drive-technology/frequency-converters/ (accessed on 26 December 2020).
  92. Alibaba, Changzhou Soochee Automatic Transmission Technology Co., Ltd. Frequency Inverter Converter Standard Drives. Available online: https://soochee.en.alibaba.com/ (accessed on 26 December 2020).
  93. Hafez, O.; Bhattacharya, K. Optimal planning and design of a renewable energy based supply system for microgrids. Renew. Energy 2012, 45, 7–15. [Google Scholar] [CrossRef]
  94. Government of Yemen; UNICEF; OCHA Services. Nutritional Anthropometric and Retrospective Mortality Survey, Children 6 to 59 Months: Taiz District, Mountainous, Hills & Valleys and Coastal Plain Ecological Zones. Available online: https://reliefweb.int/report/yemen/nutritional-anthropometric-and-retrospective-mortality-survey-children-6-59-months-taiz (accessed on 26 December 2020).
  95. Wikipedia. Media Related to Taiz. Available online: https://en.wikipedia.org/wiki/Taiz (accessed on 26 December 2020).
  96. Operacz, A. The term “effective hydropower potential” based on sustainable development—an initial case study of the Raba river in Poland. Renew. Sustain. Energy Rev. 2016, 75, 1453–1463. [Google Scholar] [CrossRef]
  97. The Global Economy. Yemen: Diesel Prices. Available online: https://www.theglobaleconomy.com/Yemen/diesel_prices/ (accessed on 26 December 2020).
  98. Qolipour, M.; Mostafaeipour, A.; Mohseni, O. Techno-economic feasibility of a photovoltaic-wind power plant construction for electric and hydrogen production: A case study. Renew. Sustain. Energy Rev. 2017, 78, 113–123. [Google Scholar] [CrossRef]
  99. Deshmukh, M.K.; Singh, A.B. Modeling of energy performance of stand-alone SPV system using HOMER pro. Energy Procedia 2019, 156, 90–94. [Google Scholar] [CrossRef]
  100. Isa, M.N.; Das, H.S.; Tan, C.W.; Yatim, A.H.M.; Lau, K.Y. A techno-economic assessment of a combined heat and power photovoltaic/fuel cell/battery energy system in Malaysia hospital. Energy 2016, 112, 75–90. [Google Scholar] [CrossRef]
  101. Razmjoo, A.; Shirmohammadi, R.; Davarpanah, A.; Pourfayaz, F.; Aslani, A. Stand-alone hybrid energy systems for remote area power generation. Energy Rep. 2019, 5, 231–241. [Google Scholar] [CrossRef]
  102. Al-Sharafi, A.; Sahin, A.Z.; Ayar, T.; Yilbas, B.S. Techno-economic analysis and optimization of solar and wind energy systems for power generation and hydrogen production in Saudi Arabia. Renew. Sustain. Energy Rev. 2017, 69, 33–49. [Google Scholar] [CrossRef]
  103. Jahangiri, M.; Haghani, A.; Shamsabadi, A.A.; Mostafaeipour, A.; Pomares, L.M. Feasibility study on the provision of electricity and hydrogen for domestic purposes in the south of Iran using grid-connected renewable energy plants. Energy Strateg. Rev. 2019, 23, 23–32. [Google Scholar] [CrossRef]
  104. Akhtari, M.R.; Baneshi, M. Techno-economic assessment and optimization of a hybrid renewable co-supply of electricity, heat and hydrogen system to enhance performance by recovering excess electricity for a large energy consumer. Energy Convers. Manag. 2019, 188, 131–141. [Google Scholar] [CrossRef]
  105. Milich, L.; Al-Sabbry, M. The ‘Rational Peasant’ vs Sustainable Livelihoods: The Case of Qat in Yemen. Available online: https://cals.arizona.edu/~lmilich/yemen.html (accessed on 26 December 2020).
Figure 1. Schematic diagram of different microgrid energy systems: (a) Case I; (b) Case II; (c) Case III; (d) Case IV; (e) Case V.
Sustainability 13 00228 g001
Figure 2. Allocation of Taiz province in the Republic of Yemen.
Sustainability 13 00228 g002
Figure 3. The monthly average solar radiation and clearness index in Taiz province, Yemen.
Sustainability 13 00228 g003
Figure 4. The monthly average air temperature in Taiz province, Yemen.
Sustainability 13 00228 g004
Figure 5. The monthly average wind speed in Taiz province, Yemen.
Sustainability 13 00228 g005
Figure 6. Schematic diagram of the different scenarios and energy strategies for electrifying various consumers’ categories.
Sustainability 13 00228 g006
Figure 7. The daily profile of energy required by three scenarios.
Sustainability 13 00228 g007
Figure 8. Percentage of different individual costs of total net present cost (NPC) for all microgrid configurations under three energy scenarios.
Sustainability 13 00228 g008
Figure 9. Percentage of NPC reduction of energy scenario 1 compared with the other two energy scenarios.
Sustainability 13 00228 g009
Figure 10. Monthly energy production from different power sources in the Case IV.
Sustainability 13 00228 g010
Figure 11. Components costs during entire system life.
Sustainability 13 00228 g011
Figure 12. Hourly data of seven random days in April for system operation in the Case IV.
Sustainability 13 00228 g012
Table 1. Initial capital, replacement, O&M, fuel, and salvage costs of total NPC for all microgrid configurations under three energy scenarios.
ScenarioMicrogrid ConfigurationInitial Capital Cost
(Dollar)
Replacement Cost
(Dollar)
M&O Cost
(Dollar)
Fuel Cost
(Dollar)
Salvage
(Dollar)
NPC
(Dollar)
1Case I64,687,500116,075,258.710,620,009.2516,232,062,86832,148,174.6716.4B
Case II4,448,705,2592,997,981,232393,621,176.7533,241,401.7737,092,955.57.64B
Case III3,571,200,5743,838,364,386216,609,967.92,900,875,9392,172,843,4698.35B
Case IV3,840,447,6432,941,326,865313,156,881416,110,538.41,125,122,6966.39B
Case V4,889,114,3303,165,627,330364,630,79101,013,651,1317.41B
2Case I90,562,500162,505,362.214,868,012.9525,628,120,51945,007,444.5425.9B
Case II7,222,355,3734,918,537,208638,418,121.1906,061,996.31,266,845,98612.4B
Case III4,308,573,3924,090,663,952121,118,2227,831,385,8622,736,624,62813.6B
Case IV6,335,955,7204,657,547,441482,255,816681,189,2441,809,457,17210.3B
Case V8,090,529,0135,067,381,819574,980,175.101,648,482,26312.1B
3Case I103,500,000185,720,413.916,992,014.829,076,240,40351,437,079.4729.3B
Case II8,258,468,6545,544,745,051720,155,913.4875,139,025.51,474,947,06313.9B
Case III6,253,638,6626,642,433,476339,089,611.35,886,009,5533,822,561,73015.3B
Case IV6,944,915,6135,157,239,225521,138,670.51,102,499,2362,049,516,14211.7B
Case V9,535,600,1795,161,567,632595,997,324.201,722,210,39713.6B
Table 2. The optimal result of technical performances and economic factors of the five microgrid configurations under scenario (1) of energy strategic.
ParametersDE (Case I)PV + DE (Case II)WT + DE (Case III)PV + WT + DE (Case IV)PV+WT (Case V)
Production (%)DE (100%)97.5%PV + 2.5% DE91.8%WT + 8.2%DE57.5%PV + 40.8%WT + 1.71%DE79.9%PV + 20.1%WT
Fuel Consumption (L/yr)485,114,00015,936,54086,696,04812,435,9460
CO2 emission (Kg/yr)1,283,022,59442,148,726229,292,44432,890,4110
Reduction of fuel consumption&CO2 emission compared to Case I (%)-------96.7282.1397.44100
Renewable Fraction (%)096.178.6097.1100
NPC (dollar)16.4B7.64B8.35B6.39B7.41B
COE (dollar/kwh)0.4480.2090.2290.1750.203
Reduction of NPC&COE compared to case I (%)-------53.4249.0461.9554.82
Table 3. The result of optimal capacity and annual energy production of the system in the Case IV.
Parameter PVWTDEBatteries Converter
Rated size (kW)793,931795,000 (265 turbines)200,0004 Batteries in a single string, 255,135 strings = 1,020,540 Bat535,152
Energy production (MWh/year)1,463,783.467 1,037,909.81343,532.7291575,390.9-----
Table 4. The economic indexes based on population growth in Taiz province in the upcoming ten years.
Year202020222024202620282030
Population (million)3.253.433.623.824.034.26
Total Energy consumption (MWh/day)4130.84698.25267.75841.96423.57015.0
NPC (billion dollars)6.397.338.179.039.9410.86
COE (dollars/kWh)0.1750.1760.1750.1750.1750.175
Table 5. The result of economic indexes via variation of a real interest rate for the best-selected optimal energy system under scenario (1) of energy strategies.
Real Interest Rate (%)−50.245
NPC (billion dollars)8.236.395.30
COE (dollars/kWh)0.1050.1750.249
Table 6. The result of economic indexes via variation of diesel fuel price for the best- selected optimal energy system in scenario (1) of energy strategies.
Diesel Fuel Price (Dollar/L)0.691.382.07
NPC (billion dollars)5.266.396.60
COE (dollar/kWh) 0.1440.1750.181
Publisher’s Note: MDPI stays neutral with regard to jurisdictional claims in published maps and institutional affiliations.

