BIM-Enabled Virtual Reality (VR) for Sustainability Life Cycle and Cost Assessment


Abstract
:1. Introduction
- -
- Q1: How are BIM-enabled VR applications understood so that general users and professionals can use them to make judgments?
- -
- Q2: How are BIM-enabled VR application outcomes for cost and sustainability assessment perceived by general and professional users?
- -
- Q3: How effective are BIM-enabled VR applications for cost assessment?
- -
- Q4: How effective are BIM-enabled VR applications for sustainability assessment?
2. Background
2.1. Building Information Modeling (BIM)
2.2. BIM-Enabled VR
2.3. BIM-Based LCA
2.4. BIM-Based QTO
3. Materials and Methods
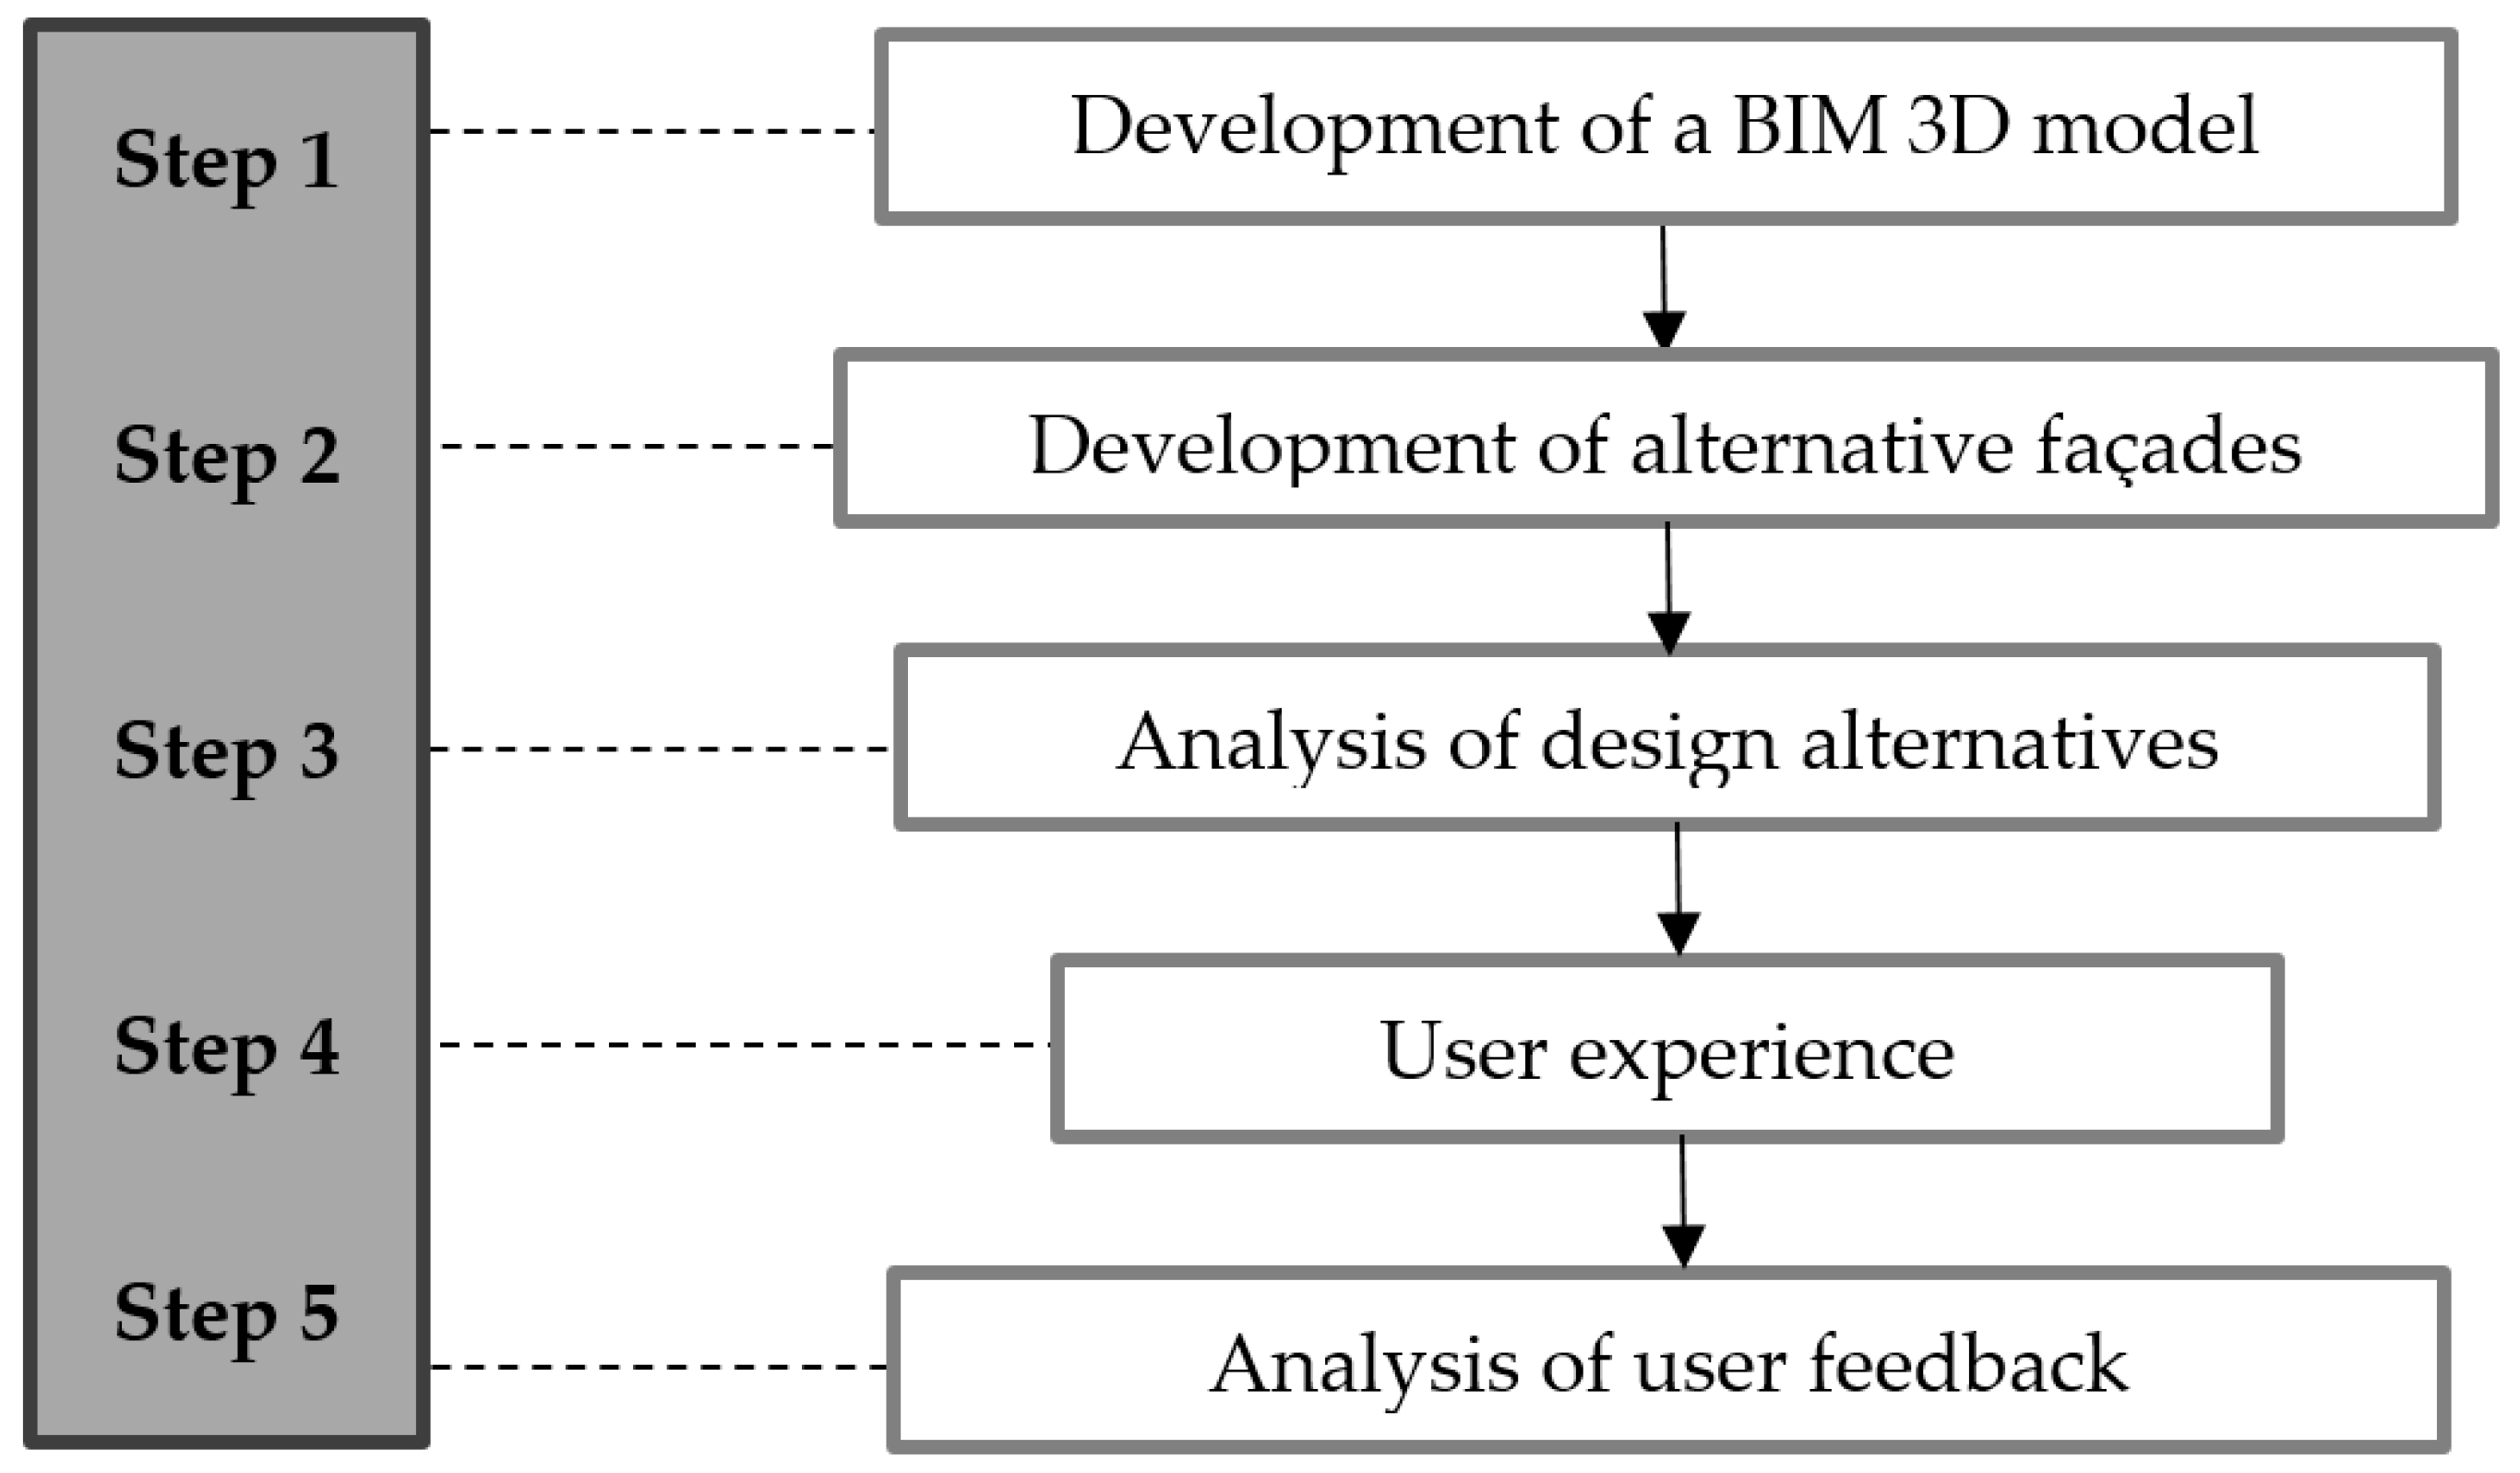
3.1. Research Process
3.2. Cost and LCA Assessment
3.3. User Experience
3.3.1. Preparing the Interview Questions
3.3.2. Design of the User Feedback Form
3.3.3. Experimental Protocol
4. Results
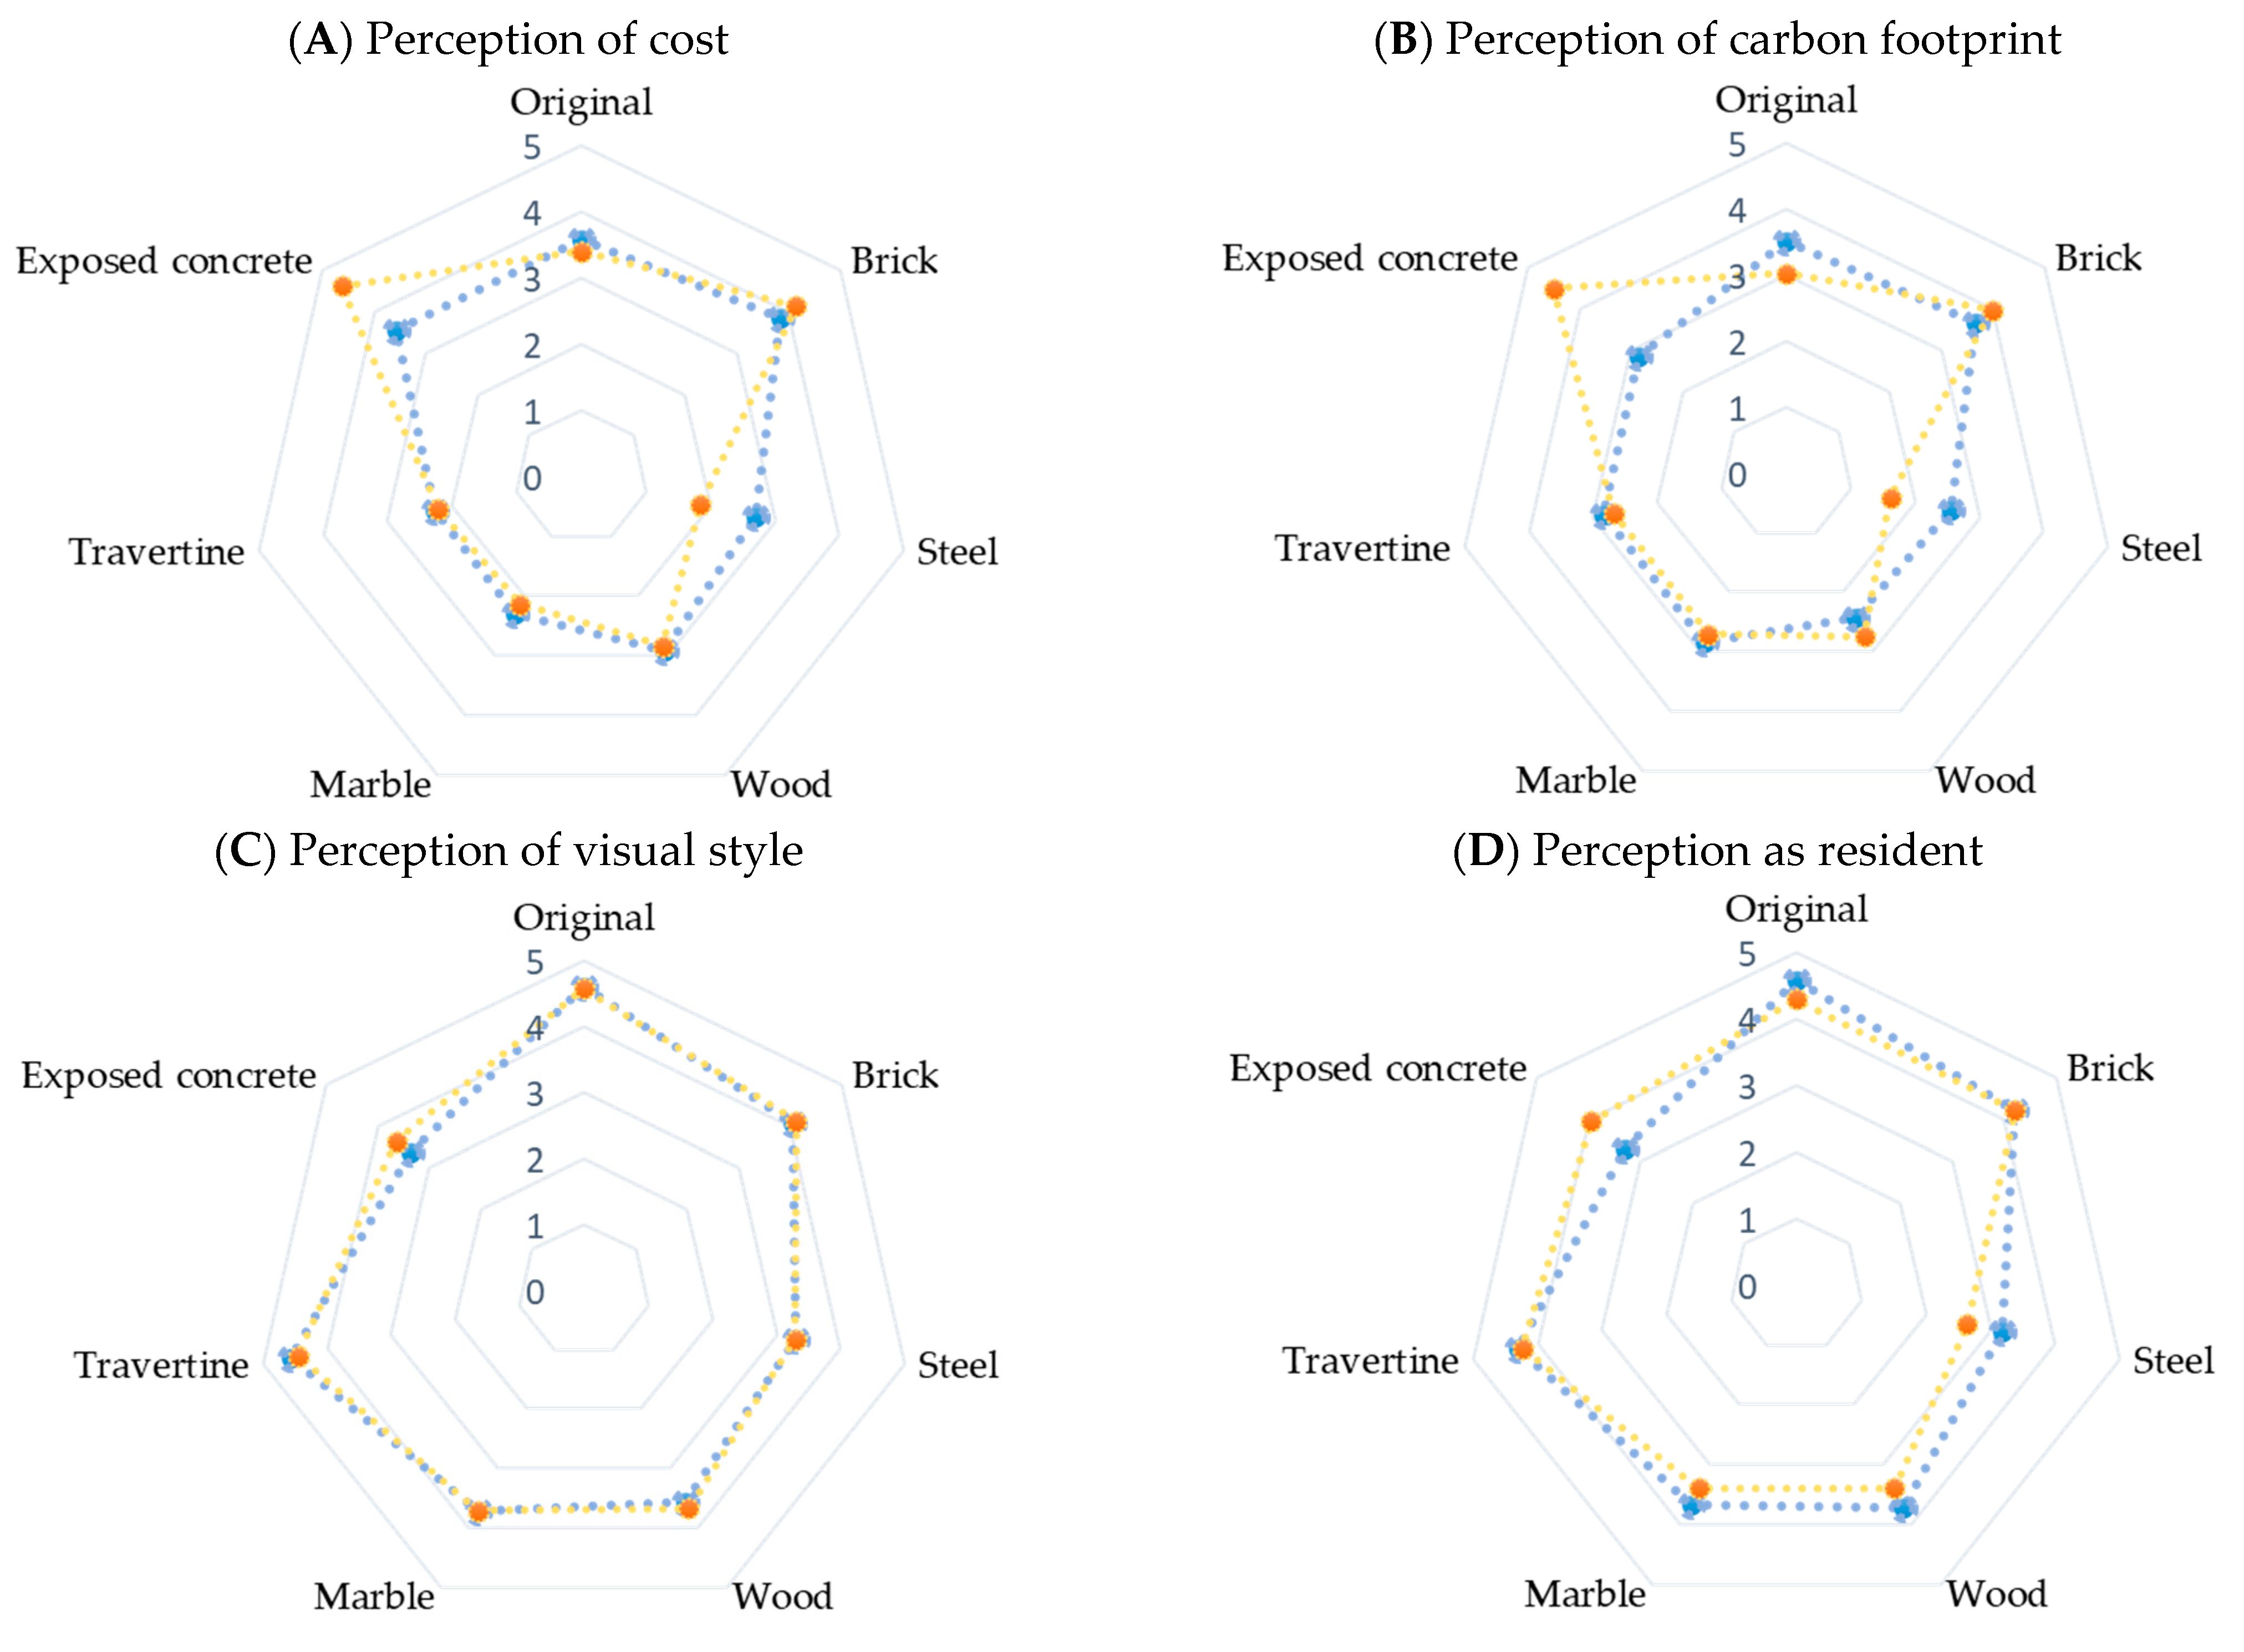
4.1. Mean Ratings for Façade Design Alternatives in All Categories
4.2. Mean Ranks Based on Education
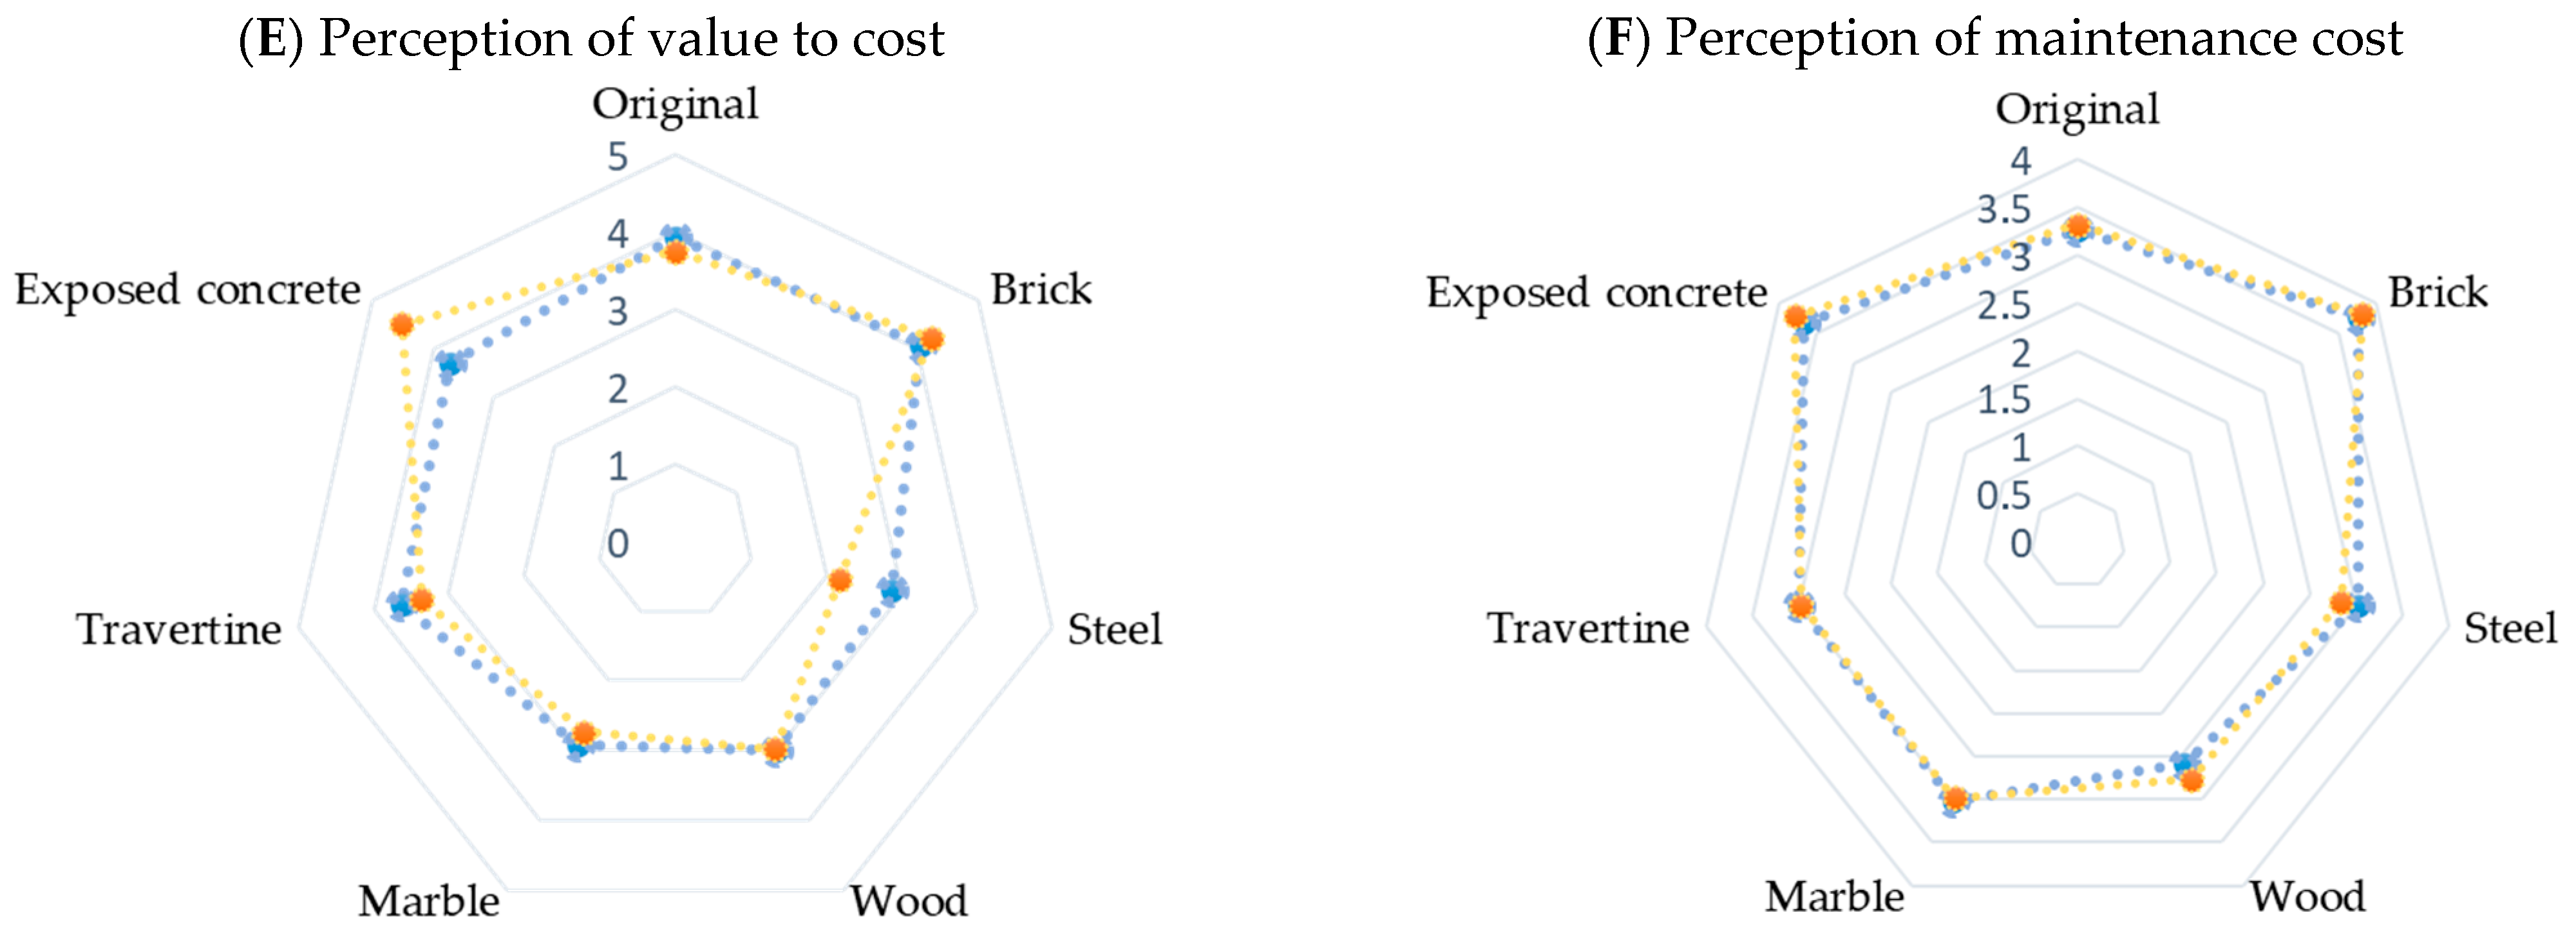
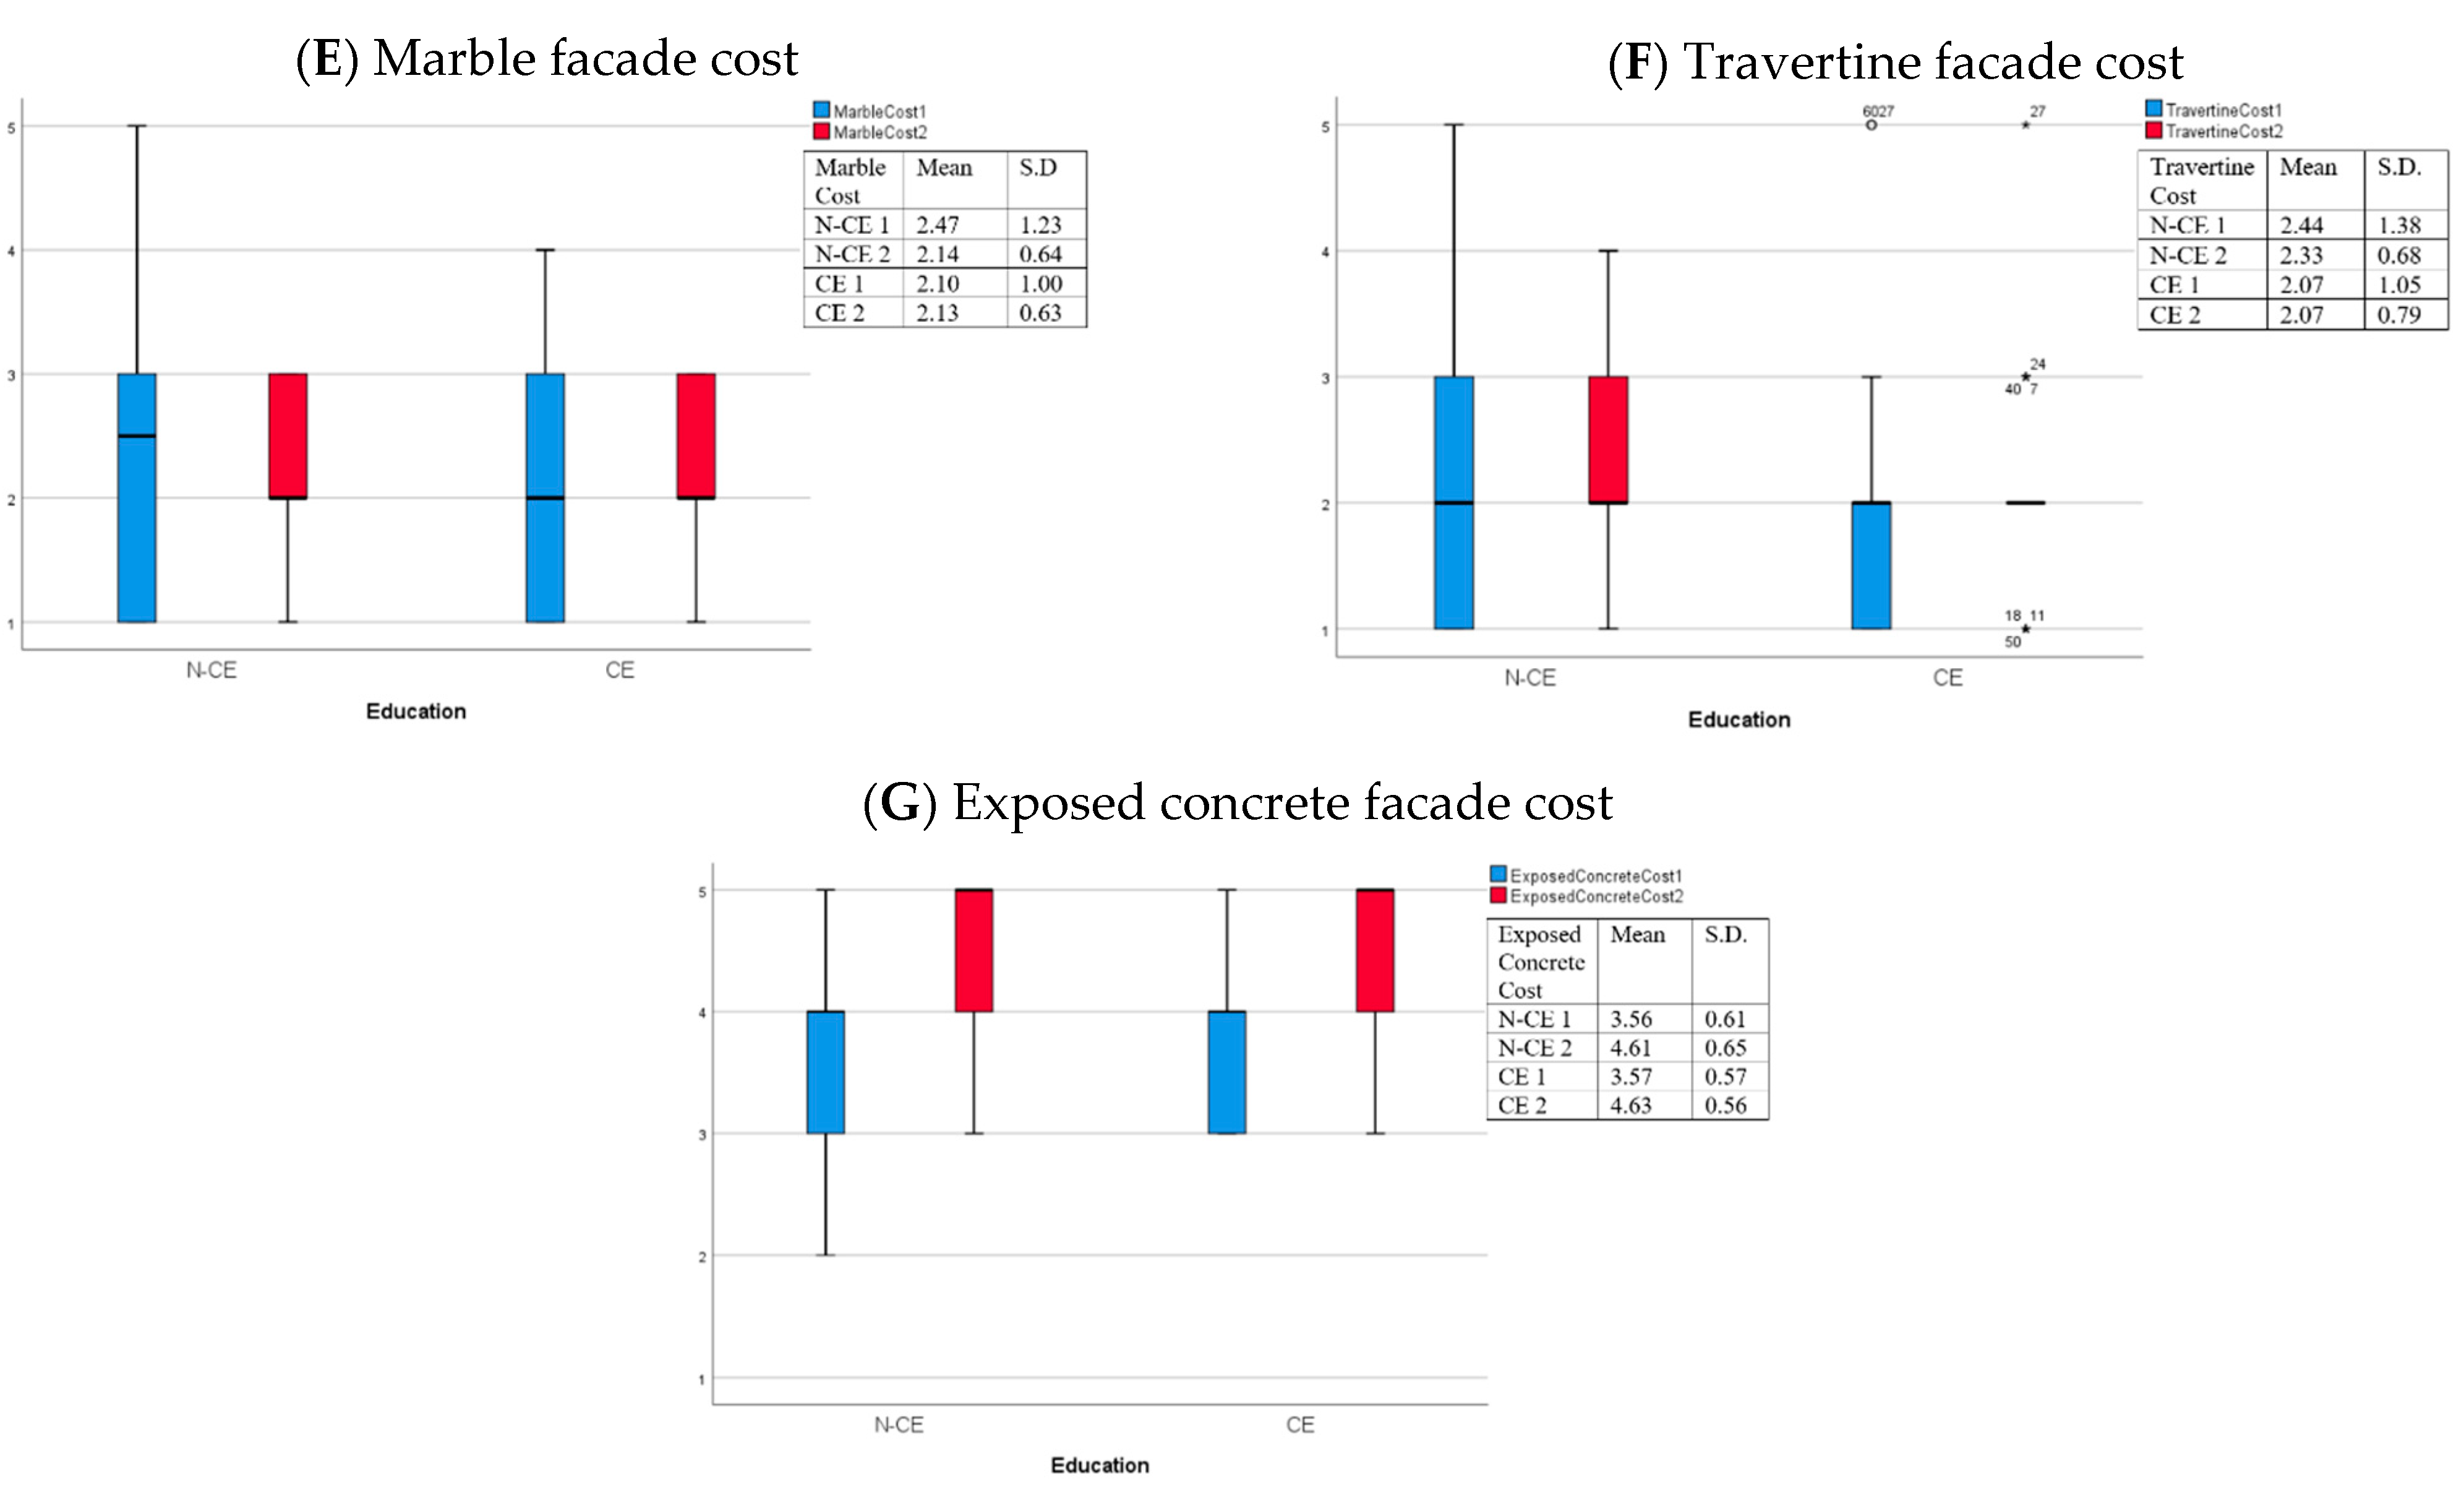
4.2.1. Comparing N-CE and CE in Relation to Façade Alternative Cost Results
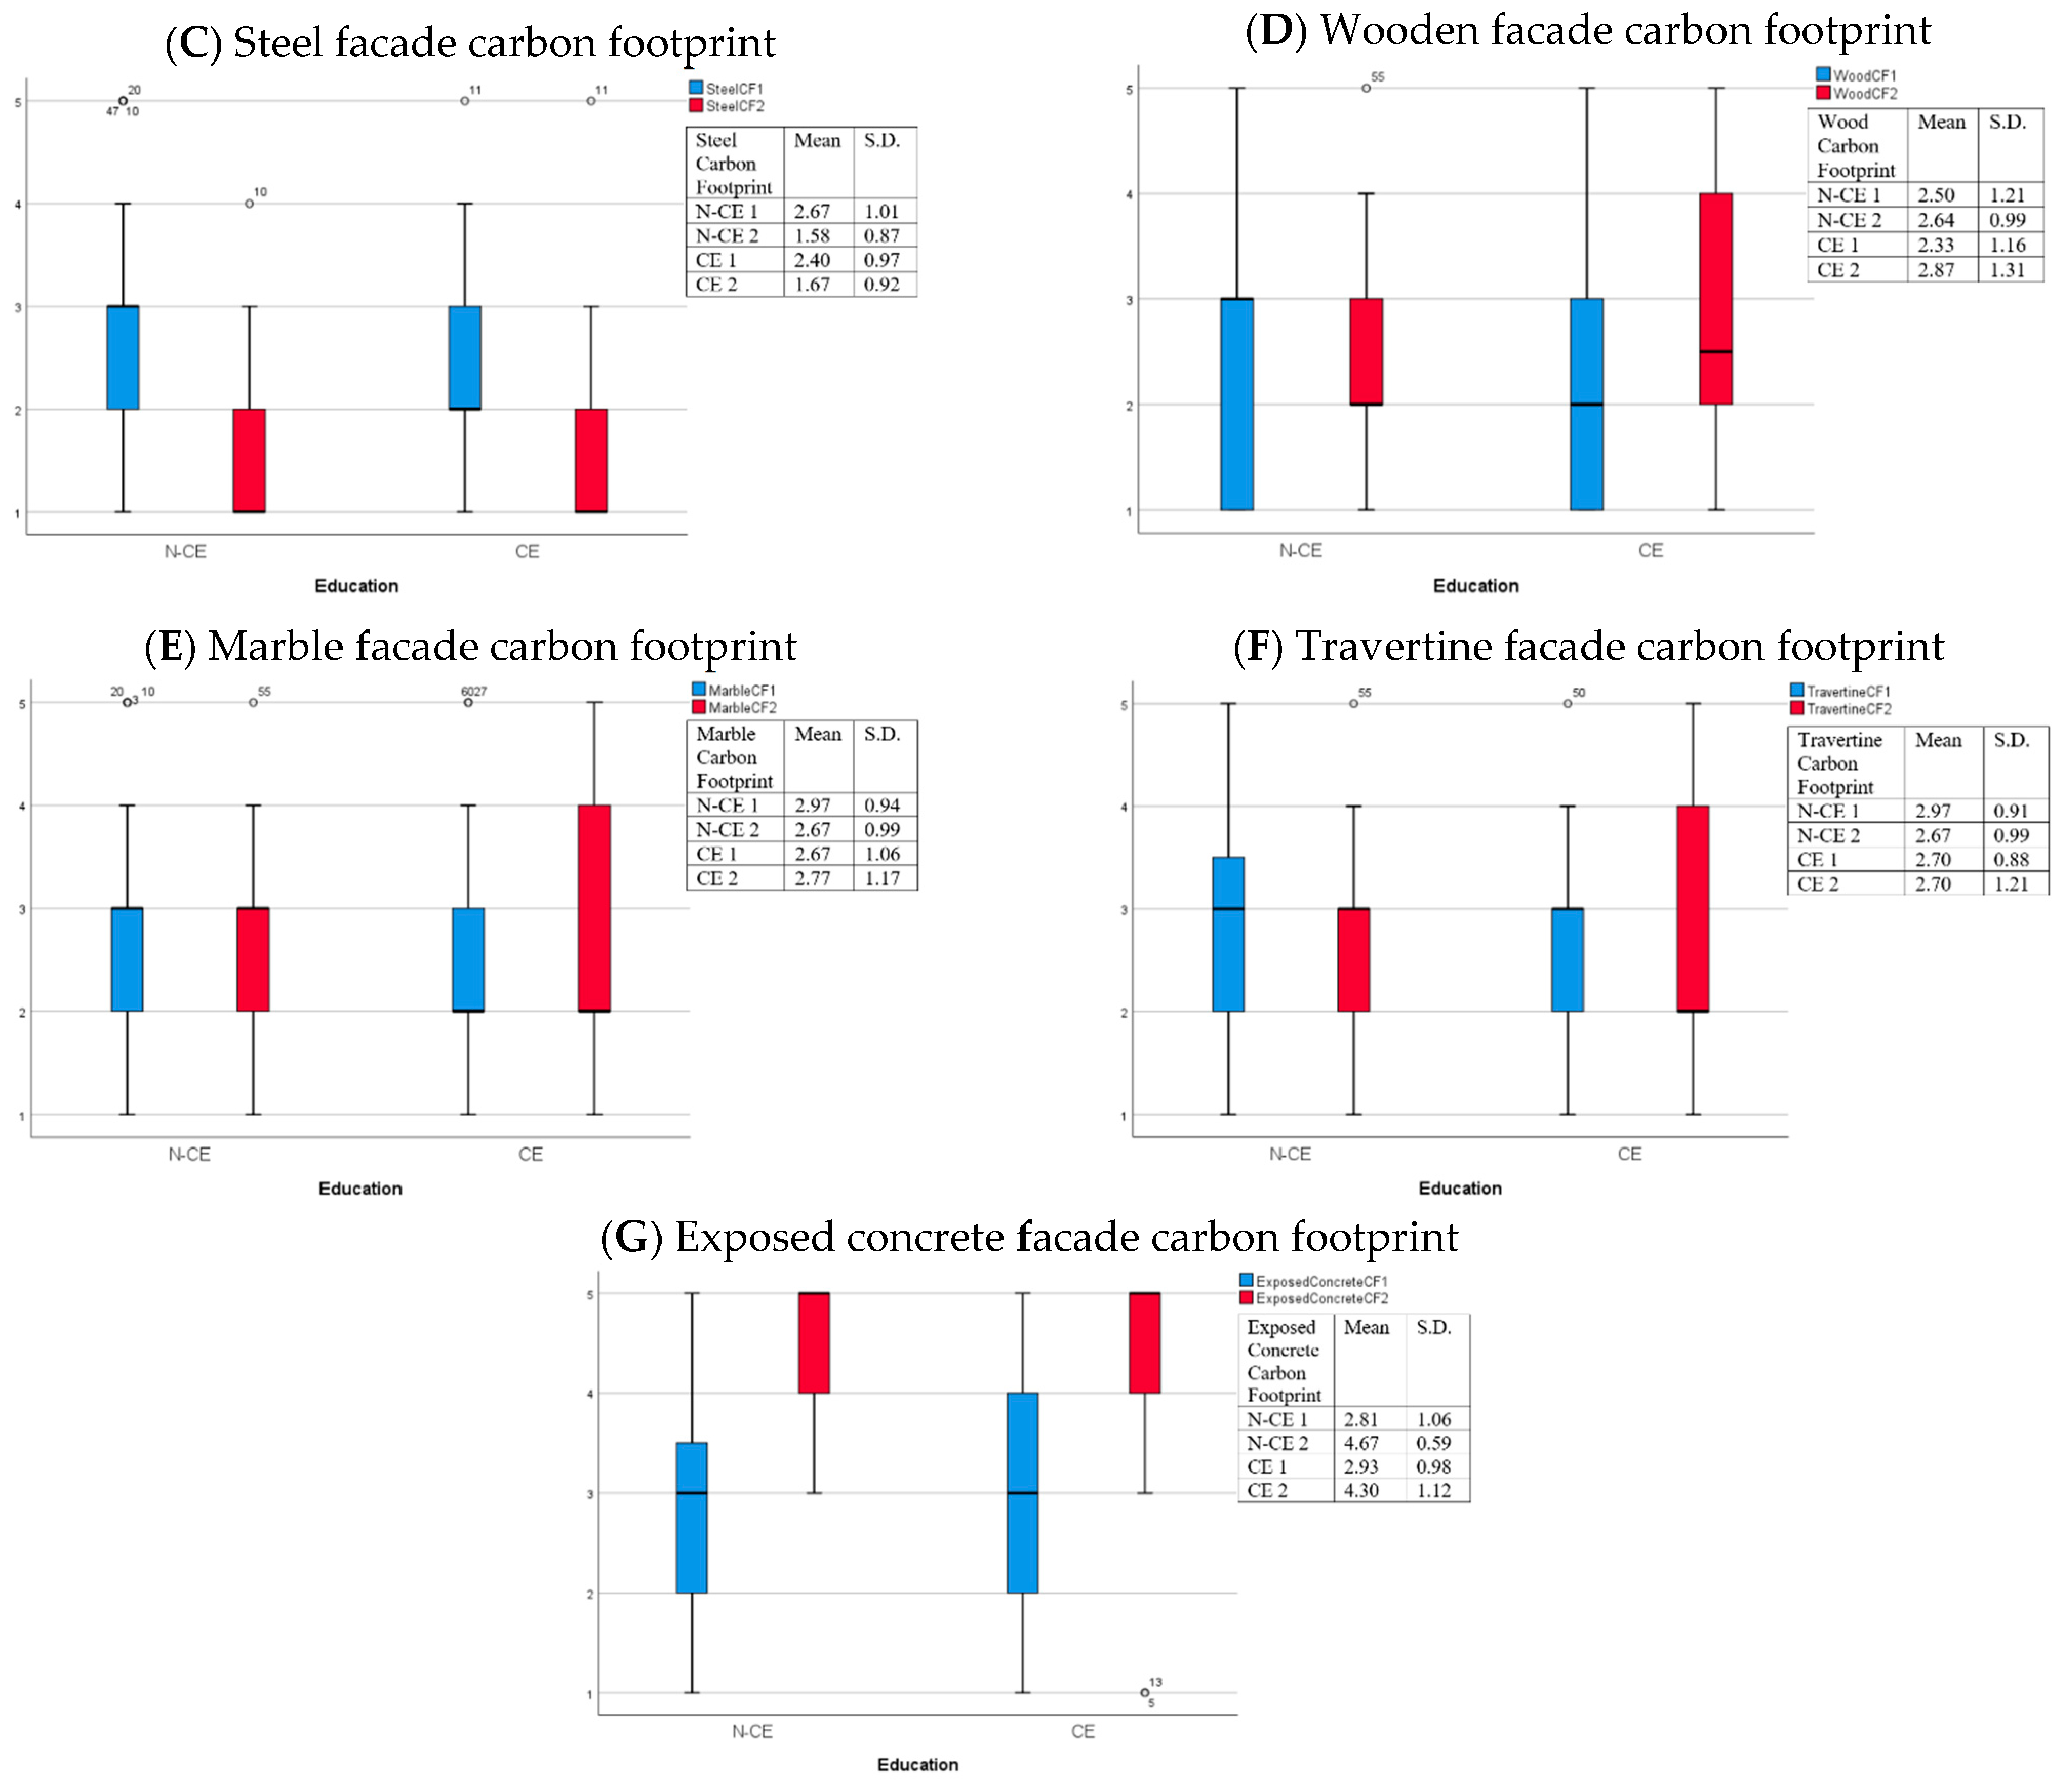
4.2.2. Comparing N-CE and CE in Relation to Façade Carbon Footprint Results
4.3. Questionnaire Results
- The dependent variable should be measured at the ordinal or continuous level, i.e., the Likert scale.
- The independent variable should consist of two categorical, independent groups, i.e., CE and N-CE.
- There should be independence of observations, meaning one participant cannot be presented in both groups at the same time.
- The data should not be normally distributed.
5. Discussion
5.1. Comparison between the CEs and N-CEs When Using BIM-Enabled VR (Addressing Q1 in Section 1)
5.2. Comparison between the Cost and Sustainability Assessments When Using BIM-Enabled VR (Addressing Q2 in Section 1)
5.3. Comparison between the Cost Assessments Using BIM-Enabled VR and without It (Addressing Q3 in Section 1)
5.4. Comparison between the Sustainability Assessments Using BIM-Enabled VR and without It (Addressing Q4 in Section 1)
6. Conclusions and Future Work
- (a)
- BIM-enabled VR applications to be extended beyond just visualization: the use of VR can be beneficial during the conceptual phase as it can eradicate cost-overruns and errors in the later stages of construction. The experiment results from the questionnaire revealed that the N-CEs participants felt the most benefited by VR, whereas the CEs had more faith in BIM + VR as a tool for future design being more efficient and sustainable.
- (b)
- BIM-enabled VR to be utilized in tracking carbon footprint and cost, leading to lesser emissions and costs: it was observed that VR in combination with BIM + QTO could enable the selection of economical solution without compromising on esthetics. Based on the experiments conducted, user participants preferred economical solutions to the more expensive ones. Likewise, VR in combination with BIM + LCA could help participants make better decisions, owing to an increased concern for sustainable solutions.
- (c)
- Understanding of these tools (BIM, cost estimation, LCA, VR) perceived by the user participants in terms of the impact on design decisions: the software used is beneficial during the conceptual design phase, as they produce LCA and cost assessments that help designers and clients make better decisions regarding the choice of materials used in the building. Based on the survey, not every user shared the same concern for the carbon footprint, as users leaned more towards the most economical or esthetic solution. However, based on simplified cost and carbon footprint results, it was evident that the users’ perception changed substantially.
Limitation and Future Study
Author Contributions
Funding
Institutional Review Board Statement
Informed Consent Statement
Data Availability Statement
Conflicts of Interest
References
- Wang, S. Application of BIM and VR Technology in Complex Construction Project: A Case Study of Iceberg 3d BIM Structure Layout Design for an Ocean Park. Commun. Comput. Inform. Sci. 2013, 369, 245–255. [Google Scholar] [CrossRef]
- Eastman, C.M.; Eastman, C.; Teicholz, P.; Sacks, R.; Liston, K. BIM Handbook: A Guide to Building Information Modeling for Owners, Managers, Designers, Engineers and Contractors, 2nd ed.; John Wiley & Sons: Hoboken, NJ, USA, 2011; ISBN 9780470541371. [Google Scholar]
- Thabet, W.; Shiratuddin, M.F.; Bowman, D. Virtual Reality in Construction. Engineering Computational Technology. In Engineering Computational Technology; Saxe-Coburg Publications: Edinburgh, UK, 2002; pp. 25–52. Available online: https://www.researchgate.net/publication/235334719 (accessed on 20 November 2019).
- Getuli, V.; Capone, P.; Bruttini, A.; Isaac, S. BIM-based immersive Virtual Reality for construction workspace planning: A safety-oriented approach. Autom. Constr. 2020, 114, 103160. [Google Scholar] [CrossRef]
- The Boston Consulting Group. Shaping the Future of Construction: A Breakthrough in Mindset and Technology; World Economic Forum: Cologny, Switzerland, 2016; Available online: https://www.weforum.org/reports/shaping-the-future-of-construction-a-breakthrough-in-mindset-and-technology (accessed on 3 September 2019).
- Sampaio, A.Z.; Ferreira, M.M.; Rosário, D.P.; Martins, O.P. 3D and VR models in Civil Engineering education: Construction, rehabilitation and maintenance. Autom. Constr. 2010, 19, 819–828. [Google Scholar] [CrossRef]
- Paes, D.; Arantes, E.; Irizarry, J. Immersive environment for improving the understanding of architectural 3D models: Comparing user spatial perception between immersive and traditional virtual reality systems. Autom. Constr. 2017, 84, 292–303. [Google Scholar] [CrossRef]
- Li, J.; Jin, Y.; Lu, S.; Wu, W.; Wang, P. Building environment information and human perceptual feedback collected through a combined virtual reality (VR) and electroencephalogram (EEG) method. Energy Build. 2020, 224, 110259. [Google Scholar] [CrossRef]
- Abanda, F.H.; Foguem, B.K.; Tah, J.H.M. BIM—New rules of measurement ontology for construction cost estimation. Eng. Sci. Technol. 2017, 20, 443–459. [Google Scholar] [CrossRef]
- Lee, S.K.; Kim, K.R.; Yu, J.H. BIM and ontology-based approach for building cost estimation. Autom. Constr. 2014, 41, 96–105. [Google Scholar] [CrossRef]
- Ma, Z.; Liu, Z. BIM-based Intelligent Acquisition of Construction Information for Cost Estimation of Building Projects. Proc. Eng. 2014, 85, 358–367. [Google Scholar] [CrossRef] [Green Version]
- Röck, M.; Hollberg, A.; Habert, G.; Passer, A. LCA and BIM: Visualization of environmental potentials in building construction at early design stages. Build. Environ. 2018, 140, 153–161. [Google Scholar] [CrossRef]
- Mora, E.P. Life cycle, sustainability and the transcendent quality of building materials. Build. Environ. 2007, 42, 1329–1334. [Google Scholar] [CrossRef]
- Fadeyi, M.O. The role of building information modeling (BIM) in delivering the sustainable building value. Int. J. Sustain. Built Environ. 2017, 6, 711–722. [Google Scholar] [CrossRef]
- Oyedele, L.O.; Tham, K.W.; Fadeyi, M.O.; Jaiyeoba, B.E. Total building performance approach in building evaluation: Case study of an office building in Singapore. J. Energy Eng. 2012, 138, 25–30. [Google Scholar] [CrossRef]
- Seyfang, G. Community action for sustainable housing: Building a low-carbon future. Energy Policy 2010, 38, 7624–7633. [Google Scholar] [CrossRef] [Green Version]
- Ham, N.; Moon, S.; Kim, J.H.; Kim, J.J. Optimal BIM staffing in construction projects using a queueing model. Autom. Constr. 2020, 113, 103123. [Google Scholar] [CrossRef]
- Chen, H.M.; Chang, K.C.; Lin, T.H. A cloud-based system framework for performing online viewing, storage, and analysis on big data of massive BIMs. Autom. Constr. 2016, 71, 34–48. [Google Scholar] [CrossRef]
- Matthews, J.; Love, P.E.D.; Heinemann, S.; Chandler, R.; Rumsey, C.; Olatunj, O. Real time progress management: Re-engineering processes for cloud-based BIM in construction. Autom. Constr. 2015, 58, 38–47. [Google Scholar] [CrossRef]
- Oraee, M.M.; Hosseini, R.; Edwards, D.J.; Li, H.; Papadonikolaki, E.; Cao, D. Collaboration barriers in BIM-based construction networks: A conceptual model. Int. J. Proj. Manag. 2019, 37, 839–854. [Google Scholar] [CrossRef]
- Lin, Y.C.; Chen, Y.P.; Yien, H.W.; Huang, C.Y.; Su, Y.C. Integrated BIM, game engine and VR technologies for healthcare design: A case study in cancer hospital. Adv. Eng. Inform. 2018, 36, 130–145. [Google Scholar] [CrossRef]
- Mashayekhi, A.; Heravi, G. A decision-making framework opted for smart building’s equipment based on energy consumption and cost trade-off using BIM and MIS. J. Build. Eng. 2020, 32, 101653. [Google Scholar] [CrossRef]
- Du, J.; Zou, Z.; Shi, Y.; Zhao, D. Zero latency: Real-time synchronization of BIM data in virtual reality for collaborative decision-making. Autom. Constr. 2018, 85, 51–64. [Google Scholar] [CrossRef]
- Zhang, Y.; Liu, H.; Kang, S.C.; Al-Hussein, M. Virtual reality applications for the built environment: Research trends and opportunities. Autom. Constr. 2020, 118, 103311. [Google Scholar] [CrossRef]
- Luo, L.; Chen, Y. Carbon emission energy management analysis of LCA-Based fabricated building construction. Sustain. Comput. Inform. Syst. 2020, 27, 100405. [Google Scholar] [CrossRef]
- Kamali, M.; Hewage, K.; Sadiq, R. Conventional versus modular construction methods: A comparative cradle-to-gate LCA for residential buildings. Energy Build. 2019, 204, 109479. [Google Scholar] [CrossRef]
- Santos, R.; Costa, A.A.; Silvestre, J.D.; Pyl, L. Integration of LCA and LCC analysis within a BIM-based environment. Autom. Constr. 2019, 103, 127–149. [Google Scholar] [CrossRef]
- Bueno, C.; Fabricio, M.M. Comparative analysis between a complete LCA study and results from a BIM-LCA plug-in. Autom. Constr. 2018, 90, 188–200. [Google Scholar] [CrossRef]
- Paari, A. Life Cycle Assessment of Cob Building Using BIM+LCA and a Brief Study on Resilience in Cob Buildings; Research and Development project in Engineering; Aarhus University: Aarhus, Denmark, 2019. [Google Scholar]
- Kamari, A.; Laustsen, C.; Petersen, S.; Kirkegaard, P.H. A BIM-Based Decision Support System for the Evaluation of Holistic Renovation Scenarios. J. Inform. Technol. Constr. 2018, 23, 354–380. Available online: http://www.itcon.org/2018/18 (accessed on 22 October 2019).
- Khosakitchalert, C.; Yabuki, N.; Fukuda, T. Automated modification of compound elements for accurate BIM-based quantity takeoff. Autom. Constr. 2020, 113, 103142. [Google Scholar] [CrossRef]
- Cheung, F.K.T.; Rihan, J.; Tah, J.; Duce, D.; Kurul, E. Early stage multi-level cost estimation for schematic BIM models. Autom. Constr. 2012, 27, 67–77. [Google Scholar] [CrossRef]
- Kothari, C.R. Research Methodology: Methods and Techniques, 2nd ed.; New Age International (P) Limited: New Delhi, India, 2004; ISBN 9788122415223. [Google Scholar]
- Autodesk. Revit Architecture 2019 (Student V) Computer Software. Available online: https://www.autodesk.com/products/revit/overview (accessed on 3 December 2019).
- One Click LCA. Helsinki Bionova Ltd. 2019 (V 1.0.0.181) [Computer Software]. Available online: https://www.oneclicklca.com/ (accessed on 28 January 2020).
- Sigma Estimates. Sigma Estimates 2019 (V 7.0.0.11822) Computer Software. Available online: https://sigmaestimates.com/about-sigma-estimates/ (accessed on 28 January 2020).
- Mujber, T.S.; Szecsi, T.; Hashmi, M.S.J. Virtual reality applications in manufacturing process simulation. J. Mater. Process. Technol. 2004, 155–156, 1834–1838. [Google Scholar] [CrossRef]
- Enscape. Enscape™ 2019 (V 2.8) Computer Software. Available online: https://enscape3d.com/ (accessed on 16 February 2020).
- Park, K.; Kim, D.; Han, S.H. Usability of the size, spacing, and operation method of virtual buttons with virtual hand on head-mounted displays. Int. J. Ind. Ergon. 2020, 76, 102939. [Google Scholar] [CrossRef]
- Imtaiaz, A. Configurations of Knowledge Intensive Processes and Collaborative Technologies; Apprimus Wissenschaftsverlag: Aachen, Germany, 2016. [Google Scholar]
- Malhotra, N.K.; Birks, D.F.; Wills, P. Marketing Research: An. Applied Approach, 4th ed.; Pearson Education: Harlow, UK, 2012; ISBN 9780273725855. [Google Scholar]
- Microsoft Corporation. Microsoft Excel 2020 Computer Software. Available online: https://www.microsoft.com/en-us/microsoft-365/excel (accessed on 3 March 2020).
- Galarnyk, M. Understanding Box Plots. Available online: https://towardsdatascience.com/understanding-boxplots-5e2df7bcbd51 (accessed on 18 March 2020).
- IBM Corp. IBM SPSS Statistics for Windows 2020, V 26.0. Computer Software IBM Corp. Available online: https://www.ibm.com/products/spss-statistics (accessed on 16 February 2020).
- Allan, R.R. Boxplots. Significance 2005, 2, 134–135. [Google Scholar] [CrossRef]
- Stephanie, G. Sig (2-Tailed): Interpreting Results. Satistics How To, 2017. Available online: https://www.statisticshowto.com/sig2-tailed-interpreting-results/ (accessed on 21 March 2020).
- Laerd Statistics. Mann-Whitney U Test Using SPSS Statistics. Available online: https://statistics.laerd.com/spss-tutorials/mann-whitney-u-test-using-spss-statistics.php (accessed on 13 April 2020).
- Laerd Statistics. Testing for Normality Using SPSS Statistics. Available online: https://statistics.laerd.com/spss-tutorials/testing-for-normality-using-spss-statistics-2.php (accessed on 20 April 2020).
- Subed, B.S. Using Likert Type Data in Social Science Research: Confusion, Issues and Challenges. Int. J. Contemp. Appl. Sci. 2016, 3, 36–49. [Google Scholar]
- Douven, I.A. Bayesian perspective on Likert scales and central tendency. Psychon. Bull. Rev. 2018, 25, 1203–1211. [Google Scholar] [CrossRef] [PubMed]
- Kamari, A.; Kirkegaard, P.H. Potential shift of Integrated Design (ID) through BIM in Sustainable Building Renovation. In Proceedings of the Sustainable Built Environment (SBE) Cardiff 2019, Cardiff, UK, 24–25 September 2019; IOP Publications: Bristol, UK, 2019. [Google Scholar]
- Kamari, A.; Pimplikar, S.S. Building Information Modeling (BIM)—Concerns and Solutions in Constructability Review and Analysis Process. NBM CW Int. J.Technol. 2013, 2, 172–185. [Google Scholar]
- Kamari, A.; Jensen, S.; Christensen, M.L.; Petersen, S.; Kirkegaard, P.H. A Hybrid Decision Support System (DSS) for Generation of Holistic Renovation Scenarios—Case of Energy Consumption, Investment Cost, and Thermal Indoor Comfort. Sustainability 2018, 10, 1255. [Google Scholar] [CrossRef] [Green Version]
- Kamari, A.; Schultz, C.; Kirkegaard, P.H. Constraint-based Renovation Design Support through the Renovation Domain Model. Autom. Constr. 2019, 104, 265–280. [Google Scholar] [CrossRef]
- Kamari, A.; Kirkegaard, P.H.; Schultz, C. PARADIS: A process integrating tool for rapid generation and evaluation of holistic renovation scenarios. J. Build. Eng. 2020, 101944. [Google Scholar] [CrossRef]
- Charef, R.; Alaka, H.; Emmitt, S. Beyond the third dimension of BIM: A systematic review of literature and assessment of professional views. J. Build. Eng. 2018, 19, 242–257. [Google Scholar] [CrossRef]


| - A - Original Facade | 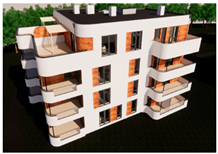 |  |
| - B - Brick Facade | 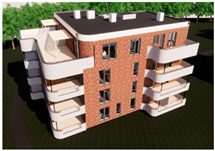 |  |
| - C - Steel Facade | 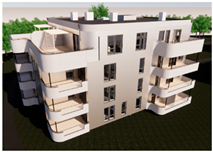 |  |
| - D - Wood Facade | 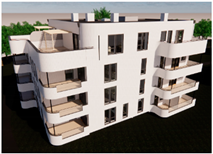 | 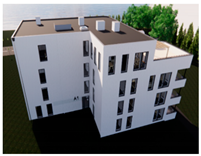 |
| - E - Marble Facade |  | 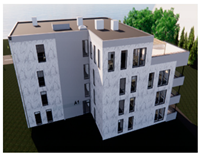 |
| - F – Travertine Facade | 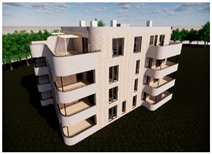 | 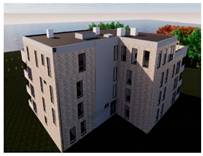 |
| - G - Exposed Concrete Facade | 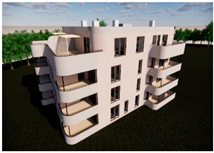 |  |
| Facade | Costs (Incl. Tax) (DKK) | Kg.CO2 eq. (Tons) | |
|---|---|---|---|
| A | Original | 1,842,353.08 | 1759 |
| B | Brick | 1,723,662.62 | 1511 |
| C | Steel | 2,344,431.97 | 1932 |
| D | Wood | 1,735,767.70 | 1508 |
| E | Marble | 2,067,248.72 | 1506 |
| F | Travertine | 1,955,400.48 | 1491 |
| G | Exposed Concrete | 1,652,021.26 | 1492 |
| Design Alternatives | Images | QR Codes |
|---|---|---|
| - A - Original Facade | 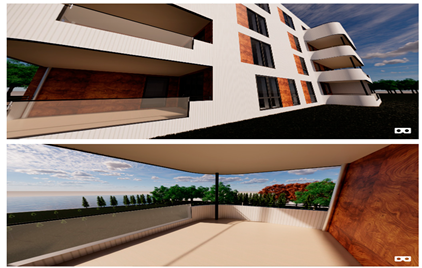 |  |
| - B - Brick Facade | 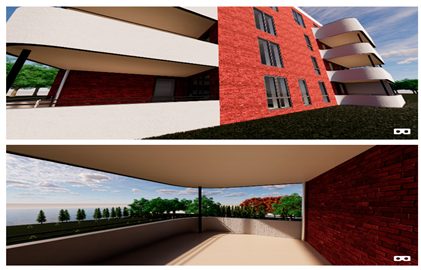 |  |
| - C - Steel Facade | 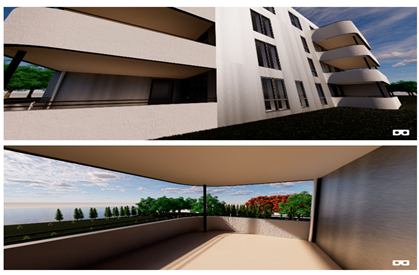 |  |
| - D -Wood Facade |  |  |
| - E - Marble Facade | 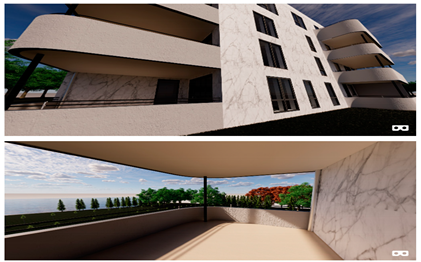 |  |
| - F - Travertine Facade | 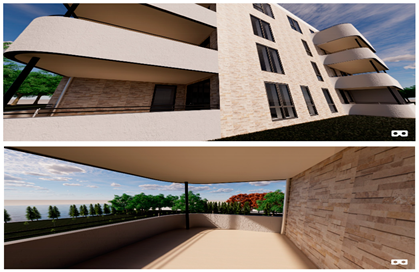 |  |
| - G - Exposed Concrete Facade |  |  |
| Facades | Costs | Carbon Footprint | Visual Style | As Resident | Value to Cost | Maintenance |
|---|---|---|---|---|---|---|
| Original | ||||||
| Brick | ||||||
| Steel | ||||||
| Wood | ||||||
| Travertine | ||||||
| Marble |
| Q. No. | Factors | Score |
|---|---|---|
| 1. | Do you use BIM for your work/projects? | |
| 2. | Do you think cost estimation is essential in a construction project? | |
| 3. | Do you think knowing the carbon footprint of a building is essential? | |
| 4. | Have you used VR before? | |
| 5. | To what extent, that you are aware of, is VR used in construction projects? | |
| 6. | Do VR models improve your perception of costs associated with different façades alternatives? | |
| 7. | Do VR models improve your perception of the carbon footprint associated with different façades and your decision? | |
| 8. | After knowing the experimental results, did the 360-degree VR images affect your existing perception of costs and the carbon footprint of building façade systems? | |
| 9. | Do you think using BIM + VR can help design efficient and sustainable buildings in the future, based on your current experience? | |
| 10. | Do you envision a better tomorrow, where the goals of reducing global warming and making your country carbon neutral are attained? |
| Test for Normality | ||||
|---|---|---|---|---|
| Questions | Background | Shapiro-Wilk | ||
| Statistic | df | Sig | ||
| 1. Do you use BIM for your work/projects? | N-CE | 0.610 | 36 | 0.000 |
| CE | 0.857 | 30 | 0.001 | |
| 2. Do you think cost estimation is essential in construction projects? | N-CE | 0.795 | 36 | 0.000 |
| CE | 0.577 | 30 | 0.000 | |
| 3. Do you think knowing the carbon footprint of a building is essential? | N-CE | 0.746 | 36 | 0.000 |
| CE | 0.628 | 30 | 0.000 | |
| 4. Have you used VR before? | N-CE | 0.872 | 36 | 0.001 |
| CE | 0.873 | 30 | 0.002 | |
| 5. To what extent, that you are aware of, is VR used in construction projects? | N-CE | 0.885 | 36 | 0.001 |
| CE | 0.800 | 30 | 0.000 | |
| 6. Do VR models improve your perception of costs associated with different facades? | N-CE | 0.727 | 36 | 0.000 |
| CE | 0.882 | 30 | 0.003 | |
| 7. Do VR models improve your perception of the carbon footprint associated with different facades? | N-CE | 0.743 | 36 | 0.000 |
| CE | 0.830 | 30 | 0.000 | |
| 8. After knowing the experimental results, did the VR models affect your perception of costs and carbon footprint of building façade systems? | N-CE | 0.624 | 36 | 0.000 |
| CE | 0.780 | 30 | 0.000 | |
| 9. Do you think using BIM + VR can help design efficient and sustainable buildings in the future, based on your current experience? | N-CE | 0.773 | 36 | 0.000 |
| CE | 0.579 | 30 | 0.000 | |
| 10. Do you envision a better tomorrow, where the goals of reducing global warming and making your country carbon neutral are attained? | N-CE | 0.243 | 36 | 0.000 |
| CE | 0.180 | 30 | 0.000 | |
| Questions | Mean Overall | Mean N-CE | Mean CE | p-Value | Significant Difference |
|---|---|---|---|---|---|
| 1. Do you use BIM for your work/projects? | 2.52 | 1.58 | 3.63 | 0.000 | Yes |
| 2. Do you think cost estimation is essential in construction projects? | 4.39 | 4.14 | 4.70 | 0.003 | Yes |
| 3. Do you think knowing the carbon footprint of a building is essential? | 4.44 | 4.28 | 4.63 | 0.062 | No |
| 4. Have you used VR before? | 2.44 | 2.25 | 2.67 | 0.255 | No |
| 5. To what extent, that you are aware of, is VR used in construction projects? | 3.12 | 2.47 | 3.90 | 0.000 | Yes |
| 6. Do VR-models improve your perception of costs associated with different facades? | 3.79 | 3.92 | 3.63 | 0.494 | No |
| 7. Do VR models improve your perception of the carbon footprint associated with different facades? | 3.64 | 3.72 | 3.45 | 0.878 | No |
| 8. After knowing the experimental results, did the VR models affect your perception of costs and the carbon footprint of building façade systems? | 4.44 | 4.67 | 4.17 | 0.028 | Yes |
| 9. Do you think using BIM + VR can help design efficient and sustainable buildings in the future, based on your current experience? | 4.39 | 4.19 | 4.63 | 0.002 | Yes |
| 10. Do you envision a better tomorrow, where the goals of bringing downreducing global warming and making your country carbon neutral are attained? | 4.89 | 4.83 | 4.97 | 0.643 | No |
Publisher’s Note: MDPI stays neutral with regard to jurisdictional claims in published maps and institutional affiliations. |
© 2020 by the authors. Licensee MDPI, Basel, Switzerland. This article is an open access article distributed under the terms and conditions of the Creative Commons Attribution (CC BY) license (http://creativecommons.org/licenses/by/4.0/).
Share and Cite
Kamari, A.; Paari, A.; Torvund, H.Ø. BIM-Enabled Virtual Reality (VR) for Sustainability Life Cycle and Cost Assessment. Sustainability 2021, 13, 249. https://doi.org/10.3390/su13010249
Kamari A, Paari A, Torvund HØ. BIM-Enabled Virtual Reality (VR) for Sustainability Life Cycle and Cost Assessment. Sustainability. 2021; 13(1):249. https://doi.org/10.3390/su13010249
Chicago/Turabian StyleKamari, Aliakbar, Ashwin Paari, and Henrik Øien Torvund. 2021. "BIM-Enabled Virtual Reality (VR) for Sustainability Life Cycle and Cost Assessment" Sustainability 13, no. 1: 249. https://doi.org/10.3390/su13010249
APA StyleKamari, A., Paari, A., & Torvund, H. Ø. (2021). BIM-Enabled Virtual Reality (VR) for Sustainability Life Cycle and Cost Assessment. Sustainability, 13(1), 249. https://doi.org/10.3390/su13010249