Article

Extraction Method and Integration Framework for Perception Features of Public Opinion in Transportation

1
College of Transportation Engineering, Tongji University, Shanghai 201804, China
2
Key Laboratory of Road and Traffic Engineering of the State Ministry of Education, Tongji University, Shanghai 201804, China
3
Shanghai Key Laboratory of Rail Infrastructure Durability and System Safety, Tongji University, Shanghai 201804, China
4
China Mobile Communications Corporation, Shanghai 201206, China
*
Author to whom correspondence should be addressed.
Sustainability 2021, 13(1), 254; https://doi.org/10.3390/su13010254
Submission received: 18 November 2020 / Revised: 23 December 2020 / Accepted: 25 December 2020 / Published: 29 December 2020

Abstract

:
To better facilitate government management and planning based on public opinion, it is essential to propose a method for extracting public opinion perception features in consideration of an integrated framework, which aims at industry monitoring and decision-making. Based on fundamental characteristics of ordinary traffic incidents, this paper develops a perception features system of public opinion consisting of four modules, where the construction methods have been elaborated. First, mining thematic features is realized via the similarity calculation of text vector. Second, based on summarized Chinese expression patterns, time extraction rules, and a five-layer tree-like spatial feature thesaurus are established to extract spatiotemporal features. Third, the modeling of the emotional features is achieved by a dictionary-based analysis model. Fourth, the evolutional features are extracted by the Exponential Generalized Autoregressive Conditional Heteroscedasticity (EGARCH). In view of the attributes of each module, an integrated framework is built to determine the collaboration relationship of feature indicators. Finally, a case study of Shenzhen public transport has been performed to illustrate the application of proposed methods. Results show that the strong odor in electric buses and a rumor that electric buses have great radiation are two main causes of the decrease in passenger satisfaction in the first quarter of 2017. In contrast, adding new bus lines, increasing service frequency, and guaranteeing the bus-lane right will improve passenger satisfaction, which is basically consistent with the official report. It should be noticed that the developed framework has been validated in the case study of passenger satisfaction analysis, while it can be extensively replicated in other fields. Furthermore, it is important for stakeholders to grasp the public perception of transportation services, in order to enhance public participation in transportation management and decision-making.

1. Introduction

Many factors affect the formulation of public policy, among which public participation is a part worthy of attention [1,2]. Reasonable public participation can not only improve the scientific rigor and effectiveness of policies but also reduce the resistance to policy implementation [3,4]. Traditionally, public opinions are captured by questionnaires and interviews for the problem owners [5,6]. However, these methods usually suffer from disadvantages, including being costly, time-consuming, and having complicated interactions with human subjects [7,8]. To make up for these limitations, a more efficient collection method is needed. Fortunately, the strong growth of textual data volume and advancements within natural language processing (NLP) provides a new way to solve this problem [9,10,11]. Public opinion analysis has emerged to meet this need.
Public opinion generally derives from the emotions and opinions that people express and hold with the occurrence, development, and variation of social events [12]. Transportation public opinion is a branch of public opinion research and an embodiment of public opinion research in specific fields. Besides, perception features are extracted in the process of cognition after processing and interpretation, which are distinguished from the general unexplained characteristics [13]. The perception features of transportation public opinion are ones obtained by mining, interpreting, and abstracting the data of public opinion under transportation knowledge. Compared with other public opinions, transportation public opinion is unique in the following two ways:
  • The evolutional features of transportation public opinion are more obvious. Transportation incidents directly affect the benefits of travelers. As a characteristic of transportation, Mobility as a Service (MaaS) extended its relationship with the national economy and people’s livelihood. Besides, the change of public opinion is closely related to the evolution of traffic incidents and the performance of disposal. Hence, negative public opinion could put great pressure on industry management, if handled improperly [14].
  • The incident-cause factors of transportation are more complicated. Since the occurrence of incidents may involve many factors including infrastructure construction, operation management, passengers’ service, and surrounding circumstance. On top of that, the subjective factors are usually mixed with objective factors, and it is hard to distinguish them [15].
Therefore, it is unreasonable to simply apply general public opinion methods to the transportation field. This article aims to combine the overall features and specificity of traffic incidents. The overall characteristics of traffic incidents can be reflected by the perception features of transportation public opinion. Mining core topics of public concern and mastering the overall trend of incidents are the basis of realizing situation awareness and safety management. It is important to apply perception features of public opinion reasonably for industry management and governance [16,17]. Due to the complexity and expansivity of traffic incidents, partial perception features cannot grasp the full extent of incidents when used alone. Instead, the collaborative relationship among features should be clarified based on the integrated perception features to achieve corresponding applications, which is also a highlight of this paper.
The remainder of this article is structured as follows. The literature review related to extraction methods and applications is introduced in Section 2. Then the construction and extraction methodology adopted in the perception features’ system is described in Section 3. After that, the detailed case analysis is presented in Section 4. Finally, conclusions are drawn in Section 5.

2. Literature Review

Thematic features and emotional features continue to be an important area of research with many practical implications, which are an important part of perception features. As for the former, Haghighi developed a topic modeling framework by Latent Dirichlet Allocation (LDA), which was used to extract Twitter results related to the performance of public transportation service, and evaluate passengers’ feedback on service by emotion analysis based on machine learning [18]. What’s more, Ali proposed a topic modeling and word embedding method by ontology and LDA for sentiment analysis, aimed at urban traffic congestion. However, it is not accurate, since some irrelevant words were regarded as emotional words [19]. For the latter, Farman proposed fuzzy ontology-based sentiment analysis and semantic web rule language (SWRL) rule-based decision-making to monitor transportation activities (accidents, vehicles, street conditions, etc.) and to make a city-feature polarity map for travelers [20]. On top of that, Chakraborty applied four different dictionary-based methods, including Bing, to evaluate emotion from Twitter, and to grasp public will in the process of transportation policy implementation [21].
In contrast, as one of the perception features, spatiotemporal features is becoming a research hotspot. Evolutional features, however, has rarely appeared so far. Zhang mined public opinion texts from social media based on a deep belief network and long-short term memory model and analyzed several important issues of a traffic accident detection, mainly considering factors including location and time deviation [22]. Similarly, to capture public opinions, extract spatial and temporal features, Li applied the Rost for sentiment analysis and topic modeling based on Latent Dirichlet Allocation [23]. What’s more, Ahmed used the term frequency-inverse document frequency (TF-IDF) to transform public opinion text into feature vectors, adopted unsupervised machine learning to implement topic modeling, and built a geographic label identifier based on the list of city main locations and roads [24]. Furthermore, Gu proposed an improved Bayesian combination model based on deep learning for short-term traffic volume prediction, whose case further illustrated the importance of spatiotemporal features to public opinion [25].
A majority of existing applications focus on special events including traffic accidents and congestion. To dynamically identify and verify the location of traffic accident black spots and the panorama of traffic violation incidents with measurable confidence, Sinnott proposed a software system considering cloud technology to associate historical blackspots’ information with Twitter data [26]. On top of that, to obtain major and minor news events from Twitter in real-time, Hasan developed a traffic incident monitoring system, based on the reverse index and incremental clustering [27]. Similarly, to perceive, detect, and represent urban traffic accidents, Lu adopted an event fusion model based on Word2vec [28]. To make up for data annotation insufficiencies and improve the quality of training data and stability, Cao built a traffic situation prediction model based on emotion analysis and semi-supervised learning methods, which adopted Conditional Generative Adversarial Networks [29]. Besides, to predict road conditions and detect abnormal data point, Monica developed the unstructured data processing based on NLP, and completed text classification and features extraction based on machine learning [30]. Furthermore, to realize the urban traffic prediction, Essien put forward a model based on deep learning and a bidirectional long-short term memory model considering public opinion and weather data sets [31].
Following an extensive review of current literatures, we identify the following four current challenges which have not been sufficiently addressed [32,33,34,35,36,37].
  • The establishment of public opinion perception features system for transportation management is still developing.
  • Existing approaches mainly focus on thematic features and emotional features, with very limited attention to spatiotemporal features and evolutional features.
  • A majority of existing applications focus on partial perception features, normally overlooking the value of the integrated features system.
  • Social media is increasingly being applied in special traffic events, while other applications, aiming at general traffic incidents based on their sources and fundamental characteristics, are frequently ignored in current research.
Addressing these limitations, this paper designed and developed an integrated framework and methods about perception features’ extraction of public opinion in transportation. Based on the proposed methods, we present the following research contributions:
  • Based on the public opinion life cycle, we establish the transportation public opinion perception features system, devoted to traffic monitoring and decision-making. We set up four primary-aspect features, like thematic feature and spatiotemporal feature, and eleven secondary-aspect features such as time and location.
  • Exploring extraction methods of public opinion perception features. Establishing a set of perceptual feature extraction methods and an integrated application framework suitable for transportation public opinion. This integrated application framework focuses on improving the spatiotemporal feature analysis method and evolutional feature modeling ideas.
  • Using Shenzhen bus as the case, mining the relationship between satisfaction and bus service index, clarifying the specific content of people’s satisfaction and dissatisfaction, and proving the feasibility and reliability of this method.

3. Method: Construction and Extraction Methodology of Perception Features System

The construction of the perception features system is explained at the beginning, followed by the calculation methods of thematic features, spatiotemporal features, emotional features, and evolutional features. Finally, the integration framework of perception features is elaborated. The research framework is shown in Figure 1.

3.1. Perception Features System of Public Opinion in Transportation

The perception feature is the one obtained after processing and interpretation, while the general feature is the one directly obtained without interpretation. In this paper, the construction of transportation perception features aims to extract information from public opinion and facilitate government management based on the support of industry knowledge background.
Considering the principles of purpose, science, and practicability, the perception features system for public opinion of general traffic incidents targeting traffic monitoring and decision-making is summarized from traffic incidents mentioned in the existing literatures, as shown in Table 1.
  • Thematic features: Only when the thematic feature of transportation public opinion is identified, can the involved type of transportation problems be classified properly. Besides, transportation public opinion is normally caused by traffic incidents, so it is critical to classify traffic incidents. By analyzing key traffic events in recent years, it is found that involved incidents mainly include traffic accidents, traffic congestion caused by meteorological disasters and road maintenance, traffic control, and shared transport. Combined with the classification of traffic incidents and the topic of public concern, features can be clearly defined.
  • Spatiotemporal features: The occurrence of traffic accidents and traffic congestion takes on strong characteristics of time and space; meanwhile, traffic control and shared transport have strong spatial geographical characteristics. Hence, it is scientific and practical to determine spatiotemporal features, which are helpful in analyzing the specific time and space of traffic incidents and in guiding transportation public opinion from the source.
  • Emotional features: To judge people’s attitudes toward specific traffic events efficiently, emotional features are developed, which are helpful for administrators to grasp public opinion accurately and make reasonable decisions. What’s more, the effectiveness of decisions can be evaluated by comparing emotional status before and after implementations.
  • Evolutional features: To monitor the dynamic development trend of traffic incidents and take corresponding measures reasonably, evolutional features are built, based on the lifecycle of public opinion from the occurrence to development to extinction. As for positive trends, managers should continue to consolidate relevant measures, and corresponding early warnings should be made promptly to prevent negative trends.

3.2. Extraction Method of Perception Features

3.2.1. Thematic Features

Text categorization is the key to thematic feature extraction of transportation public opinion. Before that, texts need to be transformed into feature vectors. While language units of texts include words, phrases, etc., it is generally thought that words as characters are better than phrases [41]. As a result, we apply text vectorization based on the vector space model. To start with, each text is represented as a vector in an n-dimensional vector space, and each dimension of the vector corresponds to a feature item. The variable ω f i denotes the weight of the featured item f i in the text vector, which indicates the ability and importance of the feature in describing the semantic content of a text, as expressed below.
V = ω f 1 , ω f 2 , ω f n
Generally, words are selected as feature items of a text; meanwhile, TF-IDF is used as the weight of each word [23], where T F f i denotes the frequency of the word f i in this text. The higher the value, the more important, where D denotes the total number of texts in the corpus and D i denotes the number of texts containing the word f i in the corpus. The variable l o g 2 D D i is a reflection of inverse document frequency, which means the difficulty to identify text types by it increases with the increase of the word f i appears, as expressed below.
T F I D F f i = T F f i · log 2 D D i
TF IDF is generally normalized in each text to exclude the influence of text length and the weight   ω f i of the word f i is obtained, as expressed below.
ω f i =   T F I D F i k n T F I D F k
Next, the classification problem is transformed into calculating the similarity between the text vector to be classified and the known thematic vector. More specifically, the text to be classified is categorized into a topic when they have the largest similarity. Following this, the thematic classification model is built by the cosine similarity of vectors.
Suppose the text vector to be classified is X   =   x 1 , x 2 , , x n , and the classified text vector is β i   =   β i 1 , β i 2 , , β i m , where β i represents five types of topic vectors, { β i   |   β 1   =   traffic   congestion ,   β 2   =   traffic   accident ,   β 3   =   shared   transport ,   β 4   =   traffic   control ,   β 5   =   other   categories } . The formula is as follows:
S i m i l a r i t y β i =   x 1 β i 1 + x 2 β i 2 + + x n β i n x 1 2 + x 2 2 + + x n 2   β i 1 2 + β i 2 2 + + β i m 2
C l a s s X = arg m a x β i S i m i l a r i t y β i
where S i m i l a r i t y β i denotes similarity between X   and β i , and C l a s s X is the thematic type of X . It is noteworthy that the dimension of X is lower than β i , therefore only the eigenvalue ω f i of the common characteristic item f i between X and β i needs to be reckoned when calculating the molecule of Equation (4), which can reduce the complexity of calculation.
Finally, it is necessary to calibrate the model parameter   β i j before using this model. Texts in each type of training set are merged to obtain five types of text data corresponding to five categories of topics. Following this, the text vector set { β i } is obtained and then calibration of model parameters is completed.

3.2.2. Spatiotemporal Features

Part 1: Extraction Method for Temporal Features Based on Rules
Numerals and nouns are normally used to express time, which has a fixed collocation when they constitute a time phrase called time expression pattern. Based on a large number of public opinion texts, five common patterns of time expression in Chinese are summarized, as shown in Table 2.
According to the establishment of time expression pattern, the problem of time feature extraction is transformed as an assignment of identifying time expression patterns. The first step is to separate the text to get a string of words. The time expression pattern is then identified based on the following strategies:
  • From the first word, compare them with the words in the database of pattern N. If there exists the same word, it will be judged as N mode, and the word will be taken out as a time feature of the text until all words are tested.
  • From the first word, judge whether the word is a numeral and if so, continue to judge the unit next to the numeral. Case 1: If it is a noun, compare it with the temporal noun database. Following this, if the same word is found, it is identified as the pattern of Num + N, and it is taken out as the time feature of the text. Case 2: If there is a symbol “:”, “.” or “/”, it will then continue to be tested whether the unit next to the word is a numeral. If so, it will be recognized as a pattern of Num: Num, Num. Num, or Num/ Num, which is taken out as the time feature of the text until all the words are tested.
It should be noted that word sequences need to be traversed twice, since there may be multiple time features extracted from a text. Meanwhile, sentences of time expression patterns should be extracted together with their contexts to understand different time features.
Part 2: Extraction Method for Spatial Feature Based on the Spatial Lexicon
Spatial geographic information generally exists in transportation public opinion events [13,14]. Based on a large amount of network text data, the expression of spatial information is normally composed of one or more of the country name, province name, city name, transport facility name, noun of locality, and distance phrase. As a result, the spatial feature of the text can be obtained if the above words are identified and arranged according to the spatial range of their expression.
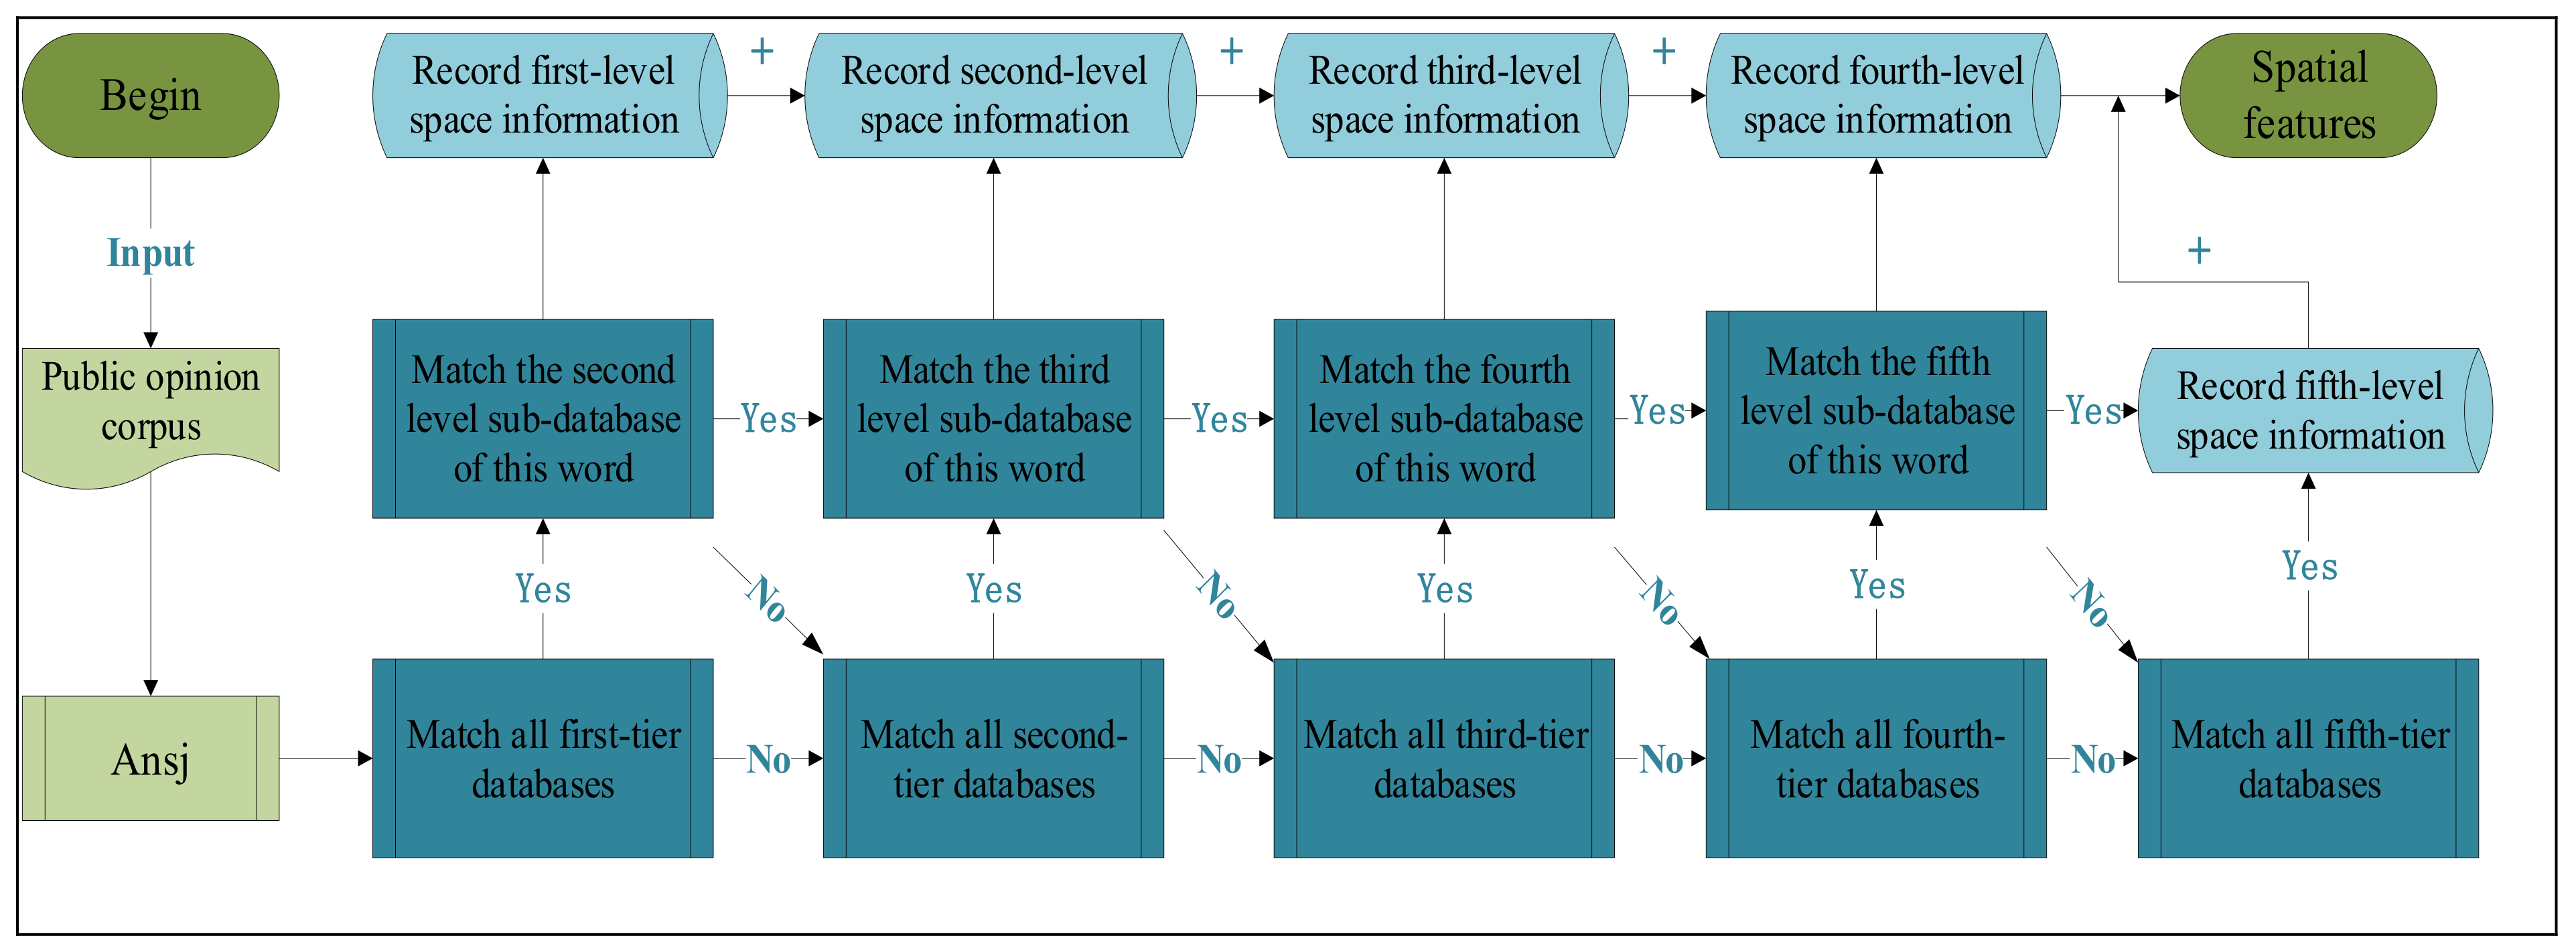
To identify the spatial information, it is necessary to build a spatial feature thesaurus. Therefore, a five-layer tree-like spatial feature thesaurus is established considering administrative divisions of China. The nation is the first layer, including China, United States, United Kingdom, and so on. The second layer is the thesaurus of “province, autonomous region, and state” under the category of countries. For example, Hebei belongs to China. The city lexicon is the third layer, which is the sub-database of the second layer. For instance, Hangzhou is a sub-database of the Zhejiang database, while the municipality under the central government is directly subordinate to the specific countries in the first layer, such as Shanghai, which is the sub-database of China library. The fourth level is the vocabulary “district, county, township”, which belongs to the specific cities in the third layer, such as Yangpu district belonging to Shanghai database. The fifth layer is transport facilities vocabulary, including the road section name, station name, etc., which are the sub-database of the fourth layer library. At this time, the construction of a five-layer tree-like spatial feature thesaurus is completed.
To begin with, by comparing words in the thesaurus with those in the public opinion corpus, spatial words contained in the public opinion corpus are mined. In the subsequent stage, they are arranged from small to large according to the number of layers, and spatial geographic information can be then extracted. Finally, the following extraction strategy is designed, as shown in Figure 2.

3.2.3. Emotional Features

Emotional feature analysis models mainly include a dictionary-based analysis model and a machine learning-based analysis model [19]. The former generally judge the relationship between text and a pre-defined dictionary, considering the frequency and polarity of words, to obtain their emotional tendency [20]. The latter is essentially a text classifier, which extracts sequence rules by training sequential texts with labels to identify text polarity [18]. However, not only does machine learning consume a lot of manual annotation, but the model obtained is only suitable for a specific field and is difficult to apply to different texts [21]. Consequently, based on the emotional analysis model, we chose to establish a dictionary. In common Chinese emotional polarity dictionaries, such as China National Knowledge Infrastructure (CNKI) and National Taiwan University Sentimental Dictionary (NTUSD), there is a lack of emotional words in the field of transportation, such as congestion or traffic accidents. It is essential to build a transportation emotional dictionary [42].
P 0 = fast ,   smooth ,   convenient ,   comfortable   is defined as the seed of positive emotional words, and we regard N 0 = {slow, congestion, car accident, chaos} as the seed of negative emotional words. Based on HIT Word-Forest, which is an authoritative dictionary, the synonyms and antonyms of the seed set are matched and expanded to get   seed P 1 and seed N 1 . Iteration is conducted k times, and stops when the number of seed sets ( seed P k and seed N k ) remains stable. It then needs to be integrated with CNKI and NTUSD. To deal with the rich network vocabularies, it is necessary to add “Lanshou (sad)”, “Xianggu (want to cry)” and other network emotional words to form the final transportation emotional dictionary.
Also, the emotional tendency of texts mainly depends on nouns, verbs, adverbs, and adjectives. There are fixed collocations in the formation of emotional tendency in grammar, which are called emotional patterns. Mining emotional patterns in texts can reduce dimensionality, eliminate neutral words, and decrease the complexity of tendentious calculation. Five common emotional patterns in Chinese are then summarized, as shown in Table 3, in which sentimental words are ones appearing in emotional dictionaries. Adverbs of degree can change the degree of emotional tendencies. Therefore, it is essential to define the influence weight of adverbs of degree on emotion, which is set based on the level of degree adverbs defined in CNKI, as shown in Table 4.
Suppose the emotional tendencies are presented as Sentiment Ψ i , i = 1 5 , which respectively represent five emotional patterns. The weight of adverbs of degree is
Sentiment S   =   P o l a r i t y ω s
Sentiment DS   =   W e i g h t ω d × P o l a r i t y ω s
Sentiment NS   =   1 n P o l a r i t y ω s
Sentiment DNS   =   1 n   W e i g h t ω d P o l a r i t y ω s
  Sentiment NDS   =   1 n P o l a r i t y ω s W e i g h t ω d
W e i g h t ω d . The following model is established to calculate the affective tendencies of each emotion pattern.
Polarity ω s denotes the polarity of the emotional word ω s (−1 or 1), and n is the number of negative words. (6): The emotional polarity of phrase (S), containing only emotional words, is determined by the polarity of emotional words. (7): The phrase with adverbs of degree (DS) needs to be multiplied by the corresponding weight. (8): The negative word plays a role in reversing the emotional polarity (NS), and its weight is −1. (9): sequence between adverbs of degree and negative words determines the strength of their change for emotional polarity. When the adverb of degree plays a role in strengthening negation (DNS), the effect of both is positive. (10): When negative words play a role in weakening the adverb of degree (NDS), the effect of both is reversed, so the weight of the adverb of degree becomes the previous reciprocal.
To eliminate the influence of text length on text polarity, the overall polarity of a text is normalized, which also facilitates the comparison of emotional polarity between different texts. When Sentiment T is the overall sentiment of the text, Positive Ψ m i and Negative Ψ l i are the emotional polarity of positive and negative emotion patterns respectively. Formula (11) represents the ratio of positive sentiment to the total sentiment of the text, and the calculation result is in the interval of [0, 1], as expressed below.
Sentiment T   =   m M Positive Ψ m i m M Positive Ψ m i +   l L Negative Ψ l i
Set threshold 0 < λ 1 λ 2 < 1 and the emotional polarity discriminant of the text are shown in (12). The threshold should be set according to actual application scenarios, and judgment of emotional polarity should be made as accurately as possible.
Polarity T   =   positive ,   λ 2 < sentiment T neutral ,   λ 1   sentiment T   λ 2 negative ,   sentiment T <   λ 1

3.2.4. Evolutional Features

The evolution of online public opinion has been studied both quantitatively and qualitatively, and the majority of these works regard the number of web pages obtained as a quantitative indicator, which can reflect the evolution of network public opinion to some extent [43]. However, there are still shortcomings in characterizing evolution. Public opinion is divided into positive and negative, before transforming each other, which may lead to a situation where the quantity of public opinion is not changed while qualitative change occurs. Therefore, for traffic managers, it is more meaningful to raise the positive public opinion and lower negative public opinion as much as possible, compared with decreasing the total amount of public opinion.
Suppose the measurement index of positive public opinion is r p t , and that of a negative item is r n t . Meanwhile, the number of positive news on social media is x p t , and the amount of forwarding is y p t . In addition, the number of negative news is x n t , the forwarding amount is y n t , and t is the cycle period, which takes a positive integer. Then, the calculation method for evolution characteristics measurement index in transportation public opinion is as follows:
r p t   =   x p t y p t     x p t 1 y p t 1 x p t 1 y p t 1
r n t   =   x n t y n t     x n t 1 y n t 1 x n t 1 y n t 1
To eliminate influence from the number of comments and analyze evolution rules of public opinion, the measurement index of evolutional features is represented by the change rate of the positive and negative number of public opinion ( r p t , r n t ). Based on the time series of change rates, we find that it has a leverage effect. Then, to represent the characters well, EGARCH is selected to model the evolution of public opinion, which is often used to describe and predict change rules [44]. Suppose time series of positive transportation public opinion is r p t , t = 1, 2, …, which represents the fluctuation of public opinion and the EGARCH model of r p t is built as follows:
r p t   =   i = 1 h β i r p t i + u t
u t =   σ t ε t
n σ t 2 = α 0 + j = 1 p a j l n σ t j 2 + i = 1 q λ i ε t i E ε t i + γ i ε t i
where r p t i is the independent variable as well as the i -order lag term of the dependent variable. β i denotes the coefficient of the independent variable and u t , which is an error term, obeys generalized error distribution (GED) with zero mean and unit variance. Besides,   ε t is a random perturbation term, which is independent of u t , and σ t is the conditional variance of u t . The conditional variance on the left side of (17) uses natural logarithm, which means σ t is nonnegative and the leverage effect is exponential. The parameter λ i is introduced into conditional, when the random disturbance term ε t i is a positive or negative value, and conditional variance will make a change. If λ i < 0 , then change of σ t 2 caused by a negative disturbance is larger than that caused by a positive disturbance, and vice versa. Therefore, the Exponential Generalized Autoregressive Conditional Heteroscedasticity (EGARCH) does reflect the leverage effect in the sequence change. The modeling of r n t is analogous to r p t .

3.3. Integrated Framework for Perception Features

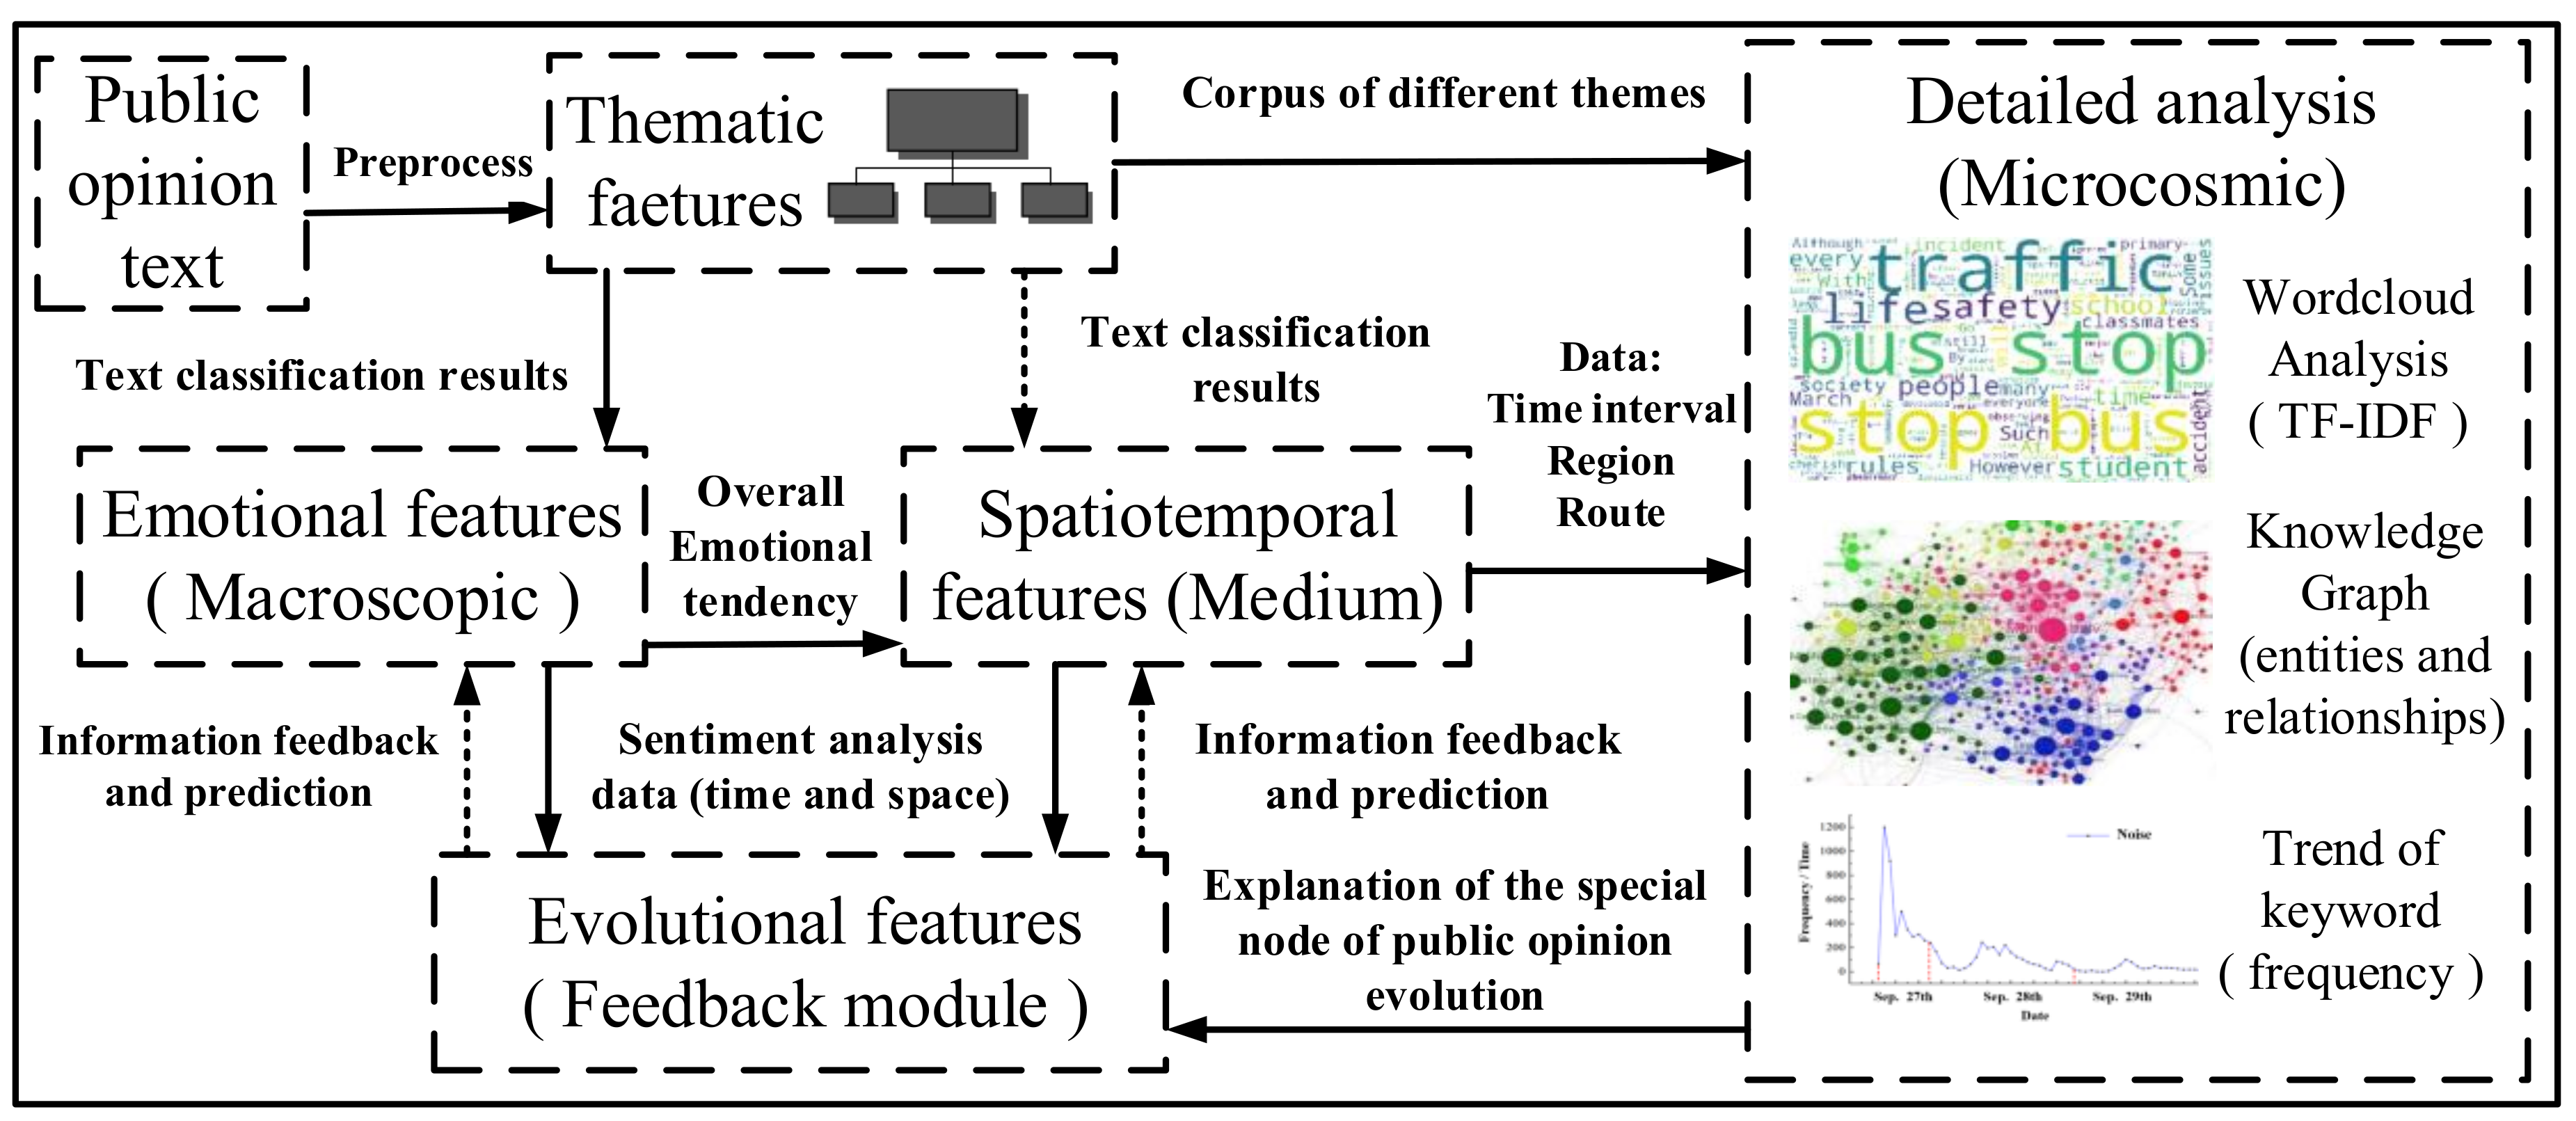
A single perception feature analysis could only obtain partial results of data analysis, while an integrated perception system application can take the logical upper-level data as the input of the analysis for in-depth research. To obtain more abundant information, and grasp a complete picture of the traffic problem, the logic framework of public opinion perception feature integration is developed, as shown in Figure 3.
At first, public opinion text is the original corpus of event analysis and data collection is the basis of event analysis. Data preprocessing aims to remove useless information and improve the accuracy of text analysis. Then, the key to traffic incident analysis is to make clear theme features, which can be used to conduct incident analysis in a more targeted manner. Based on inputting text preprocessed, classification information and public opinion corpus are output through analysis of topic features. Following this, to understand the whole emotional tendency from the macro-aspect, corresponding sentiment analysis of each classified text is built. Meanwhile, to grasp the emotional state of each module from a middle-aspect, it is necessary to carry out temporal and spatial classification. For example, some detailed analysis is implied based on area names and numbers of subway lines. In the subsequent stage, the position of evolution features is more flexible. It can be replied to reflect the development of incidents, which is next to the analysis of emotional features or spatiotemporal features. Meanwhile, predicting the future trend of public opinion or evaluating the implementation effect of intervention measures can be finished by evolution features, which is also a feedback module of overall incident analysis.
Detailed analysis, combined with thematic features, emotional features, and spatiotemporal features, is a supplement to the perceptual features system. The analysis results can be applied to explain special nodes of the process in evolution. Also, events are visualized by word cloud based on hot words, knowledge map based on entity and relationship, trend chart of keyword frequency, etc. Also, specific event points of common people’s concern are excavated deeply from a micro aspect.
Similarly, emotional features run through the analysis of incidents. First, the total emotional tendency of different traffic modules can be acquired by combining emotional features and theme features. Second, passengers’ emotional state at different time points, different regions, and even specific bus lines can be implemented by combining emotional features and spatiotemporal features. Third, emotional changes in different stages based on the life cycle can be obtained by combining emotional features and evolution features. However, all of these cannot be finished by using the emotional features module alone.

4. Case Analysis

In May 2017, Shenzhen Public Transport Administration published the “Shenzhen bus service index in the first quarter of 2017” (referred to as “Shenzhen bus service index”), which transforms GPS data, cards data, and infrastructure data into passenger flow indicators and travel characteristics of the bus, as well as calculates values of each index. The release of “Shenzhen bus service index” demonstrates the analytical and guiding role of traditional traffic data for real transportation, which has authority and reliability. Based on perception features extraction of transportation public opinion, non-traditional transportation data, transportation public opinion, is applied to analyze bus operation in Shenzhen. Results are compared with Shenzhen bus service index, and the feasibility of this method is verified. Based on that, the advantages and disadvantages of transportation public opinion compared with traditional data are acquired.
It should be noted that the extraction of thematic features is not totally reflected in this case analysis, which only targets the bus system. However, when faced with a large amount of public opinion on transportation in the future, we still need to analyze according to the foregoing framework.

4.1. Public Opinion Data Collection and Preprocessing in Shenzhen

Microblog, WeChat, and news clients are three major data sources of public opinion. Microblog users include not only the general public, but also official departments and news media, which make it have attributes of three major data sources, and is the first choice for case analysis of transportation public opinion [44]. Based on web crawler technology, “Shenzhen + bus” is used as the keyword to gather texts of Microblog. Besides, corresponding contents, user name, number of thumbs-up, comments, forwarding volume, release time, and other information are extracted.
Before text analysis, original data should be preprocessed. First, regular matching is used to remove useless information, such as forward microblog, “weblink”, reposted Microblog content after “//”, irrelevant advertising information, etc. Second, stop words are removed based on the stop word list. Third, import transportation terminology bank is constructed, and text segmentation based on Ansj is realized, which is a built-in module of Java.
Some original data is not related to bus public opinion, which should be excluded, so that accuracy of analysis can be improved. The thematic features extraction method is used to deal with this problem. To begin, the TF IDF of Microblog content is calculated to get a feature vector. Subsequently, the thematic feature of Microblog is obtained by inputting the feature vector into the Equations (4) and (5). Finally, Microblog, whose subject feature is the bus is left, while the rest is removed. The amount of raw data crawled, the rest of the data was preprocessed and the quantity of remaining data after cleaning are shown in Table 5.

4.2. Features Extraction and Integrated Application

4.2.1. Extraction and Analysis of Emotional Features

Based on the extraction method of emotional features, the emotional tendency of each Microblog is calculated. Then, set threshold λ 1 =   λ 2 = 0.5 . When the emotion value is less than 0.5, it is considered a negative emotion; it is otherwise considered as a positive emotion. Next, the emotional tendency of bus public opinion from each quarter of 2016 to the first quarter of 2017 is calculated, and they are plotted in Figure 4 and Figure 5 together with quarterly indexes in “Shenzhen bus service index”. Observed data demonstrates that:
  • The trend between passengers’ satisfaction and bus service index in 2016 is consistent. In the second quarter of 2016, the satisfaction and service index decreased compared with the first quarter and then showed an upward trend in the third and fourth quarters. It illustrates that satisfaction obtained by this method is reasonable since there is the same fluctuation trend between them.
  • In the first quarter of 2017, passengers’ satisfaction and bus service index showed an opposite trend. At that time, the bus service index showed an upward trend, while satisfaction showed a downward trend. Indicators examined by Shenzhen bus service index include the degree of congestion, waiting time of passengers, the travel speed of passengers, maintenance of station facilities, etc. It indicated that there may be some non-mentioned index factors, such as policies, management measures, or special events, which lead to satisfaction decline. Specific reasons are thought of in the following section.

4.2.2. Extraction and Analysis of Evolutional Features

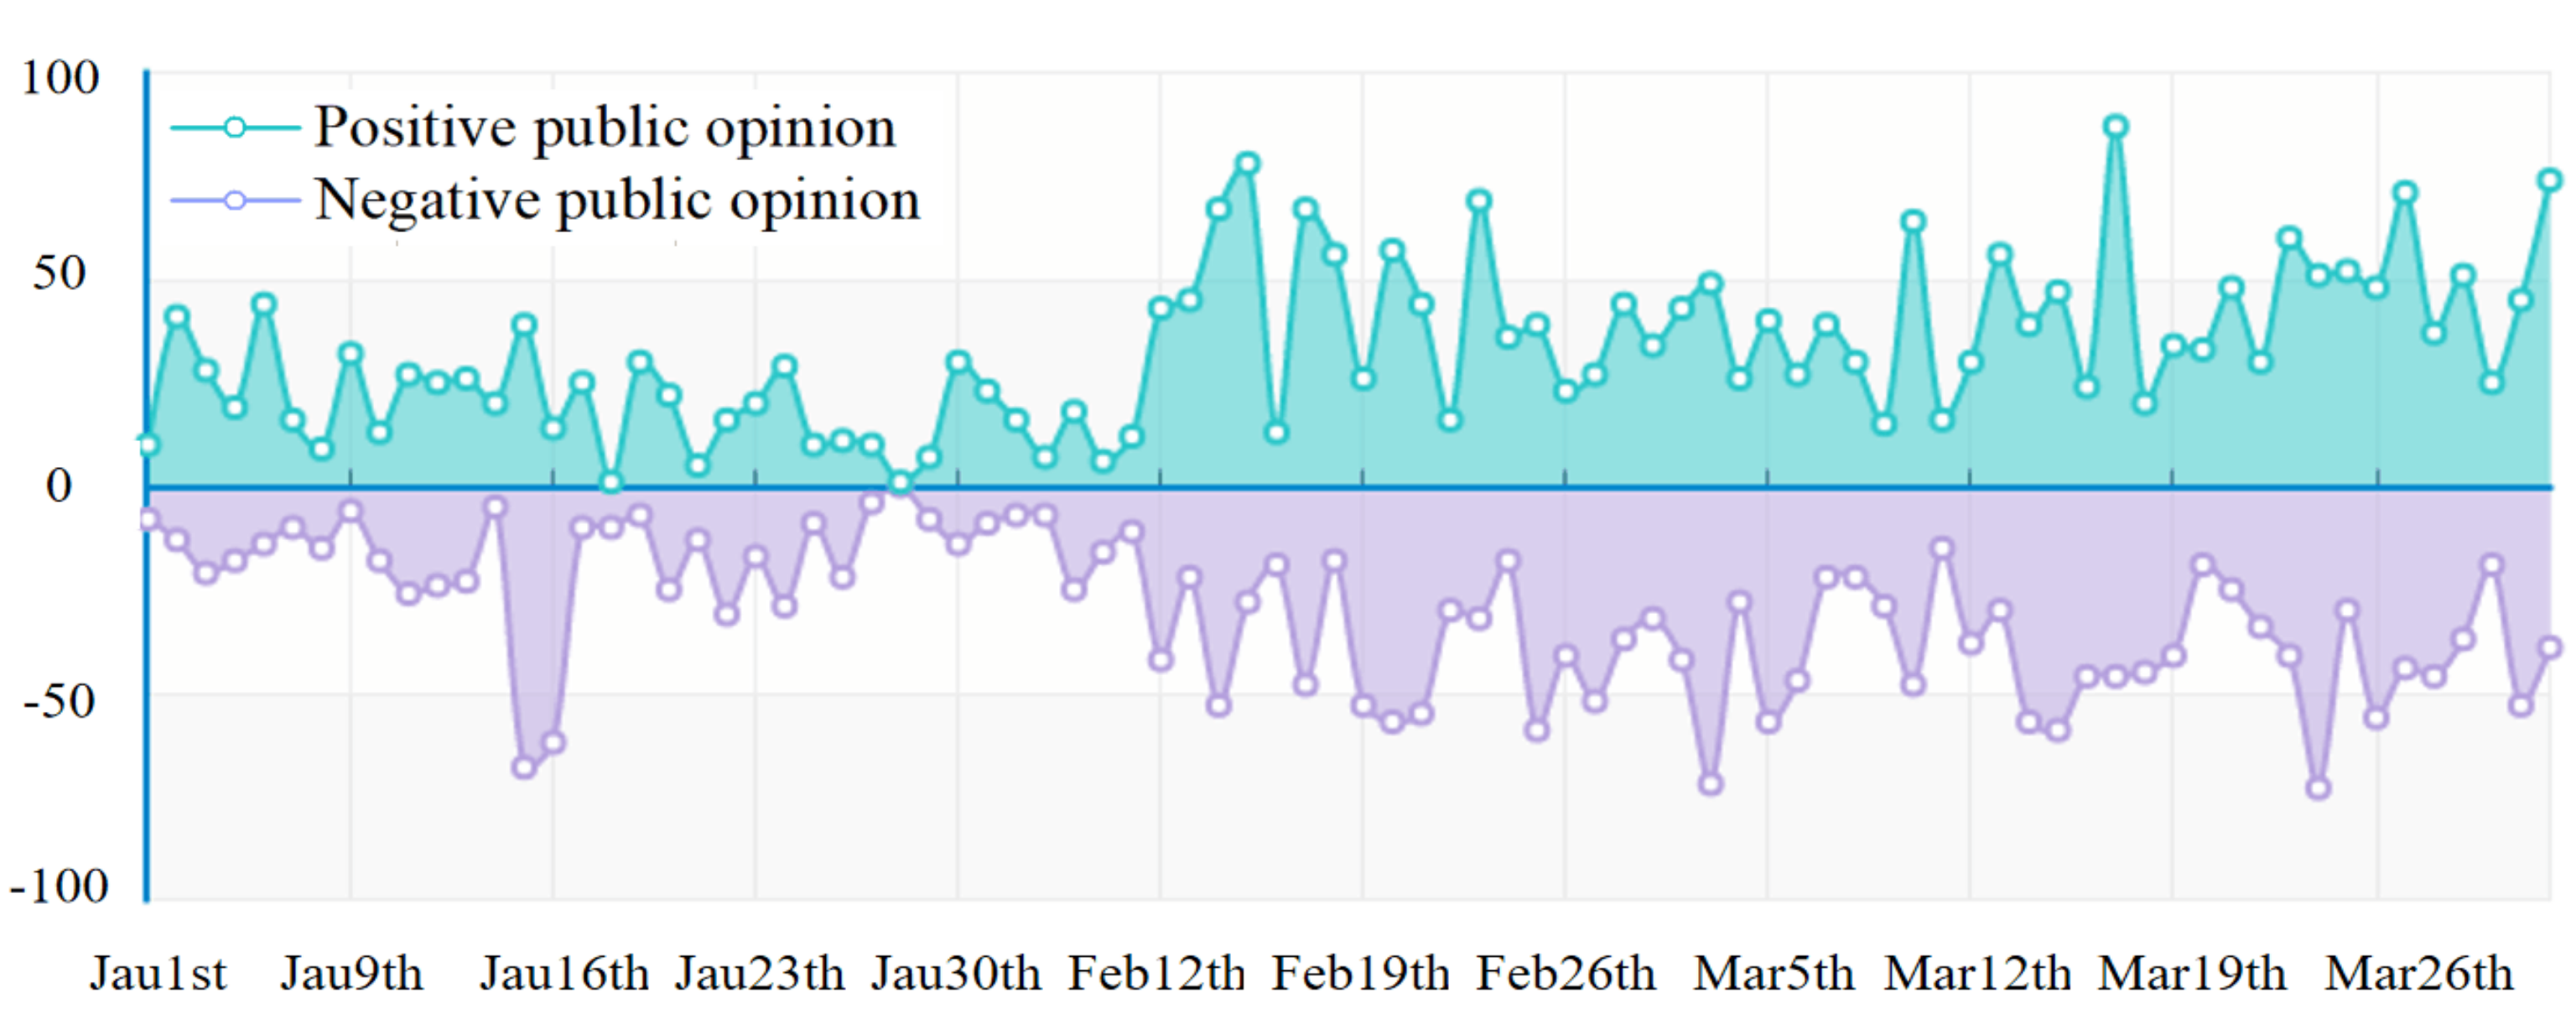
Based on the temporal features extraction method, time information of public opinion on public transport is extracted. To obtain a daily number of positive and negative public opinion in the first quarter of 2017, Microblog data is clustered according to date and emotional tendency. As shown in Figure 6.
The graph illustrates that the quantity of bus public opinion from January to early February was relatively small, while it began to increase constantly and remained at a high level in early February. According to a calendar, January 27 is traditional Chinese New Year’s Eve. Since Spring Festival Transport Season is around January 13, people had been returning to their hometown. As a result, Shenzhen, with a large number of immigrants, gradually became an empty city. Since the beginning of February, people have returned to work in Shenzhen. Therefore, the number of people taking buses has increased, and the quantity of public opinion had increased.
What’s more, positive and negative public opinion tends to fluctuate synchronously, and the trend is also consistent. A rapid increase in the amount of public opinion cannot return to the number of the previous day, which takes days to months. It also indicates characteristics of public opinion development, and more specifically, an incident of public opinion often goes through a life cycle from generation to development to end. Furthermore, through calculating the average values of the two components, we find that bus public opinions tended to be more positive with the influence of home-returning obsession in the weeks before and after the Spring Festive, and the reflection of bus operation may deviate from the reality.

4.2.3. Extraction and Analysis of Spatial Features

Shenzhen contains eight administrative districts, such as Luohu District, Futian District, and Yantian District. To count passenger satisfaction within each administrative district, it is important to obtain spatial features of bus public opinion.
Since public opinion information of Shenzhen districts alone is needed by this section, only the subspace thesaurus of “Shenzhen-districts-transportation facilities” of the space thesaurus is required.
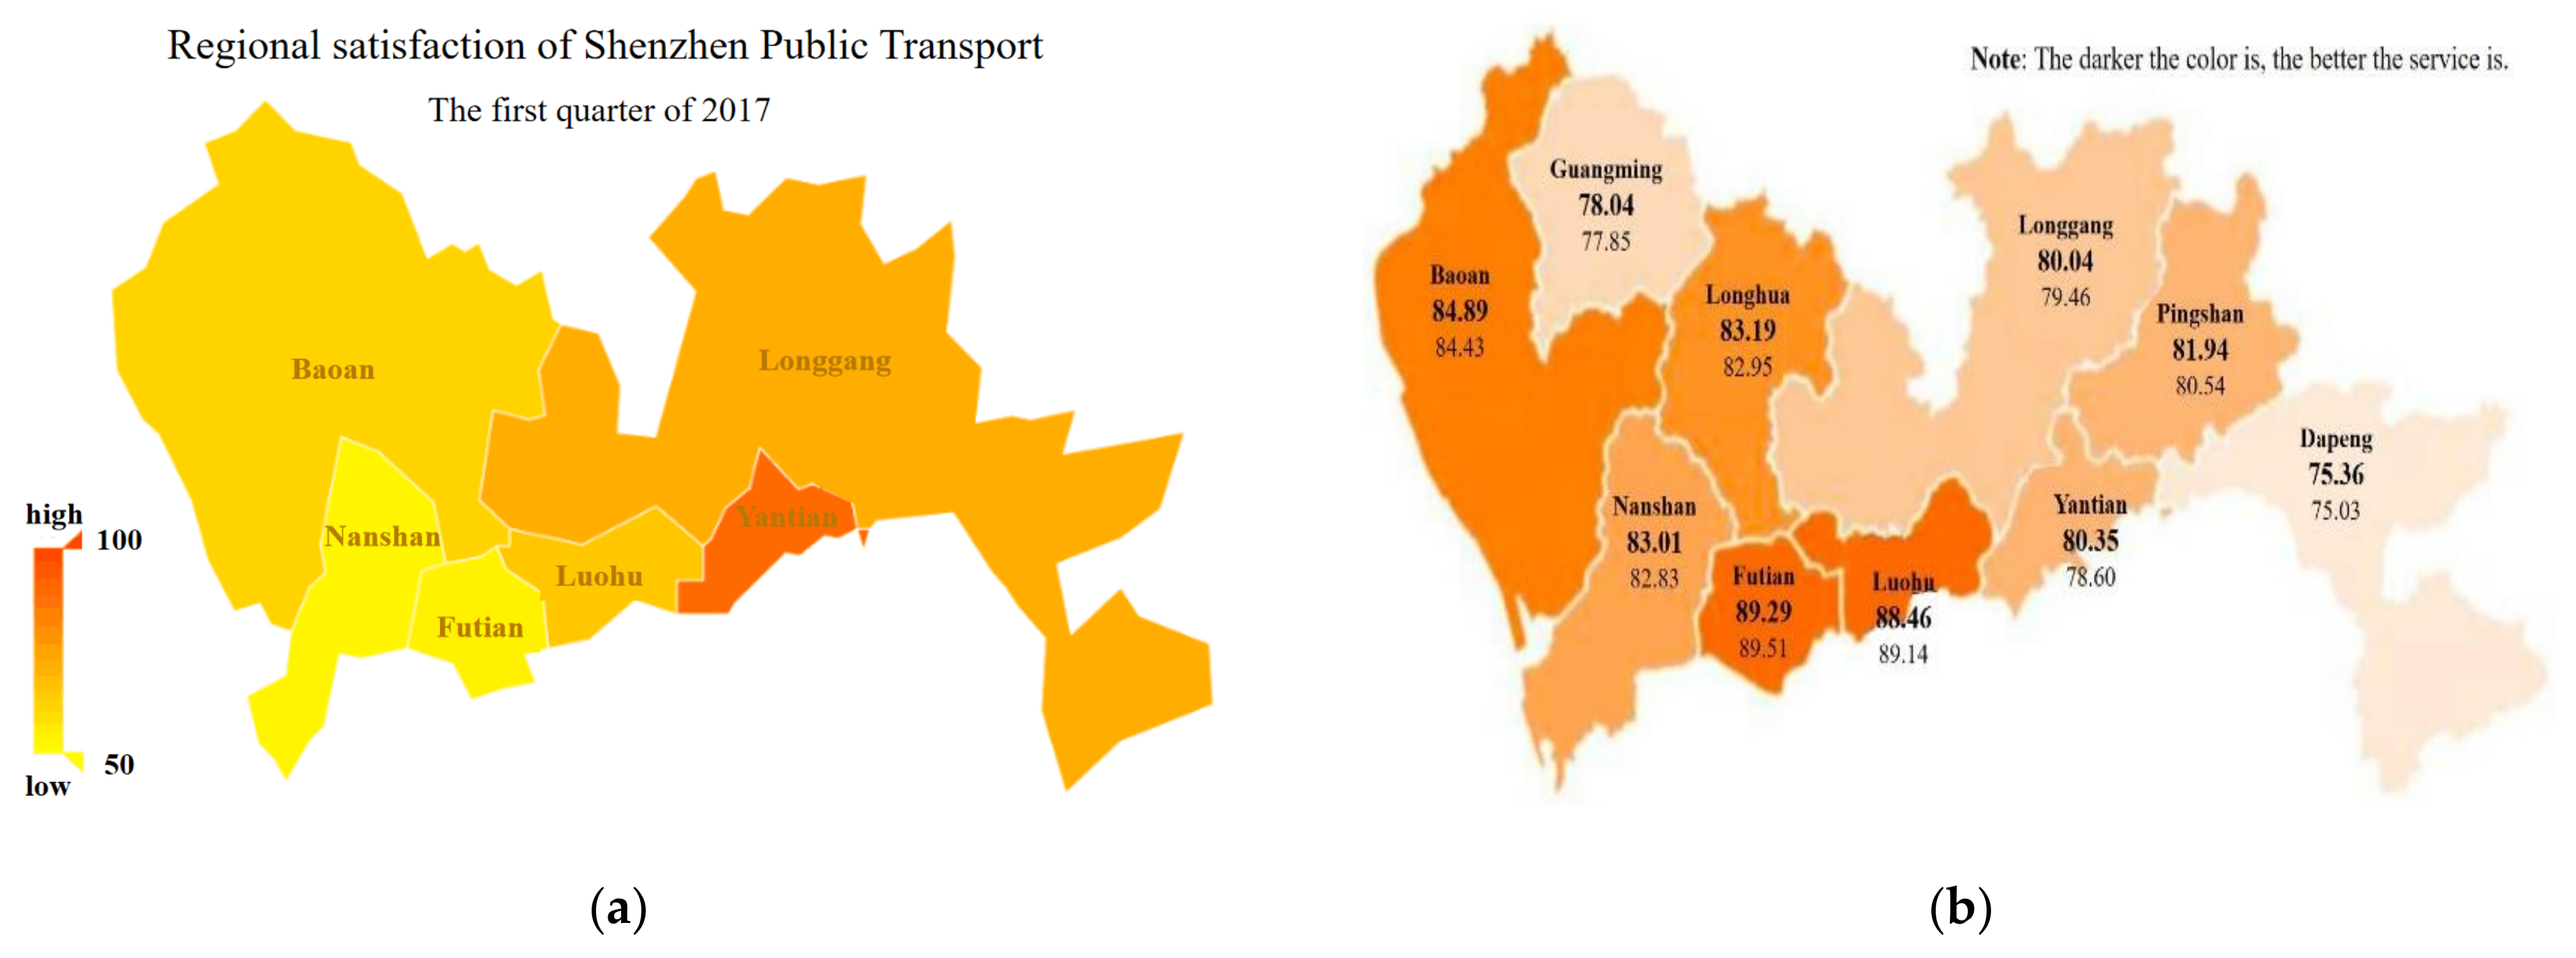
Next, public opinion is classified considering the administrative region of spatial features extracted, and the satisfaction of each region is calculated, as shown in Figure 7a. Figure 7b is regional data from the bus service index, and there are remarkable differences compared with the former.
The bus service index of Futian District and Luohu District is higher, while the satisfaction levels in those districts are in the middle and low levels, respectively. The bus service index of Yantian District and Longgang District is low, whereas satisfaction is at a high level. Shenzhen passengers’ satisfaction and service index show the opposite trend, which is not consistent with the overall correlation. It shows that the service index is not positively correlated completely with the satisfaction of buses; the reason for this may be that the public from less developed areas expect less than those from developed areas. Further investigation should be carried out to find out specific reasons.

4.2.4. Detail Evaluation of Shenzhen Bus

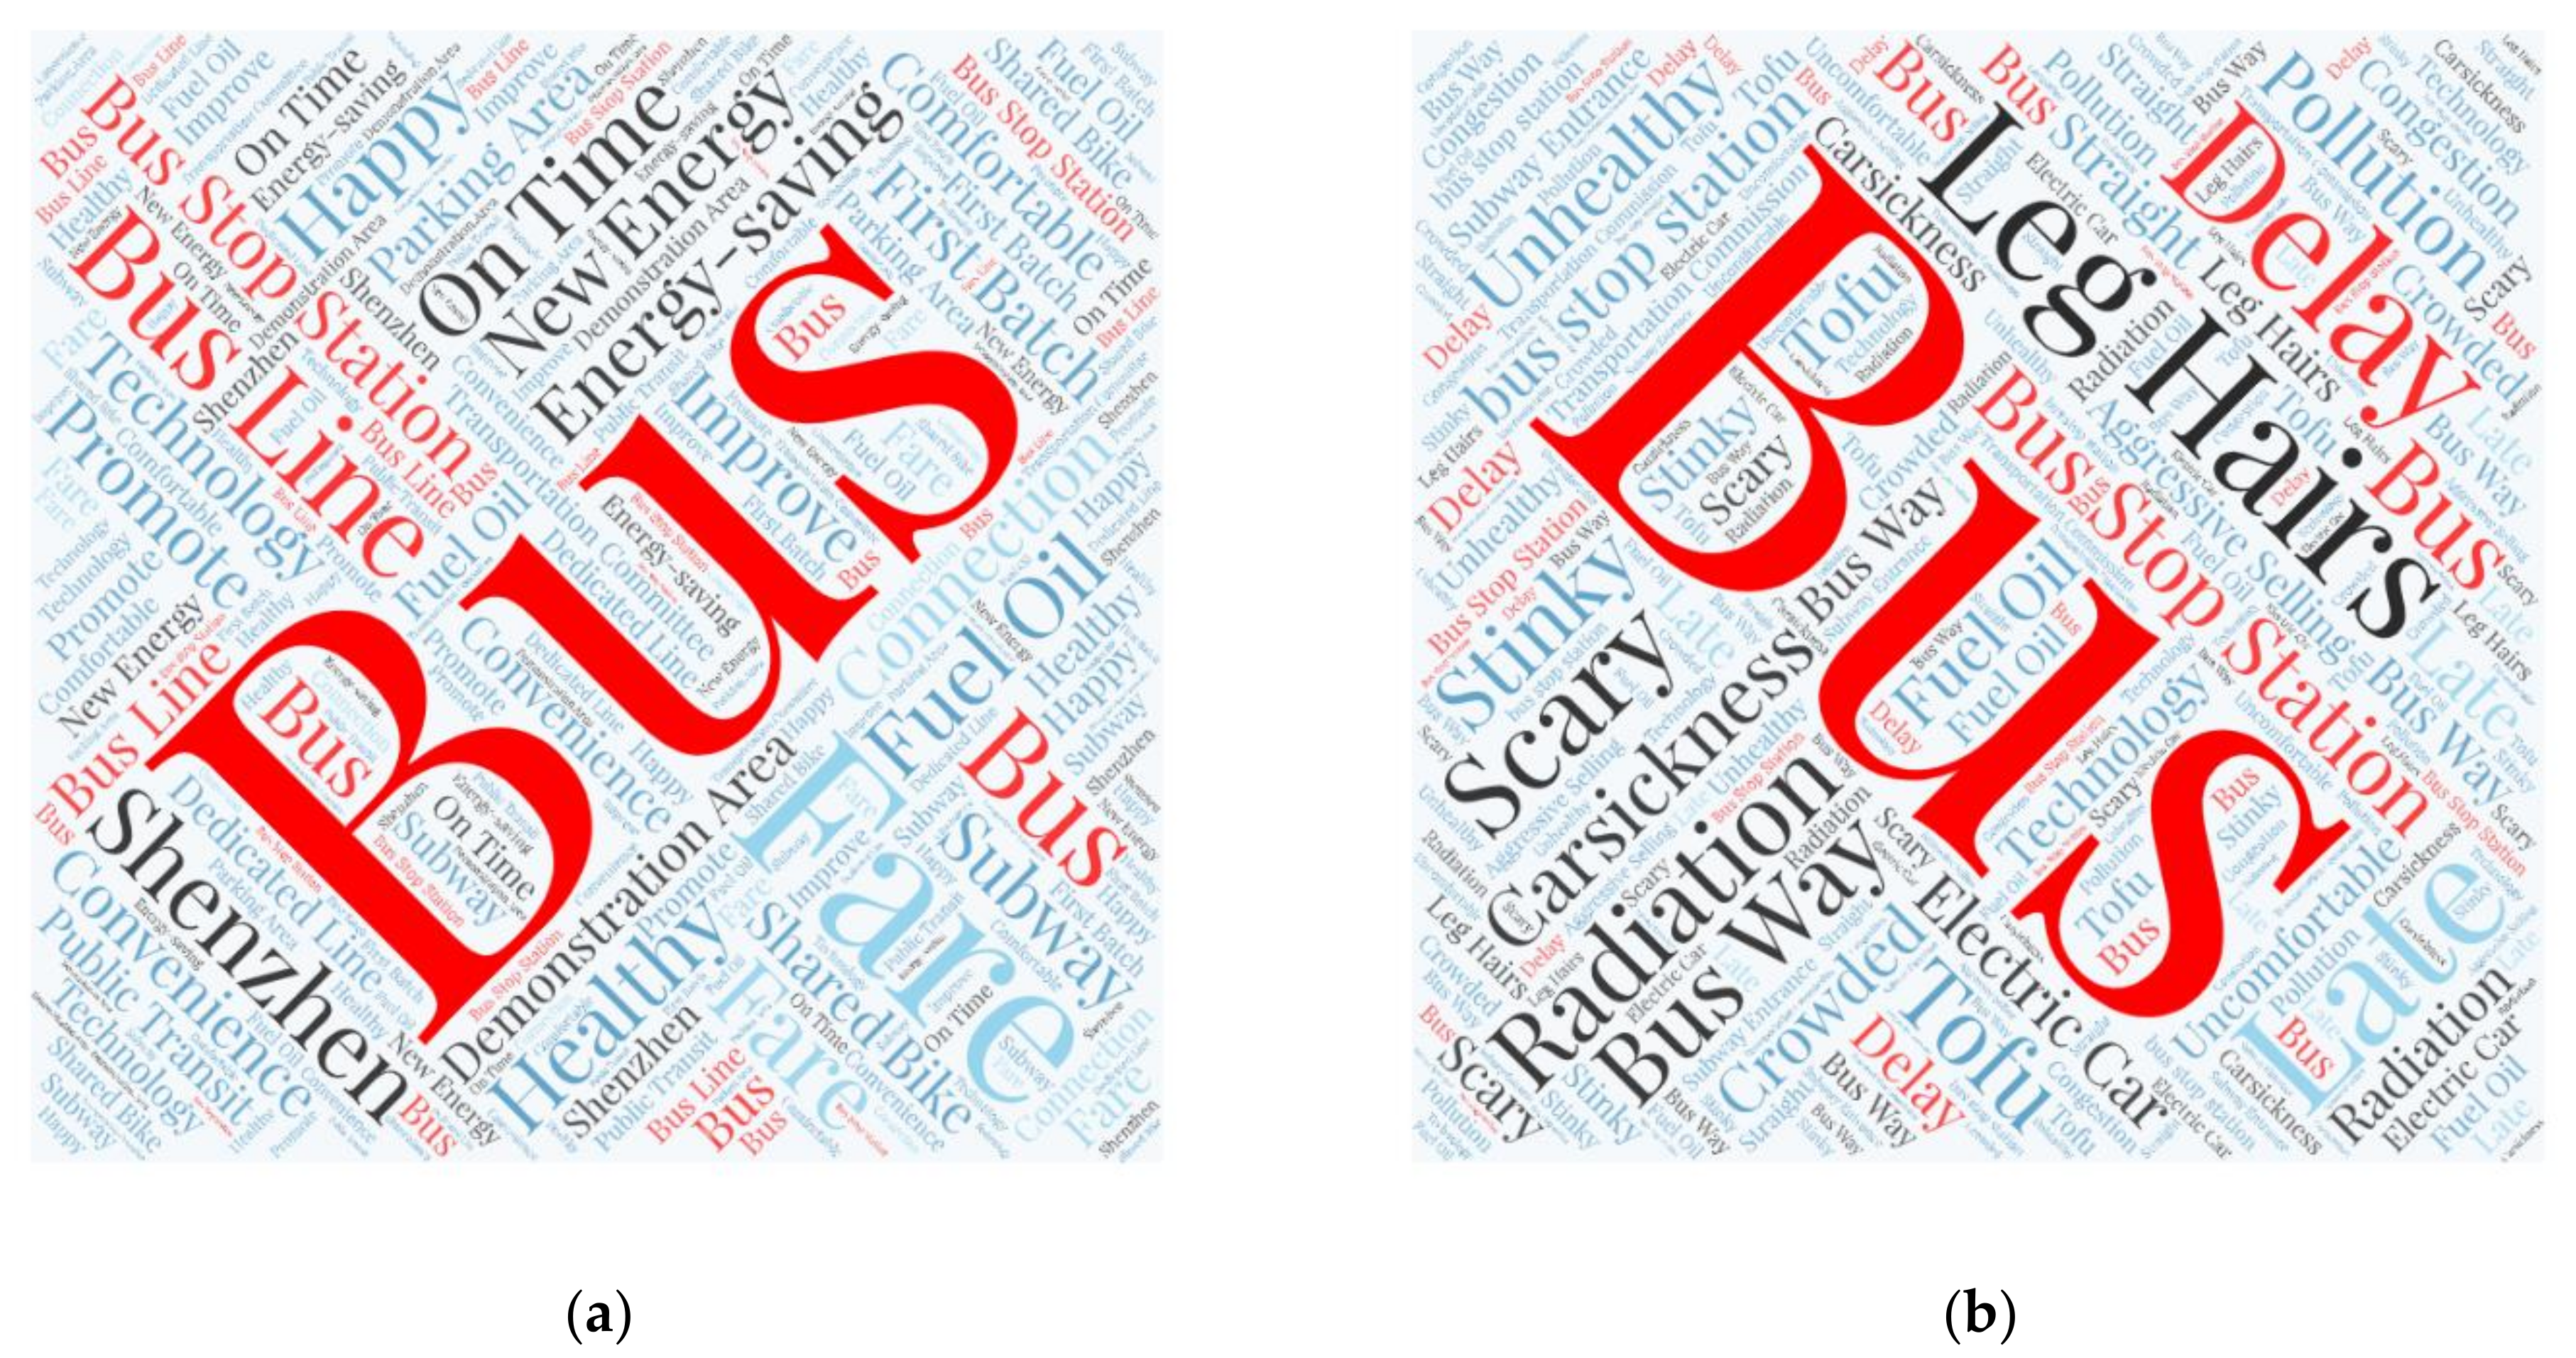
TF IDF   of words is selected as the evaluation index of keywords. TF IDF of words in positive public opinion and negative public opinion are calculated respectively, and the top 25 words are selected to plot in a word cloud, as shown in Figure 8.
Hot words of positive public opinion include new energy, energy-saving, etc. Many official microblogs express their appreciation for the promotion of new energy buses. The cloud contains the words “bus line and bus stop station”. We find that many netizens made positive comments on increasing the number of routes and departure frequency, which illustrates that the convenience and accessibility of buses are more of a concern for passengers.
However, “bus stop station” also appears in the hot words of negative public opinion. By checking texts, it was reflected by citizens that car occupation at bus stop stations would cause uncertain delays and congestion. Based on the foregoing analysis, strictly enforcing laws to ensure the busway right are recommended for management apartments. In addition, “leg hairs, radiation” and other seemingly irrelevant words to the bus appear in the hot words. By checking texts, it was clear that passengers had concerns about new energy buses because rumors spread on the internet that “electric buses have great radiation, which will make drivers lose their leg hairs”. This is one of the reasons for the decline in passengers’ satisfaction in the first quarter of 2017. The official should refute the rumors immediately, and guide the public to objectively view the new energy bus. Similarly, by analyzing the word “carsickness”, citizens commented that there was a strong odor in BYD’s electric buses, which led to discomfort such as carsickness. We suggested that relevant departments use air purifiers and other tools to remove the odor in buses and create a comfortable environment for passengers.
Therefore, based on the hot words mining, not only can specific aspects of satisfaction be extracted, but the specific problems can be classified. This is conducive to the relevant departments grasping cases and allocating resources to the issues of passengers’ real concerns accurately.

5. Conclusions

Public opinion is important for transportation management and decision. The tremendous growth of textual data volume and advancements of NLP provide a completely new approach for policymakers to perceive public opinion. To better grasp the citizen opinions on transportation, this paper concentrates on the perception features of public opinion and proposes a systematic approach under an integrated framework. Not only can it help the stakeholders understand real demands, but also enhance public participation in the policy modification, whereby the decision-making efficiency and suitability will get optimized for policymakers.
The hybrid algorithm consists of data pre-processing, features extraction, and integrated application. The data pre-processing begins with a regular matching to erase useless information, while stop words are removed and texts are segmented based on the stop word list and the improved transportation terminology bank respectively. Texts are then transformed into vectors, and irrelevant ones are discarded on the basis of thematic features. The methods of features extraction are subsequently designed in detail. To begin with, thematic features are obtained considering vector similarity. Next, based on summarized Chinese expression patterns, spatiotemporal features are extracted by double traversing. We have built an emotional dictionary of transportation, and quantitatively analyzed emotional state taking sequence and adverbs of degree into account. Finally, based on the EGARCH and life cycle of public opinion, evolutional features are carefully extracted. In terms of the case study guided by the integrated framework, the main causes of the fluctuating passenger satisfaction can be obtained. The result supported by the proposed methods is obviously distinct from the official one in the first quarter of 2017, where specific reasons have been analyzed. It is noted that the proposed method is not only suitable for Chinese text processing, but also can be extended to other languages.
Future work will deal with the relationship among corpus entities considering events, public opinion, and management departments. When a public opinion incident occurs, it can automatically locate the specific responsible departments and provide handling measures for them. Meanwhile, a performance evaluation method of traffic governance based on public opinion feedback will also be studied. Technologies like graph databases and deep learning are worth applying to enhance the recognition performance. In summary, the proposed systematic approach under an integrated framework can effectively extract perception features of public opinion and assist transportation departments to make reasonable decisions.

Author Contributions

Conceptualization, S.L., J.T., and Y.G.; methodology, S.L., J.T., and Y.G.; software, S.L. and Y.G.; validation, J.T.; formal analysis, S.L.; investigation, S.L.; resources, Y.G.; writing—original draft preparation, S.L. and Y.G.; writing—review and editing, S.L. and J.T.; visualization, S.L. and Y.G.; supervision, J.T. All authors have read and agreed to the published version of the manuscript.

Funding

This research was funded by the National Social Science Fund of China, grant number 18BGL005.

Institutional Review Board Statement

Not applicable.

Informed Consent Statement

Not applicable.

Data Availability Statement

Not applicable.

Conflicts of Interest

The authors declare no conflict of interest.

References

  1. Emilia, S.; Enora, R.; Jenny, M. Night-Time Mobilities and Justice in London: Constructing Mobile Subjects and the Politics of Difference in Policy-Making. J. Transp. Geogr. 2020, 82, 102569. [Google Scholar]
  2. Cristina, M.; Campos, A.; Diego, P.; Gemma, P.; Jose, L. Long-Term Cost Efficiency of Alternative Management Forms for Urban Public Transport from the Public Sector Perspective. Transp. Policy 2020, 88, 16–23. [Google Scholar]
  3. Aseem, K.; Samaneh, B.; Rasmus, B.; Thomas, A.; Francisco, P. Examining the Potential of Textual Big Data Analytics for Public Policy Decision-Making: A Case Study with Driverless Cars in Denmark. Transp. Policy 2020, 98, 68–78. [Google Scholar]
  4. Behbahani, H.; Nazari, S.; Kang, M.; Litman, T. A Conceptual Framework to Formulate Transportation Network Design Problem Considering Social Equity Criteria. Transp. Res. Pt. A-Policy Pract. 2019, 125, 171–183. [Google Scholar] [CrossRef]
  5. Enoch, M.; Cross, R.; Potter, N.; Davidson, C.; Taylor, S. Future Local Passenger Transport System Scenarios and Implications for Policy and Practice. Transp. Policy 2020, 90, 52–67. [Google Scholar] [CrossRef]
  6. Peters, L.; MacKenzie, D. The Death and Rebirth of Bikesharing in Seattle: Implications for Policy and System Design. Transp. Res. Pt. A-Policy Pract. 2019, 130, 208–226. [Google Scholar] [CrossRef]
  7. Cunningham, M.; Regan, M.; Horberry, T.; Weeratunga, K.; Dixit, V. Public Opinion about Automated Vehicles in Australia: Results from a Large-Scale National Survey. Transp. Res. Pt. A-Policy Pract. 2019, 129, 1–18. [Google Scholar] [CrossRef]
  8. Li, S.; Zhao, P.; Zhang, H.; Quan, J. Walking Behavior in the Old Downtown Beijing: The Impact of Perceptions and Attitudes and Social Variations. Transp. Policy 2018, 73, 1–11. [Google Scholar] [CrossRef]
  9. Kauffmann, E.; Peral, J.; Gil, D.; Ferrandez, A.; Sellers, R.; Mora, H. Managing Marketing Decision-Making with Sentiment Analysis: An Evaluation of the Main Product Features Using Text Data Mining. Sustainability 2019, 11, 15. [Google Scholar] [CrossRef] [Green Version]
  10. Anik, M.; Sadeek, S.; Hossain, M.; Kabir, S. A Framework for Involving the Young Generation in Transportation Planning Using Social Media and Crowd Sourcing. Transp. Policy 2020, 97, 1–18. [Google Scholar] [CrossRef]
  11. Ballestar, M.; Cuerdo-Mir, M.; Freire-Rubio, M. The Concept of Sustainability on Social Media: A Social Listening Approach. Sustainability 2020, 12, 2122. [Google Scholar] [CrossRef] [Green Version]
  12. Xu, J.; Tang, W.; Zhang, Y.; Wang, F. A Dynamic Dissemination Model for Recurring Online Public Opinion. Nonlinear Dyn. 2020, 99, 1269–1293. [Google Scholar] [CrossRef]
  13. Murry, M.W.E.; Isaacowitz, D.M. Age Differences in Emotion Perception: The Effects of the Social Environment. Int. J. Behav. Dev. 2017, 41, 597–604. [Google Scholar] [CrossRef]
  14. Sigal, K.; Shaun, B.D.; Carlo, P. The Relation Between the Perception of Safe Traffic and the Comprehension of Road Signs in Conditions of Ambiguous and Redundant Information. Transp. Res. Pt. F-Traffic Psychol. Behav. 2018, 55, 415–425. [Google Scholar]
  15. Smith, G.; Sochor, J.; Karlsson, I.C.M. Mobility as a Service: Development Scenarios and Implications for Public Transport. Res. Transp. Econ. 2018, 69, 592–599. [Google Scholar] [CrossRef]
  16. Jonghak, L.; Junghyo, C.; Taekwan, Y.; Hojin, Y. Traffic Accident Severity Analysis with Rain-Related Factors Using Structural Equation Modeling-A Case Study of Seoul City. Accid. Anal. Prev. 2018, 112, 1–10. [Google Scholar]
  17. Li, R.; Pereira, F.C.; Akiva, M.E. Overview of Traffic Incident Duration Analysis and Prediction. Eur. Transp. Res. Rev. 2018, 10, 1–13. [Google Scholar] [CrossRef]
  18. Nima, H.N.; Liu, X.; Ran, W.; Liu, W.; Hu, S. Using Twitter Data for Transit Performance Assessment: A Framework for Evaluating Transit Riders’ Opinions about the Quality of Service. Pub. Transp. 2018, 10, 363–377. [Google Scholar]
  19. Farman, A.; Daehan, K.; Pervez, K.; Shaker, E.; Amjad, A.; Ssna, U.; Hyum, K.; Kyung, K. Transportation Sentiment Analysis Using a Word Embedding and Ontology-Based Topic Modeling. Knowl. Based Syst. 2019, 174, 27–42. [Google Scholar]
  20. Farman, A.; Daehan, K.; Pervez, K.; Riazul, I.M.; Hyun, K.K.; Kwak, K.S. Fuzzy Ontology-Based Sentiment Analysis of Transportation and City Feature Reviews for Safe Traveling. Transp. Res. Pt. C-Emerg. Technol. 2017, 77, 33–48. [Google Scholar]
  21. Chakraborty, P.; Sharma, A. Public Opinion Analysis of the Transportation Policy Using Social Media Data: A Case Study on the Delhi Odd-Even Policy. Transp. Dev. Econ. 2019, 5, 5.1–5.9. [Google Scholar] [CrossRef] [Green Version]
  22. Zhang, Z.; Qing, H.; Jing, G.; Ming, N. A Deep Learning Approach for Detecting Traffic Accidents from Social Media Data. Transp. Res. Pt. C-Emerg. Technol. 2017, 86, 580–596. [Google Scholar] [CrossRef] [Green Version]
  23. Li, D.; Zhang, Y.; Cheng, C. Mining Public Opinion on Transportation Systems Based on Social Media Data. Sustainability 2019, 11, 4016. [Google Scholar] [CrossRef] [Green Version]
  24. Ahmed, M.F.; Vanajakshi, L.; Suriyanarayanan, R. Real-Time Traffic Congestion Information from Tweets Using Supervised and Unsupervised Machine Learning Techniques. Transp. Dev. Econ. 2019, 5, 1–11. [Google Scholar] [CrossRef]
  25. Gu, Y.; Lu, W.; Xu, X.; Qin, L.; Zhang, H. An Improved Bayesian Combination Model for Short-Term Traffic Prediction with Deep Learning. IEEE Trans. Intell. Transp. Syst. 2020, 21, 1524–9050. [Google Scholar] [CrossRef]
  26. Sinnott, R.; Yin, S. Accident Black Spot Identification and Verification through Social Media. In Proceedings of the IEEE International Conference on Data Science and Data Intensive Systems, Sydney, NSW, Australia, 11–13 December 2015; pp. 17–24. [Google Scholar]
  27. Mahmud, H.; Mehmet, O.; Rolf, S. A Survey on Real-Time Event Detection from the Twitter Data Stream. J. Inf. Sci. 2017, 44, 443–463. [Google Scholar]
  28. Lu, H.; Shi, K.; Zhu, Y.; Yi, L.; Niu, Z. Sensing Urban Transportation Events from Multi-Channel Social Signals with the Word2vec Fusion Model. Sensors 2018, 18, 4093. [Google Scholar] [CrossRef] [Green Version]
  29. Cao, D.L.; Wang, S.R.; Lin, D.Z. Chinese Microblog Users’ Sentiment-Based Traffic Condition Analysis. Soft Comput. 2018, 22, 7005–7014. [Google Scholar] [CrossRef]
  30. Monica, B.; Lavanya, K. Social Media Data Analysis for Intelligent Transportation Systems. In Proceedings of the 2020 ic-ETITE, Vellore, India, 24–25 February 2020. [Google Scholar]
  31. Essien, A.; Petrounias, I.; Sampaio, P.; Sampaion, S. A Deep-Learning Model for Urban Traffic Flow Prediction with Traffic Events Mined from Twitter. World Wide Web, 2020; in press. [Google Scholar]
  32. Wang, D.; Al-Rubaie, A.; Davies, J.; Clarke, S.S. Real-Time Road Traffic Monitoring Alert Based on Incremental Learning from Tweets. In Proceedings of the IEEE Symposium on Evolving and Autonomous Learning Systems, Orlando, FL, USA, 9–12 December 2014. [Google Scholar]
  33. Campisi, T.; Basbas, S.; Skoufas, A.; Akgun, N.; Ticali, D.; Tesoriers, G. The Impact of COVID-19 Pandemic on the Resilience of Sustainable Mobility in Sicily. Sustainability 2020, 12, 8829. [Google Scholar] [CrossRef]
  34. Serna, A.; Ruiz, T.; Gerrikagoitia, J.K.; Arroyo, R. Identification of Enablers and Barriers for Public Bike Share System Adoption using Social Media and Statistical Models. Sustainability 2019, 11, 6259. [Google Scholar] [CrossRef] [Green Version]
  35. Campisi, T.; Akgün, N.; Ticali, D.; Tesoriere, G. Exploring Public Opinion on Personal Mobility Vehicle Use: A Case Study in Palermo, Italy. Sustainability 2020, 12, 5460. [Google Scholar] [CrossRef]
  36. Ting, F.; Bo, P.; Samart, P.; Gang, H. The Impact of Disaster of a National Airline on the Nation’s Tourism: An Empirical Investigation. Sustainability 2019, 11, 1233. [Google Scholar]
  37. Alattyih, W.; Haider, H.; Boussabaine, H. Development of Value Creation Drivers for Sustainable Design of Green Buildings in Saudi Arabia. Sustainability 2019, 11, 5867. [Google Scholar] [CrossRef] [Green Version]
  38. Nallaperuma, D.; Nawaratne, R.; Bandaragoda, T.; Adikari, A.; Pothuhera, D. Online Incremental Machine Learning Platform for Big Data-Driven Smart Traffic Management. IEEE Intell. Transp. Syst. 2019, 99, 1–12. [Google Scholar] [CrossRef]
  39. Lana, I.; Ser, J.D.; Velez, M.; Vlahogianni, E.I. Road Traffic Forecasting: Recent Advances and New Challenges. IEEE Trans. Intell. Transp. Syst. Mag. 2018, 10, 93–109. [Google Scholar] [CrossRef]
  40. Chen, M.; Zhou, P.; Fortino, G. Emotion Communication System. IEEE Access 2017, 5, 326–337. [Google Scholar] [CrossRef]
  41. Wang, G.; Wang, Y.; Liu, K.; Li, J. Multidimensional Influencing Factors of Public Opinion Information Dissemination in Social Media: Evidence from Weibo Dataset. Int. J. Mod. Phys. B 2020, 33, 1331–1342. [Google Scholar] [CrossRef]
  42. Cao, J.; Zeng, K.; Wang, H.; Cheng, J.; Qiao, F.; Wen, D.; Gao, Y. Web-Based Traffic Sentiment Analysis: Methods and Applications. IEEE Trans. Intell. Transp. Syst. 2013, 15, 844–853. [Google Scholar]
  43. Signorini, A.; Segre, A.M.; Polgreen, P.M. The Use of Twitter to Track Levels of Disease Activity and Public Concern in the U.S. during the Influenza A H1N1 Pandemic. PLoS ONE 2011, 6, e19467. [Google Scholar] [CrossRef] [Green Version]
  44. Blazek, S.; Ho, H.-C.; Liu, S.-P. Score-Driven Markov-Switching EGARCH Models: An Application to Systematic Risk Analysis. Appl. Econ. 2018, 50, 6047–6060. [Google Scholar] [CrossRef]
Figure 1. The research framework of methods.
Sustainability 13 00254 g001
Figure 2. Spatial features extraction strategy.
Sustainability 13 00254 g002
Figure 3. The logic framework of perception features integration for public opinion.
Sustainability 13 00254 g003
Figure 4. Satisfaction and service index of Shenzhen bus between 2016 and the first quarter of 2017.
Sustainability 13 00254 g004
Figure 5. The satisfaction of Shenzhen bus in the first quarter of 2017.
Sustainability 13 00254 g005
Figure 6. Daily public opinion in the first quarter of 2017.
Sustainability 13 00254 g006
Figure 7. (a) Regional satisfaction of Shenzhen public transport in the first quarter of 2017; (b) Regional service index of Shenzhen public transport in the first quarter of 2017.
Sustainability 13 00254 g007
Figure 8. (a) Positive hot words; (b) Negative hot words.
Sustainability 13 00254 g008
Table 1. Perception features’ system of transportation public opinion.
Primary FeaturesSecondary Features
Thematic features [38]Traffic accident
Traffic congestion
Traffic control
Shared transport
Spatiotemporal features [39]Time features (year, month, day, hour, minute, second)
Spatial features (province, city, district, road name, specific location)
Emotional features [40]Positive
Neutral
Negative
Evolutional featuresQuantity of information
Rate of change
Table 2. Time expression pattern.
Expression PatternMeaningExamples
Num + NNumeral + Noun of time denoting time6 Dian (o’clock), 6 Yue (June)
NNoun of timeMorning, Monday, Today, o’clock
Num: NumNumeral: Numeral18:30
Num. NumNumeral. Numeral2020.6
Num/ NumNumeral/ Numeral2020/8
Table 3. Five common emotional patterns.
PatternsCollocationExamples
SSentimental wordsHappy
DSSentimental words + adverbs of degreeConvenient much more (Much more convenient)
Adverbs of degree + sentimental wordsVery happy
NSNegative words + sentimental wordsNot satisfied (Dissatisfied)
DNSAdverbs of degree + negative words + sentimental wordsVery not unobstructed (The traffic is very heavy)
NDSNegative words + adverbs of degree+ sentimental wordsNot very smooth (It is not very smooth)
Table 4. Weight table of the influence of degree adverbs on text emotion.
Adverbs of DegreeWeightBrief Introduction
extreme/most2.5The word strongly enhances the tone
very2.1Not very smooth (It is not very smooth)
more1.8The word enhances the tone to a certain extent
-ish1.2
insufficiently0.5The word weakens the tone
over−1The word changes word polarity
Table 5. Number of public opinion of transportation in Shenzhen.
DateNumber of Raw Data Crawled/pcsRest of Data Preprocessed/pcsQuantity of Data after Cleaning/pcs
March 2017180616061445
February 20171072872767
January 2017864664610
The fourth quarter of 2016192815281390
The third quarter of 2016209418941665
The second quarter of 2016200816081436
The first quarter of 2016195316531464
Publisher’s Note: MDPI stays neutral with regard to jurisdictional claims in published maps and institutional affiliations.