The Role of Public Participation for Determining Sustainability Indicators for Arctic Tourism


Department of Geography and Tourism Studies, Institute of Life and Environmental Sciences, University of Iceland, 102 Reykjavík, Iceland
Sustainability 2021, 13(1), 295; https://doi.org/10.3390/su13010295
Submission received: 21 November 2020
/
Revised: 27 December 2020
/
Accepted: 28 December 2020
/
Published: 30 December 2020
(This article belongs to the Section Environmental Sustainability and Applications)
Abstract
:The new paradigm of sustainable development highlights the importance of enforcing defined boundaries between economies, societies, and the environment within a system. Sustainability indicators are tools that have proven to be a successful aid in defining and creating system boundaries. This paper focuses on the development of sustainability indicators for Arctic tourism, with a special emphasis on the role of public participation in their determination. It presents a stakeholder-centric approach to indicator selection by developing a framework that effectively integrates public participation in the processes of indicators’ selection and designation, and highlights the importance of combining local and expert knowledge in these processes. The results reveal that the making of sustainability indicators is an ideal platform for local voices to be heard, and thus to have a significant stake in the overall process of tourism development. The most effective way to make their voices heard in the final decision-making process is via their evaluation of the adaptability and prioritization of these indicators. The results, furthermore, stress that sustainability indicators need to be constantly re-evaluated and updated, as tourism is part of a complex and dynamic system that is constantly changing. To provide a holistic vision of the impact of economic, environmental, and social factors, as well as the causality between them in the system, sustainability indicators must be integrated from many indicators. Since the monitoring of conventional indicators is often less complicated and more cost-effective than the monitoring of integrated indicators, a better result can however be reached by combining conventional indicators with sustainability indicators.
1. Introduction
The history behind the concept of sustainable development can be traced back more than three decades to when the world’s nations agreed on an ideology intended to maintain and develop prosperity and wellbeing in the long-term [1]. Ever since, there have been divergent opinions on the route to follow towards such a long-term prosperity, as the concept is vast and relevant to all. The ideology behind the concept has, however, never been as important as today. This importance is emphasized in the UN Sustainable Development Goals (SDGs) [2]. Increased knowledge and understanding of sustainable development stress that its main pillars, i.e., economy, society, and nature, take part within a closed system [3]. Accordingly, all growth that exceeds the limitations of the system is unsustainable. It is thus vital to both be familiar with and understand the system and the limitations of its main pillars, as well as to organize and direct development so that it maintains sustainability within the system. For decision-making to promote sustainable development, it must be based on the integration of economical, sociological, and ecological factors. This integration is only possible through a holistic vision of the different factors influencing the system.
Many of the most popular natural destinations owe their existence to sensitive ecosystems and cultures. In such areas, it is essential that sustainability forms a part of the tourism development process. To direct planning towards sustainability and monitor the impact of tourism, both on nature and societies, it is furthermore necessary to make use of sustainability indicators, along with system thinking. Sustainability indicators are metrics for assessing development or changes in different factors that impact economies, societies, and ecosystems [4,5]. As a control, sustainability indicators help increase transparency and an understanding of the causality between different influential factors. Sustainability indicators for tourism have been growing gradually during the past three decades. Today, they are upheld as an imperative control system; hence, many international organizations have put much work into developing and coordinating sustainability indicators for tourism, as well as regularly updating the indicators as knowledge increases [6,7,8,9,10,11,12,13,14]. Still, there exist no sustainability indicators for tourism in the Arctic.
With easier accessibility, the Arctic has been attracting an increasing number of tourists every year, with consequent increased impact on its nature and societies [15]. This trend is likely to continue once the world has recovered from the Covid-19 pandemic, and possibly at a faster pace than before. Ecological and sociological vulnerability characterizes a large part of the Arctic, making the use of sustainability indicators for tourism of particular importance. Their importance also involves preventing the diversity of the region, by equally incorporating internal socioeconomic, cultural, and environmental elements into tourism development and management [16]. Sustainability indicators are likewise critical in the Arctic’s protected natural areas, where many interests intertwine. Protected areas are especially prone to tourism impact, as when an area is given a protected status, the tourist sees it as a validation of the area’s value. As a result, this serves as a magnet for tourism, and subsequently as a marketing tool for the tourism industry. Hence, there is a need for efficient tools that can aid managers to reduce the negative impacts of tourism in the most vulnerable areas [17], and at the same time take into account the different needs of tourists as well as the local communities [18]. Local knowledge and public participation is a significant part of sustainable development when it comes to preventing conflicts of interest and ensuring general prosperity, and thus also in the development of sustainability indicators. As regards tourism, public participation provides a certain accord when developing tourism services.
This paper focuses on the role of public participation in determining sustainability indicators for tourism in protected areas in Iceland. It presents the development of a framework that aims to better engage stakeholders in the processes of selecting and designating indicators by effectively integrating public participation in the framework design. This research forms a part of a larger project sponsored by the Icelandic Ministry of Industries and Innovation and European Union’s Northern Periphery and Arctic Programme (NPA), which goes by the acronym BuSK (building shared knowledge capital to support natural resource governance in the Northern periphery) [19,20].
2. Sustainable Tourism Indicators
Despite the tremendous increase in knowledge and understanding of sustainable development during the past three decades, it seems that an agreement on what precisely is sustainable is still far out of reach. The methodology that has proven most successful is the employment of sustainability indicators. Miller and Twining-Ward [4] pointed out that sustainability indicators assist in making complicated processes more transparent and thus easier to comprehend and analyze. They also point out that when sustainability indicators cover the environment, economy, and society in an equal manner, they can indicate what opportunities and/or problems are forthcoming, and hence assist in any decision-making process. Accordingly, through the use of sustainability indicators, it is possible to reliably track changes occurring in the society, economy, and ecology, and meanwhile increase the understanding of the impacts of specific factors, as well as the causality between the different influential factors. Sustainable tourism indicators can similarly serve as a device for maintaining a holistic vision of the multifarious impacts of tourism.
In the early 1990s, sustainability indicators mostly involved reviewing and monitoring the economy and nature [21,22,23,24,25]. The first time the discussion was directed towards the development of societies, prosperity, and administration as vital parts of sustainable development was at the UN conference on sustainable development held in Johannesburg in 2002 [26]. This conference thus marked a certain turning point in the discussion on sustainable development, as ever since there has been an increased emphasis on the importance of a holistic vision of all the influential factors, so as to gain an understanding of their interconnectedness. Since then, there has been an increasing number of scientific research, e.g., [24,27,28,29,30,31,32,33,34], focusing on the importance of developing integrated sustainability indicators that describe the total impact of tourism, as well as the connection between tourism and the complex systems of the society, economy, and environment. Hence, only through an overall vision is it possible to see how the different parts from each system interconnect with the three main pillars of sustainability, as well as between themselves [32]. This is emphasized in the UN SDGs, where tourism is presented as a part of larger systems [2]. Tourism has an impact that touches all the 17 SDGs. A recent review of sustainable tourism indicators in relation to the SDGs [25] revealed, however, a lack of direct attention to the SDGs in tourism research undertaken after the launch of the SDGs in 2016. Furthermore, most of the research tends to overlook the dimension of governance.
According to Torres-Delgado and Saarinen [5], there exist two types of indicators: simple and complex (Table 1). Simple indicators, also called conventional indicators, have evolved from objective development indicators and are usually used to describe large areas or countries as a whole. Such indicators rely on quantitative research and standardized numerical data [4,5,35,36]. They are most often used to describe the state of a development and then connected to the so-called development index. A development index is an objective evaluation of a development towards a certain goal, whose objective is mostly to compare areas and countries through standardized numerical data [37]. The purpose of simple indicators is thus to simplify the reality of each area to facilitate a comparison between areas. Their key advantage is that they are based on reliable data [37]. Their flaws are most apparent in the fact that they can easily be misinterpreted or manipulated to impact decision-making. Too much simplification of any circumstances can furthermore provide misleading information [4,5]. Simple indicators, therefore, do not provide a proper holistic vision of multifarious local effects, challenges, and opportunities.
Complex indicators are subjective and concentrate on the distinctiveness of a specific area [5]. Sustainability indicators are classified as complex indicators. Owing to their complexity, sustainability indicators are integrated, meaning that they are composed of many indicators, seeking to describe in detail the overall picture of an area through the various influential factors [32]. They rely on quantitative and qualitative data, such as the analysis of an area’s uniqueness, the attitude of interest groups, as well as the knowledge and experience of residents [5,38]. Consequently, they cover complex systems more efficiently, such as the systems that characterize tourism, wherever it is practiced with all its diverse use of resources and innumerable stakeholders. The principal quality of sustainable indicators is the holistic vision of the impact of different factors and how they interconnect. Such a holistic vision provides the transparency necessary to understand the different influential factors, as well as the causal connection between them. Conversely, their complexity is their primary flaw. Monitoring of the labor market in a specific area can be used as an example of the difference between the approach of simple and complex indicators. Simple indicators monitor the labor market, for instance through the variables ‘average income’ and ‘number of unemployed persons’. Complex indicators, or sustainability indicators, would additionally evaluate many more variables in order to increase the understanding of the overall picture. These could include variables, such as ‘number of working hours on an average income necessary to meet basic needs’ or ‘diversity of job opportunities and the flexibility of the labor market’.
In 1996, the UNWTO (United Nations World Tourism Organization) released its first criteria for the use of sustainability indicators for tourism, based on several case studies, under the title: “What Tourism Managers Need to Know: A Practical Guide to the Development and Use of Indicators of Sustainable Tourism” [9]. According to Dymond [39], these criteria and the indicators that came with them are the first that could be used to assess the sustainable development of tourism in all types of destinations. The UNWTO’s development of sustainability indicators for tourism happened alongside the UN’s development of general sustainability indicators, i.e., “The United Nations Commission on Sustainable Development: Theme Indicator Framework”, which was also published in 1996 [6]. Since 1996, the UNWTO has constantly been improving the methodology for developing sustainability indicators, whilst also re-examining the existing indicators regularly. In the UNWTO’s instructions from 2004 [11], an emphasis is placed on twelve issues, which should be taken into consideration if the objective is to develop sustainable tourism that may be divided into three stages: (i) research and organization, (ii) indicators’ development, and (iii) implementation (Table 2). This applies to all types of destinations. In the instructions, the main emphasis is on communicating with residents about development and the impact of tourism, their attitude towards a declaration of protection in their municipality, and the effect of an act declaring nature protection in their locality. Moreover, public participation in decision-making is highlighted, for example by monitoring through a regular use of surveys.
In 2011, a subsidiary organ of the UNTWO, The Global Sustainable Tourism Council, published ready-made sustainability indicators for tourism under the title “The Global Sustainable Tourism Criteria for Destinations and Performance Indicators”. These indicators are based on environmental management systems and environmental certifications [40], and thus focus more on ecosystems than on a holistic vision of the three main pillars of sustainability. These criteria, as well as the sustainability indicators that accompany them, are highly accessible and underscore many features of tourism that cannot be found in other criteria for sustainability indicators. In the same year, i.e., 2011, the OECD also published its own sustainability indicators that are called “The Green Growth Indicators”. These indicators were revised in 2014. Their primary focus is the connection between ecosystems and economies, and they are principally designed to compare the OECD member countries [41]. They are therefore mostly based on standardized nation-wide measurements and thus they are not as suitable for tourism in specific areas, such as protected areas. The European Union Regional Development Fund (ERDF) has also been focusing on the development of sustainability indicators. It has not created any specific indicators for tourism, however, the ERDF has developed detailed criteria and indicators for coastal areas, which go by the name “SUSTAIN” [42]. Since tourism plays a significant role in many coastal areas in Europe, these criteria contain many indicators whose function is to assess the impact of tourism. The SUSTAIN data and procedures have been made accessible to all, without any cost, thus they have become quite widely used and their utility has been effectively explored. The origins of development of the SUSTAIN criteria and indicators can be traced back to an EU project from 1999 called “Voluntary Initiative for Sustainability in Tourism (VISIT)”, which mainly focused on environmental certifications in tourism. In this project, drafts for sustainability indicators were developed based on environmental certifications and thus the principal emphasis was on natural resources. The VISIT project’s sustainability indicators were further developed in a project titled “CoastLearn”, where other dimensions of sustainability were taken into consideration, and later integrated in the SUSTAIN project [42]. As a result of the tremendous amount of work that has gone into developing SUSTAIN, both the criteria and the indicators have gone through numerous screening processes. Furthermore, they have been tested and adapted to many, as well as specific, areas. However, neither the UNWTO’s indicators nor the OECD’s indicators for tourism have yet been specifically tested in the European Arctic region.
Although specific sustainability indicators for tourism are still lacking for the Arctic, sustainability indicators and general criteria have been developed for the region. In 1998, the prime ministers and other political leaders in the Nordic countries signed a declaration on a sustainable Nordic region. Among other things, the declaration states that the current and coming generations must be guaranteed a safe and healthy existence; that renewable resources should be utilized, yet also explicitly protected; and that a potent awareness ought to be created in Nordic societies of the procedures that lead to sustainable development. Consequently, the Nordic Council of Ministers was assigned the role of developing a policy on sustainable development in the Nordic countries with a primary focus on the common interests of the Nordic region [43]. As a result of this strategic effort, the Nordic Sustainable Development Indicators were developed. Their primary function is to compare national sustainable development between the Nordic countries, and thus they are mostly based on conventional indicators [14].
Indicators based on a report titled “Arctic Human Development Report” were first released in 2006 under the name “Arctic Social Indicators (ASIs)”. The report had, as its primary objective, to guarantee a certain number of indicators to describe the social development of the Arctic, as well as to ensure that the indicators were feasible according to each area’s access to reliable data and monitoring possibilities [12]. Therefore, all the ASIs must meet three demands: (i) that data are present locally, i.e., that the data are not only accessible at a national level; (ii) that data for at least five consecutive years are available and; (iii) that data are accessible both to aboriginal residents, as well as other inhabitants of the country [13]. Due to these demands, the ASIs are few and restrictive, yet highly feasible. According to Ozkan and Schott [44], these indicators are the closest thing to being adaptable to the Arctic region, nevertheless, they should be viewed with a certain reserve as they do not properly represent environmental issues.
Extensive work has thus been carried out as regards the development of sustainable indicators that are applicable in the Arctic. The existing work is invaluable for the development of sustainable tourism indicators in the Arctic, especially those that are grounded on repeated evaluation and screening processes. Accordingly, a literature review was found to be critical in the selection process of key indicators in the development of the framework in this study. However, the essence of the concept of sustainable development implies that indicators that are to promote sustainability must be based on local conditions. It is therefore vital that the development of sustainability indicators take into account the unique circumstances that characterize each area, as regards both ecosystems and societies.
3. Indicator Framework Development
3.1. Study Area
Before the outbreak of the Covid-19 pandemic, the growth in tourism in Iceland had been monumental and among the highest at a global level. This exponential growth has had a diverse impact on the country and its population, both positive and negative. It is important to recognize these effects and understand their interconnectedness, otherwise, they cannot be managed towards sustainability.
Snæfellsjökull National Park was selected as a case study for the public participation indicator framework development. The national park has grown to be one of Iceland’s most popular tourist attractions. It is located on the westernmost point of Snæfellsnes peninsula, covering some 170 km2 stretching circular around the picturesque stratovolcano Snæfellsjökull with an ice cap covering its top, which holds the area’s highest point of 1446 m a.s.l. [45] (Figure 1). The ice cap presently covers less than 10 km2, and has lost more than 50% of its size in less than a hundred years [46]. Snæfellsjökull National Park was established in 2001 [47]. It is characterized by a volcanic landscape, mainly postglacial basaltic lava originated from Snæfellsjökull. During the Holocene, about twenty eruptions took place, the largest one around 1800 years ago [48]. The lava fields are very porous, resulting in low groundwater level, which affects the vegetation of the area, which is characterized by heathland and moss heath [49]. Both the lava and the vegetation are especially vulnerable to external impacts [50] such as tourism. There are five municipalities located in the Snæfellsnes peninsula, with a population of 3882 on the 1st of January 2018 [51]. Representatives from these five municipalities participated in the case study supporting the framework development.
3.2. Key Work Components in the Framework
The indicator framework developed is composed of the following five work components (Figure 2):
- (i)
- Selection of sustainability indicators based on a literature review on international standards and criteria;
- (ii)
- Selection of indicators that fit the area in question based on a compilation and reviewing of local literatures and reports with respect to sustainable development, as well as field observations of local condition;
- (iii)
- Public evaluation of the selected indicators’ applicability and priorities. The public is composed of local stakeholders related to each project;
- (iv)
- Experts’ evaluation of the indicators’ measurability and monitoring, as well as their causal relations;
- (v)
- An overall assessment of each indicator’s applicability for the area in question.
The framework stresses the importance of a holistic approach to tourism, yet that sustainability indicators have to be site specific and take into account local conditions concerning society and the environment [52,53]. In such an overall view, local stakeholders are a fundamental part of the system.
3.2.1. Selection of Key Indicators
The first step in the framework development was the selection of key indicators. Key indicators are critical when public participation is to be a part of the development of sustainability indicators. According to Miller and Twining-Ward [4], it is most effective to prepare preliminary lists with possible sustainability indicators and present those to the participants for further evaluation and processing. If the participants start from scratch it is likely that the result of their evaluation process will be a long list of ideas for indicators that cannot be easily applied and lack a clear causality.
Key indicators should describe both the natural and social conditions, as well as the characteristics of the area being examined. Thus, they correspond to sustainability indicators that analyze tourism as a part of complex societies and ecosystems by employing them to monitor environmental, economic, and social processes in an equal manner. The integrated sustainability indicators selected for the case study area were based on the findings of the literature review, along with localized criteria for Snæfellsjökull National Park and its surrounding municipalities. The following criteria were found to be the most suitable for the selected study area: (i) The sustainability indicators for coastal areas (SUSTAIN) that were developed by the ERDF [42]. (ii) The Global Sustainable Tourism Criteria for Destinations and Performance Indicators from the Global Sustainable Tourism Council [34]. (iii) The UNWTO’s criteria for sustainability indicators for tourism in protected areas [11]. (iv) The Arctic Social Indicators [12,13]. (v) Suitable sustainability indicators for tourism obtained from the academic literatures, e.g., [34,53,54,55]. (vi) Key domains and sustainability indicators of the environmental certification of the five municipalities in Snæfellsnes [56].
After further reviewing these criteria with respect to the localized circumstances, 44 sustainability indicators were chosen as key indicators to promote the sustainable development of tourism in the area. The key indicators were divided into four categories, i.e., economy, society and wellbeing, environment, and governance, all of which are equivalent to the four pillars of sustainable tourism according to McCool et al. [57]. They argued that sustainability will not become a reality without government interference. Therefore, they considered governance to be the fourth pillar of sustainable development and underscored that any given development, no matter how economically positive, socially accepted, and environmentally friendly, will not be executed without the acceptance and support of the government. The division of the selected 44 key indicators into the four categories was: economy (12 indicators), society and wellbeing (13 indicators), environment (12 indicators), and governance (seven indicators) (Table 3).
3.2.2. Indicators Evaluation
Evaluation of the selected key indicators was based on a combination of local and expert knowledge. Evaluation of local stakeholders as regards the indicators’ adaptability and prioritization on the one hand, and evaluation of experts as regards the indicators’ measurability and causal relation on the other hand.
3.3. Public Evaluation
Public participation is an important process in sustainable development [48,49,50,51] and thus also in the development of sustainability indicators [4,25,32,58]. Typically, public participation has been defined as an active process where residents can affect decision-making so that it can contribute to increasing their quality of life [59]. In Iceland, public participation has so far mostly been related to consultation because of developments and construction that falls under the Environmental Impact Assessment Act No. 106 from 2000 [60] and the Strategic Environmental Assessment Act No. 105 from 2006 [61], both of which mandate consultation meetings with local residents. It is fair to say that Act No. 106/2000 was ground-breaking when it comes to public participation because of developments. In the act’s goal statement, there is a specific emphasis on promoting “the cooperation of any interest group or parties affected by the developments… [as well as] to introduce to the public the environmental impact of the developments that fall under the provisions of these laws, along with possible retaliatory actions because of them, while allowing the public to comment or present any information […]” (Act No. 106/2000, art. 1c og art. 1d). Infrastructure developments for the tourism industry, as for any other sector, come within the Environmental Impact Assessment Act. However, in such an assessment, only the scope of the development is taken into consideration, and not the impact of increased tourism that follows constructions, including demands of better infrastructure and increased service, and subsequently increased tourism impacts.
Many distinct methods exist for gathering data from different interest groups depending on the purpose and objective of each project. In this study, the public’s role was to evaluate and categorize the 44 selected key indicators. For that purpose, it was decided that a focus group should be assembled in an attempt to best represent all stakeholders. When composing a focus group, the main thing is to bring together individuals who represent different interest groups and individuals who have different experiences of the area in focus due to work or residence, and are then experts in a specific field compared to the other participants [62,63]. It is furthermore important that the number of participants is not too large, so that each participant can express his/her own opinion. This is especially important when evaluating complex issues, such as sustainability, where experts recommend around ten participants to be able to analyze results effectively [4,62,64]. The different tourism stakeholders that are influenced by the existence of the Snæfellsjökull National Park were thus mapped, and five different interest groups were defined, i.e., the tourism industry, NGOs, the cultural sector, local government, and the national park. Two representatives were nominated for each group, a total of ten participants. During the focus group meeting, a mixed technique was employed, based on a combination of individual assignments, group work, and open discussions, hence aiming at highlighting the main qualities of a group interview. The first part of the meeting was dedicated to individual assignments and the latter to group work. During the individual assignments, each participant was asked to evaluate the practicability of the selected indicators by answering three evaluative questions for each indicator: (1) Is it clear what this indicator stands for? (2) Is the indicator relevant to current circumstances? (3) Is it simple to monitor this indicator? A 5-point Likert scale was employed, where 1 = strongly disagree and 5 = strongly agree. Furthermore, each participant was asked to evaluate the importance of the indicators by ordering by priority within each category (i.e., economy, society and wellbeing, environment, and governance), where the most important indicator was given the value 1, and so forth. The participants were then divided into groups that discussed each of the four categories with the goal of agreeing on the priority order of the indicators by using the same method as in the individual assignment. The participants were also offered the opportunity to suggest indicators they felt to be missing, along with general commentary. This was followed by an open discussion where participants were invited to assess the evaluation process and give their opinion on public participation in developing and monitoring sustainable tourism indicators. No specific measures nor monitoring methods for each indicator were given so that the participants could evaluate their own understanding of the indicators and discuss them with an open mind.
The indicators’ assessment by the participants resulted in changed wording of eighteen indicators that, in their opinion, became more clear, transparent, and representable for the area. Three indicators were crossed out, as they were considered either obscure or not descriptive of the area, while four new ones were added. Among those was climate change, which was considered to be such an urgent matter that it deserved to be a special indicator. The other new indicators were indirect income from tourism, cultural heritage and history, and safety issues and information flow to tourism. The total number of indicators after the local stakeholders assessment was 45 (Table 3). After prioritizing the indicators, the most important indicators in each category according to the participants were: job opportunities and the labor market (economy), residents’ experience of tourism (society and wellbeing), carrying capacity of vegetation and soil (environment), and policymaking for sustainable development policy making (governance).
3.4. Experts Evaluation
Since monitoring is one of the primary premises so that sustainability indicators can function as a measurement for sustainability, there is an ever-increasing focus on assessing the feasibility of monitoring. The monitoring feasibility assessment for each indicator began as a response to a criticism of sustainability indicators, i.e., that the indicators cannot easily be adapted to the specific needs of an area. Furthermore, that the access to measurements, statistics, and other monitoring methods differs quite a lot between countries and regions. So far, in academic discussions concerning the development of sustainability indicators only, few examples can be found where an emphasis is placed on the practicality of monitoring possibilities. However, some of the international criteria stress the promotion of this aspect. The OECD [41] has, for example, presented suggestions on how to reinforce monitoring in separate areas. The organization’s indicators are classified as short-term, medium-term, or long-term indicators, depending on whether data and measurements are available, somewhat available, or not at all. The Nordic Council [13] evaluates the feasibility of their Arctic Social Indicators (ASIs) depending on what monitoring, measurements, and statistical information can be found in the Arctic. Therefore, all the ASIs must fulfill three demands, i.e., (i) that the data are not only available at a national level but also locally; (ii) that data exist for at least five consecutive years; and (iii) that the data are available both to aboriginal residents and other local residents. Due to these demands, the ASIs are few and restrictive, whilst also highly practical for the Arctic compared with many other criteria. In the case of sustainable tourism, it is vital that monitoring covers the integration of data, which encompasses the impact of tourism on the environment, society, and local economy, as well as tourists’ experiences [65].
In this study, a monitoring framework was designed based on the classification of the OECD [41], which can be used to assess the feasibility of monitoring sustainability indicators for tourism (Table 4). The framework was tested for all the 45 key indicators that had passed the assessment of the focus group participants. However, to gather and compile all possible monitoring data demands considerably more time, effort, and contributors than this research allowed for. Therefore, the feasibility assessment is only a sample of the framework’s utility, as in Iceland, there is an overall lack of basic data and monitoring of tourism in general. Moreover, a monitoring strategy for each area is a precondition for the development of sustainable tourism in protected areas.
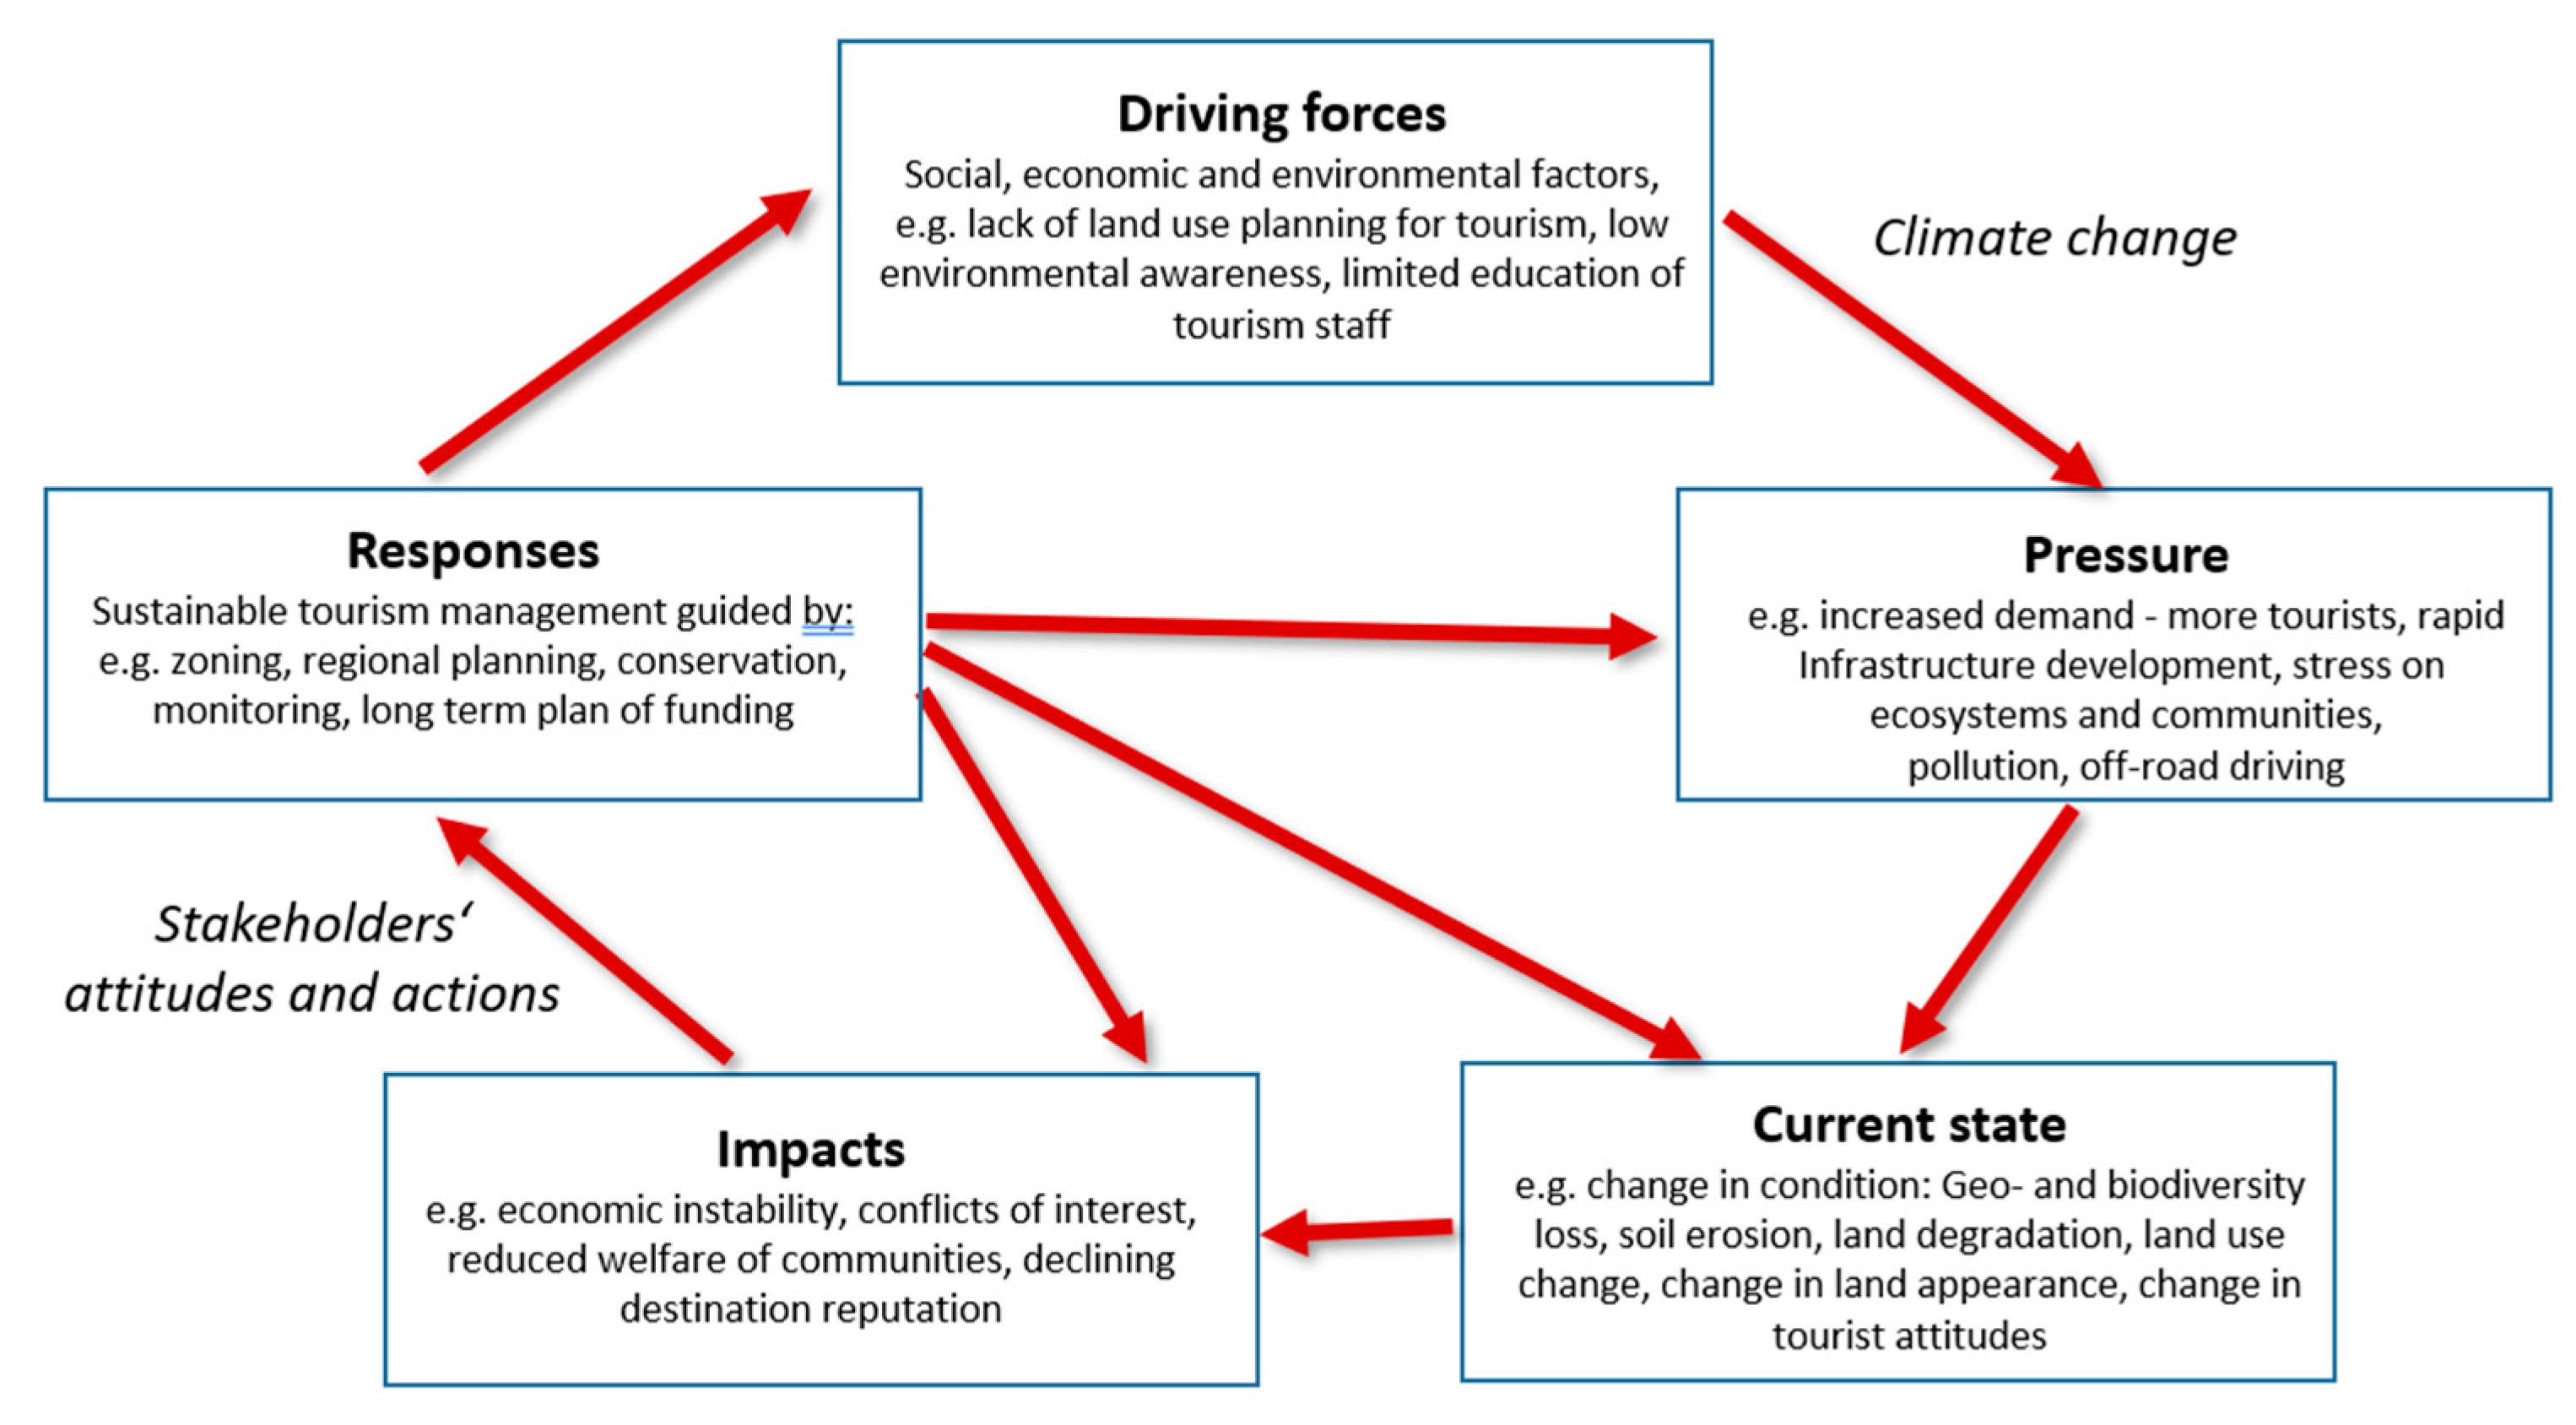
In order to analyze the causality between different environmental impacts and tourism, the DPSIR causal framework of the European Environment Agency (EEA) was applied. DPSIR stands for driving forces, pressure, current state, impacts, and responses. The framework was designed in the late 1990s as a tool for analyzing and understanding the root of environmental problems and thus identifying the appropriate response/action to those problems [66]. In recent years the development of the DPSIR has brought it closer to the concept of sustainability and an analysis of the causality between societal, economic, and environmental factors. Nevertheless, it has been criticized for not covering the dynamics that characterize most systems, as an understanding of the dynamics of systems is one of the main premises of sustainability. Accordingly, DPSIR is closer to being a classification than a model [67]. It has also been criticized for not fully incorporating the attitudes of the different stakeholders, since the attitudes and actions of interested parties are generally connected with the cause or consequence of a certain impact [67].
Since nature is the primary attraction for tourists in Snæfellsjökull National Park, the DPSIR framework was considered appropriate to analyze the causality between the distinct environmental impacts and tourism. In combination with the indicators’ evaluation by the local stakeholders, it is believed that DPSIR can strengthen the integrated analysis needed to form a policy on the sustainable development of tourism. The social and economic development that follows growth in tourism is a strain on the environment, which can lead to changes in its condition. This development then impacts the ecosystem and public health, which then results in a societal response that affects the driving forces, pressure points, or condition of a system, as well as the governmental response (Figure 3). Hence, it is vital to analyze the causality between all the indicators in order to obtain a holistic overview.
The results of the DPSIR analysis revealed that the majority of the governance indicators describe responses (Table 5), which is perhaps not surprising. When it comes to sustainability, the government’s responses are essential as they impact all factors of the system. Moreover, the results demonstrate that most economic, social, and environmental indicators describe a state that reflects the current status with regard to the environment and tourism, both in the national park and in the surrounding communities. However, this current state is not stable and can easily alter due to pressure, which depends on the different driving forces. Therefore, it is particularly important to know and understand the system’s driving forces, as well as its pressures. Besides, it is necessary to understand the causality between them so they can be managed in a sustainable manner. The key indicators that were identified as driving forces were population growth, local image and culture according to residents, and sustainability and environmental awareness of tourists. Indicators identified as pressure were transportation and traffic, direct income from tourism, travel behavior and length of stay, environmentally friendly management, waste management, energy use, and off-road driving.
3.5. Each Indicator’s Overall Assessment
Since tourism is a part of a complex system that alters incessantly, it is important to keep in mind that sustainability indicators must be continually revised and updated. International criteria are constantly developing; localized goals and local projects, many of which the residents actively participate in, are always contributing new knowledge and adding to locals’ experiences. With increased strain from tourism, the residents’ attitudes toward what indicators are important and can change rapidly. Moreover, the data and measurements available vary, along with monitoring possibilities. Hence, sustainability indicators must be revised regularly, and the process repeated. Sustainability indicators should thus never really be considered completed [38].
4. Discussion and Conclusions
4.1. Sustainability Indicators as a Tool for Managing Tourism Development in the Arctic
Sustainable tourism is not a new type of tourism. In essence, sustainable tourism is a management process, which has long-term considerations and a holistic vision, along with an understanding of the causality between different factors in the overall picture. An understanding of the overall picture is critical for sustainability in order to promote an understanding of the synergy of different impact factors. Still, there seems to be a long way to go. Hall [68] stated that with respect to natural resource use, tourism today is less sustainable than ever despite more than 30 years of international effort towards sustainable development. Sharpley [69] agreed and argued that tourism has witnessed little evidence of progress towards a more sustainable tourism sector. He criticized that the developmental benefits of tourism still are primarily defined in economic terms, both by international bodies and in destination policies. As emphasized in this study, the three traditional dimensions of sustainable development, i.e., economy, society, and nature, are a part of a closed system [3], meaning that changes in one dimension affect the others and that tourism development that goes beyond the boundaries between them is unsustainable. Thus, sustainability means enforcing certain defined boundaries, and to be able to define boundaries, an understanding of the system is essential. Sustainability indicators are tools that have proven to be a successful aid in defining and creating system boundaries [27,58], and seek to simplify the system and make it more transparent. To capture these elements and provide a holistic vision of the impact of economic, environmental, and social factors, as well as the causality between influential factors, sustainability indicators must be integrated. Sustainability indicators are thus, by nature, complex, as they are integrated from many indicators in order to cover the overall picture, with all its distinct influential factors and dissimilar interest groups [32]. Due to this, they can adapt to the diverse circumstances of areas, which makes them different from conventional simple indicators. However, as regards sustainable tourism, ever more research, e.g., [4,5,36,70,71,72], indicates that a better result can be reached by combining conventional indicators with sustainability indicators, since the monitoring of conventional indicators is often less complicated and consequently less expensive than the monitoring of integrated indicators. The results of this study support this.
The Arctic possesses unique natural resources, such as distinctive ecosystems, geosites, relatively untouched nature, and wilderness, which during the past decades have been attracting a growing number of tourists [73,74,75]. Increasingly, the tourism industry has made use of these natural resources, and in the most popular destinations, the tourism industry is gradually altering the destinations by building infrastructure to accommodate more tourists, e.g., improved access, parking spaces, walking paths, lavatories, souvenir stores, restaurants, and accommodation. Such alterations change visitors’ experiences [76,77,78], stressing the critical importance of a holistic approach when planning Arctic tourism. A holistic approach is no less important for maintaining the diversity of the Arctic region [16]. Many of the Arctic’s most popular destinations are furthermore located within protected areas. Accordingly, tourism plays an ever-larger part within the Arctic’s protected areas, and with growing tourism, this role will likely expand even further, as a declaration of protection is a signpost for something of interest, and as such a magnet for tourism.
4.2. The Role of Public Participation for Determining Sustainability Tourism Indicators
Effective communication of indicator selection and determination is of vital importance in sustainable tourism development. The locals’ evaluation of the indicators adaptability and prioritization in the case study presented in this paper showed the factors considered most important to increase the community’s prosperity, stressing the fundamental role of public participation in sustainable development, and likewise in the development of sustainability indicators for tourism. In this study, the term “public” embraced local stakeholders affected by a change due to tourism, but as pointed out by Sandström et al., [79] the term when used in public participation has yet no clear definition or universal agreement. As regards Arctic tourism, Ozkan and Schott [44] stressed that locals’ prosperity should be a major factor in the development of sustainable tourism. It has been shown in this paper that the making of sustainability indicators can be an ideal platform for local voices to be heard, and thus for them to have a significant stake in the overall process of tourism development. However, as tourism is a complex and dynamic system impacting multiple stakeholders, its transformation toward sustainability therefore demands a holistic approach to implementation, where public participation includes all stakeholders affected by tourism. This is highlighted in the UN Sustainable Development Goals [80], emphasizing the need for changing governance in land use management towards active collaborations between different stakeholders to organize common efforts towards achieving sustainability.
The value of integrating locals’ and experts’ knowledge in land use management has long been demonstrated by many [81,82]. According to Persson et al. [83], the division between the two-knowledge system has distorted and hampered the understanding of sustainability issues, and subsequently the implication of sustainable development. This was supported by Hall [68] underlining that knowledge may not be dominated by experts. On the contrary, it must reflect each community, meaning that public participation “needs to extend well beyond the narrowly envisaged public-private partnership” that is emphasized in the SDGs [68], p. 13. Thus, the role of public participation in determining sustainability indicators for Arctic tourism will be both significant and successful.
4.3. Management Implication
From a systemic perspective, sustainability indicators are tools that help to organize and direct tourism development so that it maintains sustainability within the system. Sustainability indicators also help to increase the system’s transparency, thus making complicated processes easier to understand, as well as the causality between the different impact factors. To manage tourism sustainably, it is therefore of vital importance to both know and understand the system.
Local knowledge is one of the key elements in understanding the system, and thus in defining boundaries between economies, societies, and the environment within the system. Local knowledge influences residents’ perception and their attitudes, and accordingly a community’s well-being. Public participation should therefore be a significant part of tourism development and decision making. The role of public participation should also be fundamental in determining sustainable tourism indicators, particularly in areas that are characterized by ecological and sociological vulnerability, such as in the Arctic protected areas.
The indicator framework presented in this paper emphasizes three major steps: the selection of key indicators, their evaluation, and the indicators’ recurrent assessment and improvements. Carefully selected key indicators are critical in this process to motivate the work of the public participants and make their work more effective. The indicators’ adaptability and prioritization should be based on local stakeholders’ evaluation, while their measurability and causal relation should be based on expert evaluation. Such integration of local and scientific knowledge in the determination of indicators will give the best results. The current pandemic clearly reflects the dynamic nature of tourism as an industry, underlining the framework’s last step, i.e., the need for the indicators’ constant revision, updating, and improvements.
Funding
This study was supported by the Icelandic Ministry of Industries and Innovation and the EU Northern Periphery and Arctic Program 2014–2020.
Institutional Review Board Statement
Not applicable.
Informed Consent Statement
Not applicable.
Data Availability Statement
Not applicable.
Acknowledgments
The author would like to thank Kristín Rut Kristjánsdóttir, Kristín Vala Ragnarsdóttir, Jón Björnsson, Guðmundur Björnsson, and Johannes T. Welling for their valuable collaboration during the various stages of this project. Sincere appreciation goes also to all the participants in the workshops underpinning this research. Micael Runnström is gratefully acknowledged for valuable comments and suggestions on the final manuscript. Further thanks are given to Guðrún Valdimarsdóttir for language correction.
Conflicts of Interest
The author declares no conflict of interest.
References
- WCED (World Commission on Environment and Development). Our Common Future; Oxford University Press: Oxford, UK, 1987. [Google Scholar]
- UN (United Nations). Transforming our World: The 2030 Agenda for Sustainable Development. United Nations A/RES/70/1. 2015. Available online: https://www.un.org/en/development/desa/population/migration/generalassembly/docs/globalcompact/A_RES_70_1_E.pdf (accessed on 28 December 2020).
- Griggs, D.; Stafford-Smith, M.; Gaffney, O.; Rockström, J.; Öhman, M.C.; Shyamsundar, P.; Steffen, W.; Glaser, G.; Kanie, N.; Noble, I. Sustainable development goals for people and planet. Nat. Cell Biol. 2013, 495, 305–307. [Google Scholar] [CrossRef]
- Miller, G.; Twining-Ward, L. Monitoring for a Sustainable Tourism Transition. The Challenge of Developing and Using Indicators; CABI Publishing: Wallingford, UK, 2005. [Google Scholar]
- Torres-Delgado, A.; Saarinen, J. Using indicators to assess sustainable tourism development: A review. Tour. Geogr. 2013, 16, 31–47. [Google Scholar] [CrossRef]
- UN (United Nations). The CSD Theme Indicator Framework; United Nations Division for Sustainable Development: New York City, NY, USA, 1996. [Google Scholar]
- UN (United Nations). The CSD Theme Indicator Framework, 2nd ed.; United Nations Division for Sustainable Development: New York City, NY, USA, 2001. [Google Scholar]
- UN (United Nations). Indicators of Sustainable Development: Guidelines and Methodologies, 3rd ed.; UN Department of Economic and Social Affairs: New York City, NY, USA, 2007. [Google Scholar]
- UNWTO (United Nations World Tourism Organization). What Tourism Managers Need to Know: A Practical Guide to the Development and Use of Indicators of Sustainable Tourism; UNWTO (United Nations World Tourism Organization): Madrid, Spain, 1996. [Google Scholar]
- UNWTO (United Nations World Tourism Organization). Agenda 21 for the Travel and Tourism Industry; UNWTO, WTTC and Earth Council Publication: Madrid, Spain, 1996. [Google Scholar]
- UNWTO (United Nations World Tourism Organization). Indicators of Sustainable Development for Tourism Destinations; A guidebook; UNWTO (United Nations World Tourism Organization): Spain, Madrid, 2004. [Google Scholar]
- Nordic Council. Arctic Social Indicators ASI II Implementation. In TemaNord 2010:519; Larsen, J.N., Schweitzer, P., Fondahl, G., Eds.; Nordic Council: Copenhagen, Denmark, 2010. [Google Scholar]
- Nordic Council. Arctic Social Indicators. In TemaNord 2014:568; Larsen, J.N., Schweitzer, P., Fondahl, G., Eds.; Nordic Council: Copenhagen, Denmark, 2014. [Google Scholar]
- Nordic Council. Indicators for Sustainable Development. 2017. Available online: https://www.norden.org/en/nordic-council-of-ministers/ministers-for-co-operation-mr-sam/sustainable-development/indicators-for-sustainable-development-1 (accessed on 20 August 2019).
- Ólafsdóttir, R.; Tuulentie, S.; Hovgaard, G.; Zinglersen, K.B.; Svartá, M.; Poulsen, H.H.; Söndergaard, M. The contradictory role of tourism in the northern peripheries: Overcrowding, overtourism and the importance of tourism for rural development. In Sharing Knowledge for Land Use Management: Decision-Making and Expertise in Europe’s Northern Periphery; McDonagh, J., Tuulentie, S., Eds.; Edward Elgar Publishing: Cheltenham, UK, 2020; pp. 86–99. [Google Scholar]
- Saarinen, J.; Varnajot, A. The Arctic in tourism: Complementing and contesting perspectives on tourism in the Arctic. Polar Geogr. 2019, 42, 109–124. [Google Scholar] [CrossRef] [Green Version]
- Selvaag, S.K.; Aas, O.; Gundersen, V. Linking visitors’ spatial preferences to sustainable visitor management in a Norwegian national park. Eco Mont. 2020, 12. [Google Scholar] [CrossRef]
- Ólafsdóttir, R.; Sæþórsdóttir, A.D.; Noordhuizen, J.; Nijkrake, W. Sustainable Leisure Landscapes in Icelandic Rural Communities: A Multidisciplinary Approach. J. Manag. Sustain. 2018, 8, 54. [Google Scholar] [CrossRef] [Green Version]
- Ólafsdóttir, R.; Kristjánsdóttir, K.R.; Björnsson, G. Þróun Sjálfbærnivísa fyrir Ferðamennsku á Friðlýstum Svæðum [Development of Sustainability Indicators for Tourism in Protected Areas]; University of Iceland, The Icelandic Ministry of Industries and Innovation: Reykjavík, Iceland, 2018. [Google Scholar]
- McDonagh, J.; Tuulentie, S. (Eds.) Sharing Knowledge for Land Use Management: Decision-Making and Expertise in Europe’s Northern Periphery; Edward Elgar Publishing: Cheltenham, UK, 2020. [Google Scholar]
- Victor, P.A. Indicators of sustainable development: Some lessons from capital theory. Ecol. Econ. 1991, 4, 191–213. [Google Scholar] [CrossRef]
- McKercher, B. The unrecognized threat to tourism. Tour. Manag. 1993, 14, 131–136. [Google Scholar] [CrossRef]
- Pearce, D.; Hamilton, K.; Atkinson, G. Measuring sustainable development: Progress on indicators. Environ. Dev. Econ. 1996, 1, 85–101. [Google Scholar] [CrossRef]
- Milne, S.; Ateljevic, I. Tourism, economic development and the global-local nexus: Theory embracing complexity. Tour. Geogr. 2010, 3, 369–393. [Google Scholar] [CrossRef]
- Rasoolimanesh, S.M.; Ramakrishna, S.; Hall, C.M.; Esfandiar, K.; Seyfi, S. A systematic scoping review of sustainable tourism indicators in relation to the sustainable development goals. J. Sustain. Tour. 2020, 1–21. [Google Scholar] [CrossRef]
- Hák, T.; Janoušková, S.; Moldan, B. Sustainable Development Goals: A need for relevant indicators. Ecol. Indic. 2016, 60, 565–573. [Google Scholar] [CrossRef]
- Valentin, A.; Spangenberg, J.H. A guide to community sustainability indicators. Environ. Impact Assess. Rev. 2000, 20, 381–392. [Google Scholar] [CrossRef]
- Briassoulis, H. Sustainable tourism and the question of the commons. Ann. Tour. Res. 2002, 29, 1065–1085. [Google Scholar] [CrossRef]
- Farrell, B.; Twining-Ward, L. Seven Steps Towards Sustainability: Tourism in the Context of New Knowledge. J. Sustain. Tour. 2005, 13, 109–122. [Google Scholar] [CrossRef]
- Buckley, R.C. Sustainable tourism: Research and reality. Ann. Tour. Res. 2012, 39, 528–546. [Google Scholar] [CrossRef] [Green Version]
- Saarinen, J. Critical Sustainability: Setting the Limits to Growth and Responsibility in Tourism. Sustainability 2013, 6, 1–17. [Google Scholar] [CrossRef] [Green Version]
- Kristjánsdóttir, K.; Ólafsdóttir, R.; Ragnarsdóttir, K.V. Reviewing integrated sustainability indicators for tourism. J. Sustain. Tour. 2018, 26, 1–17. [Google Scholar] [CrossRef]
- Rajaonson, J.; Tanguay, G.A. Strategy for selecting sustainable tourism indicators for the Gaspésie and Illes de la Madeleine regions. TÉOROS Spec. Issue 2012, 77–84. [Google Scholar] [CrossRef] [Green Version]
- Choi, H.C.; Sirakaya, E. Sustainability indicators for managing community tourism. Tour. Manag. 2006, 27, 1274–1289. [Google Scholar] [CrossRef]
- Mikulić, J.; Kožić, I.; Krešić, D. Weighting indicators of tourism sustainability: A critical note. Ecol. Indic. 2015, 48, 312–314. [Google Scholar] [CrossRef]
- Marzo-Navarro, M.; Pedraja-Iglesias, M.; Vinzón, L. Sustainability indicators of rural tourism from the perspective of the residents. Tour. Geogr. 2015, 17, 586–602. [Google Scholar] [CrossRef]
- OECD and the European Commission’s Joint Research Centre. Handbook on Constructing Composite Indicators; Methodology and User Guide; OECD and the European Commission’s Joint Research Centre: Paris, France, 2008. [Google Scholar]
- Hart, M. Guide to Sustainable Community Indicators, 2nd ed.; Hart Environmental Data: North Andover, MA, USA, 1999. [Google Scholar]
- Dymond, S.J. Indicators of Sustainable Tourism in New Zealand: A Local Government Perspective. J. Sustain. Tour. 1997, 5, 279–293. [Google Scholar] [CrossRef]
- Global Sustainable Tourism Council. The Global Sustainable Tourism Council Criteria version 1, 1st November 2013 and Suggested Performance Indicators version 1, 10 December 2013 for Destinations. 2013. Available online: https://www.gstcouncil.org/wp-content/uploads/2013/11/Dest-_CRITERIA_and_INDICATORS_6-9-14.pdf (accessed on 22 August 2019).
- OECD. Green Growth Indicators. 2014. OECD Green Growth Studies: OECD Publishing. Available online: http://www.keepeek.com/Digital-Asset-Management/oecd/environment/green-growth-indicators-2013_9789264202030-en#page141 (accessed on 28 December 2020).
- ERDF (European Union Regional Development Fund). SUSTAIN. Measuring Costal Sustainability. A Guide for the Self-Assessment of Sustainability Using Indicators and a Means of Scoring Them; EU European Regional Development Fund, October 2012; Available online: https://www.sustain-eu.net/what_are_we_doing/measuring_coastal_sustainability.pdf (accessed on 28 December 2020).
- Government of Iceland. Sustainable Development—A New Strategy for the Nordic Countries [Sjálfbær þróun-ný stefna fyrir Norðurlönd]. 2001. Available online: https://www.stjornarradid.is/media/umhverfisraduneyti-media/media/PDF_skrar/sjalfbaernordurlond.pdf (accessed on 14 October 2018).
- Ozkan, U.R.; Schott, S. Sustainable Development and Capabilities for the Polar Region. Soc. Indic. Res. 2013, 114, 1259–1283. [Google Scholar] [CrossRef]
- NLSI (National Land Survey of Iceland). Topographical Map 1:500,000; NLSI: Akranes, Iceland, 1995. [Google Scholar]
- Björnsson, H. Jöklar á Íslandi [Glaciers in Iceland]; Forlagið: Reykjavík, Iceland, 2009. [Google Scholar]
- EAI (Environment Agency of Iceland). Þjóðgarðurinn Snæfellsjökull. Verndaráætlun 2010–2020 [Snæfellsjökull National Park. Protection plan 2010–2020]. 2010. Available online: Ust-2010_09-verndaraaetlun-snaefellsnes_www.pdf (accessed on 8 June 2019).
- Jóhannesson, H. Snæfellsnes. In Náttúruvá á Íslandi. Eldgos og Jarðskjálftar [Natural Disaster in Iceland. Volcanic Eruptions and Earthquakes] 2013; Sólnes, J., Sigmundsson, F., Bessason, B., Eds.; University Publication Press: Reykjavík, Iceland, 2010; pp. 367–377. [Google Scholar]
- CORINE. Corine Land Cover 2012 Raster Data. 2012. Available online: https://www.eea.europa.eu/data-and-maps/data/clc-2012-raster (accessed on 15 October 2019).
- Ólafsdóttir, R.; Runnström, M.C. Assessing the conditions of hiking trails in two popular tourists’ destinations in the Icelandic highlands. J. Outdoor Recreat. Tour. 2013, 3–4, 57–67. [Google Scholar] [CrossRef]
- Statistics Iceland. Population by Municipalities. 2020. Available online: https://www.statice.is/statistics/population/inhabitants/municipalities-and-urban-nuclei/ (accessed on 20 August 2019).
- Manning, T. Indicators of tourism sustainability. Tour. Manag. 1999, 20, 179–181. [Google Scholar]
- Roberts, S.; Tribe, J. Sustainability Indicators for Small Tourism Enterprises—An Exploratory Perspective. J. Sustain. Tour. 2008, 16, 575–594. [Google Scholar] [CrossRef]
- Tsaur, S.-H.; Lin, Y.-C.; Lin, J.-H. Evaluating ecotourism sustainability from the integrated perspective of resource, community and tourism. Tour. Manag. 2006, 27, 640–653. [Google Scholar] [CrossRef]
- Ng, S.I.; Chia, K.W.; Ho, J.A.; Ramachandran, S. Seeking tourism sustainability—A case study of Tioman Island, Malaysia. Tour. Manag. 2017, 58, 101–107. [Google Scholar] [CrossRef]
- Von Schmalensee, M.; Matthíasdóttir, T.; Stefánsson, R. Skref í rétta átt. Hverju hefur vinna að umhverfisvottun sveitarfélaga á Snæfellsnesi skilað? [Towards a Brighter Future. The Outcome of a Decade of Environmental Certification of the Municipalities on the Snæfellsnes Peninsula (Iceland)]. 2015. Available online: http://nesvottun.is/wp-content/uploads/2016/04/Skref_i_retta_att.pdf (accessed on 20 August 2019).
- McCool, S.F.; Butler, R.W.; Buckley, R.; Weaver, D.; Wheeller, B. Is Concept of Sustainability Utopian: Ideally Perfect but Impracticable? Tour. Recreat. Res. 2013, 38, 213–242. [Google Scholar] [CrossRef] [Green Version]
- Blackstock, K.L.; White, V.; McCrum, G.; Scott, A.; Hunter, C. Measuring responsibility: An appraisal of a Scottish National Park’s sustainable tourism indicators. J. Sustain. Tour. 2008, 16, 276–297. [Google Scholar] [CrossRef]
- Oakley, P. Projects with People: The Practice of Participation in Rural Development; International Labour Office: Geneva, Switzerland, 1991. [Google Scholar]
- Icelandic Act no. 106/2000 on environmental impact assessment [Lög um mat á umhverfisáhrifum]. Available online: www.althingi.is (accessed on 28 December 2020).
- Icelandic Act no. 105/2006 on strategic environmental assessment [Lög um umhverfismat áætlana]. Available online: www.althingi.is (accessed on 28 December 2020).
- Esterberg, K.G. Qualitative Methods in Social Research; McGraw Hill: New York City, NY, USA, 2001. [Google Scholar]
- Mathevet, R.; Antona, M.; Barnaud, C.; Fourage, C.; Trébuil, G.; Aubert, S. Contexts and Dependencies in the ComMod Processes; Springer Science and Business Media LLC: Berlin, Germany, 2014; pp. 103–125. [Google Scholar]
- Therivel, R. Strategic Environmental Impact Assessment in Action; Earthscan: London, UK, 2004. [Google Scholar]
- Newsome, D.; Moore, S.; Dowling, R. Natural Area Tourism: Ecology, Impacts and Management, 2nd ed.; Channel View Publications: Bristol, UK, 2013. [Google Scholar]
- OECD. Environmental Indicators: OECD Core Set; Organization for Economic co-operation and Development: Paris, France, 1994. [Google Scholar]
- Carr, E.R.; Wingard, P.M.; Yorty, S.C.; Thompson, M.C.; Jensen, N.K.; Roberson, J. Applying DPSIR to sustainable development. Int. J. Sustain. Dev. World Ecol. 2007, 14, 543–555. [Google Scholar] [CrossRef]
- Hall, C.M. Constructing sustainable tourism development: The 2030 agenda and the managerial ecology of sustainable tourism. J. Sustain. Tour. 2019, 27, 1044–1060. [Google Scholar] [CrossRef]
- Sharpley, R. Tourism, sustainable development and the theoretical divide: 20 years on. J. Sustain. Tour. 2020, 28, 1932–1946. [Google Scholar] [CrossRef]
- Sinclair, A.J.; Diduck, A.P.; Vespa, M. Public participation in sustainability assessment: Essential elements, practical challenges and emerging directions. In Handbook of Sustainability Assessment; Morrison-Saunders, A., Pope, J., Bond, A., Eds.; Edward Elgar Publishing: Cheltenham, UK, 2015; pp. 349–374. [Google Scholar]
- Simpson, M.C. An integrated approach to assess the impacts of tourism on community development and sustainable livelihoods. Community Dev. J. 2007, 44, 186–208. [Google Scholar] [CrossRef] [Green Version]
- Tanguay, G.A.; Rajaonson, J.; Therrien, M.-C. Sustainable tourism indicators: Selection criteria for policy implementation and scientific recognition. J. Sustain. Tour. 2013, 21, 862–879. [Google Scholar] [CrossRef] [Green Version]
- Sæþórsdóttir, A.D. Tourism Struggling as the Icelandic Wilderness is Developed. Scand. J. Hosp. Tour. 2010, 10, 334–357. [Google Scholar] [CrossRef]
- Ólafsdóttir, R.; Sæþórsdóttir, A.D. Public Perception of Wilderness in Iceland. Land 2020, 9, 99. [Google Scholar] [CrossRef] [Green Version]
- Ólafsdóttir, R.; Runnström, M.C. How Wild is Iceland? Assessing Wilderness Quality with Respect to Nature Based Tourism. Tour. Geogr. 2011, 13, 280–298. [Google Scholar] [CrossRef]
- Ólafsdóttir, R.; Haraldsson, H. Tourism spatial dynamics and causal relations: A need for holistic understanding. In A Research Agenda for Tourism Geographies; Müller, D., Ed.; Edward Elgar Publishing: Cheltenham, UK, 2019; Chapter 15; pp. 128–137. [Google Scholar]
- Tverijonaite, E.; Ólafsdóttir, R.; Thorsteinsson, T. Accessibility of protected areas and visitor behaviour: A case study from Iceland. J. Outdoor Recreat. Tour. 2018, 24, 1–10. [Google Scholar] [CrossRef]
- Haraldsson, H.V.; Ólafsdóttir, R. Evolution of Tourism in Natural Destinations and Dynamic Sustainable Thresholds over Time. Sustainability 2018, 10, 4788. [Google Scholar] [CrossRef] [Green Version]
- Sandström, S.; Sandström, P.; Nikula, A. Who is the public and where is participation in participatory GIS and public participation GIS. In Sharing Knowledge for Land Use Management: Decision-Making and Expertise in Europe’s Northern Periphery; McDonagh, J., Tuulentie, S., Eds.; Edward Elgar Publishing: Cheltenham, UK, 2020; pp. 55–69. [Google Scholar]
- UNWTO (United Nations World Tourism Organization). Tourism and the SDGs; UNWTO (United Nations World Tourism Organization): Madrid, Spain, 2017; Available online: http://www2.unwto.org/content/tourism-and-sdgs (accessed on 22 August 2019).
- Ólafsdóttir, R.; Júlíusson, Á.D. Farmers’ perception on land cover changes in NE Iceland. Land Degrad. Dev. 2000, 11, 439–445. [Google Scholar] [CrossRef]
- Welling, J.; Árnason, Þ.; Ólafsdóttir, R. Implications of Climate Change on Nature-Based Tourism Demand: A Segmentation Analysis of Glacier Site Visitors in Southeast Iceland. Sustainability 2020, 12, 5338. [Google Scholar] [CrossRef]
- Persson, J.; Johansson, E.L.; Olsson, L. Harnessing local knowledge for scientific knowledge production: Challenges and pitfalls within evidence-based sustainability studies. Ecol. Soc. 2017, 23. [Google Scholar] [CrossRef] [Green Version]
Figure 1.
The location of the case study area in Iceland.

Figure 2.
The major work processes and components in the proposed sustainability indicator framework.
Figure 2.
The major work processes and components in the proposed sustainability indicator framework.

Figure 3.
The European Environment Agency (EEA)’s driving forces, pressure, current state, impacts, and responses (DPSIR) framework and examples of causality between different factors in the development of Arctic tourism in protected areas.
Figure 3.
The European Environment Agency (EEA)’s driving forces, pressure, current state, impacts, and responses (DPSIR) framework and examples of causality between different factors in the development of Arctic tourism in protected areas.

Table 1.
Principal aspects of sustainability indicators compared to conventional ones.
| Conventional Indicators (Simple) | Sustainability Indicators (Complex) | |
|---|---|---|
| Characteristics |
|
|
| Purpose |
|
|
| Benefits |
|
|
| Flaws |
|
|
Table 2.
Issues to be taken into consideration when developing sustainable tourism according to UNWTO [11], divided into three stages.
Table 2.
Issues to be taken into consideration when developing sustainable tourism according to UNWTO [11], divided into three stages.
| Stage 1 | Stage 2 | Stage 3 |
|---|---|---|
| Research and Organization | Indicators’ Development | Implementation |
|
|
|
Table 3.
The 44 selected key indicators for sustainable development of tourism in and around Snæfellsjökull National Park, and the participants suggested changes and prioritizing.
Table 3.
The 44 selected key indicators for sustainable development of tourism in and around Snæfellsjökull National Park, and the participants suggested changes and prioritizing.
| Economy | Society and Wellbeing | Environment | Governance | |||||
|---|---|---|---|---|---|---|---|---|
| Selected key indicator | Local stakeholders suggested change | Selected key indicator | Local stakeholders suggested change | Selected key indicator | Local stakeholders suggested change | Selected key indicator | Local stakeholders suggested change | |
| 1 | Job opportunities and the labor market around the national park | Job opportunities and the labor market | Population growth around the national park | Population growth | Environmental certifications and opportunities for environmentally friendly operations | Environmentally friendly management | Sustainable development policymaking | |
| 2 | Opportunities for innovation | Opportunities for local innovation | Quality of service | Biodiversity | Land use strategy tourism development | Zoning and regional planning of tourism | ||
| 3 | Economic standard of living and pricing | Travel behavior and tourists needs | Travel behavior and length of stay | Geodiversity | Sustainability monitoring | |||
| 4 | Seasonal and all year residence | Locals’ experience of tourism | Residents’ experience of tourism | Coastal erosion | National park’s human resources and knowledge of sustainable development | |||
| 5 | Seasonal work | National park employees’ view of tourists | Off-road driving | Public participation in policymaking | ||||
| 6 | Income from tourism | Direct income from tourism | Contentment and living standards of tourism employees | Waste management | Long term appropriation of funding for the national park | |||
| 7 | Modes of transport and traffic | Transportation and traffic | Tourists’ satisfaction | Tourists’ experience and satisfaction | Air pollution and climate change | Air pollution | Locals’ experience of the national park | Residents’ experience of the national park |
| 8 | Condition of roads and parking areas | Status of equality in society | Local equality | Energy utilization | Energy use | |||
| 9 | Sanitary facilities for tourists | Lavatories and other sanitary facilities for tourists | Education and training | Residents’ education and training | Nature conservation | |||
| 10 | Import of labor | Leave out | Local image and culture according to residents | Tourists’ impact on soil and vegetation | Carrying capacity of vegetation and soil | |||
| 11 | Import of goods | Leave out | Locals sustainability and environmental awareness | Sustainability and environmental awareness of residents | Seasonal vegetation and soil carrying capacity | Leave out | ||
| 12 | Local production of goods and services | Local production and utilization of goods and services | Sustainability and environmental awareness of tourists | Management of freshwater resources | Freshwater resources | |||
| 13 | Residents‘ public health and safety | Residents’ public health | ||||||
| New | Indirect income from tourism | Climate change Cultural heritage and history | Safety issues and information flow to tourists | |||||
Table 4.
Framework to evaluate the feasibility of monitoring sustainability indicators (based on OECD [41]). The figures show the number of indicators for the case study area in each sustainability category.
Table 4.
Framework to evaluate the feasibility of monitoring sustainability indicators (based on OECD [41]). The figures show the number of indicators for the case study area in each sustainability category.
| Monitoring Practical | Monitoring Partially Practical | Monitoring Impractical | ||
| Monitoring of an indicator is practical given the current circumstances. The foundational data and measurements exist, at least at a national level, and the monitoring can be based on those. | Only a part of the data and measurements are available; the measurements are not compatible and cannot give an overall picture of the area’s sustainability. | Monitoring is impractical because of a lack of data and measurements related to this indicator. | ||
| Economy | 3 | 6 | 2 | 11 |
| Society and wellbeing | 3 | 6 | 4 | 13 |
| Environment | 8 | 2 | 3 | 13 |
| Governance | 0 | 6 | 2 | 8 |
| TOTAL | 14 (31%) | 20 (44%) | 11 (25%) | 45/100 |
Table 5.
DPSIR causal analysis of the revised key indicators.
| DPSIR | Sustainability Indicators | |||
|---|---|---|---|---|
| Economy | Society and Wellbeing | Environment | Governance | |
| Driving forces | Population growth Local image and culture according to residents Sustainability and environmental awareness of tourists | |||
| Pressure | Transportation and traffic Direct income from tourism | Travel behavior and length of stay | Environmentally friendly management Waste management Energy use Off-road driving | |
| Current state | Job opportunities and the labor market Economic standard of living and pricing Seasonal and all year residence Condition of roads and parking areas Indirect income from tourism Seasonal work | Sustainability and environmental awareness of residents Residents’ public health Quality of service Contentment and living standards of tourism employees National park employees’ views of tourists | Carrying capacity of vegetation and soil Biodiversity Geodiversity Air pollution Coastal erosion Fresh water resources | Residents’ experience of the national park National park’s human resources and knowledge of sustainable development |
| Impacts | Residents’ experience of tourism Tourists’ experience and satisfaction Local equality | Climate change | ||
| Responses | Local production and utilization of goods and services Lavatories and other sanitary facilities for tourists Opportunities for local innovation | Residents’ education and training | Nature conservation Cultural heritage and history | Sustainable development policy making Long-term appropriation of funding for the national park Zoning and regional planning of tourism Sustainability monitoring Public participation in policymaking Safety issues and information flow to tourists |
Publisher’s Note: MDPI stays neutral with regard to jurisdictional claims in published maps and institutional affiliations. |
© 2020 by the author. Licensee MDPI, Basel, Switzerland. This article is an open access article distributed under the terms and conditions of the Creative Commons Attribution (CC BY) license (http://creativecommons.org/licenses/by/4.0/).
Share and Cite
MDPI and ACS Style
Ólafsdóttir, R. The Role of Public Participation for Determining Sustainability Indicators for Arctic Tourism. Sustainability 2021, 13, 295. https://doi.org/10.3390/su13010295
AMA Style
Ólafsdóttir R. The Role of Public Participation for Determining Sustainability Indicators for Arctic Tourism. Sustainability. 2021; 13(1):295. https://doi.org/10.3390/su13010295
Chicago/Turabian StyleÓlafsdóttir, Rannveig. 2021. "The Role of Public Participation for Determining Sustainability Indicators for Arctic Tourism" Sustainability 13, no. 1: 295. https://doi.org/10.3390/su13010295
Note that from the first issue of 2016, this journal uses article numbers instead of page numbers. See further details here.