Article

Spatial Variation in Tourism and Investment Potential in the Context of Sustainable Development—A Case Study of Staszowski County

by
Marta Lisiak-Zielińska
1 and
Agnieszka Ziernicka-Wojtaszek
2,*
1
Department of Ecology and Environmental Protection, Faculty of Environmental and Mechanical Engineering, Poznań University of Life Sciences, 60-637 Poznań, Poland
2
Department of Ecology, Climatology and Air Protection, Faculty of Environmental Engineering and Land Surveying, University of Agriculture in Kraków, 30-059 Kraków, Poland
*
Author to whom correspondence should be addressed.
Sustainability 2021, 13(1), 3; https://doi.org/10.3390/su13010003
Submission received: 18 October 2020 / Revised: 1 December 2020 / Accepted: 18 December 2020 / Published: 22 December 2020

Abstract

:
The aim of the study was to assess spatial variation in the tourism and investment potential of Staszowski County and to indicate possibilities for sustainable development of tourism in the area. The method of synthetic measures was used for the analysis, taking into account 45 features characterizing the tourism and investment space, including tourism assets, the state and protection of the environment, transport accessibility, hotels, eating establishments and supplementary facilities, service and technical infrastructure, population relations, and commune finances. The features were analysed using geostatistical and statistical tools. The analyses, despite certain methodological limitations, indicated that there is still great potential for more sustainable development of tourism in the county. The spatial distribution of the features did not show a tendency to form clusters, but most of them were located in the centre of the study area, in two communes—Staszów and Połaniec. The most attractive commune in terms of tourism and investment was Staszów, with strong tourism assets and a well-developed service and technical infrastructure. This commune, however, has one of the lowest environmental protection indices in the county.

1. Introduction

The origin of the concept of sustainable development dates back to the 1980s and is associated in part with the Report of the World Commission on Environment and Development: Our Common Future, also known as the Brundtland Report. Sustainable development was defined as ‘development that meets the needs of the present without compromising the ability of future generations to meet their own needs’ [1]. Over time, the concept of sustainable development has become increasingly popular, covering new areas of life, including tourism, due to its effect on the environment, society, and the economy [2].
The United Nations Environment Programme and United Nations World Tourism Organization [3] define sustainable tourism as tourism ‘that takes full account of its current and future economic, social and environmental impacts, addressing the needs of visitors, the industry, the environment and host communities’. According to Jeong et al. [4], tourism in itself is considered a means of sustainable development when a region has numerous nature and tourism resources. According to most researchers, however, tourism is sustainable if it guarantees development in alignment with the needs of society and the tourist site as well as with its limitations [5,6]. Dimoska and Petrevska [7] and Vallone et al. [8] indicate that sustainable tourism, apart from economic, societal and environmental aspects, should be stable, integrated and diverse, as well as closely monitored, so that necessary means of limiting negative consequences can be introduced. Over-exploitation of the environment for the purposes of tourism, without defining the conditions and directions of its development, can be dangerous for the environment and even self-destructive [4]. The concept of sustainable tourism arose therefore in response to the expansive development of mass tourism and its negative impact on the natural and sociocultural environment in areas receiving tourists. This type of tourism was initially referred to as alternative tourism, soft tourism, or environmentally sensible tourism [9]. Recently, in undertaking measures arising from the principles of sustainable tourism, we can make use of other concepts close to the theory of sustainable development of tourism. The most important theoretical concepts that can be used to describe and resolve problems associated with the socio-economic and sociocultural aspects of sustainable tourism and with the natural environment, on a spatial scale, include the concepts of local development, the resort cycle, the tourism area life cycle, tourism space, tourist capacity, the territorial recreational system, limits of acceptable change, spatial zoning, the integrated tourist resort, tourism as meeting of cultures, dependency theory, the formal/informal sector, and limited availability [10].
Tourism is one of the key areas of economic development in Poland, due in part to the country’s environmental and social attributes [2]. One of the aims of the Tourism Development Programme in Poland is to improve the competitiveness and innovativeness of tourism by supporting companies, organizations, and institutions of the tourism industry in the context of the principles of sustainable development [11]. The Świętokrzyskie Voivodeship, where Staszowski County, analysed in this study, is located, is a region with great tourist potential which remains largely unexploited. The region owes its unique character to its diverse upland landscapes, the beauty of its nature and its numerous historical monuments. It is also a region with great investment potential due to its wealth and diversity of resources and well-developed infrastructure. Moreover, the location of the voivodship allows the local tourist product to be incorporated into programmes for touring Poland, which local authorities and governments increasingly appreciate and attempt to exploit [12]. Furthermore, the COVID-19 pandemic may increase interest in domestic tourism [13], and thus tourism in the Świętokrzyskie Voivodeship.
The aim of the study was to assess the spatial variation in the tourism and investment potential of Staszowski County and indicate key features shaping this area in terms of sustainable development. Particular focus was placed on the role of environmental protection in determining the attractiveness of individual communes for tourists, as well as the role of population relations in determining the attractiveness of individual communes in the county for investors. In addition, suggestions were made for investments and undertakings that can be carried out in individual communes and that could contribute to a strategy for the development of tourism in the county and communes in accordance with the principles of sustainable development. This is the first study to provide a comprehensive and synthetic presentation of the function of tourism in this region.
The article begins with a description of the theoretical background about spatial variation in tourism and investment potential, as well as about the tools supporting tourism sustainable development. Then the research material and methods are presented. This section presents the study area and Gołembski’s method of multidimensional comparative analysis. This is followed by an assessment of the area’s attractiveness for tourism and investment potential. The results of standard deviational ellipses, spatial autocorrelation, and principal component analysis for tourism and investment attractiveness are described in Section 4. The role of environmental protection in tourism attractiveness and of population relations in investment attractiveness are analysed as well. In addition, based on a synthetic measure of the total determinants of tourism development in the communes, proposals for development in individual communes are formulated. Then the results are discussed in relation to previous research. Finally, some theoretical and practical implications of the research are suggested, as well as possibilities for future research.

2. Theoretical Background

2.1. Spatial Variation in Tourism

Spatial heterogeneity is one of the basic concepts of geography, which reflects the distribution of geographic phenomena [14]. Tourism, due to relation to natural environment and socio-economic aspects, has an important territorial dimension, with uneven spatial distribution [15]. One of the basic concepts of research is the concept of tourism space. According to Warszyńska and Jackowski [16] tourism space is understood as a part of geographical space, in which numerous phenomena and processes take place, including concentration, deconcentration, diffusion, expansion, regionalization or hierarchy [17]. Hence, every country, region, and even city contains several popular and unpopular places. These places form an uneven spatial pattern of tourism and have a network or cluster structure [18,19]. There may be several reasons for the concentration or regionalization of tourism, particularly economies of scale and scope, access to transport, or government policy [20,21]. Investments (public or private) in a given location can also be a significant factor in the development of tourism, because they stimulate economic activity and contribute to overall development [22,23,24]. Furthermore, the development of tourism in one place or region positively affects tourism in neighbouring towns and regions [25]. The spatial consequences of these influences, however, depend on the type of tourism as well as on the specific character of each place or region. Therefore, these differences in the positive influences of various places or regions substantiate the need for detailed spatial analyses of the distribution of tourist traffic, as they can be sensitive to local conditions [26]. Moreover, a specific spatial pattern of tourism was observed at borderlands, which were often analysed as separate research areas [27]. According to Rietveld [28], a national border is a barrier where the decreasing of the interaction intensity between two countries might be observed. The reasons for differences can be several, such as national regulations, consumer preferences, or costs of transport as well as accommodation. We assume that even the commune border might be a barrier in sustainable development of tourism in the region. On the other hand, the spatial distribution of tourism is relatively stable over time, despite seasonal fluctuations in tourist traffic [20].
An increasingly common method, including in the case of tourism, is Geographic Information Systems (GIS) [29]. One advantage of analyses carried out using GIS tools is that they provide more knowledge of the spatial character of the phenomenon under study. GIS in tourism can help in creating lists of tourism resources, enhancement of environmental protection during planning of tourism, management and control of the development of tourism, monitoring of tourist activity, or simulation and modelling of spatial results [30]. In addition, spatial analyses can be used to define centrographic measures and autocorrelations between features [29,31]. Thus, they provide knowledge on locations that are more and less attractive in terms of tourism, which can be very useful in tourism planning [32,33].

2.2. Investment Potential in Tourism

Tourism potential cannot be considered equivalent to the investment potential in tourism. However, tourism is a complex system of tourism potential and investment potential in tourism, which means that both of them should be integrated in the tourism sustainable development [34].
Tourism potential, often equated with attractiveness, is widely used. It expresses certain territorial possibilities, which arouse the interest of tourists [35,36]. One of the basic factors that determine the tourist potential are tourist values. By adapting a given tourist value to the needs of tourism, it is transformed into a tourist attraction, which might need some tourist infrastructure, in particular accommodation, eating establishments and local transport [36]. Hence, the development of tourism contributes to many transformations and might be a polarizing or stimulating factor for the general development of the region. The polarizing effect of tourism is typical for the regions with high tourism potential, where in addition to high tourism attractiveness and well-developed infrastructure, there are good conditions for the development of many other sectors of the economy. Moreover, the development of tourism and para-tourism is closely related, which means that tourism is the main factor in the development of all economic areas in the region. The stimulating influence of tourism on socio-economic development is characteristic of areas where tourism has only an indirect impact on the economy, because other economic sectors function there. However, it contributes to an overall increase in investment potential in tourism [37]. In both cases, tourism might contribute to increasing revenues from the tourism sector to the regional finance, which allows for financing further socio-economic investments related to service and technical infrastructure, which constitute the investment potential [38,39].
The concept of investment potential refers to the specifics of demand and supply [34]. However, in the case of tourism, this concept should take into account the tourist values, as well as the other elements important for tourists and investors. These are elements that refer to typically tourism development, such as hotels, eating establishments and supplementary facilities, as well as to para-tourism development, such as transport accessibility, service infrastructure (e.g., petrol stations, pharmacies, banks and money exchange offices or post and telecommunication centres), technical infrastructure (e.g., water network, sanitary drainage network or gas supply network). Due to the large number of various factors determining investment needs and opportunities, as well as the current state of tourism development of the surveyed spatial units, the assessment of the investment potential can be performed on the basis of synthetic indicators that allow taking into account the impact of as many elements as possible on the overall assessment [39]. These partial indicators may include such elements as:
  • market and financial conditions, which influence on the decision-making about investment in tourism,
  • demographic and psychological conditions concerning the perception of the region by potential tourists and the tradition of recreation,
  • technological and ecological conditions related to the possibility of better adaptation of tourist values or use by tourists and protection against degradation,
  • political conditions including actions taken by state and local authorities for the development of tourism [40,41].
Some of these conditions, e.g., technological, are necessary for using tourist values, as well as are an important element of the development of tourism [34].

2.3. Tool Supporting Tourism Sustainable Development

There are many tools and methods that can be used to assess sustainable development. This set of tools and methods can be divided into seven groups: assessment frameworks, participatory tools, scenario analysis tools, multi-criteria analysis tools, cost-benefit analysis tools, indicator sets, and model tools. The usefulness of some of these tools, however, depends on the stage of the decision-making process at which they are used [42]. As in the case of tools used to evaluate sustainable development, there are many different ways to evaluate the conditions and directions of the sustainable development of tourism. Schianetz et al. [43] indicated some tools, such as sustainability indicators, environmental impact assessment or ecological footprint, that can be used to assess the sustainability of tourism. Some of them are more useful for assessment of tourism development at different levels, while the others are better for measurements of progress in achieving sustainable development. Hence, the comprehensive sustainability assessment of tourism might require a combination of different tools [43]. At the European level, the European Tourism Indicators System (ETIS) has been developed. The ETIS is a group of 67 indicators providing a more intelligent approach to tourism planning. The system consists of a management tool, a monitoring system and an information tool. However, the ETIS is specially created for tourism destinations to develop plans for sustainability with long-term vision, carry out as well as monitor these plans [44].
Various elements are analysed and assessed in terms of sustainable tourism. The assessment can be conducted at different levels, from the world to regional level, even at the city or street level [45]. Tourism and investment potential can be one of the tools which might be use to analyse the tourism sustainable development. Tourism and investment potential can be analysed according to selected features and generate rankings of regions according to their increasing/decreasing value. It is also possible to make an aggregation of various features according to the summary indicator of tourist and investment attractiveness [36]. Moreover, tourism potential is usually analysed using multi-criteria decision-making methods [35]. Another way to assess tourism potential is cluster analysis based on the weighted linear combination method (WLC) with principal component analysis (PCA) [46], a mathematical model [45], a SWOT analysis [47] or multiple linear regression based on four variables [48]. A common element of these methods and tools is variables or indicators of sustainable development containing quantitative and qualitative data. They are considered relatively simple but reliable [43] and can be objective (reflecting physical, economic or social reality) or subjective (referring to the attitudes and experiences of residents or tourists) [49]. Indicators provide broad knowledge about the state of a given location through analysis of various aspects of different spheres, e.g., social, economic and environmental. They also help to assess progress in sustainable tourism, address weaknesses, and enhance the strengths of a given place [50]. Research on indicators of sustainable tourism, however, is still in its initial stages [51]. One problem is that there are too many different indicators [51,52]. Also crucial in the application of indicators is the choice of a suitable approach [53], scale adjustment [54], and choice of reference values for weights [55]. Biermann et al. [56] point out that many basic indicators common to a region can be chosen for assessment of sustainable tourism in a given location, but for the diverse problems of a single place, indicators specific to phenomena observed in the region should be applied.

3. Materials and Methods
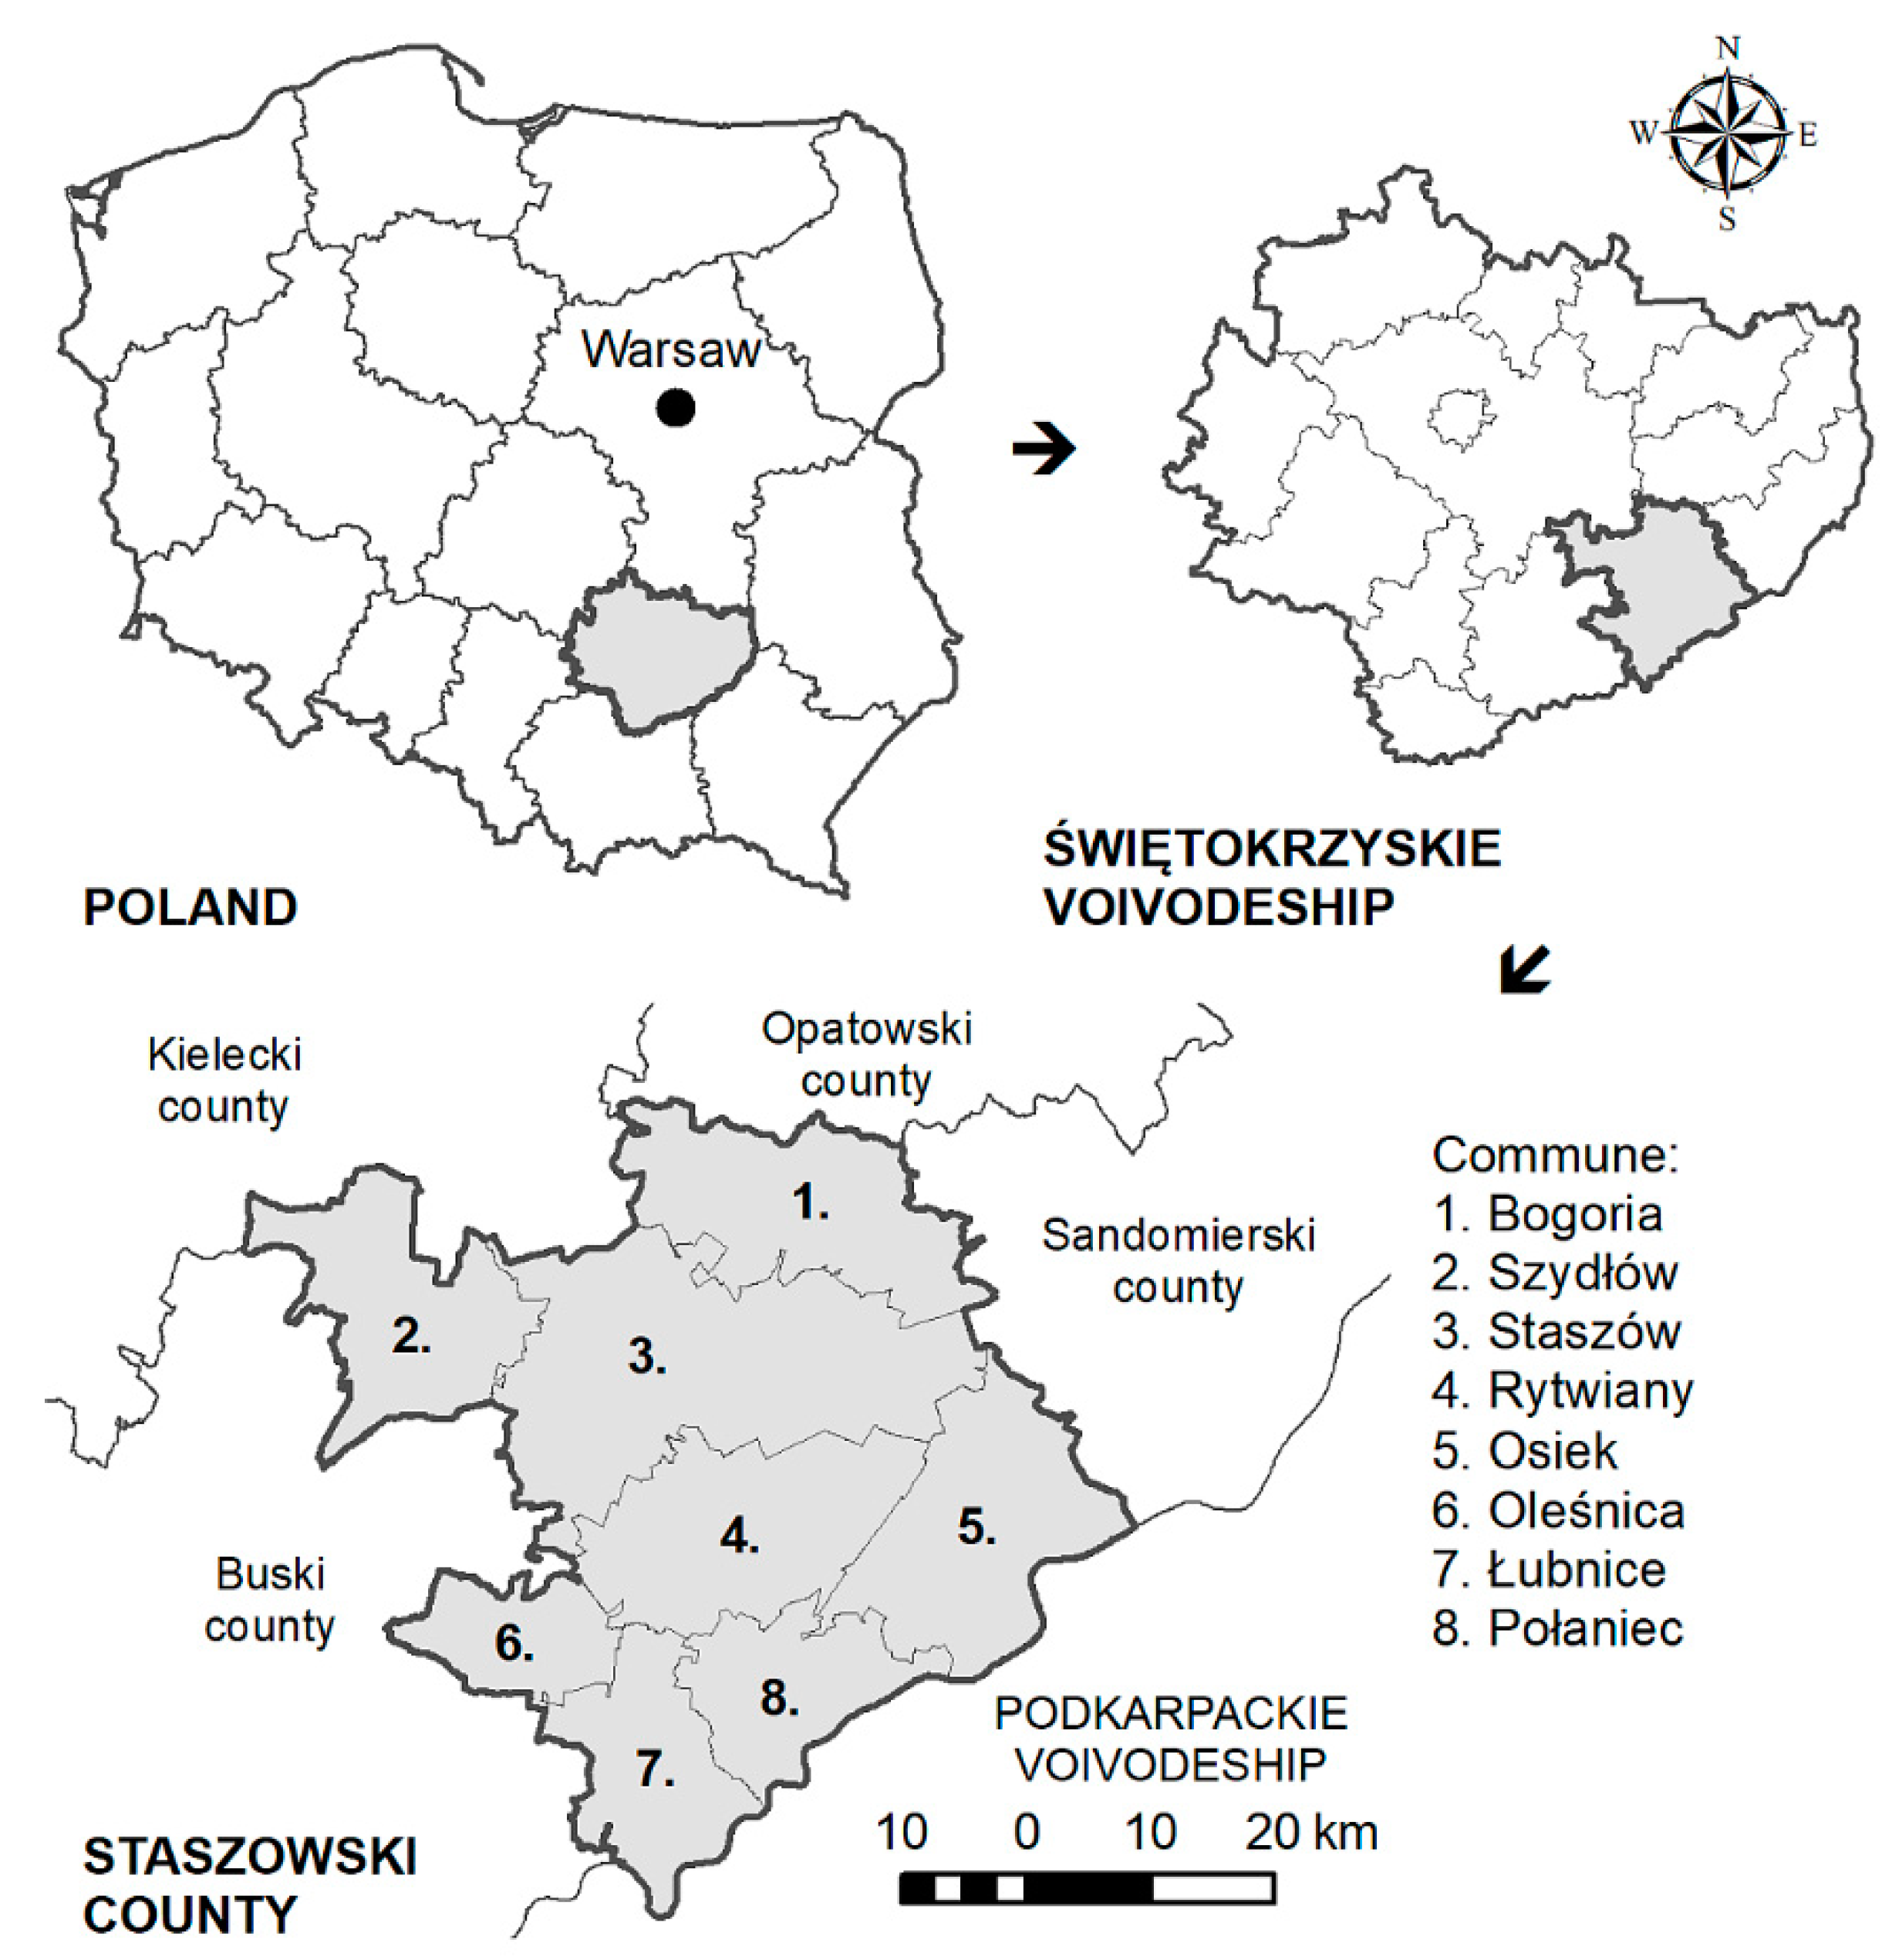
3.1. Study Area

Staszowski County, with an area of 925 km2, was chosen as the study area. It is situated in south-central Poland, in the Świętokrzyskie Voivodeship. The county consists of eight communes, among which Staszów Commune occupies nearly 25% of the area of the county and functions as its seat (Figure 1). Geographically, the area is situated within several geomorphological units, and thus has a diverse terrain. A large part of the county is part of the geographic macroregion of Niecka Nidziańska (Nida Basin), which is a vast depression between Wyżyna Krakowsko-Częstochowska (the Krakow-Częstochowa Upland) and Wyżyna Kielecko-Sandomierska (the Kielce-Sandomierz Upland). The northern part of the county is included in the Wyżyna Kielecka (Kielce Upland) macroregion, with numerous hills intersected by deep ravines [57]. Due to its unique nature assets and numerous historical monuments, tourism is beginning to play an increasing role in the county’s economy [58].

3.2. Methodology

A modification of Gołembski’s method of multidimensional comparative analysis [39] was used to assess the development of the tourism and investment space of Staszowski County. This method is quite commonly used because it makes it possible to compare spatial objects (e.g., counties or communes) having multiple features and to rank them objectively. The commune was adopted as the basic spatial unit in the analysis, because it is the smallest administrative unit for which reliable statistical data are available. Information about the communes was obtained from the Bank of Local Data (as of 2018), available studies on the communes and interviews with inhabitants and tourists.
The analysis was based on 45 diagnostic features assigned to eight categories: tourism assets; the state and protection of the environment; transport accessibility; hotels, eating establishments and supplementary facilities; service infrastructure; technical infrastructure; population relations; and commune finances. The diagnostic features were standardized so that they were all stimuli, meaning that an increase in the value of the diagnostic features leads to an increase in the value of the tourism and investment potential (Table 1). Inhibitors were transformed into stimuli by the ‘maximum shift’ method—the value of a given diagnostic feature in the commune was subtracted from the maximum value observed in the analysed group of communes for that feature.
First, the values obtained for the diagnostic features were normalized by dividing the value of the feature by the value of the reference standard according to the following Formula (1):
nij = yij/(yj max),
where:
  • nij—normalized value of the j-th indicator in the i-th commune,
  • yij—value of j-th indicator in the i-th commune,
  • yj max—maximum value of the j-th indicator among analysis communes.
Next, weights were assigned to the diagnostic variables as proposed by Gołembski [39]. The value of the weights varied depending on the importance of a given feature in the assessment of the tourism and investment space (Table 1). Then a synthetic measure was calculated for the divisions by adding up the results. The value of the synthetic index of the assessment of the tourist and investment space for the commune was calculated as the weighted average of the synthetic measures for the spheres (tourism attractiveness and investment attractiveness) taking into account the weights of individual divisions (Table 2).
Based on the valorisation of individual communes, a typology of the study area was drawn up, with particular focus on two indicators of sustainable development: environmental protection and population relations in Staszowski County. The proportion of environmental protection in the tourism attractiveness of each commune and that of population relations in the attractiveness of each commune for investors were compared. Next, four groups of communes were identified according to the intensification of environmental protection measures, and four groups were identified according to the intensification of measures associated with population relations representing sustainable development in tourism. For investment attractiveness, these were communes with (1) tourism assets higher than the county average and an environmental protection index higher than the county average; (2) tourism assets lower than the county average but an environmental protection index higher than the county average; (3) tourism assets higher than the county average but an environmental protection index lower than the county average; and (4) tourism assets and an environmental protection index both lower than the county average. An analogous division into four groups of communes was made for investment attractiveness, except that in this case the indicator of sustainable development was population relations. The methodology assumed that wealthier and stronger communes, i.e., those with high tourism attractiveness and attractiveness for investors, should be supported.
Normalized features were analysed using statistics software and GIS tools (Statistica 13.1 and ArcGIS 10.5). Principal component analysis (PCA) was used to evaluate key features influencing the attractiveness of the tourism and investment space of a given commune. The diagnostic features and communes were orthogonally transformed to a new set of uncorrelated variables (components). To analyse the spatial distribution of the spheres and divisions of the tourism and investment space, we analysed the distribution of standard deviational ellipses (one standard deviation), which enables analysis of the degree of spatial concentration. In addition, spatial autocorrelation of the set of features was performed using the global Moran’s I statistic to determine whether the standard was clustered, dispersed, or random.

4. Results

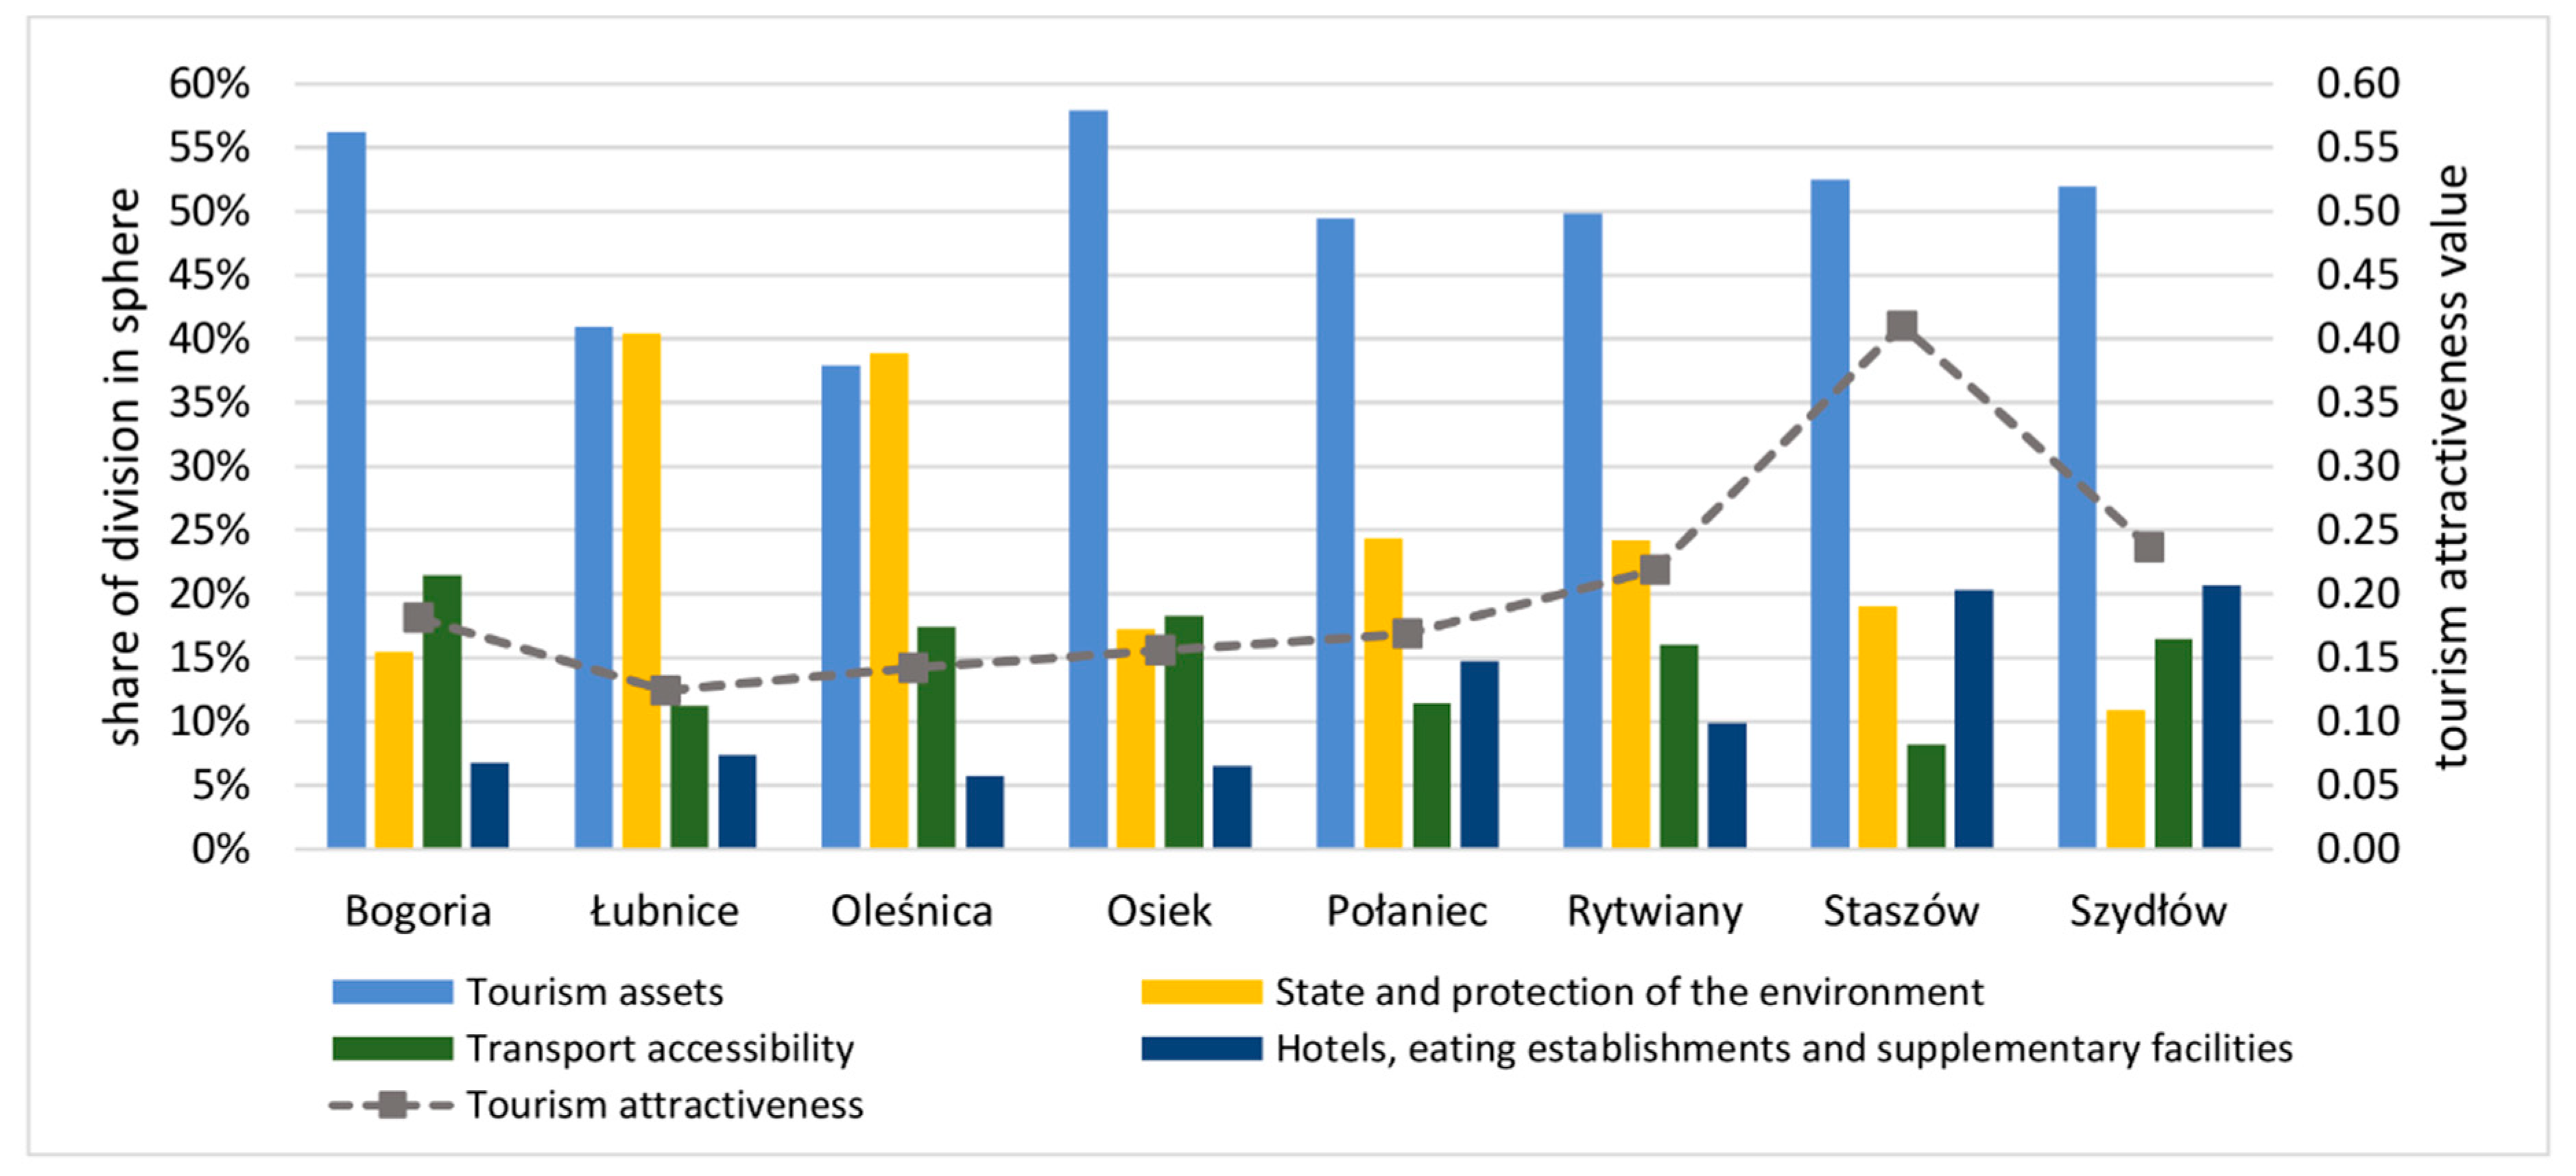
4.1. Assessment of Tourism Attractiveness

The analyses revealed that communes with high tourism assets have greater tourism attractiveness. The most attractive commune in terms of tourism was Staszów (0.411). The measure of the attractiveness of this commune was markedly higher than for the other communes in the county. The tourism attractiveness of the commune was most influenced by its tourism assets (52.5%), followed by the number of hotels, restaurants, and other service facilities (20.3%). The commune also has the most historical monuments in the county, and the most cultural events take place here. In second place was Szydłów Commune (0.237), followed by Rytwiany Commune (0.219). Both of these communes had a large proportion of tourism assets (52.0% and 49.8%, respectively). The value for Bogoria Commune was somewhat lower (0.181). This is one of the communes with high tourist assets (56.3%), but the number of hotels, restaurants, and other service facilities is a problem. Połaniec Commune (0.169) owes its attractiveness to a large protected area and to cultural events, as well as good transport accessibility. Next in the ranking were the communes of Osiek (0.156) and Oleśnica (0.142). The least attractive commune in the county in terms of tourism was Łubnice Commune (0.124), which despite its tourism assets has poor transport accessibility and inadequate hotel and restaurant facilities (Figure 2).
No intensified environmental protection measures were noted in the communes that were most attractive in terms of tourism. Less attractive communes such as Łubnice and Oleśnica stand out with regard to environmental protection. In the most attractive communes of Szydłów and Staszów, it would be worthwhile to intensify measures to improve the state of the environment. Four communes with an intermediate degree of tourism attractiveness, i.e., Bogoria, Osiek, Rytwiany and Połaniec, also have a lower proportion of environmental protection in the assessment of tourism attractiveness. Measures to improve the state of the environment should be undertaken next in these communes (Figure 3A).
The graphic representation of the standard deviational ellipses for the analysed divisions indicated a directional distribution of the features. The standard deviational ellipse for tourism assets was located in the centre of the county, which indicates that most of the features were located in the communes of Staszów and Rytwiany. The directional distribution was south-eastern, which means an uneven distribution towards the commune of Połaniec. The standard deviational ellipse for environmental protection was shifted southwards, and thus towards the communes of Oleśnica and Łubnica. In the case of transport accessibility, the location and shape of the ellipse points to the central communes in the county, and thus to Staszów (the county seat) and the adjacent communes. The standard deviational ellipse for hotels, eating establishments and other conveniences had the smallest area, and thus the concentration of these facilities was highest relative to the other divisions. The location of the ellipse and the directional distribution towards the southeast indicates that these facilities were concentrated in three communes: Staszów, Szydłów and Rytwiany (Figure 4).
The spatial autocorrelation tool based on the global Moran’s I statistic for the features in the divisions of tourism assets and hotels, eating establishments and supplementary facilities indicate a random distribution of the features. Only the values obtained for transport accessibility indicate that the features had a tendency to form clusters, and in the case of environmental protection the probability that the dispersed pattern is the result of random distribution is less than 5% (Table 3).
The graphic presentation of the data pertaining to tourism attractiveness using principal component analysis for all communes together explained a large portion of the variation in the data –67.95% of the variance of primary variables. The analysis showed positive relationships between most of the features in the division of tourism assets and hotels, eating establishments and supplementary facilities. Negative relationships were observed for individual features, e.g., the area of wasteland and the number of boarding houses. Staszów Commune had the highest values among all the communes for features related to tourism assets (Figure 5).

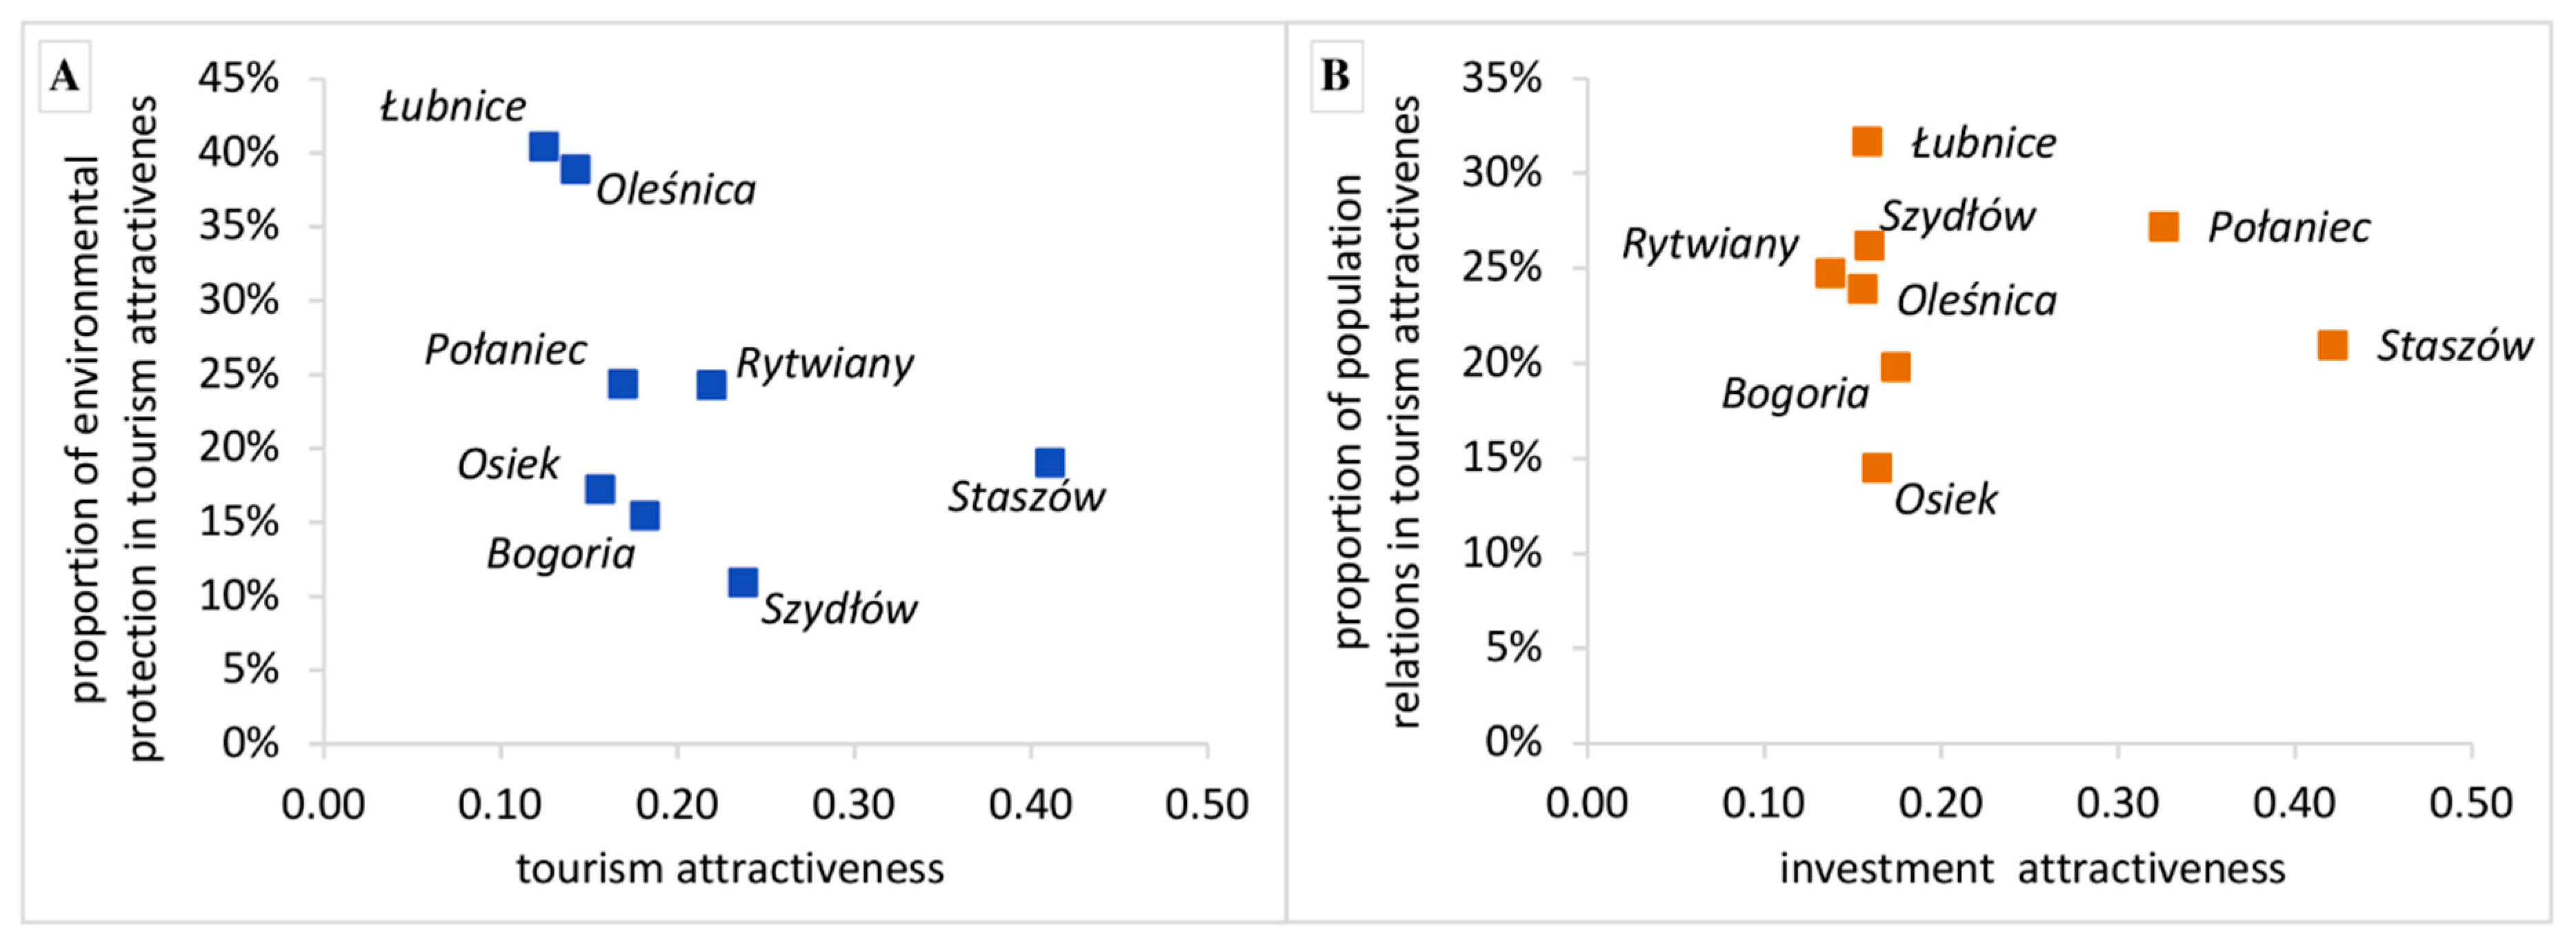
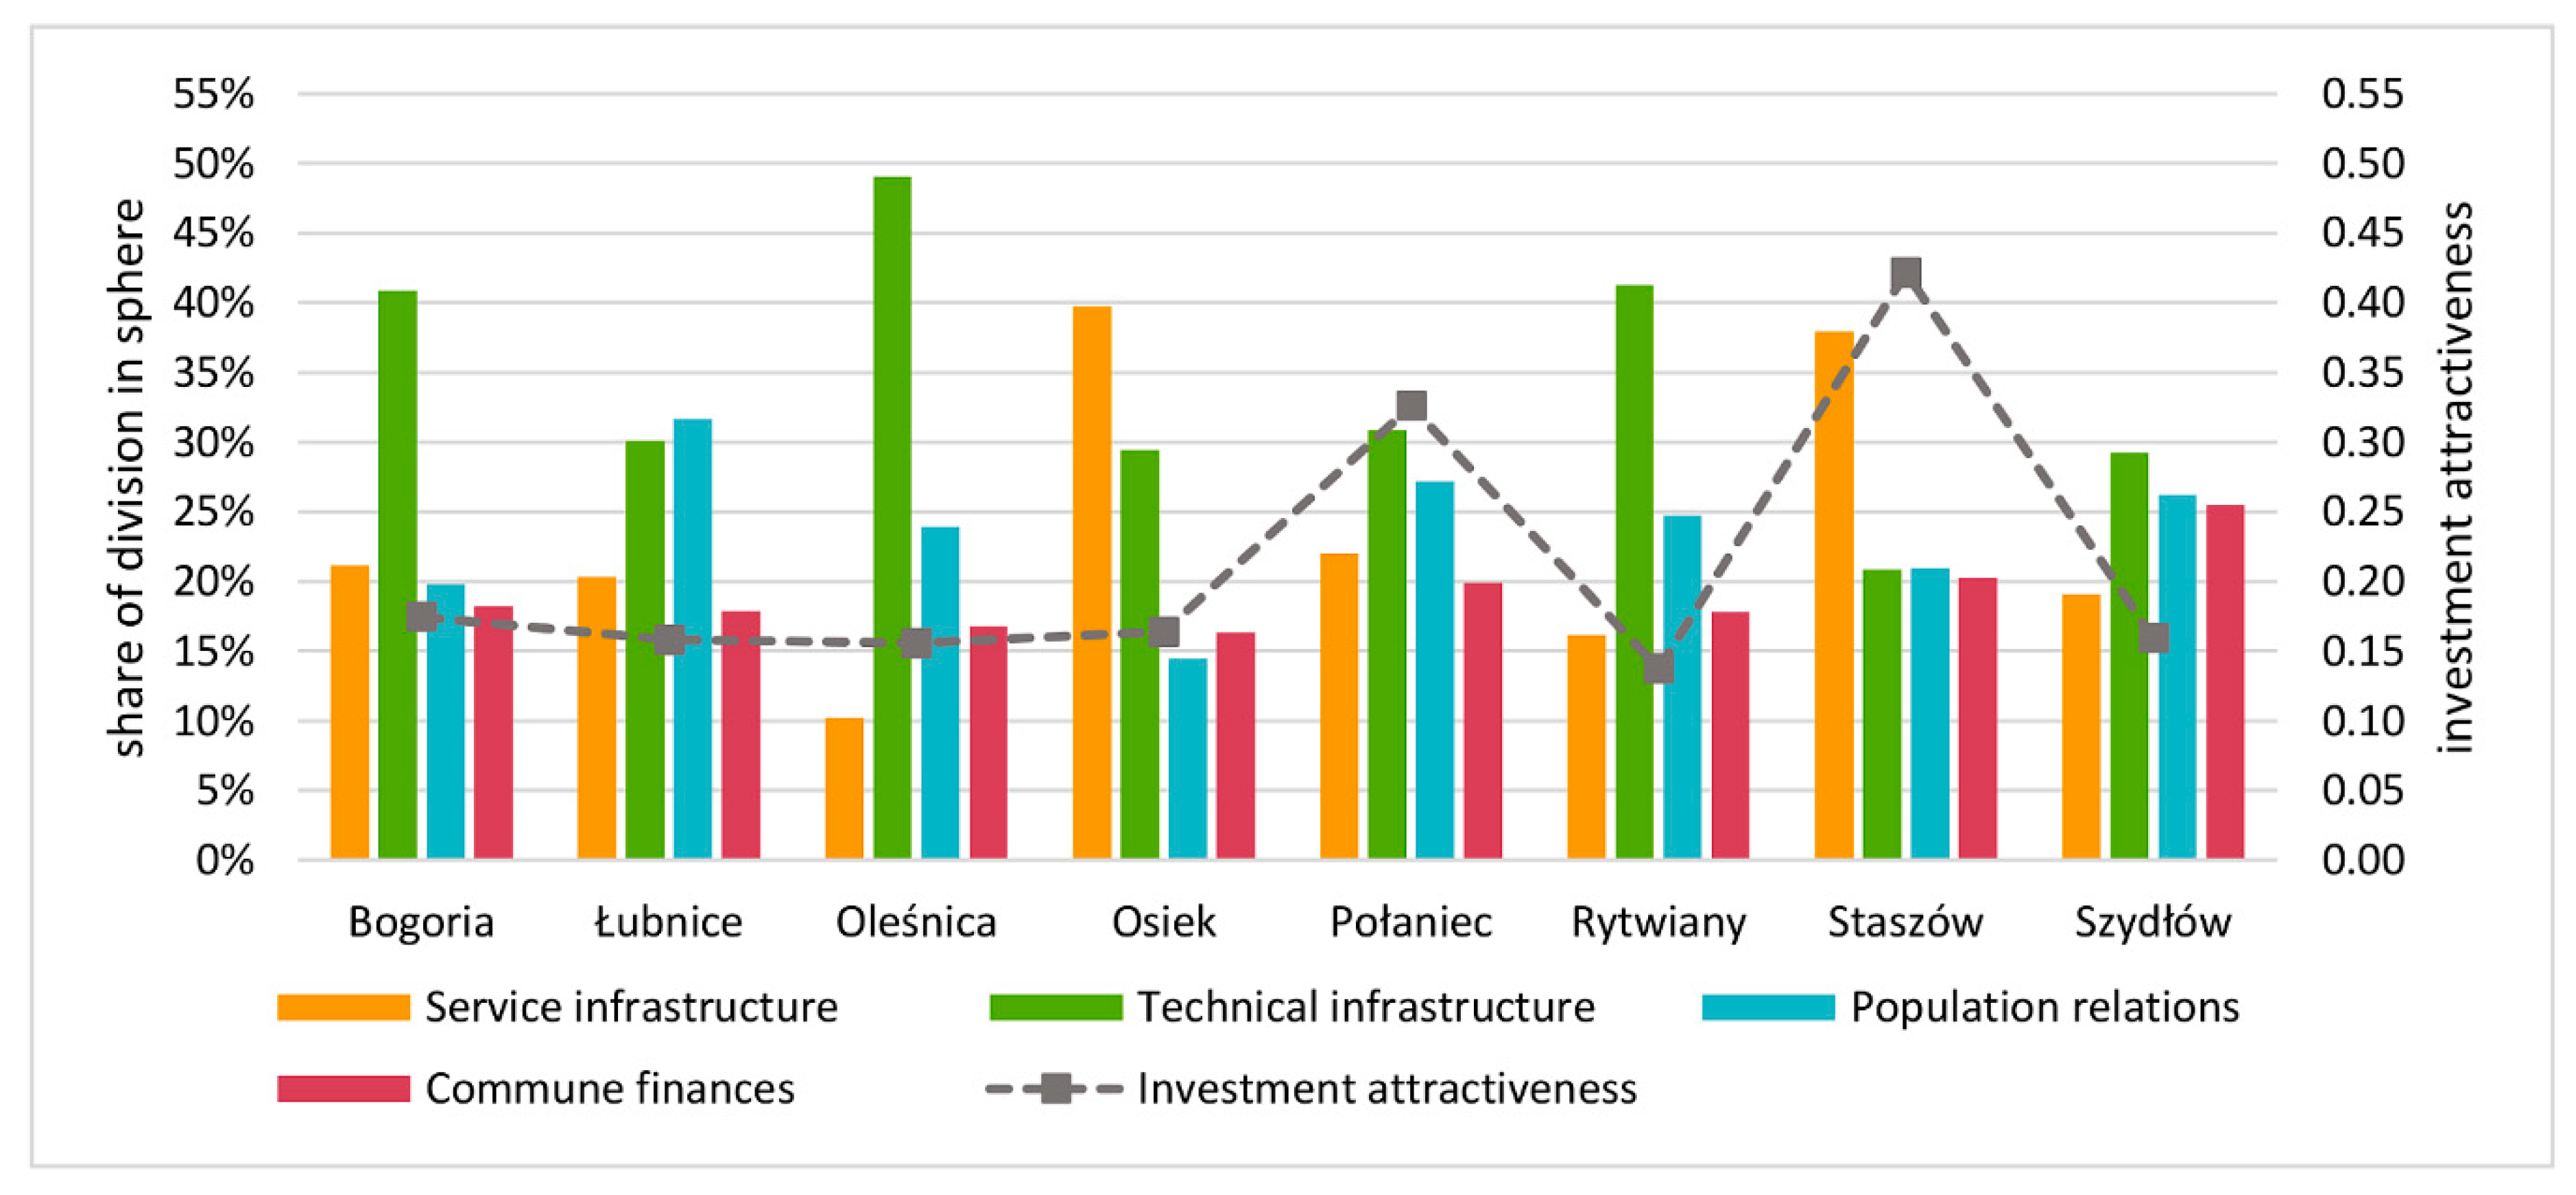
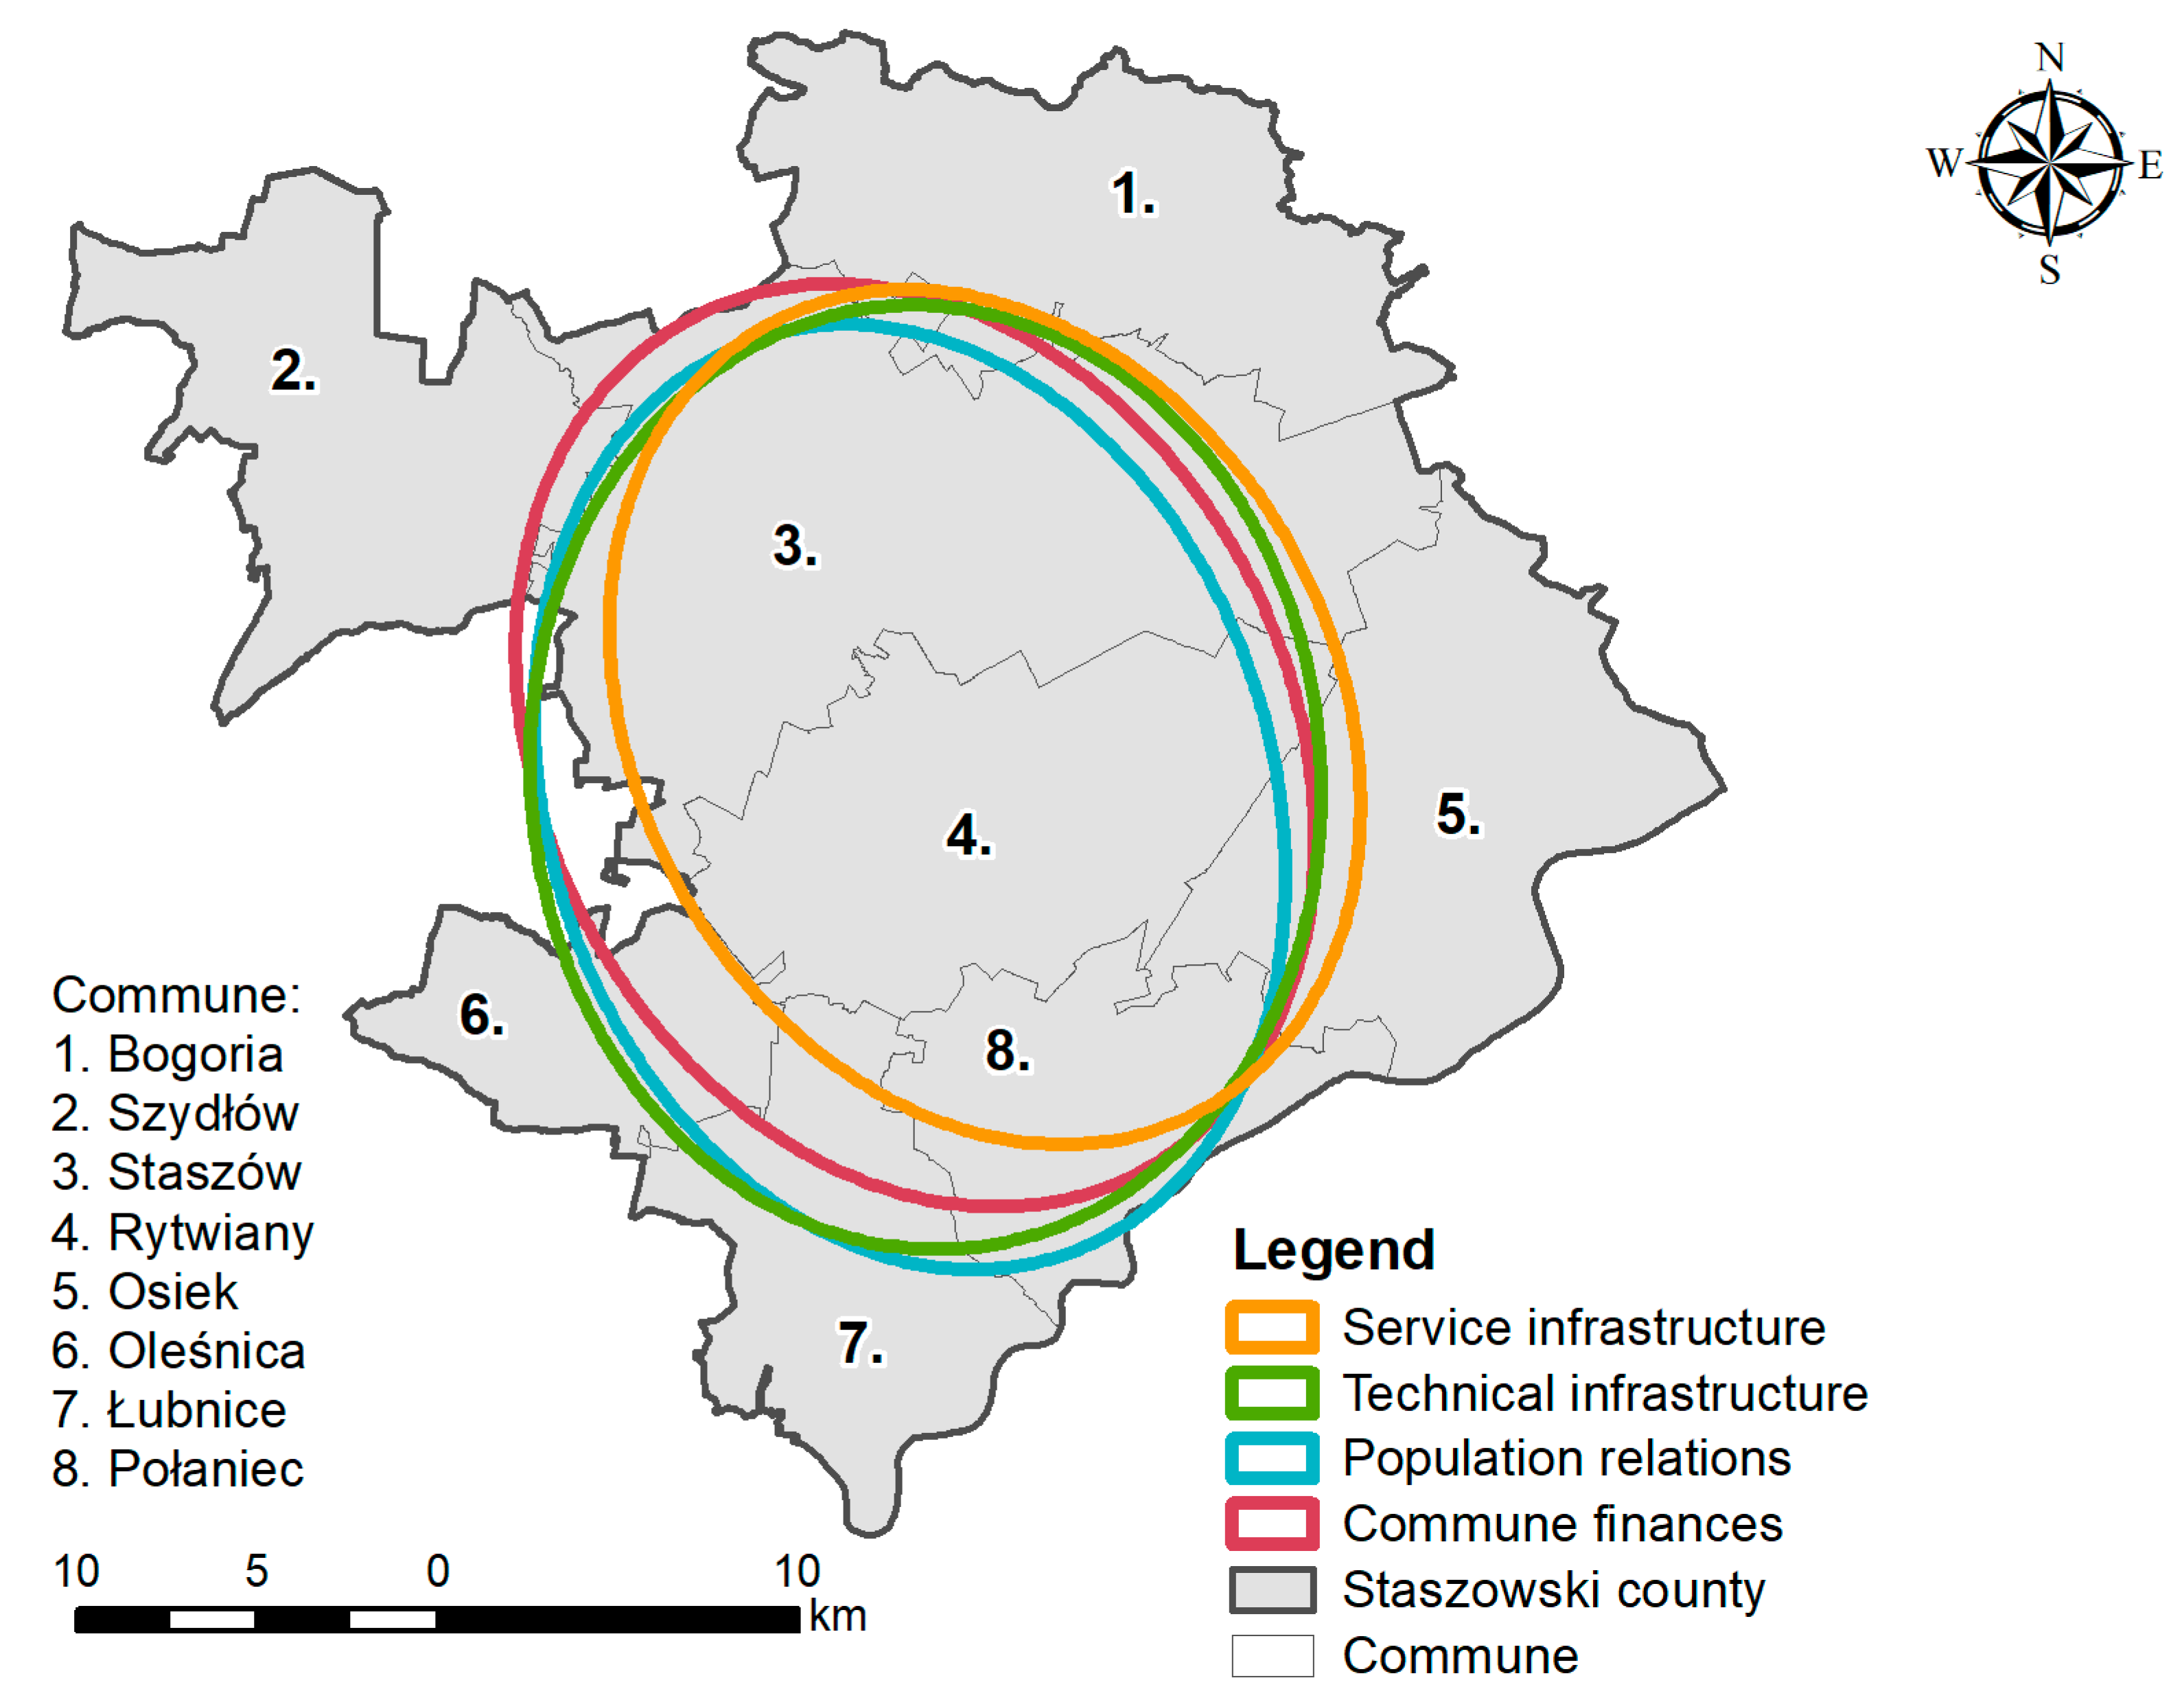
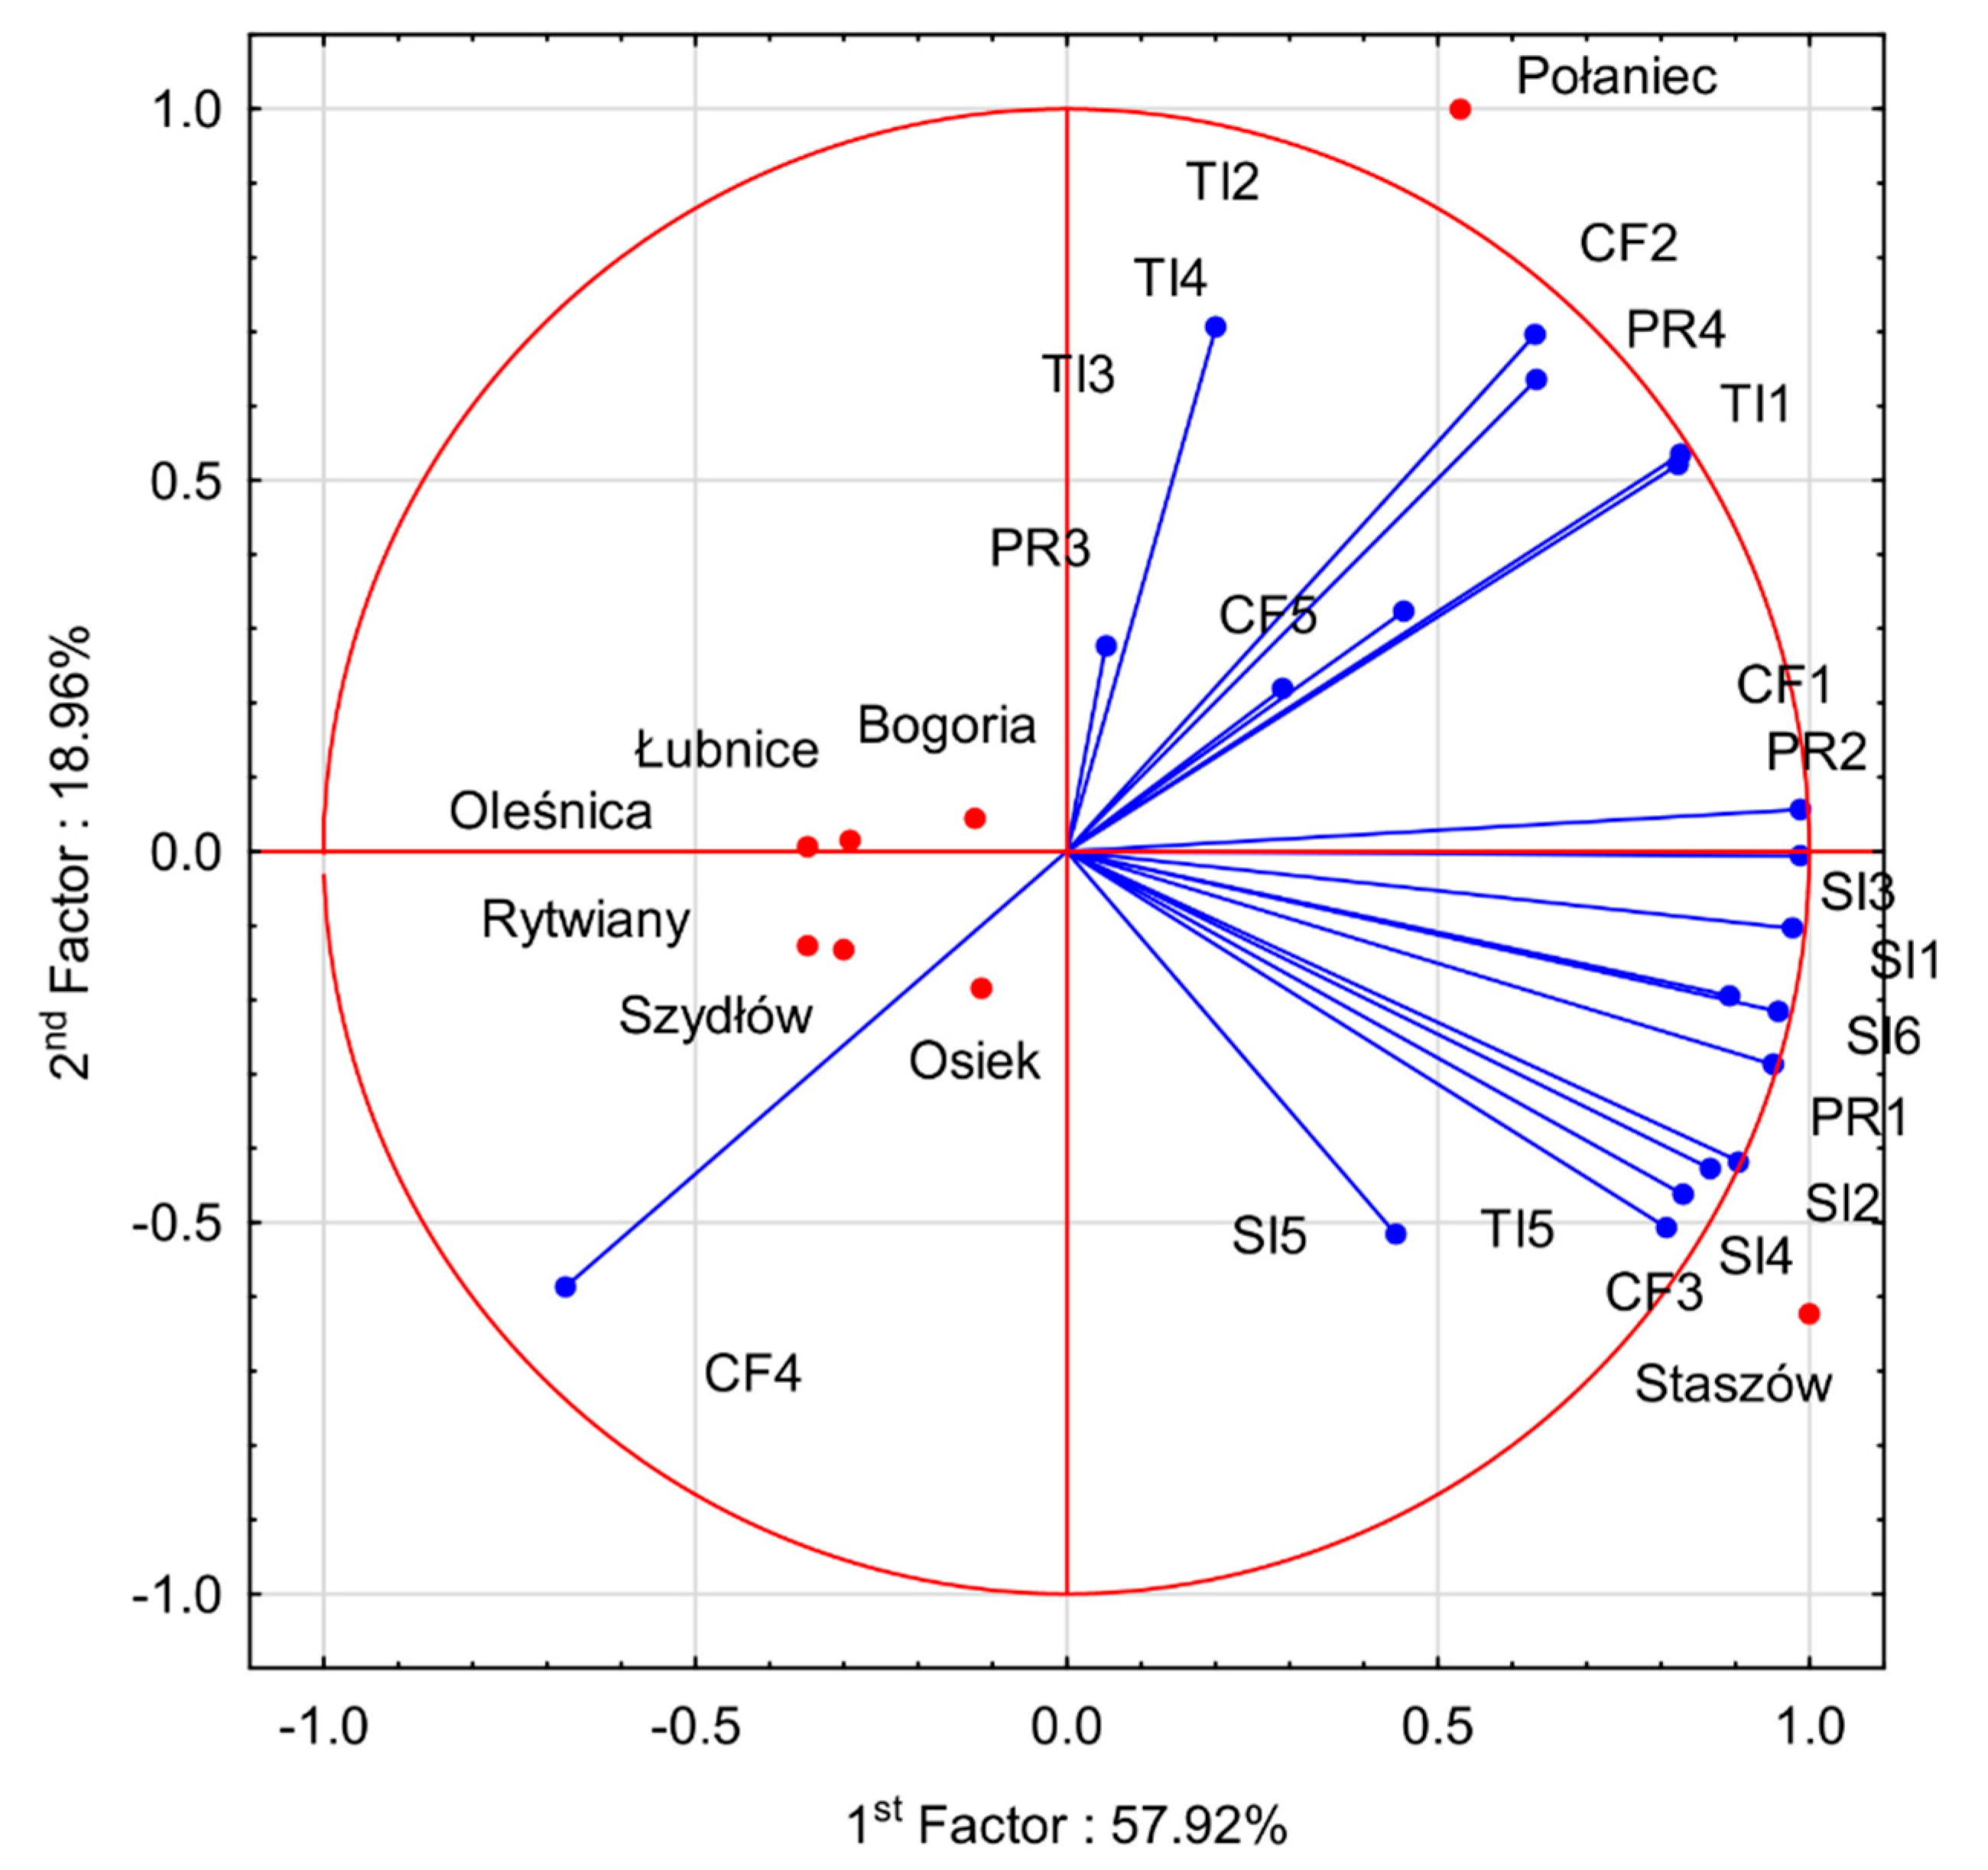
4.2. Assessment of Attractiveness for Investors

In terms of attractiveness for investors, the value for the synthetic measure was nearly twice as high for two communes, Staszów (0.422) and Połaniec (0.326), as for the remaining communes. The high investment attractiveness in Staszów Commune was most influenced by its well-developed service infrastructure (38.0%), and in Połaniec Commune by its technical infrastructure (30.9%) and population relations (27.2%). The other communes of Staszowski County had similar levels of investment potential, with values ranging from 0.137 (Rytwiany) to 0.175 (Bogoria). The communes of Bogoria, Łubnica and Szydłów had similar proportions of service infrastructure (on average 20.2%). Most of the communes had similar proportions of population relations in their investment potential (on average 18.2%). Only Szydłów Commune had a higher proportion −25.5% (Figure 6).
In the most attractive commune for investors, the value for population relations was lower than the county average. Population relations were somewhat better–higher than average–in the communes of Łubnice, Oleśnica, Połaniec, Rytwiany and Szydłów. Measures should be taken to improve the population relations in Staszów Commune, which is very attractive for investors. The last communes in which these measures should be undertaken are Rytwiany and Oleśnica, which are less attractive for investors (Figure 3B).
The standard deviational ellipses for the analysed divisions indicated a directional distribution of the features, but less so than in the case of the divisions pertaining to tourism attractiveness. The standard deviational ellipse for service infrastructure was located in the centre of the county, and its concentration was the highest of all ellipses. The directional distribution of the ellipses pointed to the communes of Staszów and Osiek. The standard deviational ellipse for technical infrastructure was also located in the centre of the county, but its area indicates greater dispersion of the features. In the case of population relations, the area of the standard deviational ellipse indicated similar dispersion of features as in the case of technical infrastructure. The ellipse was shifted towards the communes of Oleśnica and Łubnica. The directional distribution of the standard deviational ellipses for commune finances was south-eastern, which indicates uneven dispersion towards Połaniec Commune (Figure 7).
The spatial autocorrelation tool based on the global Moran’s I statistic for the features from the divisions of service infrastructure and commune finances indicates random distribution of the features. The analysis indicated that the probability that the dispersed pattern is the result of random distribution of the divisions of technical infrastructure and population relations is less than 10% (Table 3).
The graphic presentation of the data pertaining to investment attractiveness using principal component analysis for all communes together explained a large portion of the variation in the data –82.40% of the variance of primary variables. The analysis showed positive relationships between most of the features associated with service and technical infrastructure. As in the case of tourism attractiveness, Staszów Commune had the highest values among all communes for the features from these divisions, as well as the lowest unemployment (Figure 8).

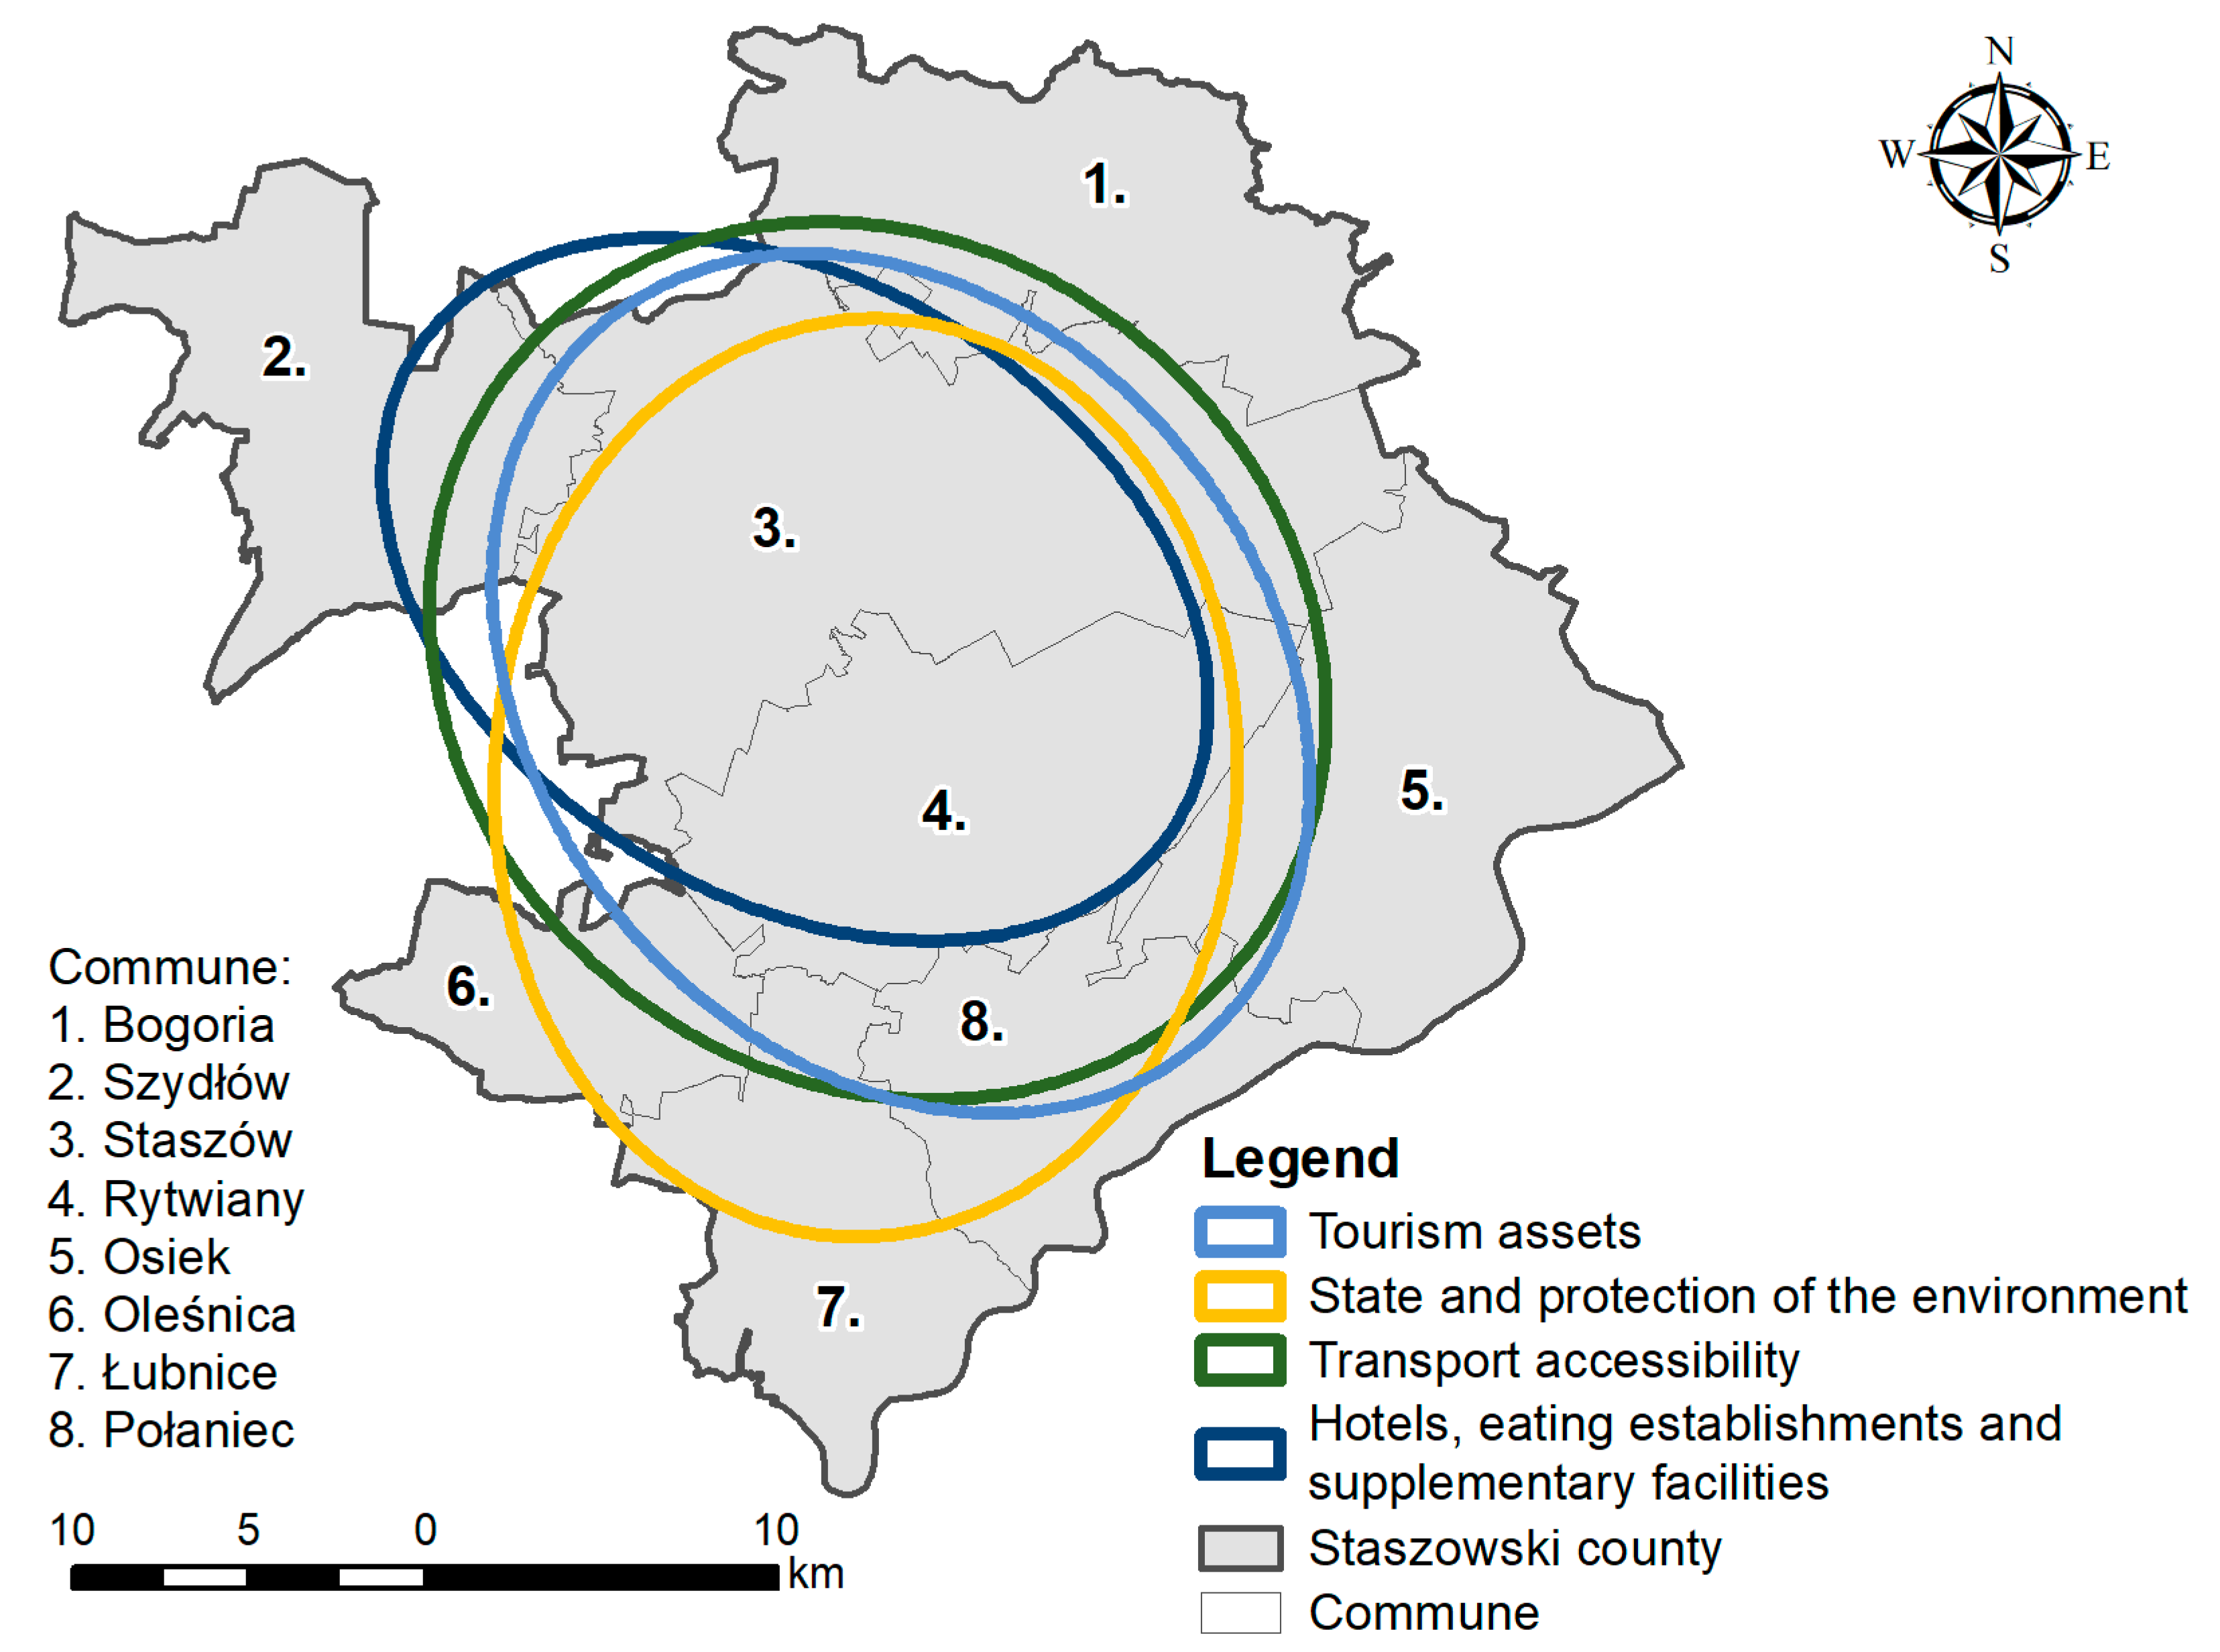
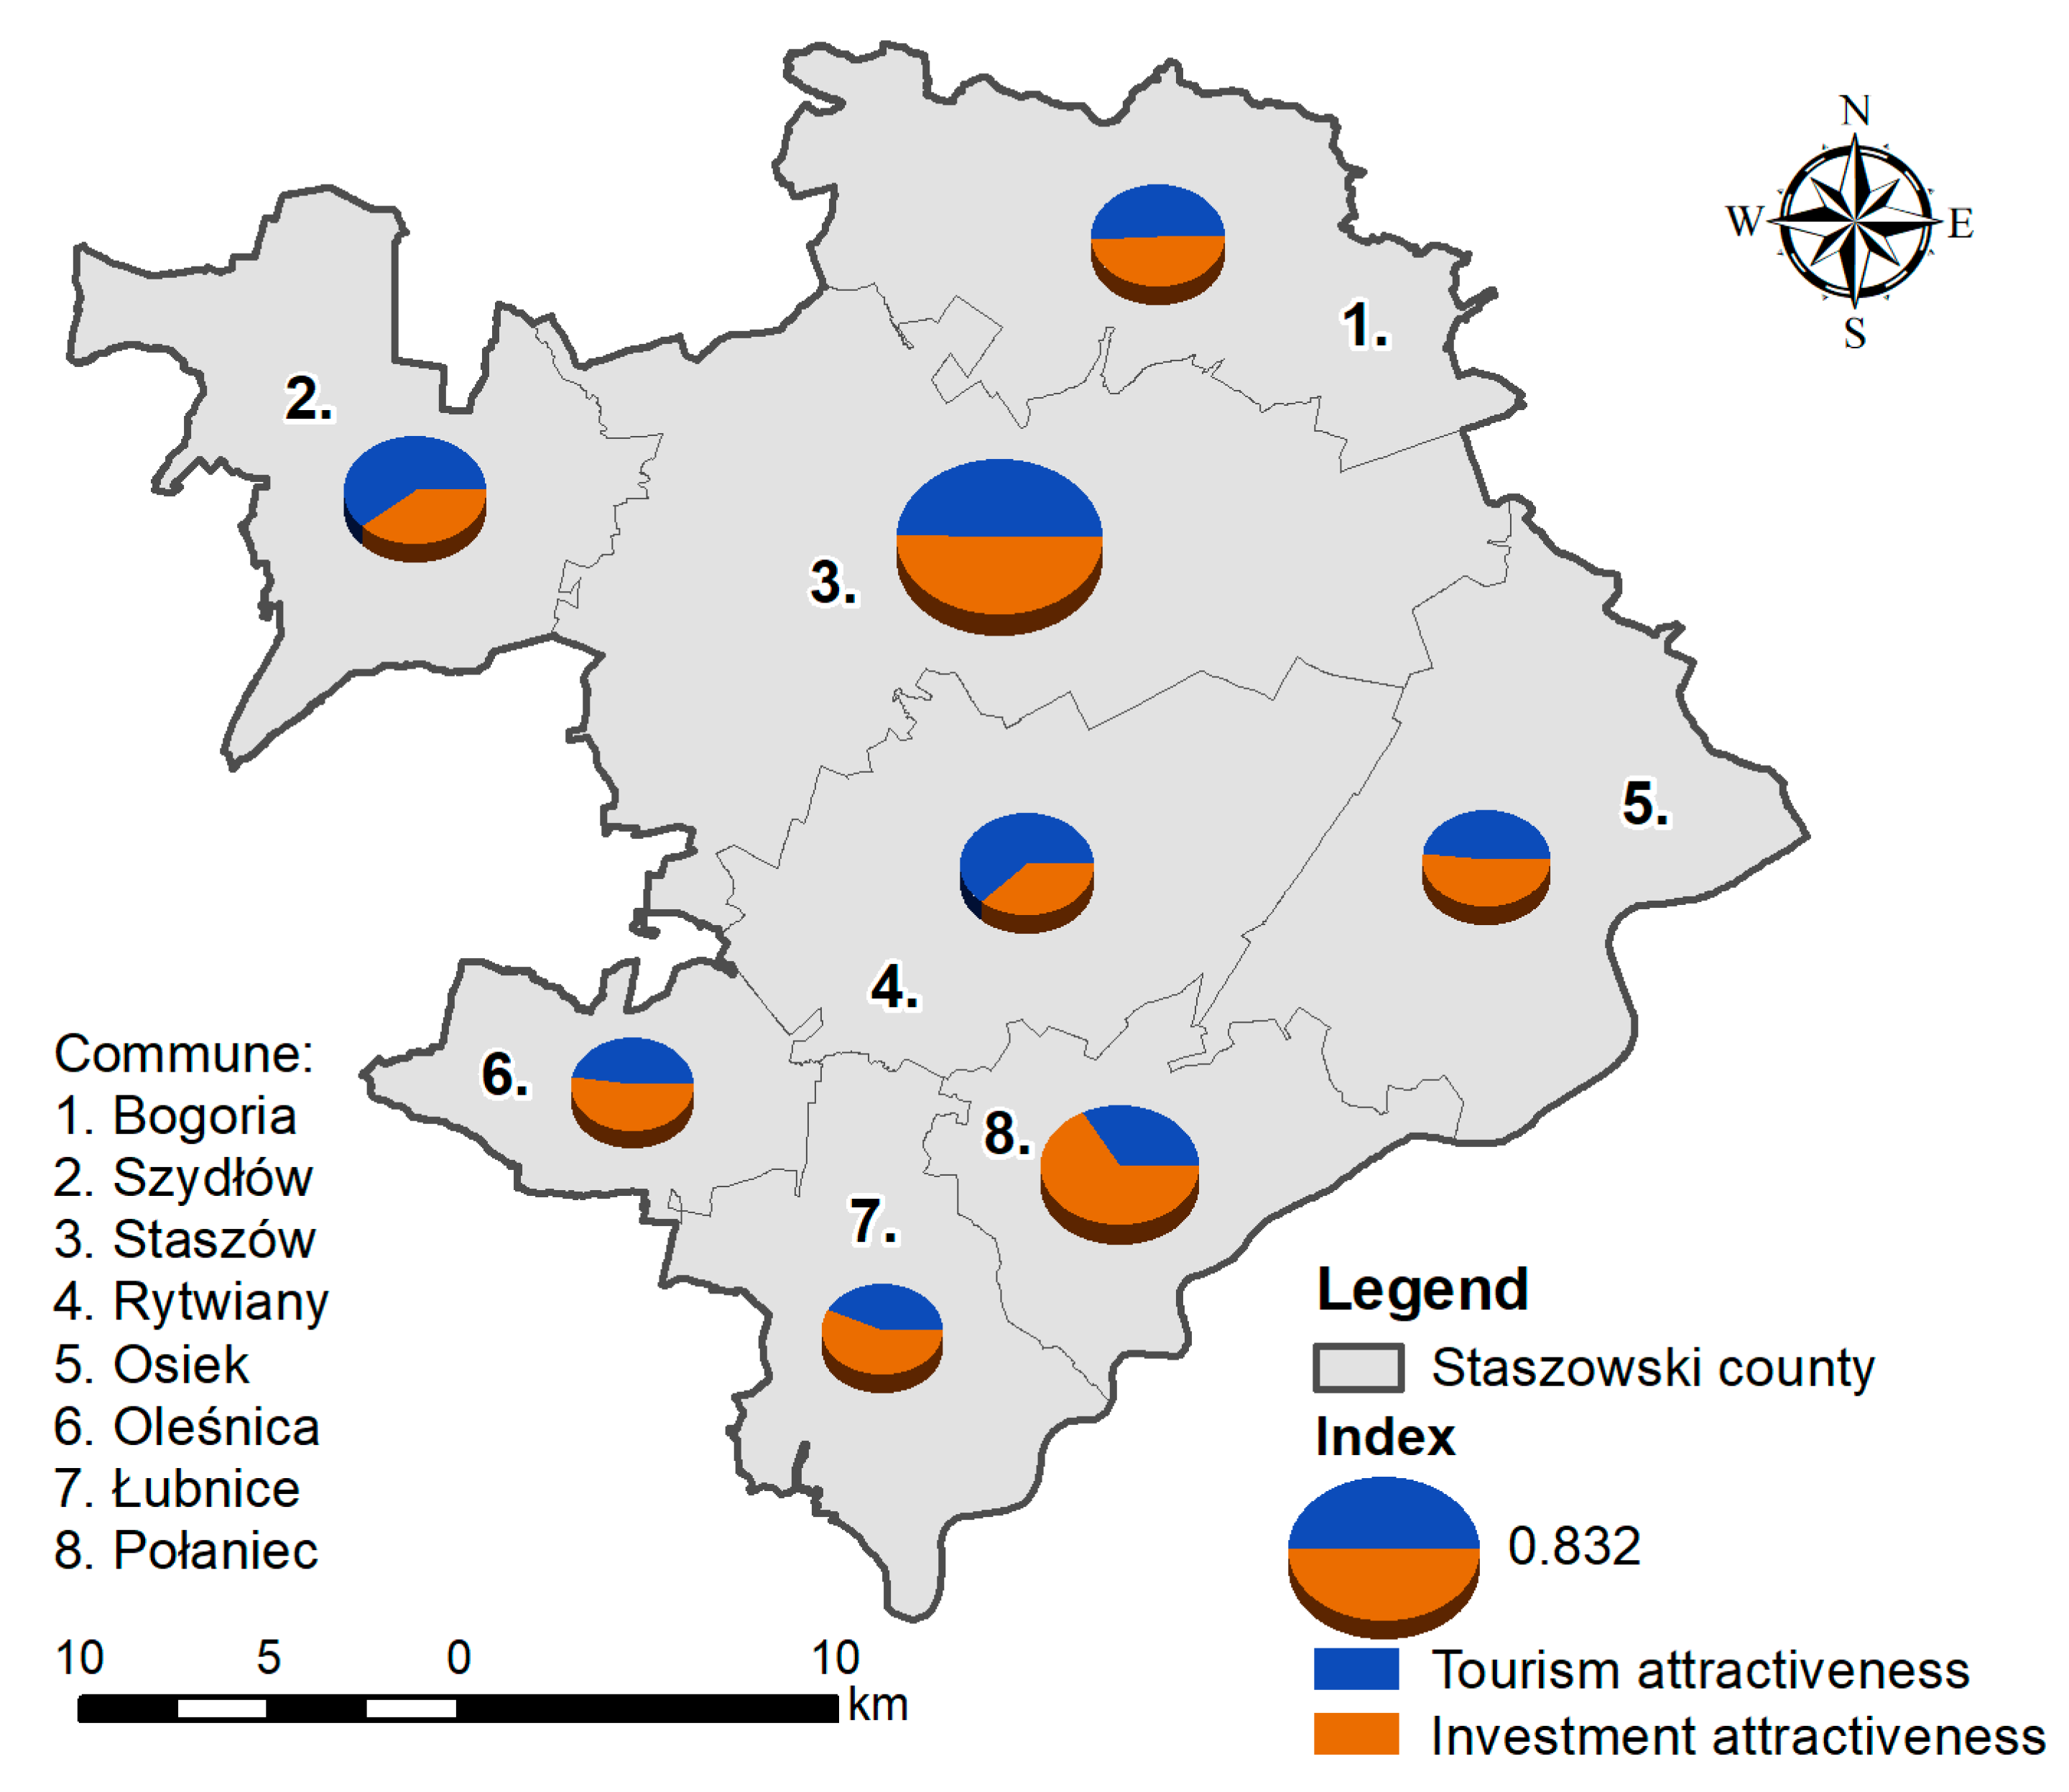
4.3. Synthetic Measure of Total Determinants of the Development of Tourism in the Communes

The commune with the greatest development potential was Staszów (0.832). This commune had the highest tourism attractiveness and investment attractiveness indices. Of great importance was the fact that it is the county seat, with the strongest tourist assets and the best-developed service and technical infrastructure. In second place was Połaniec (0.495), which attained a high investment attractiveness index, followed by the communes of Szydłów (0.396) and Bogoria and Rytwiany (0.356 for both). These are communes with high tourist assets. Further in the ranking were the communes of Osiek (0.320) and Oleśnica (0.298). The commune with the poorest result was Łubnice (0.283), which had low values for the indicators in most of the divisions. At the same time, this commune had a relatively high proportion of investment attractiveness in the synthetic measure of the total determinants of tourism development (Figure 9).

4.4. Suggestions for Development in Individual Communes

The development of tourism in Staszowski County is concentrated in Staszów and is closely associated with the landscape and nature resources of this area. Despite certain methodological limitations, however, the analyses indicate that there are still too few possibilities for improving the tourism potential of this area while at the same time developing tourism in a more sustainable manner. Therefore, it seems necessary to take measures aimed at dispersion of tourist traffic based on broader promotion of alternative tourist attractions in the region.
An unquestionable asset of all the communes is the nature and landscape attributes of the region, among which an educational trail together with a recreational cycling path could be formed. The River Czarna Staszowska flows through three communes in the county (Staszów, Rytwiany and Połaniec), where it would be possible to organize kayaking trips providing an opportunity to admire the natural beauty of Staszowski County. In Bogoria Commune the investments most necessary to the development of the tourism sector are improvements in the roads, modernization of sport and recreation facilities, and development of technical infrastructure, which are being systematically carried out. The northern part of Oleśnica Commune, along the River Wschodnia, has unexploited agritourism potential. Szydłów Commune should focus on tourism development and the promotion of its regional product śliwka szydłowska (dried, smoked prunes). This commune has numerous cultural monuments, but they are in need of restoration and appropriate development of the surrounding areas. Połaniec Commune has considerable investment potential owing to newly formed special economic zones, which may increase interest in the area among investors. Although Połaniec Commune is focused mainly on the development of entrepreneurship, it also has tourism assets that can be an alternative direction of development. Rytwiany Commune has strong natural environment assets, which should be displayed and at the same time protected. There are numerous monuments that are worthy of exposure, some of which have been renovated and made accessible to tourists. Staszów Commune contains many sites constituting cultural and historical heritage which are not adequately exposed. Examples include the Staszów Market Square and Town Hall, as well as numerous palaces.
Tourism development plans can also be helpful in promoting the region. These should be created in each commune of the county, because currently tourism is being developed in the communes in an uncoordinated manner. They should take into account existing tourism potential, the opinions of the local community, and cooperation between communes, so that the measures can be implemented on a larger scale and in an integrated manner.

5. Discussion

This analysis provided a simple means of evaluating the tourism attractiveness of Staszowski County and defined a framework for sustainable development of the tourism and investment space. The results are much poorer than those obtained for Spanish coastal destinations [55] or even for coastal or mountain communes in Poland [59]. However, those places are very popular and widely known and tourism has existed in these places for long time. The values are comparable to those observed for communes located outside the most attractive parts of Poland [60,61,62,63,64,65,66]. It should be emphasized, however, that previous studies have made use of a slightly different set of indicators, which makes a detailed comparison difficult. In the case of Lubaczowski County [66] and Lubliniecki County [62], the highest value for the synthetic measure of tourism attractiveness was observed in the town or commune that functioned as the county seat. This phenomenon was also observed in Staszowski County, where Staszów Commune was the most attractive. As in studies by Witkowska-Dąbrowska [60], Pukowiec & Kurda [62], Lisiak et al. [63] and Ziernicka-Wojtaszek & Lisiak [66], greater tourism attractiveness in the county was noted for communes with strong tourism assets, such as forested areas, surface waters, protected natural areas and cultural sites. Another significant factor was tourism assets, as in the case of Nowosądecki County [38] and Bielski County [65]. Inadequate accommodation facilities can be considered one of the limitations in the development of tourism in Staszowski County, as in all of the Świętokrzyskie Voivodeship [67]. Świstak & Świątkowska [67] note that the Świętokrzyskie Voivodeship is one of the smallest voivodeships, and part of it is under legal protection, which limits the development of the region, including possibilities for providing accommodation.
Staszowski County as a whole, without consideration of the values of tourism parameters in individual communes, is included in the study ‘Tourism development strategy in the Świętokrzyskie Voivodeship for 2006-2014′ [68]. The strengths named in the SWOT analysis include the county’s exceptional nature, landscape and cultural assets, holiday centres and hotels, and progress in air quality protection, but there were weaknesses as well: the poor state of historical monuments and of roads, rubbish in the forests, and unsatisfactory eating establishments. The priorities named were measures to improve water quality, construction of small-scale retention reservoirs, reduction of pollutant emissions, preservation of the unique landscape, and improvement of tourist services. Eleven years later, in the ‘Development strategy of the Staszów County for 2016-2025′ [58], these goals and tasks are more specific and more pro-environmental, specifically directed towards sustainable development. These are goals and measures such as construction and expansion of wastewater treatment plants, including home treatment facilities, river sanitation together with the construction of a sanitary sewer system, storm drains, and a water supply network, an increased proportion of renewable energy in the county’s energy economy, support for production of energy from renewable energy sources (RES), a transition to a low-emission economy that is resistant to climate change, improvement of the thermal efficiency of public buildings and multi-family housing together with modernization of energy production systems, increased the energy efficiency of buildings, expansion of the activity of the Department of Municipal Waste Management to increase the efficiency of waste management, the creation and modernization of tourist trails and educational forest and nature trails, care for the natural environment, environmental education, elimination of unauthorized dumping sites, and landfill reclamation [58].
According to Rodriguez Rangel and Sanchez Rivero [29], spatial analyses have become a major ally in tourism planning, because they enable exhaustive analyses of the study area. Ruda [30] also emphasizes the advantages of spatial analyses for detecting certain tendencies between neighboring study sites, while also indicating that the results may be unsatisfactory. Previous studies, however, have focused mainly on the distribution of a single type of accommodation as an element of the accommodation facilities of a given region [29,31,69]. The spatial analysis of the locations of the features showed that most of them were concentrated in the centre of Staszowski County. The phenomenon of concentration of tourism assets has also been observed in the city of Łódź for hotels and accommodation [31], as well as for historical sites such as factories, villas and palaces [70]. In the case of Łódź, however, factors associated with the history and spatial layout of the city were very important [31]. Research by Derek et al. [69], on the other hand, showed that accommodation facilities were concentrated in the central-west part of the Great Masurian Lakes region, which was linked to determinants related to nature in this region. Analysis of Moran’s I statistic for the features, broken down by divisions, showed that they were randomly distributed. However, previous analyses carried out using Moran’s I statistic or the Getis–Ord general G (d) test for tourism showed that the tourist assets analysed showed a weak tendency to form clusters, and they mainly concerned accommodations [29]. As pointed out by Rodriguez Rangel and Sanchez Rivero [29], however, the fact that a global spatial distribution has not been identified does not mean that the values do not have a tendency to be grouped together at a local level, e.g., in a given commune.

6. Conclusions

The following conclusions with practical implications can be drawn from the data obtained for the communes of Staszowski County, the computation of individual indicators necessary to determine the tourism and investment potential, and the spatial analyses:
  • The most attractive communes in terms of tourism, i.e., Staszów and Szydłów, and the most attractive communes for investors, i.e., Staszów and Połaniec, have lower indicators of sustainable development associated with environmental protection than the average for the county.
  • Staszowski County has tourism and investment potential as well as the potential to be a significant centre of development of tourism, but it should strive for more sustainable development.
  • Communes with greater tourism potential, such as Staszów and Szydłów, are situated in the centre of the county, and should be more focused on their nature and cultural assets, while at the same time taking care to ensure appropriate tourism assets and environmental protection.
  • Communes such as Łubnica and Połaniec, situated in the south-eastern part of the county, are distinguished by their greater investment potential, and should be more focused on the development of suitable technical and transport infrastructure in order to increase the number of potential investors.
It is also possible to formulate more theoretical conclusions and recommendations for the future and for further research:
  • The study confirms the useful contribution of GIS tools in the assessment of tourism and investment potential. They are especially useful to the identification of spatial patterns, which might be helpful in a more sustainable development of the region. The other contribution for the existing literature is identification of the lack of cluster structure for tourism in the region, which have some tourism and investment potential, but tourism has only an indirect impact on the economy. However, due to small sample size, the research should be carried out in other regions with similar tourism and investment potential.
  • The study can be used as a basis for drawing up planning documents at the local level to support sustainable development in the area. They can also be used as a basis for future cooperation between communes, including cooperation aimed at supporting the competitiveness of the county. This will help to better exploit the common assets of the region and its sustainable development.
  • The study should be repeated in subsequent years, particularly in 2021, in order to track the changes in the values of the parameters analysed and to evaluate progress in the sustainable development of tourism in the study area. This research can also be helpful in assessing the development of tourism after two phases of the COVID-19 pandemic.

Author Contributions

A.Z.-W. and M.L.-Z. conceived the idea and planned the research. A.Z.-W. collected the data. M.L.-Z. planned and carried out the statistical analyses. M.L.-Z. and A.Z.-W. contributed to the interpretation and visualization of the results. A.Z.-W. and M.L.-Z. were responsible for writing the manuscript. Both authors have read and agreed to the published version of the manuscript.

Funding

This research was financed by the Ministry of Science and Higher Education of the Republic of Poland. The publication was co-financed within the framework of Ministry of Science and Higher Education programme as “Regional Initiative Excellence” in years 2019–2022, Project No. 005/RID/2018/19.

Conflicts of Interest

The authors declare no conflict of interest. The funders had no role in the design of the study; in the collection, analyses, or interpretation of data; in the writing of the manuscript, or in the decision to publish the results.

References

  1. World Commission on Environment and Development. Our Common Future; Oxford University Press: Oxford, UK, 1987; pp. 1–383. [Google Scholar]
  2. Kapera, I. Sustainable tourism development efforts by local governments in Poland. Sustain. Cities. Soc. 2018, 40, 581–588. [Google Scholar] [CrossRef]
  3. United Nations Environment Programme; United Nations World Tourism Organization. Making Tourism More Sustainable: A Guide for Policy Makers; UNEP: Paris, France; UNWTO: Madrid, Spain, 2005; p. 12. [Google Scholar]
  4. Jeong, J.S.; García-Moruno, L.; Hernández-Blanco, J.; Jaraíz-Cabanillas, F.J. An operational method to supporting siting decisions for sustainable rural second home planning in ecotourism sites. Land Use Policy 2014, 41, 550–560. [Google Scholar] [CrossRef]
  5. Paskaleva-Shapira, K.A. New paradigms in city tourism management: Redefining destination promotion. J. Travel. Res. 2007, 46, 108–114. [Google Scholar] [CrossRef]
  6. Timur, S.; Getz, D. Sustainable tourism development: How do destination stakeholders perceive sustainable urban tourism? Sustain. Dev. 2009, 17, 220–232. [Google Scholar] [CrossRef]
  7. Dimoska, T.; Petrevska, B. Indicators for sustainable tourism development in Macedonia. In Proceedings of the First International Conference on Business, Economics and Finance “From Liberalization to Globalization: Challenges in the Changing World”, Stip, North Macedonia, 13–15 September 2012; pp. 389–400. [Google Scholar]
  8. Vallone, C.; Orlandini, P.; Cecchetti, R. Sustainability and innovation in tourism services: The Albergo Diffuso case study. Eur. J. Soc. Sci. 2013, 1, 21–34. [Google Scholar]
  9. Krippendorf, J. Tourism in the system of industrial society. Ann. Tour. Res. 1986, 13, 517–532. [Google Scholar] [CrossRef]
  10. Kowalczyk, A. Turystyka zrównoważona; Wydawnictwo Naukowe PWN: Warsaw, Poland, 2001; pp. 1–34. [Google Scholar]
  11. Ministry of Sport and Tourism. Tourism Development Programme Until 2020; Ministry of Sport and Tourism: Warsaw, Poland, 2015; pp. 1–100. [Google Scholar]
  12. Pałka, E. The development of tourist sector in the Świętokrzyskie voivodship in background of Poland. Infrastruct. Ecol. Rural. Areas 2011, 2, 27–39. [Google Scholar]
  13. Rasoolimanesh, S.M.; Ramakrishna, S.; Hall, C.M.; Esfandiar, K.; Seyfi, S. A systematic scoping review of sustainable tourism indicators in relation to the sustainable development goals. J. Sustain. Tour. 2020, 1–21. [Google Scholar] [CrossRef]
  14. Liu, Y. Revisiting several basic geographical concepts: A social sensing perspective. Acta Geogr. Sin. 2016, 71, 564–575. [Google Scholar]
  15. Kurek, W.; Mika, M. Turystyka jak przedmiot badań naukowych. In Turystyka; Kurek, W., Ed.; Wydawnictwo Naukowe PWN: Warsaw, Poland, 2007; pp. 9–49. [Google Scholar]
  16. Warszyńska, J.; Jackowski, A. Podstawy Geografii Turyzmu; Wydawnictwo Naukowe PWN: Warsaw, Poland, 1978. [Google Scholar]
  17. Liszewski, S. Przestrzeń turystyczna. Turyzm 1995, 5, 87–103. [Google Scholar]
  18. Yang, Y.; Wong, K.K. Spatial distribution of tourist flows to China’s cities. Tour. Geogr. 2012, 15, 338–363. [Google Scholar] [CrossRef]
  19. Zhang, X.; Song, H.; Huang, G.Q. Tourism supply chain management: A new research agenda. Tour. Manag. 2009, 30, 345–358. [Google Scholar] [CrossRef] [Green Version]
  20. Gillmor, D.A. Evolving air-charter tourism patterns: Change in outbound traffic from the Republic of Ireland. Tour. Manag. 1996, 17, 9–16. [Google Scholar] [CrossRef]
  21. O’Hare, G.; Barrett, H. Regional inequalities in the Peruvian tourist industry. Geogr. J. 1999, 165, 47–61. [Google Scholar] [CrossRef]
  22. Chan, L.Y.; Lin, H.L.; Wang, C.L. Industry-region position and economic performance of travel and tourism service industry: An agglomeration perspective. Asia Pac. J. Tour. Res. 2012, 17, 562–576. [Google Scholar] [CrossRef]
  23. Michael, E.J. Tourism micro-clusters. Tour. Econ. 2003, 9, 133–145. [Google Scholar] [CrossRef]
  24. Nawaz, M.A.; Hassan, S. Investment and Tourism: Insights from the literature. J. Econ. Manag. Perspect. 2016, 10, 581–590. [Google Scholar]
  25. Romão, J.; Guerreiro, J.; Rodrigues, P.M. Territory and sustainable tourism development: A space-time analysis on European regions. Region 2017, 4, 1–17. [Google Scholar] [CrossRef] [Green Version]
  26. Romão, J.; Saito, H. A spatial analysis on the determinants of tourism performance in Japanese Prefectures. Asia Pac. J. Reg. Sci. 2017, 1, 243–264. [Google Scholar] [CrossRef] [Green Version]
  27. Jędruch, M.; Furmankiewicz, M.; Kaczmarek, I. Spatial Analysis of Asymmetry in the Development of Tourism Infrastructure in the Borderlands: The Case of the Bystrzyckie and Orlickie Mountains. ISPRS Int. J. Geo Inf. 2020, 9, 470. [Google Scholar] [CrossRef]
  28. Rietveld, P. Barrier E_ects of Borders: Implications for Border Crossing Infrastructures. Eur. J. Transp. Infrastruct. Res. 2012, 12, 150–166. [Google Scholar]
  29. Rodriguez Rangel, M.C.; Sanchez Rivero, M. Spatial Imbalance Between Tourist Supply and Demand: The Identification of Spatial Clusters in Extremadura, Spain. Sustainability 2020, 12, 1651. [Google Scholar] [CrossRef] [Green Version]
  30. Ruda, A. Exploring tourism possibilities using GIS-based spatial association methods. Geogr. Tech. 2016, 11, 87–101. [Google Scholar] [CrossRef] [Green Version]
  31. Nalej, M. Rozmieszczenie obiektów noclegowych w Łodzi w 2013 roku w świetle miar centrograficznych. Acta Univ. Lodziensis. Folia Geogr. Socio Oeconomica 2014, 16, 133–148. [Google Scholar]
  32. Majewska, J. Inter-regional agglomeration effects in tourism in Poland. Tour. Geogr. 2015, 17, 408–436. [Google Scholar] [CrossRef]
  33. Majewska, J.; Trusklolaski, S. Spatial concentration of economic activity and competitiveness of Central European regions. In Challenges for International Business in Central and Eastern Europe; Wach, K., Kneževi’c, B., Šimurina, N., Eds.; Cracow University of Economics: Kraków, Poland, 2017; pp. 47–64. [Google Scholar]
  34. Zarębski, P.; Kwiatkowski, G.; Malchrowicz-Mośko, E.; Oklevik, O. Tourism investment gaps in Poland. Sustainability. 2019, 11, 6188. [Google Scholar] [CrossRef] [Green Version]
  35. Al Mamun, A.; Mitra, S. A methodology for assessing tourism potential: Case study Murshidabad District, West Bengal, India. Int. J. Sci. Res. 2012, 2, 1–8. [Google Scholar]
  36. Nowak, E. Regionalne zróżnicowanie atrakcyjności turystycznej na przykładzie województwa świętokrzyskiego. Studium Vilnense A. 2020, 17, 120–125. [Google Scholar]
  37. Kornak, A.S.; Rapacz, A. Zarządzanie Turystyką i Jej Podmiotami w Miejscowości i Regionie; Wydawnictwo Akademii Ekonomicznej we Wrocławiu: Wrocław, Poland, 2001; pp. 1–228. [Google Scholar]
  38. Gawroński, K.; Król, K.; Gawrońska, G.; Leśniara, N. Spatial diversity of tourism attractiveness of the Nowy Sącz district, using the Wrocław taxonomic method. Geomat. Landmanagement Landsc. 2019, 2, 37–54. [Google Scholar] [CrossRef]
  39. Gołembski, G. (Ed.) Regionalne Aspekty Rozwoju Turystyki; Wydawnictwo Naukowe PWN: Warsaw-Poznań, Poland, 1999; pp. 1–206. [Google Scholar]
  40. Meyer, B. Aktywność samorządu lokalnego jako element potencjału turystycznego na przykładzie wybranych gmin województwa zachodniopomorskiego. Zesz. Nauk. Uniw. Szczecińskiego 2010, 590, 23–32. [Google Scholar]
  41. Guillet, B.D.; Zhang, H.Q.; Gao, B.W. Interpreting the mind of multinational hotel investors: Future trends and implications in China. Int. J. Hosp. Manag. 2011, 30, 222–232. [Google Scholar] [CrossRef]
  42. De Ridder, W.; Turnpenny, J.; Nilsson, M.; Von Raggamby, A. A framework for tool selection and use in integrated assessment for sustainable development. J. Environ. Assess. Policy Manag. 2007, 9, 423–441. [Google Scholar] [CrossRef]
  43. Schianetz, K.; Kavanagh, L.; Lockington, D. Concepts and tools for comprehensive sustainability assessments for tourism destinations: A comparative review. J. Sustain. Tour. 2007, 15, 369–389. [Google Scholar] [CrossRef]
  44. European Commission. The European Tourism Indicator System. ETIS Toolkit for Sustainable Destination Management; Publications Office for the European Union: Luxembourg, 2016; pp. 1–32. [Google Scholar]
  45. Yan, L.; Gao, B.W.; Zhang, M. A mathematical model for tourism potential assessment. Tour. Manag. 2017, 63, 355–365. [Google Scholar] [CrossRef]
  46. Ashouri, P.; Faryadi, S. Potential Assessment of Nature-Based Tourism Destinations Using MCA Techniques (Case Study: Lavasan-e Koochak). J. Environ. Stud. 2010, 36, 1. [Google Scholar]
  47. Collins-Kreiner, N.; Wall, G. Evaluating tourism potential: A SWOT analysis of the Western Negev, Israel. Tourism 2007, 55, 51–63. [Google Scholar]
  48. Iatu, C.; Bulai, M. New approach in evaluating tourism attractiveness in the region of Moldavia (Romania). Int. J. Energy Environ. 2011, 5, 165–174. [Google Scholar]
  49. Miller, G. The development of indicators for sustainable tourism: Results of a Delphi survey of tourism researchers. Tour. Manage. 2001, 22, 351–362. [Google Scholar] [CrossRef] [Green Version]
  50. Lozano-Oyola, M.; Blancas, F.J.; González, M.; Caballero, R. Sustainable tourism tags to reward destination management. J. Environ. Manage. 2019, 250, 109458. [Google Scholar] [CrossRef]
  51. Asmelash, A.G.; Kumar, S. Assessing progress of tourism sustainability: Developing and validating sustainability indicators. Tour. Manage. 2019, 71, 67–83. [Google Scholar] [CrossRef]
  52. Marzo-Navarro, M.; Pedraja-Iglesias, M.; Vinzón, L. Sustainability indicators of rural tourism from the perspective of the residents. Tour. Geogr. 2015, 17, 586–602. [Google Scholar] [CrossRef]
  53. Hunter, C.; Shaw, J. The ecological footprint as a key indicator of sustainable tourism. Tourism Manage. 2007, 28, 46–57. [Google Scholar] [CrossRef]
  54. Zapata, M.J.; Hall, C.M.; Lindo, P.; Vanderschaeghe, M. Can community-based tourism contribute to development and poverty alleviation? Lessons from Nicaragua. Curr. Issues. Tour. 2011, 14, 725–749. [Google Scholar] [CrossRef]
  55. Blancas, F.J.; González, M.; Lozano-Oyola, M.; Perez, F. The assessment of sustainable tourism: Application to Spanish coastal destinations. Ecol. Indic. 2010, 10, 484–492. [Google Scholar] [CrossRef]
  56. Biermann, F.; Kanie, N.; Kim, R.E. Global governance by goal-setting: The novel approach of the UN Sustainable Development Goals. Curr. Opin. Env. Sust. 2017, 26–27, 26–31. [Google Scholar] [CrossRef]
  57. Kondracki, J. Geografia regionalna Polski; Wydawnictwo Naukowe PWN: Warsaw, Poland, 2009; pp. 1–441. [Google Scholar]
  58. Starostwo Powiatowe w Staszowie. Strategia Rozwoju Powiatu Staszowskiego na lata 2016–2025; Starostwo Powiatowe w Staszowie: Staszów, Poland, 2016; pp. 1–73. [Google Scholar]
  59. Durydiwka, M. Tourist function in rural areas of Poland. Spacial diversity and changing trends. Misc. Geogr. 2013, 17, 5–11. [Google Scholar] [CrossRef] [Green Version]
  60. Witkowska-Dąbrowska, M. Ocena potencjału turystycznego powiatu o wysokich walorach środowiskowych. In Tourism in the Development of Rural Areas; Sikorska-Wolak, A., Ed.; Wydawnictwo SGGW: Warsaw, Poland, 2007; pp. 463–477. [Google Scholar]
  61. Ziernicka-Wojtaszek, A.; Zawora, T. Wybrane metody oceny atrakcyjności agroturystycznej terenów wiejskich. Infrastruct. Ecol. Rural. Areas 2011, 2, 235–245. [Google Scholar]
  62. Pukowiec, K.; Kurda, W. Ocena atrakcyjności turystyczno-rekreacyjnej gmin powiatu Lublinieckiego. Zeszyty Naukowe Wyższej Szkoły Przymierza Rodzin w Warszawie 2013, 11, 7–20. [Google Scholar]
  63. Lisiak, M.; Opala, A.; Borowiak, K. The concept of tourism development as a factor increasing the tourism potential of rural communes—A case study. Studia Obszarów Wiejskich 2016, 44, 99–112. [Google Scholar] [CrossRef] [Green Version]
  64. Robaszkiewicz, K.; Lisiak, M.; Borowiak, K.; Kanclerz, J. The concept of tourism enrichment potential of Witkowo commune concerning Gniezno county area. Infrastruct. Ecol. Rural. Areas 2016, IV/2, 1373–1383. [Google Scholar]
  65. Król, K.; Ziernicka-Wojtaszek, A.; Zdonek, D. Assessment of the attractiveness of the tourist and recreation area of Bielsko County. Zesz. Nauk. Organ. i Zarządzanie Politech. Śląska 2020, 144, 299–314. [Google Scholar]
  66. Ziernicka-Wojtaszek, A.; Lisiak, M. Evaluation of the tourism and recreational space of Lubaczowski County, Poland. J. Water Land Dev. 2020, 44, 165–172. [Google Scholar]
  67. Świstak, E.; Świątkowska, M. Zróżnicowanie przestrzenne bazy noclegowej jako determinanta ruchu turystycznego w Polsce. Ekon. Probl. Tur. 2016, 34, 201–210. [Google Scholar] [CrossRef]
  68. Polska Agencja Rozwoju Turystyki SA. In Strategia Rozwoju Turystyki w Województwie Świętokrzyskim na Lata 2006–2014; Ministerstwo Sportu i Turystyki: Warsaw, Poland, 2005.
  69. Derek, M.; Woźniak, E.; Kulczyk, S. Clustering nature-based tourists by activity. Social, economic and spatial dimensions. Tour. Manage. 2019, 75, 509–521. [Google Scholar] [CrossRef]
  70. Jażdżewska, I. The use of centrographic measures in analysing the dispersion of historic factories, villas and palaces in Łódź (Poland). Folia Geogr. 2018, 60, 50. [Google Scholar]
Figure 1. Location of Staszowski County in the Świętokrzyskie Voivodeship. Source: own work based on data from national geodetic and cartographic resources.
Sustainability 13 00003 g001
Figure 2. Share of individual divisions in the sphere of tourism attractiveness for each commune.
Sustainability 13 00003 g002
Figure 3. Proportion of environmental protection in tourism attractiveness (A) and of population relations in investment attractiveness (B) for the communes.
Sustainability 13 00003 g003
Figure 4. Standard deviational ellipses for divisions of tourism attractiveness. Source: own work based on data from national geodetic and cartographic resources.
Sustainability 13 00003 g004
Figure 5. Principal component analysis for tourism attractiveness.
Sustainability 13 00003 g005
Figure 6. Proportion of each division in the investment attractiveness of the communes.
Sustainability 13 00003 g006
Figure 7. Standard deviational ellipses for divisions of investment attractiveness. Source: own work based on data from national geodetic and cartographic resources.
Sustainability 13 00003 g007
Figure 8. Principal component analysis for investment attractiveness.
Sustainability 13 00003 g008
Figure 9. Spatial distribution of values for the general synthetic measure. Source: own work based on data from national geodetic and cartographic resources.
Sustainability 13 00003 g009
Table 1. Divisions within which diagnostic variables were selected and their weights.
DivisionFeatureSymbolUnit of MeasurementWeightCharacter
tourism assetsforest areaTA1ha0.15+
meadow and pasture areaTA2ha0.04+
other land and wastelandTA3ha0.08+
protected areas TA4ha0.12+
river TA5number0.08+
lakeTA6number0.08+
fairs, exhibitions and eventsTA7number0.08+
museumsTA8number 0.05+
churchesTA9number 0.06+
palace and castlesTA10number 0.09+
historic monumentsTA11number 0.09+
tourist trail lengthTA12km0.08+
state and protection of the environmentwastewater treatment plant capacity relative to volume of wastewater to be treatedEP1%0.25+
amount of waste generated during the yearEP2t0.25-
water consumption for the needs of the national economy and population during the yearEP3hm30.25-
number of home sewage treatment plantsEP4number0.25+
transport accessibilitylength of regional roadsTRA1km0.50+
length of county roadsTRA2km0.50+
hotels, eating establishments and supplementary facilitieshotelsHC1number of facilities0.30+
boarding housesHC2number of facilities0.25+
restaurants and cafésHC3number of facilities0.25+
swimming poolsHC4number of facilities0.04+
swimming areasHC5number of facilities0.05+
sports fieldsHC6number of facilities0.06+
horse riding centres, studsHC7number of facilities0.05+
service infrastructurepetrol stationsSI1number of facilities0.30+
pharmaciesSI2number of facilities0.08+
banks and money exchange officesSI3number of facilities0.20+
post and telecommunication centresSI4number of facilities0.30+
outpatient clinics and health centresSI5number of facilities0.06+
dental surgeonsSI6number of facilities0.06+
technical infrastructureproportion of residential buildings connected to the water network in total residential buildingsTI1%0.20+
water distribution network lengthTI2km per 100 km20.20+
proportion of residential buildings connected to the sanitary drainage network in total residential buildingsTI3%0.20+
sanitary drainage network lengthTI4km per 100 km20.20+
population using gas supply networkTI5%0.20+
population relationstotal number of inhabitantsPR1number of people0.15+
total number of employed peoplePR2number of people0.20+
unemployment ratePR3%0.30+
population densityPR4number of people per km20.35+
commune financescommune incomesCF1PLN0.40+
total value of signed grant agreementsCF2PLN0.10
the proportion of commune’s investments in total expenditure from the communal budgetCF3%0.20+
proportion of grants and subsidies in total income of the communeCF4%0.10+
expenditure on public roadsCF5PLN0.20+
where: ‘+’ designates stimuli and ‘-’ designates inhibitors.
Table 2. Spheres and divisions within which diagnostic variables were selected and their weight.
SphereWeight of SphereDivisionWeight of Division
tourism attractiveness0.50tourism assets0.60
state and protection of the environment0.10
transport accessibility0.10
hotels, eating establishments and supplementary facilities0.20
investment attractiveness0.50service infrastructure0.32
technical infrastructure0.25
population relations0.23
commune finances0.20
Source: own work based on Gołembski [39].
Table 3. Spatial autocorrelation—global Moran’s I statistic for features from each division.
Analysis DivisionMoran’s I indexz-Scorep-ValueSpatial Pattern
tourism assets0.0310.7800.435random
state and protection of the environment−0.734−2.5180.012dispersed
transport accessibility0.3021.7370.082clustered
hotels, eating establishments and supplementary facilities0.1831.5310.126random
service infrastructure−0.323−0.9740.330random
technical infrastructure−0.612−1.8170.069dispersed
population relations−0.597−1.8160.069dispersed
commune finances−0.374−1.0070.314random
Publisher’s Note: MDPI stays neutral with regard to jurisdictional claims in published maps and institutional affiliations.

