1. Introduction
Urbanization has produced a variety of endemic structural changes in land-use/land-cover (LULC) characteristics. LULC highlights the causal relationships between spatial transformations involving land conversion and adverse environmental ramifications. Globally, urban agglomerations inches closer to worrisome milestones, as cities assume new roles of de facto national economies of many countries [
1]. With globalization, the cities have become increasingly attractive to all strata of human society because of their strategic economic and political advantages, employment opportunities and availability of relevant infrastructures and facilities. Urbanization exerts a chain anthropogenic process on the natural environment and is arguably the major contributor to global land-use transition. LULC change is a complex mechanism that transforms natural landscapes, climate conditions and a major source of threat to environmental biology, ecological ‘flora and fauna’ and deterioration of biodiversity.
Fast LULC change has caused many catastrophic weather and environmental events due to rising tides of natural and anthropogenic forcing elements such as solar radiation, flooding, temperature, wind and seismic effects [
2]. Whilst the evolutionary phases of the developed nations have reached their prime, their counterparts in the developing world are in the worst phase of uncontrolled urbanization. Whilst the developed nations’ developmental stages have entered their primes, their counterparts in the developing countries are in the worst period of unchecked urbanization.
Manifest variants of crumbled infrastructure, poverty, insecurity, instability and social-economic inequalities have increased the trend and scale of rural to urban migration, defining rural settings of Africa, Asia and South America compared to cities. In low- and middle-income countries, the marked population-cum-urbanization chains have had a tremendous impact on LULC transition and urban development planning. Equally, many cities are plagued by population waves, urban sprawls and gaps in infrastructure, which currently occupy many domains of knowledge and discourses by policy makers and academia. LULC expansion is among the major contributors to climatic change [
3], not least the impact of the transport sector, which contributes a significant share of about 27% to global greenhouse gas (GHG) emission [
4].
Land covers include physical and human landscapes (e.g., vegetation, rocks, water bodies, arable land and transport infrastructures). Land use, on the other hand, involves human activities on the ground including farming, mining, commercial and industrial developments etc. Empirical studies by researchers have established many diverse fields of applications of LULC including geology and mining [
5,
6], hydrology and water catchments [
7], agriculture [
8], forestry and wildlife [
9,
10], urban evolution and regional geography [
11], climate change and environmental ecology [
12]. The traditional urban growth of Nigeria has always merged all infrastructure development together, including transport, without recourse to their differing critical needs and priorities.
The rapid global urbanization pace is undercut by epic challenges of meeting the greater demands for housing, health and educational facilities, good transport systems, employment and other basic services, especially for the poor urban communities. The key impetus of a sustainable urban planning regime optimizes development for socioeconomic and environmental inclusion for all, with compatible land use and resilient infrastructure. Urban planning developments in developed countries have long been discernibly planned and coordinated with sustainable outlooks [
13]. The developing countries’ cities, on the other hand, have concentrated development at the center, while the periphery is littered with a scattered mosaic of urban sprawl and slums neglected by the political authorities [
14,
15].
Segregated socioeconomic structure of Nigerian society, together with the menacing atmosphere of Boko-haram Islamist insurgency and other violent crimes has heightened the plague of urbanization in Kano—the second most populous city in the country [
16,
17,
18]. The underlying population increase in Kano metropolis combined with massive transport infrastructure deficits has brought mobility, pollution, motorization, safety and urban transport problems to a head [
19,
20]. The spatial, socioeconomic and environmental impacts of loosely planned cities can be devastating, especially for the city which has experienced remarkable urban growth over a short period of time [
21].
Efficient, accessible and resilient transport infrastructure and services bore the hallmark of livable sustainable cities. While Kano city authorities are attempting to cover up for the seemingly wide gap in transport infrastructure, sufficient attention has not been paid to the changing physical and spatial-temporal scales of the urban landscape and its compatibility with a sustainable paradigm.
In theory, all past events could influence our forecasts for the next experiment when sequences of stochastic events are observed. Satellite imaging has been widely used with remote-sensing technology to locate, inventory, map or classify landscape ecology [
22,
23]. Like a Markov chain, a Markov process can be considered a directed graph of a system’s states [
24]. Thus, a Markov continuous process could be adapted to model dynamic changes in transport infrastructure and urban landscape ecology by two-time states to forecast potential distribution areas.
In order to make informed decisions, there is a need for comprehensive documentation of LULC transition, and the causal effects of transport planning and policy interventions. The research is motivated to examine the relationship between city growth, the demand of transport infrastructure and transition chains in landscape ecology with the goal of predicting future land-use changes scenarios in Kano metropolis. In this research, we apply three Landsat images (from Thematic Mapper (TM) of July 1984, Enhanced Thematic Mapper Plus (ETM+) of March 2013 and Operational Land Imager (OLI) of October 2019) for remote sensing transport landscape mapping.
Geographic information systems (GIS) are remote-sensing tools for tracking geographic and spatial changes, LULC simulation and scenario prediction. It is commonly used to study LULC changes and prediction based on past knowledge with a validation model to measure the accuracy of prediction [
25]. Continuous Landsat imagery data offer useful information which can be used as a prediction reference. Landsat has remained the most widely used satellite remote-sensing data, and its continuous long-term dependability, cost-effectiveness, and timeliness have made it a useful resource for tracking LULC transition.
Many developed countries have largely reached the terminal stage of urban transition; the climax of future urban growth potential of 2030 to 2050 will take place in African and Asian cities where most of the world-leading mega-cities will emerge [
26]. Mega-cities, cities with at least ten million inhabitants, are sprouting in Africa without the critical aspect of infrastructure development. Needless to say that the Nigerian city of Lagos became the world 14th largest mega-city with an urban population of more than 15 million in 2013 [
27]. Kano metropolis, the second largest city of 4million inhabitants, is exhibiting similar growth potentials to join in the pack. The cycle of urbanization coupled with defective and poorly oriented policies is negatively impacting the most basic infrastructure [
28].
We retrospectively tracked urbanization in Nigeria from two important temporal milestones (1984 and 2013) to when the research data were taken in 2019. The country returned to civil rule in 1983 blossomed economy, an impetus triggering the high urbanization wave in 1984 with many cities almost tripling in size within a few years [
29]. At 2013, demographic indices for the first time reached a pinnacle of 58.3% urbanization level, putting more Nigerians in cities than rural settings [
16].
The trajectories of future potential population and urban growths are higher—urbanization level is estimated at about 67.1%, creating more than 295 million city dwellers out of about 450million projected total population in 2050 [
27]. Even as urbanization is often related to higher wages, improved productivity and overall living standards improvements, the speed and size of the new urban paradigm in developed countries do not assure these improvements. In the United Nations Human Development Index, Nigeria is ranked 152 out of 178 countries among the group of “low human development” [
30].
Furthermore, we developed a Markov probability transition matrix implemented in IDRISI SELVA 17 to forecast likely future scenarios of transport infrastructure and land-use ecology to Kano city’s urban form in 2030 to 2050 temporal periods after model validation. Population and urbanization growth indicators speak to the strategic importance of these time scales to planning and development control—Nigerian population forecast could climb 450 million milestone in 2050, with urban agglomeration spikes of about 70% in 2030 [
30]. The cellular automata-Markov (CA-Markov) model fitted in IDIRIS SELVA software could be used to establish a spatial weighting of a specific area roughly the same as existing land use, making it very accurate in spatial-temporal dynamics and quantitative estimation of LULC change modeling [
31]. Finally, a scientific framework is developed for tracking urban spatial-temporal dynamics and as a decision-making tool for ecological conservation and optimal resource allocation for Nigerian cities
2. Materials and Methods
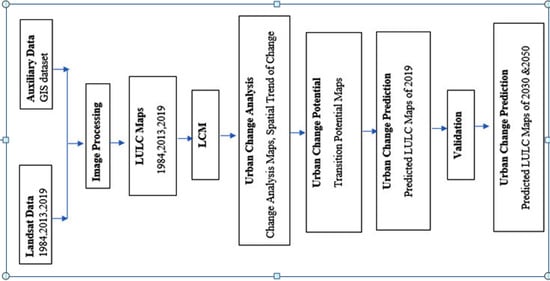
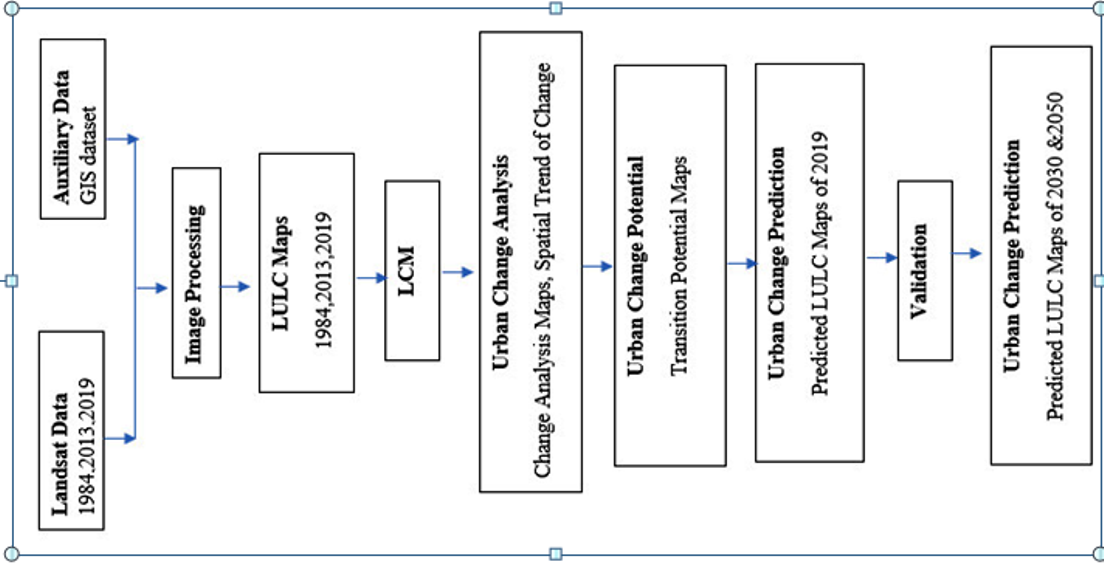
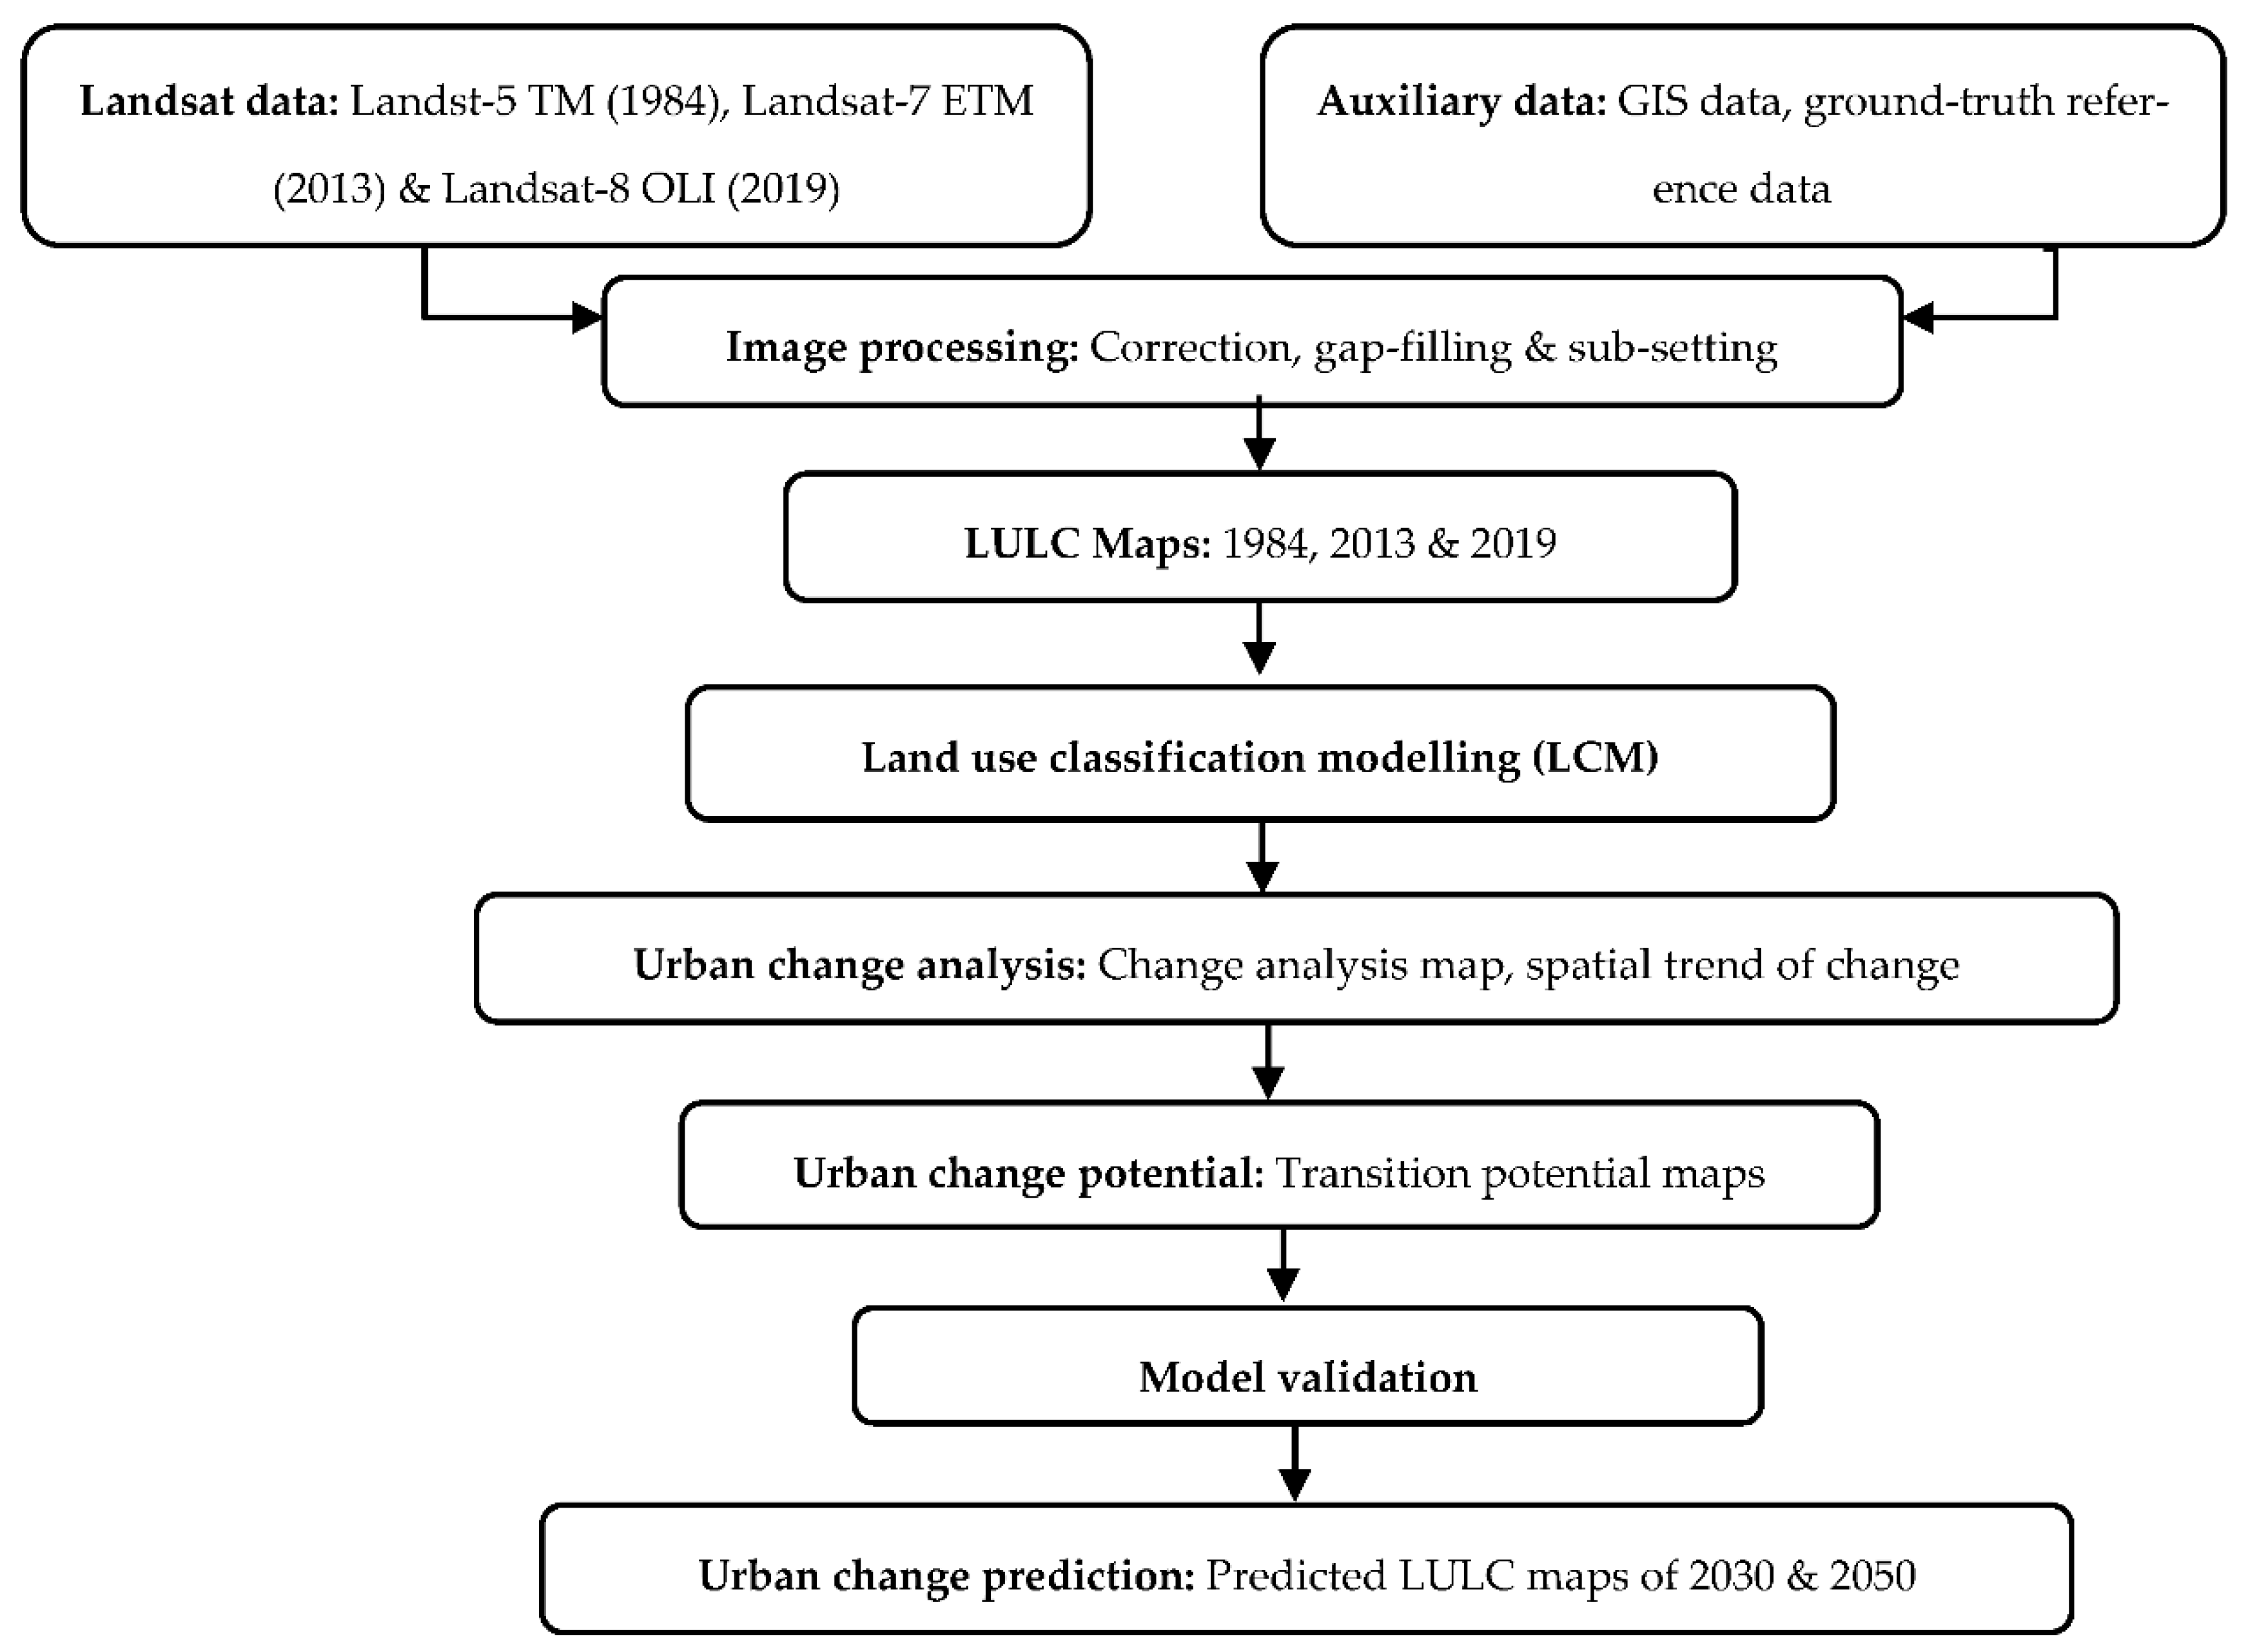
The methodology involves using hybrid GIS and CA-Markov for assessing and examining LULC modeling and predicting transport system infrastructure demand in Kano metropolis. Before implementing algorithms for LULC change detection, a series of pre-processing measures were carried out for Landsat images, including atmospheric correction, cloud and atmosphere recognition, and composite fusion metric techniques [
32,
33]. The methodological algorithm of the hybrid model is shown
Figure 1.
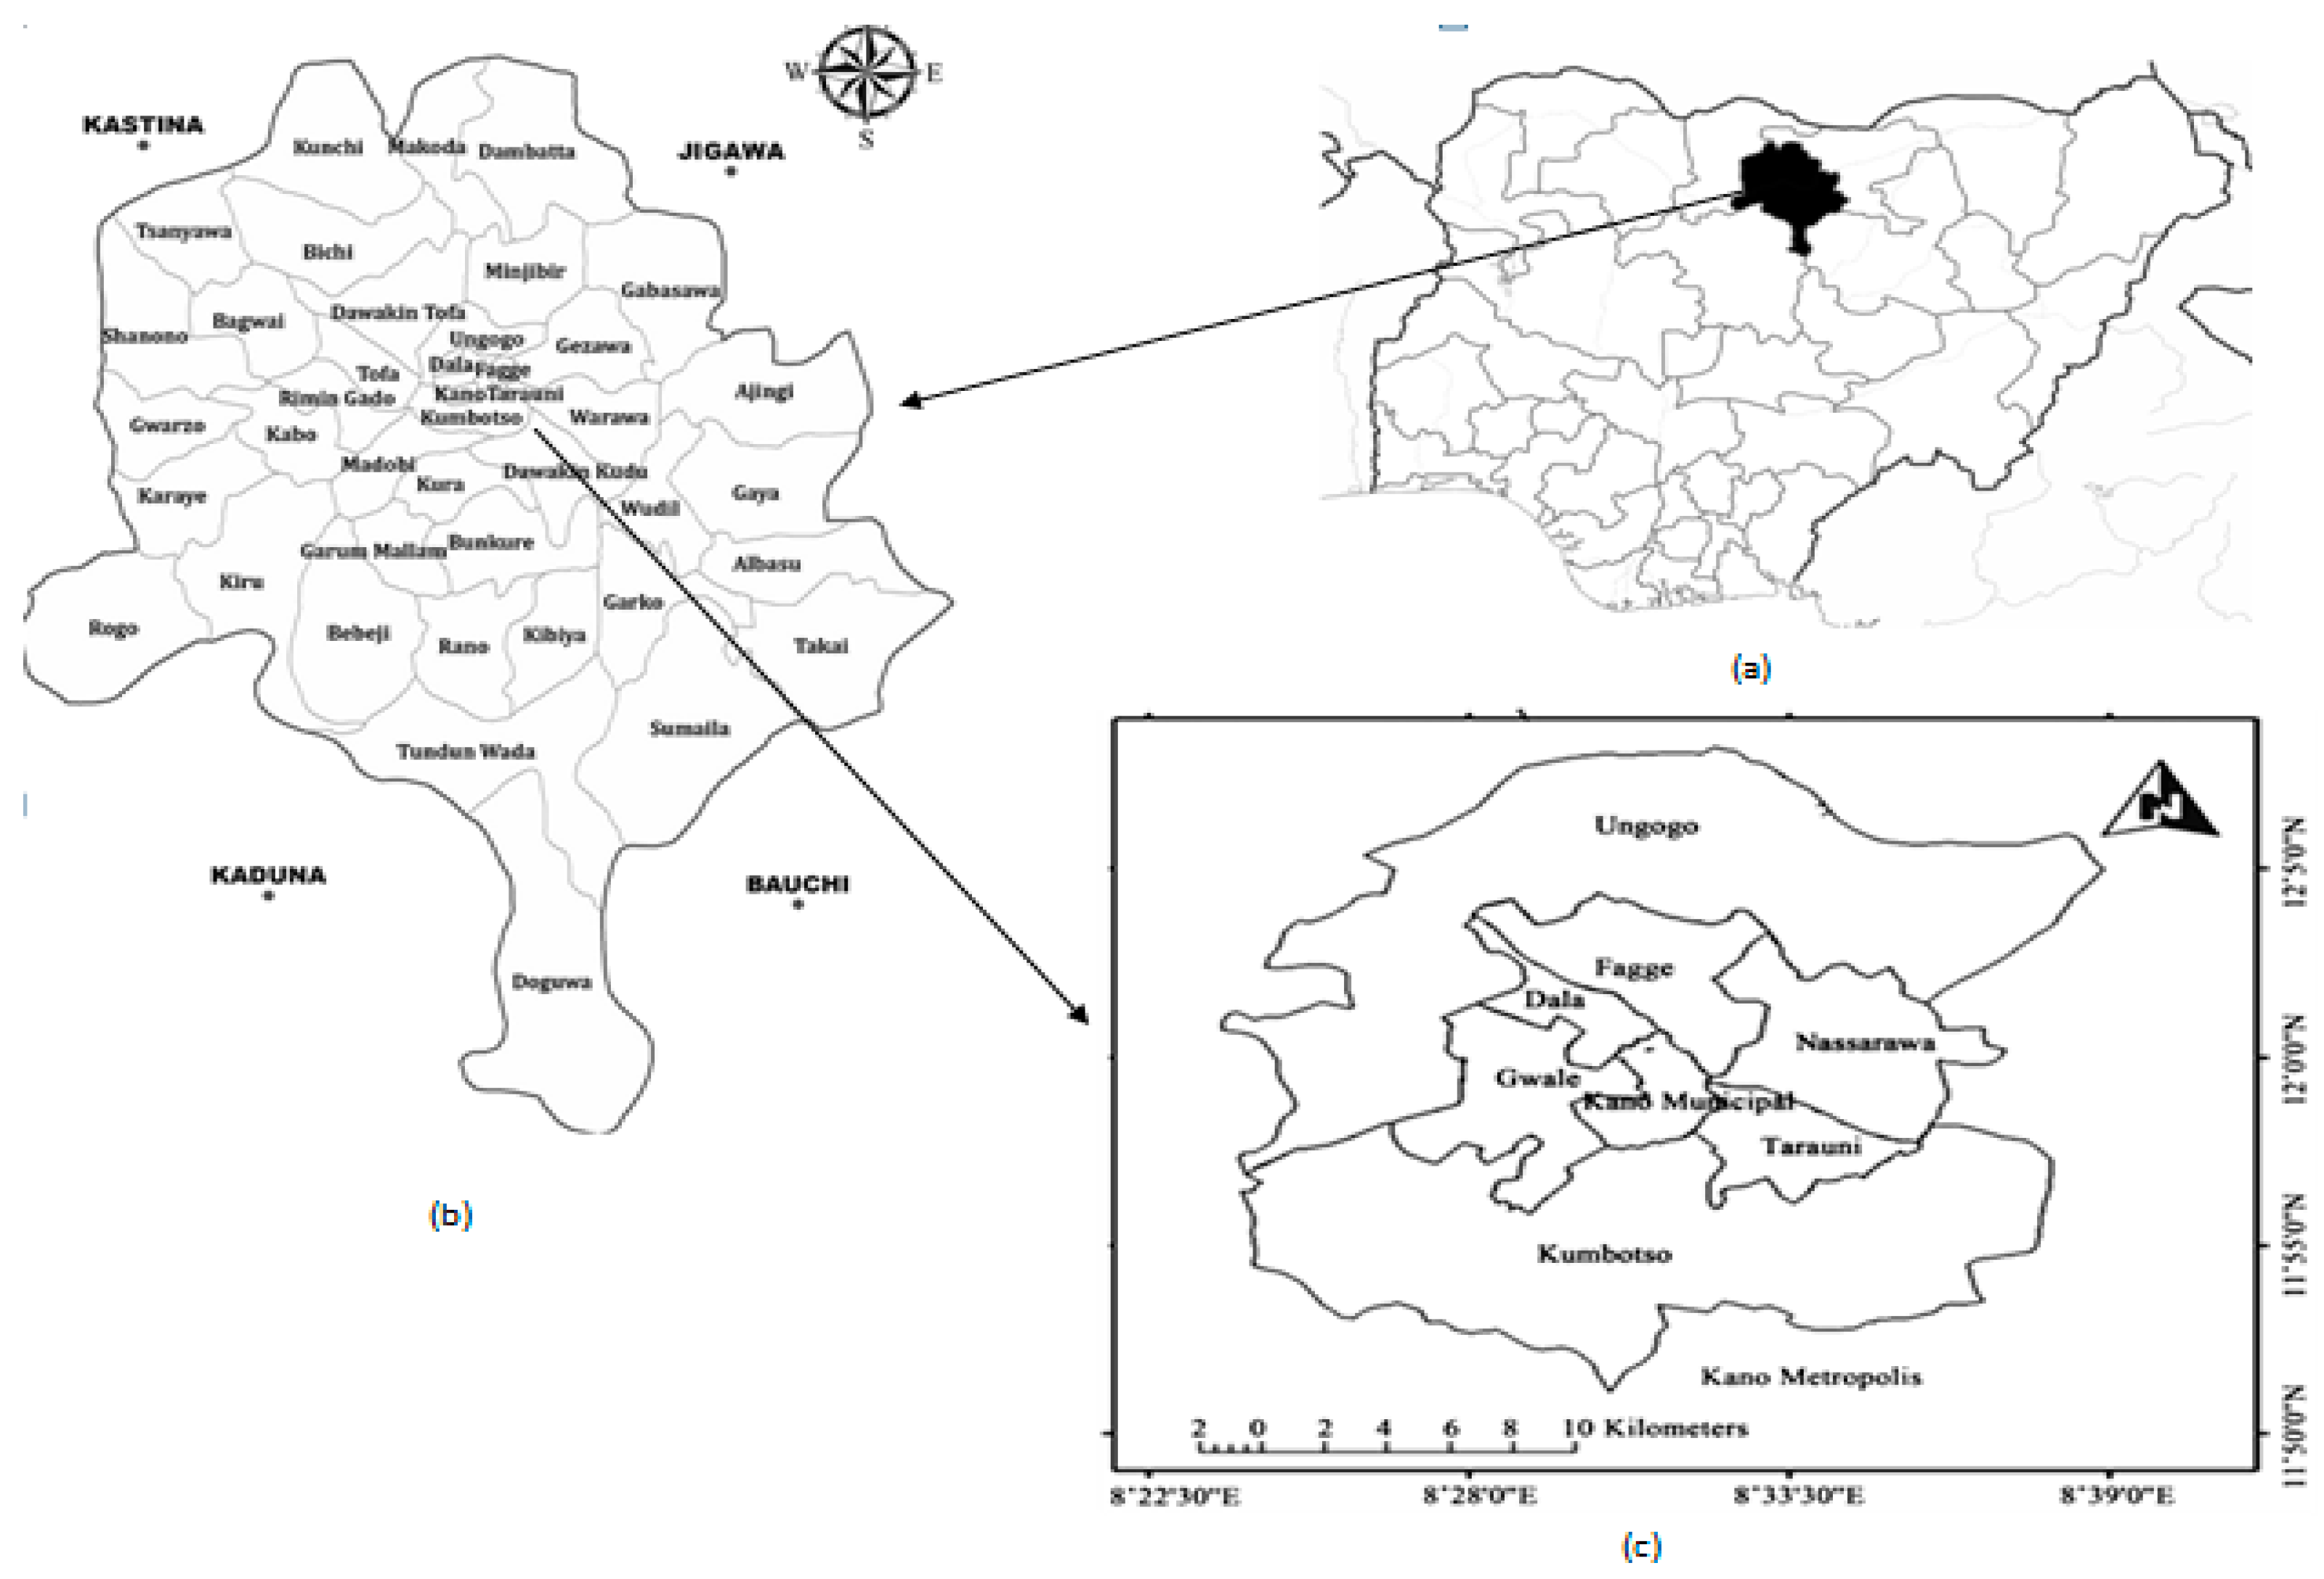
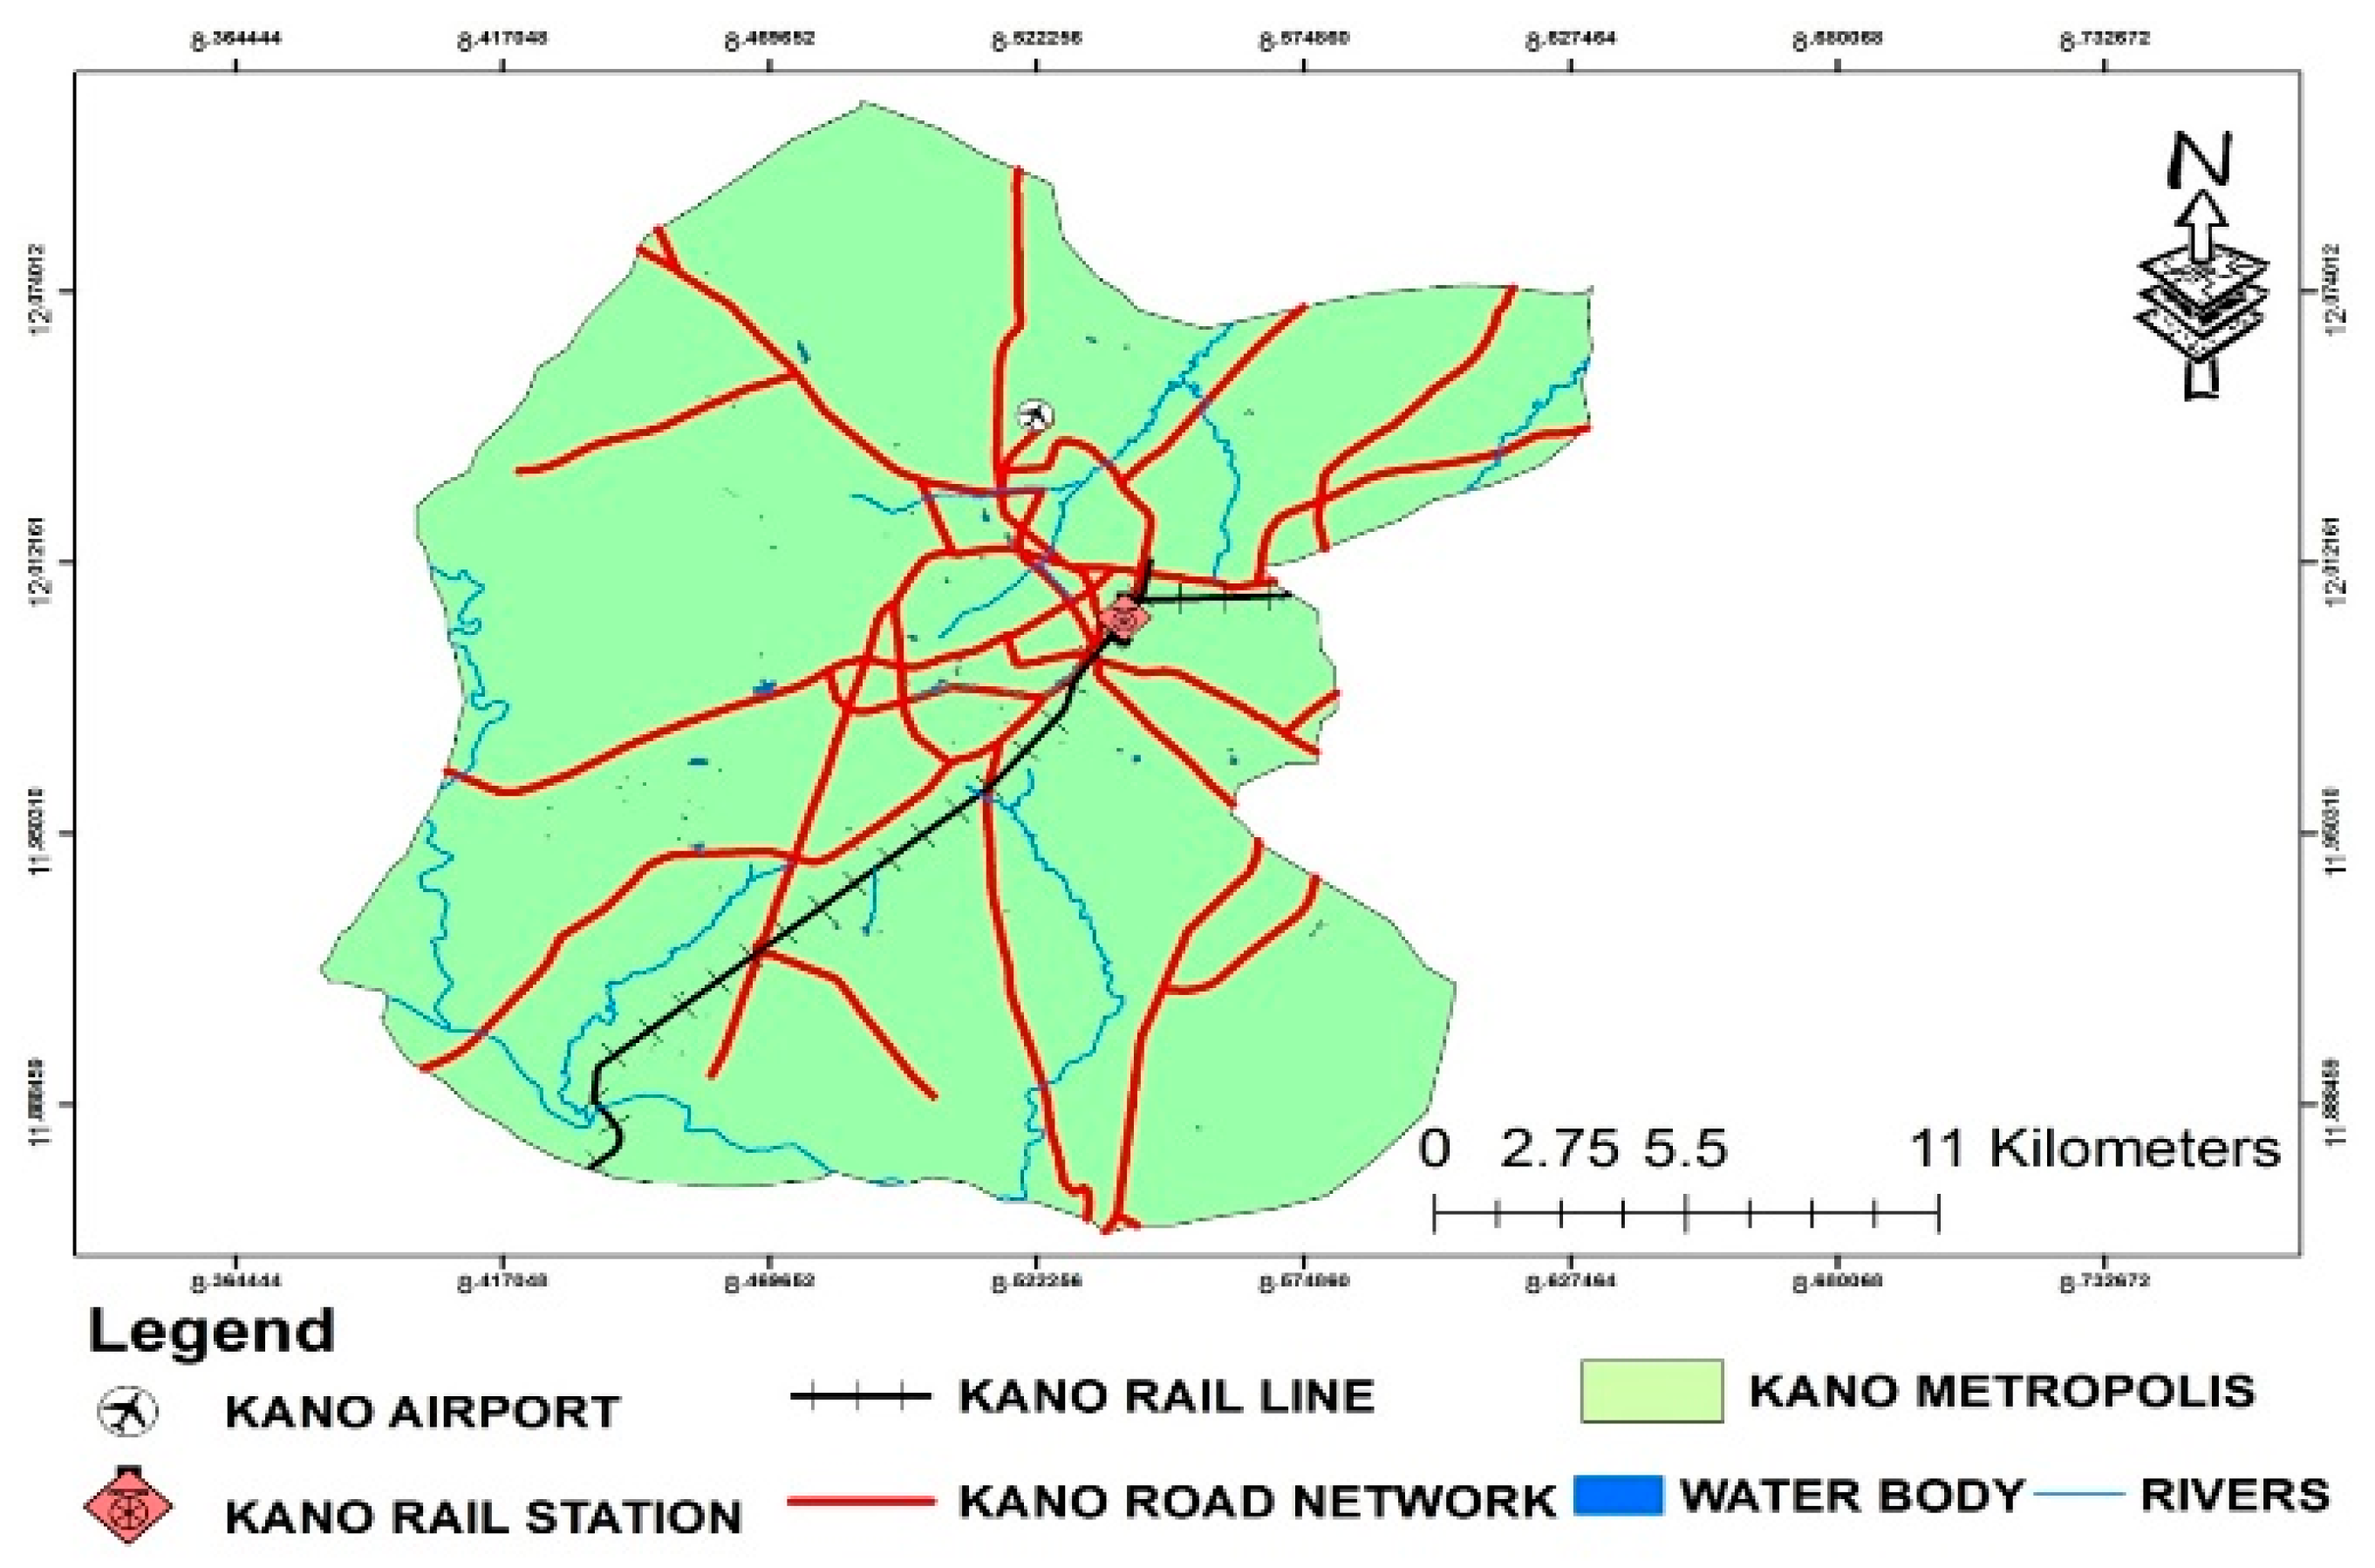
2.1. The Study Area
Kano city is an urban conurbation of eight (8) Local Government Areas (LGAs) (Dala, Fagge, Gwale, Kano Municipal, Nassarawa, Tarauni, Ungogo and Kumbotso), located between latitudes 11°25′ N to 12°47′ N and longitude 8°22′ E to 8°39′ E on 472 m above sea level in the Sahel desert. It is the commerce nerve center of the northern country due to its long flourishing marketing (and dominant economic) activities. Nevertheless, agriculture is a second means of employment on the savannah vegetation with Jakara and Challawa rivers being the main water bodies draining the city catchment area [
34].
Figure 2 shows the location map of the city metropolitan study area and
Figure 3 is the digitized map of major transport infrastructure.
2.2. Sources of Data and Image Processing
The geo-referenced data used are the United States Geological Survey (USGS) Landsat (
https://earthexplorer.usgs.gov/) imageries—thematic mapper TM (Landst-5 TM), enhanced thematic mapper ETM (Landsat-7 ETM) and operational land imager OLI (Landsat-8 OLI) respectively for 1984, 2013 and 2019 temporal milestones. Also, other ancillary data obtained are land use maps obtained from the Nigerian National Space Research and Development Agency (NASRDA (
https://nasrda.gov.ng)), high resolution Google Earth photo and physical landmarks from knowledge of the area for verifying and delineating major transport infrastructure including roads, airports and railway lines.
Table 1 provides detailed attributes of the Landsat data used LULC transition analysis.
Data files in tagged image file (TIF) format was downloaded with less than 10 percent cloud cover and imported as raster using ERDAS IMAGINE 2014 software. The raster format is registered image-to-image based on similar projection system and re-sampled to a spatial resolution of 30 × 30 m. The sequence of digital image processing includes correction of the atmosphere, radiometry error and the geometry, as well as image gap filling, area of interest sub-setting and band selection.
The digital elevation model (DEM) data collection of the Advanced Space-borne Thermal Emission and Reflection Radiometer (ASTER) repository at the USGS website was used for the land areas in 30 m spatial resolution posting for the surface elevation and topography extraction. Cloud constitutes a very critical barrier to remote sensing and optical quality, especially in some humid tropical environments, thus, cloud cover effect is a key requirement for land cover dynamics. To guarantee the accuracy of atmospheric correction, level 2 atmospherics with geometric and radiometric pre-corrected Landsat imageries were obtained from USGS Earth Explorer and with delineated conversion scale factor into surface reflectance.
In May 2003, a scan line corrector (SLC) compensating for the satellite forward motion of Landsat 7 Enhanced Thematic Mapper Plus (ETM+) failed, thereby imposing a state of “fill-no-data” otherwise called data “gap” on image scenes especially in heterogeneous landscapes. From the date henceforth, gap filling processing for Landsat 7 ETM+ SLC-off became necessary. In the current research, the gap filling software approach involves Interactive Data Language (IDL 7.0) (
https://glovis.usgs.gov/). Therefore, three further images were required to fill the “no-data” areas: (1) an anchor fill in the image (2) an image obtained before May 2003 (3) an image obtained post anchor.
Spatial transformation was carried out by manual image registration adopted to match images of the same scene from the different satellite imageries using Landsat 5TM (for 1984) as master control points. With these control points, the alignment of image scenes also involves stacking other satellite imageries (Landsat 7 ETM and Landsat 8 OLI) and compared with referenced auxiliary data. The transformation matched points yielded error average (root mean squared error (RMSE) = 0.12 pixels) at a resolution of 30m is a good match iteration being less than the suggested literature threshold of RMSE <0.5 pixel [
36,
37].
Predictive modelling of LULC change is an increasingly growing research field due to its significance in identifying the anthropogenic and ecological impact of human activities. LULC change has a direct impact on global change, including biodiversity, water and biological cycles and ecological systems. These changes are typically triggered by human activities (e.g., urbanization, deforestation, mining, overgrazing and agriculture intensification), and other natural causes relating to cosmic radiation and climate change. In view of the strategic importance, scientists have formed an international LULC organization linked to the International Geosphere Biosphere Program (IGBP) and the International Human Dimensions of Global Change Program (IHDGCP) both founded in 1987 [
38].
In the study of LULC transition, several different modelling techniques have been implemented, land use conversion and its drivers have dominated the discourse. The models provide a probabilistic estimate of where the changes might potentially occur by understanding the factors driving them [
39,
40]. Several methods have been developed involving computer implemented algorithms for accuracy, speed and ease of handling big data in land use modelling and prediction. Prediction models have been categorized into four groups—dynamic (process-based), optimization, stochastic and empirical–statistical based techniques [
41].
Cellular automata (CA) are one of the modelling algorithms which is a time and space based discrete dynamic system that obeys specific rules on a uniform space grid. Due to its ability to depict a complex system using a series of small collection of rules and states for detecting spatial-temporal behavior, it is particularly selected for LULC modelling. Markov chain analysis involves a stochastic modelling for the study of the dynamic transition process of land use at various spatial and temporal scales based on the assumption that the physical state can be determined if an earlier state is known. CA incorporates transformation rules that are used to describe a certain cell’s state. CA-Markov was compiled as one of the powerful models in IDRISI SELVA software for spatial interaction and modelling simulation [
42].
2.3. Image Classification and Accuracy
The quantitative aspects of LULC transition monitoring and analysis are precision driven, as the quality of various LULC mapping application algorithms are vital to the potential dynamic change modeler. Application of different classification algorithms, namely—maximum likelihood classifier (MLC), support vector machine (SVM), random forest (RF), decision tree (DT), Mahalanobis distance (MD), artificial neural networks, spectral angle mapper (SAM), Fuzzy logic adaptive resonance theory-multi-agent process (Fuzzy ART—MAP) and genetic algorithms produced satisfactory accuracies (i.e., Kappa value > 84%) [
43,
44].
In order to appropriately classify the individual Landsat images, a widely adopted method of supervised maximum likelihood classifier (MLC) was used to generate the relevant land-use classes and to evaluate urban expansion including transport spatial evolution. MLC is commonly adopted because of its ease of parametric convergence as many of the other classifiers usually take time to optimize.
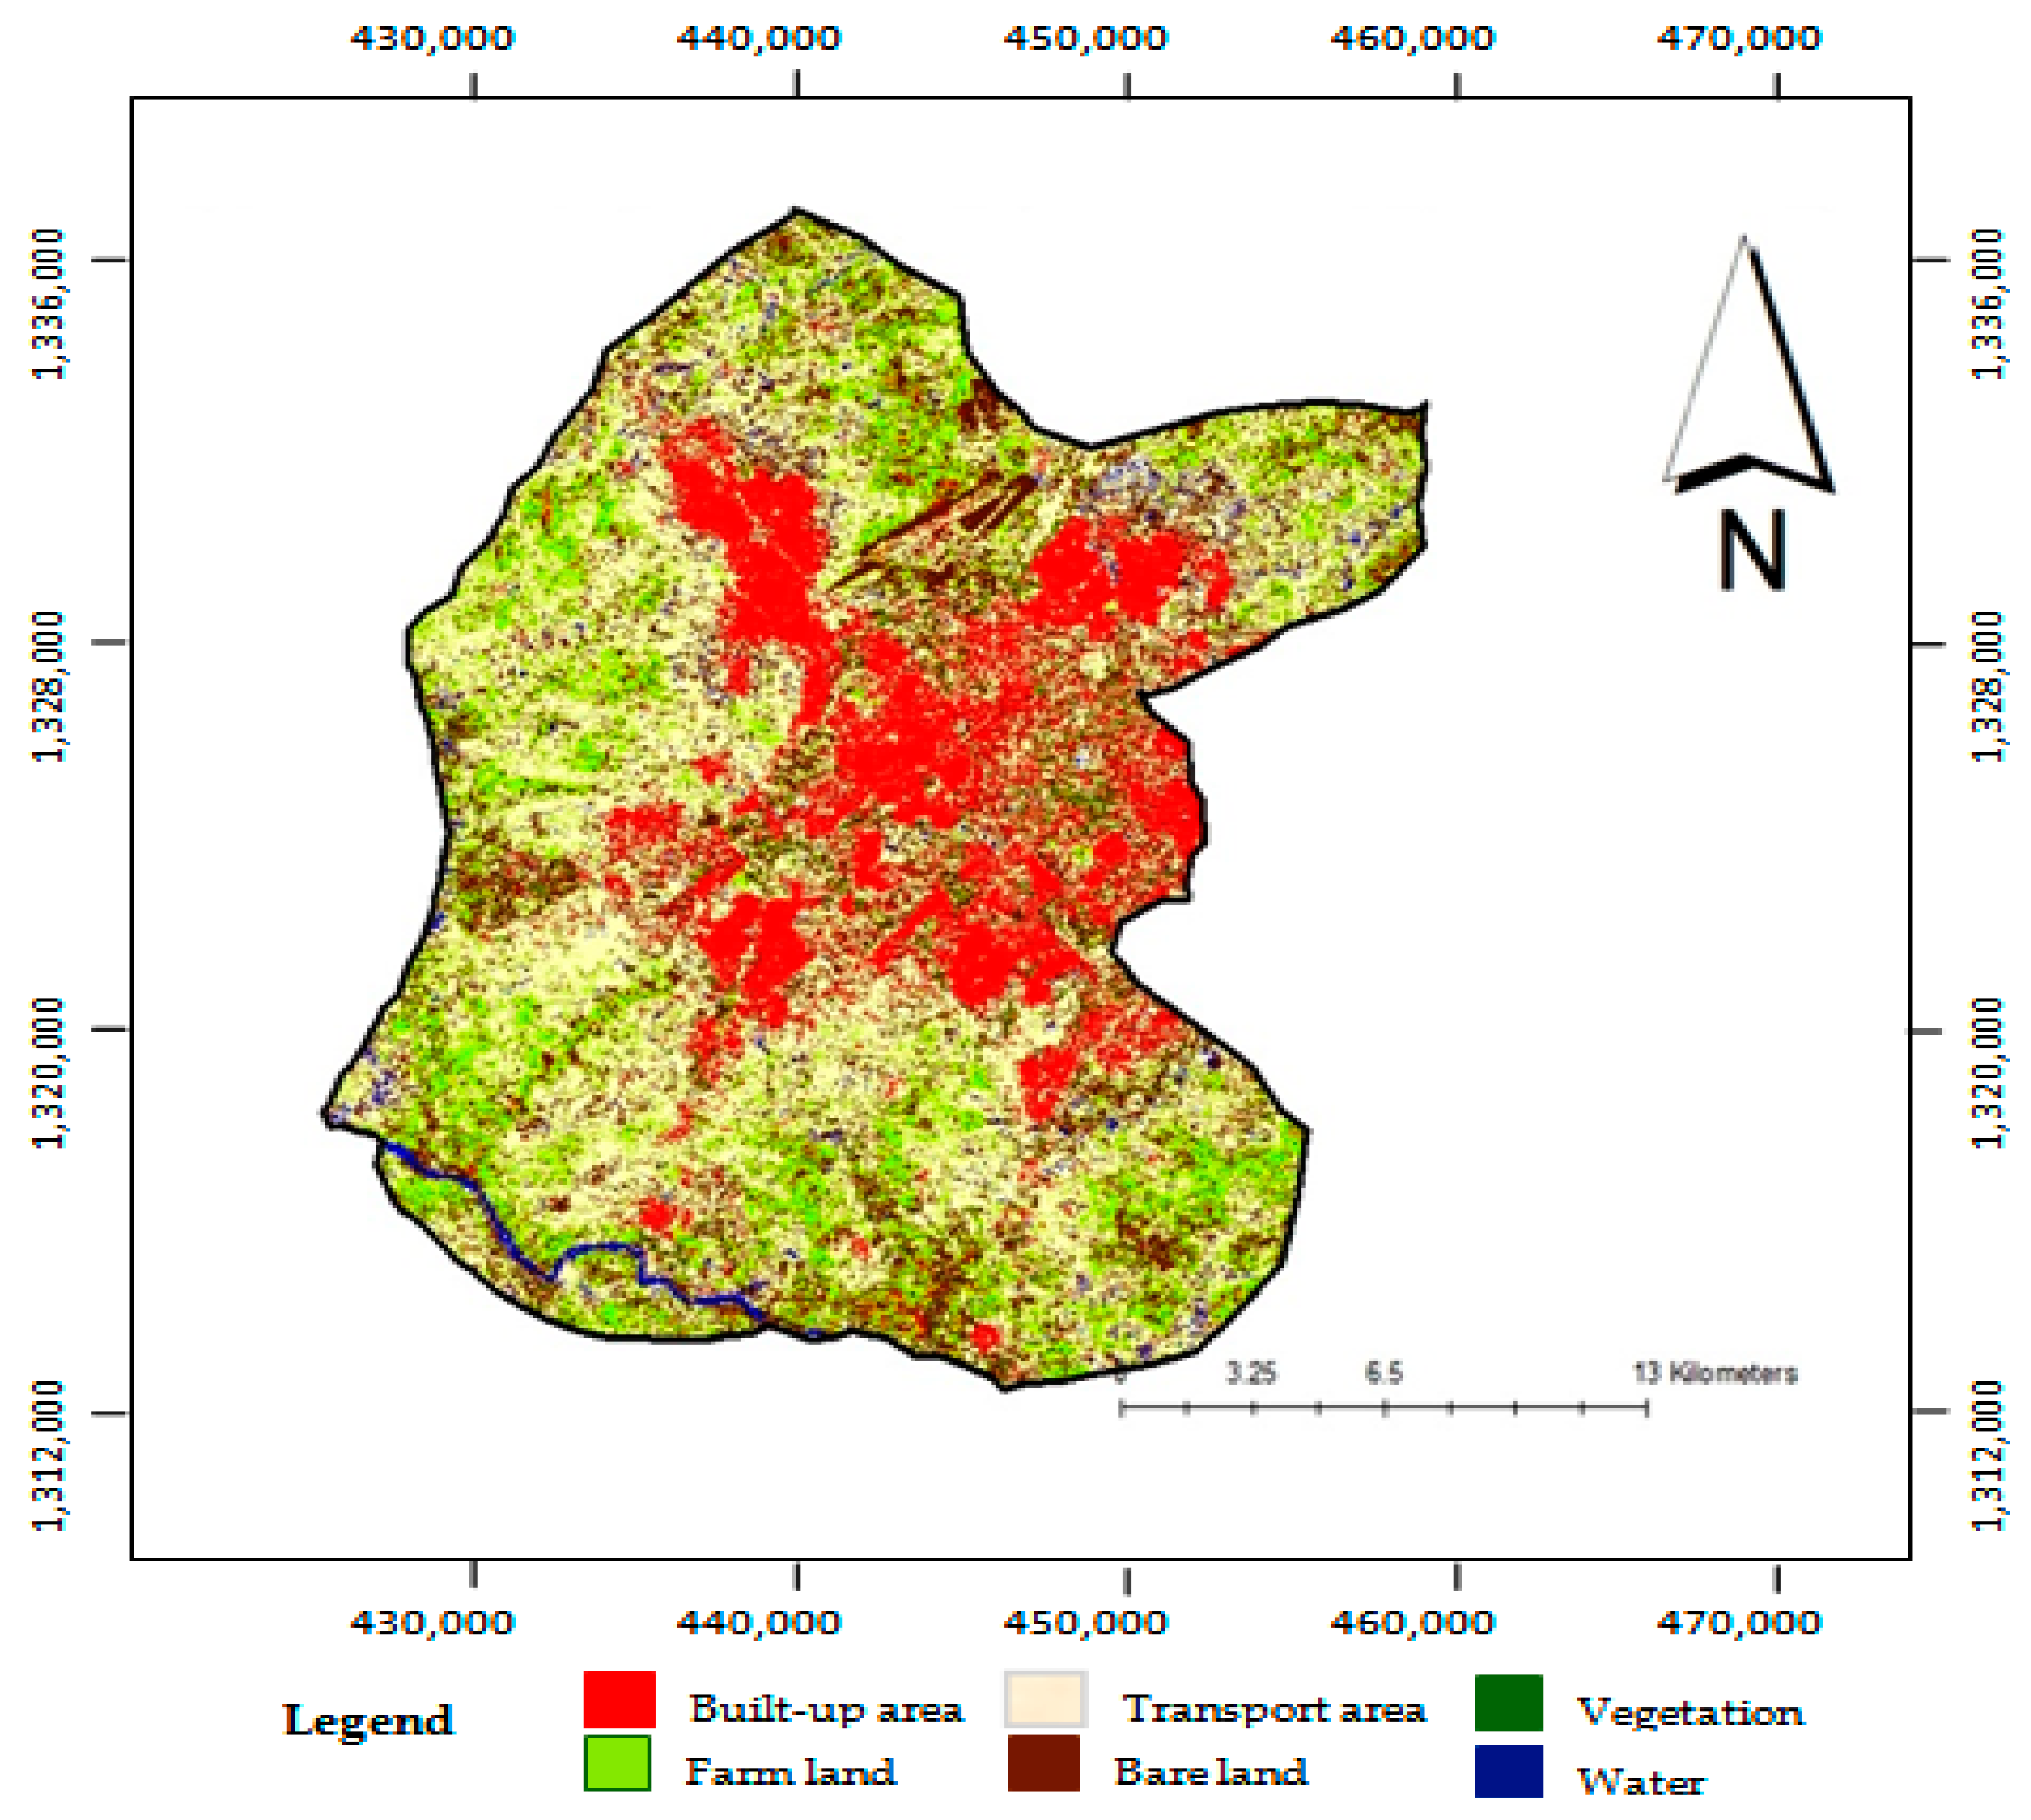
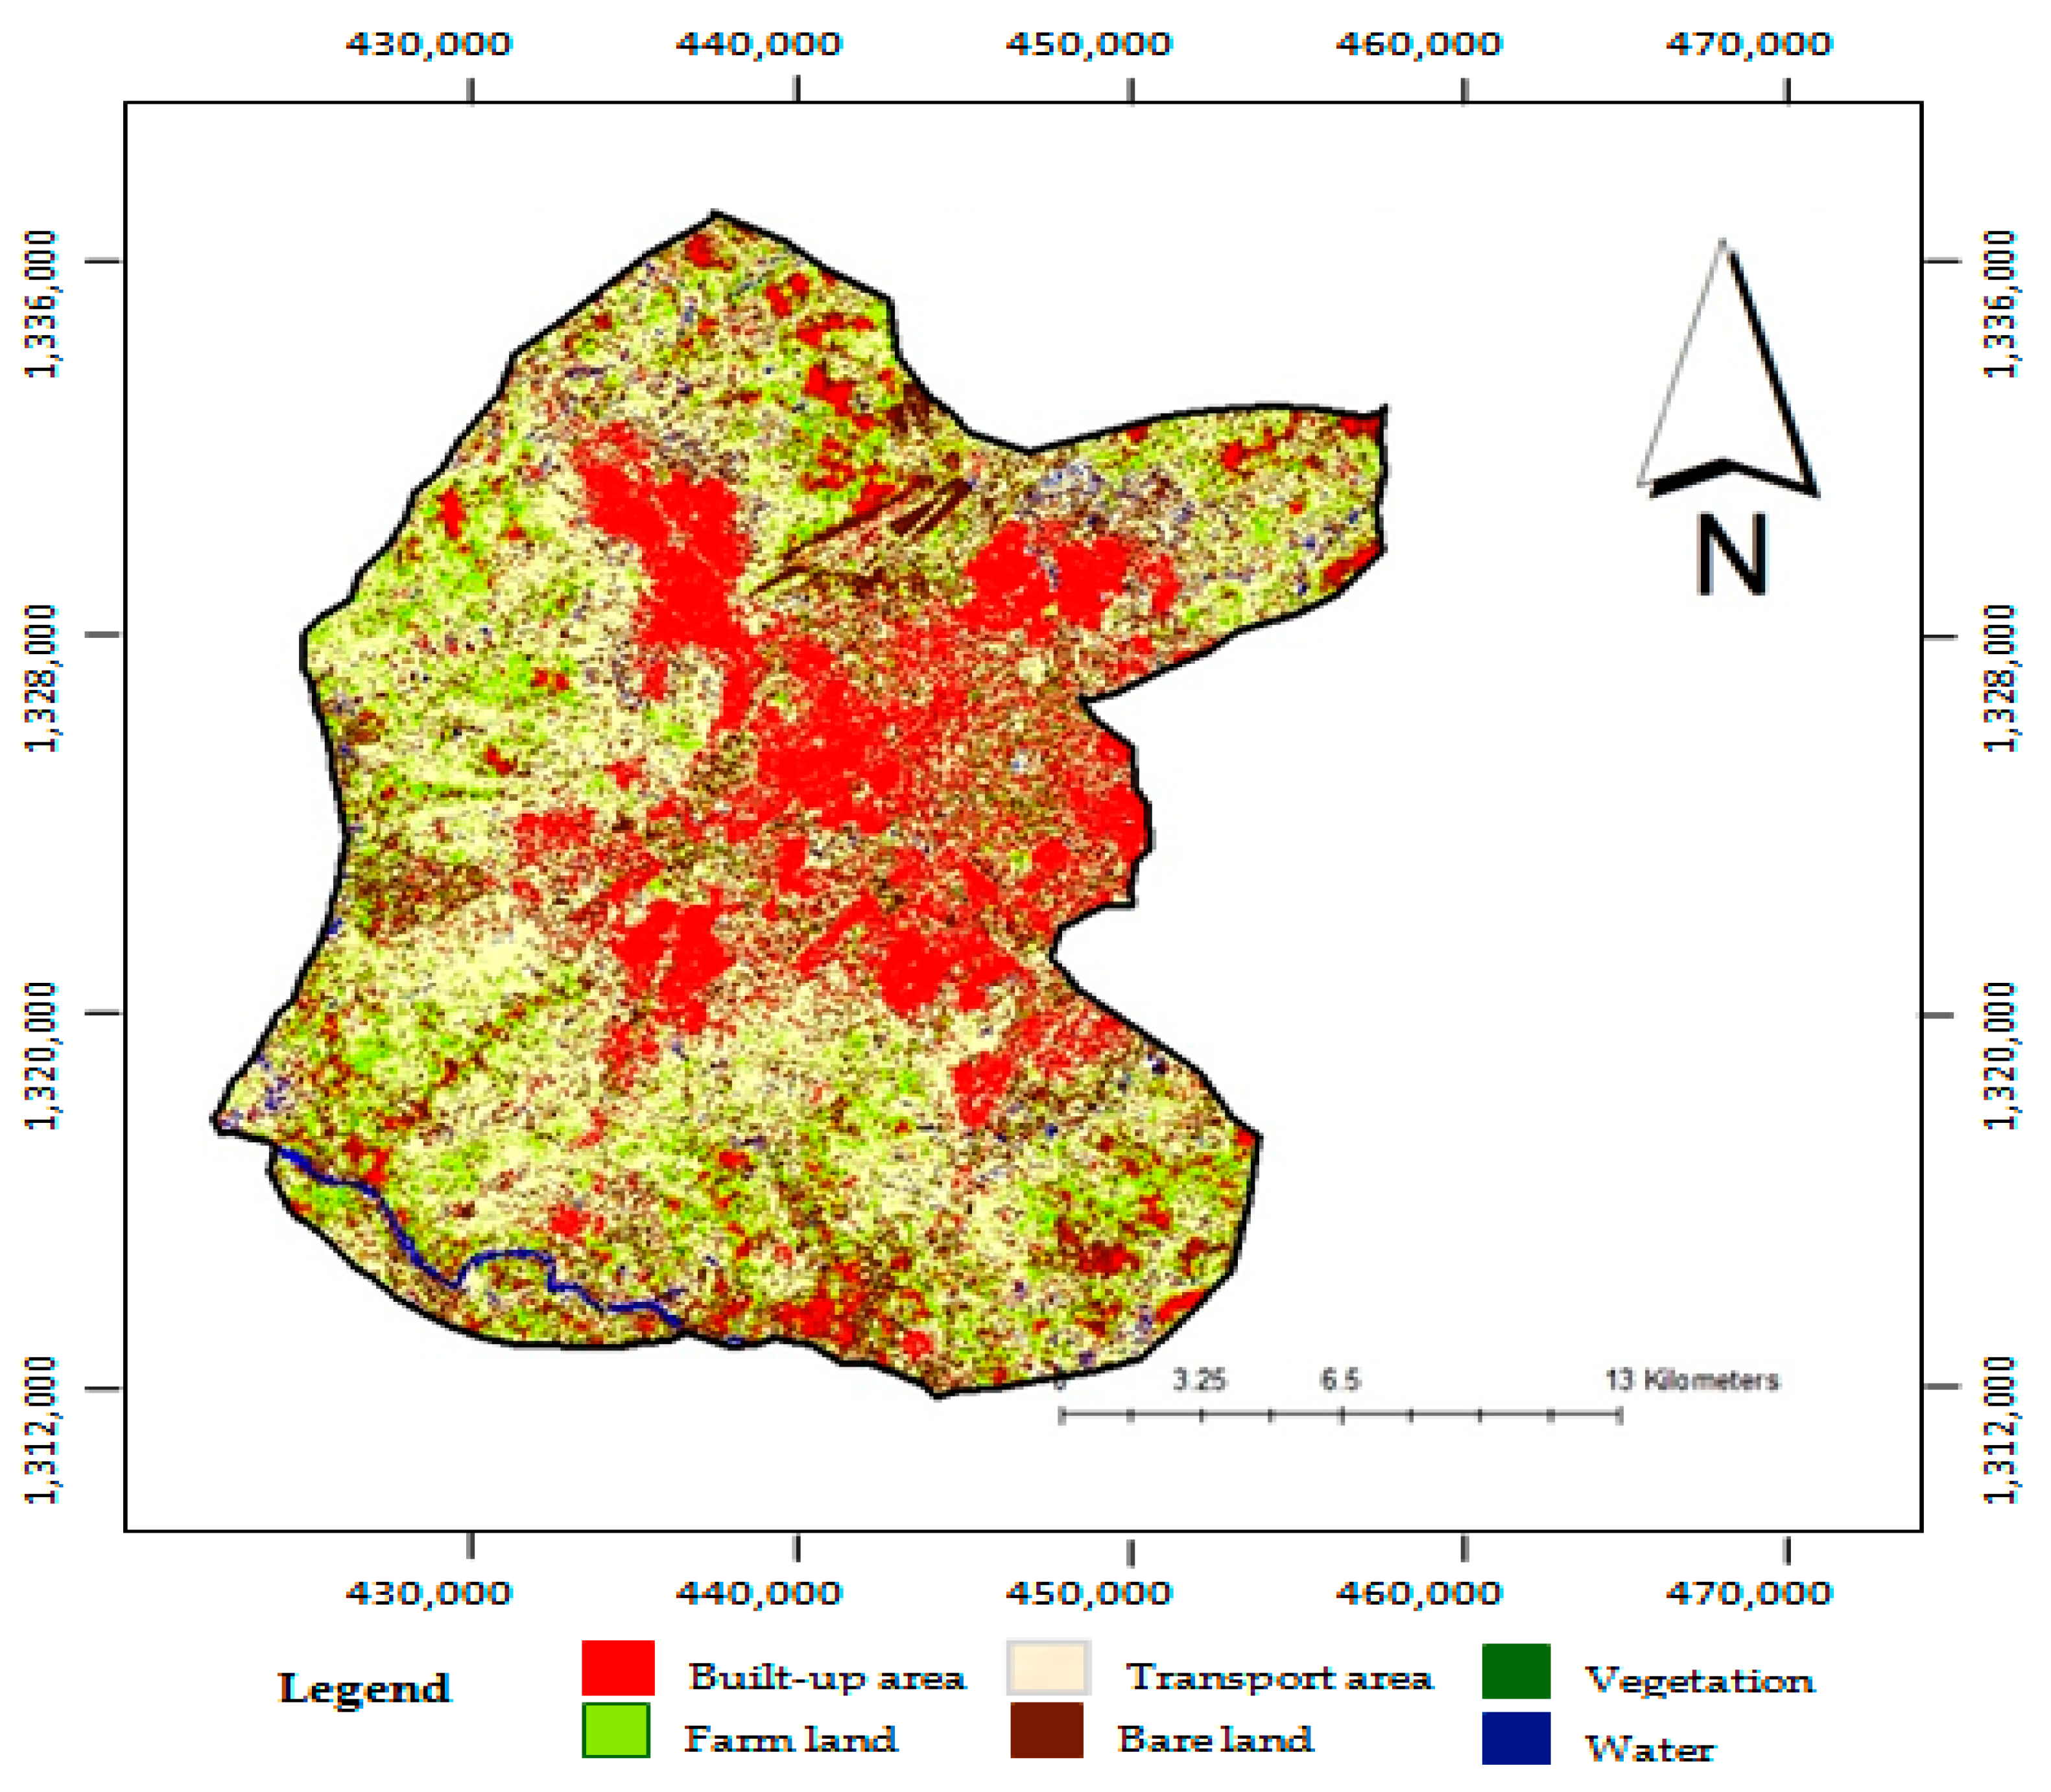
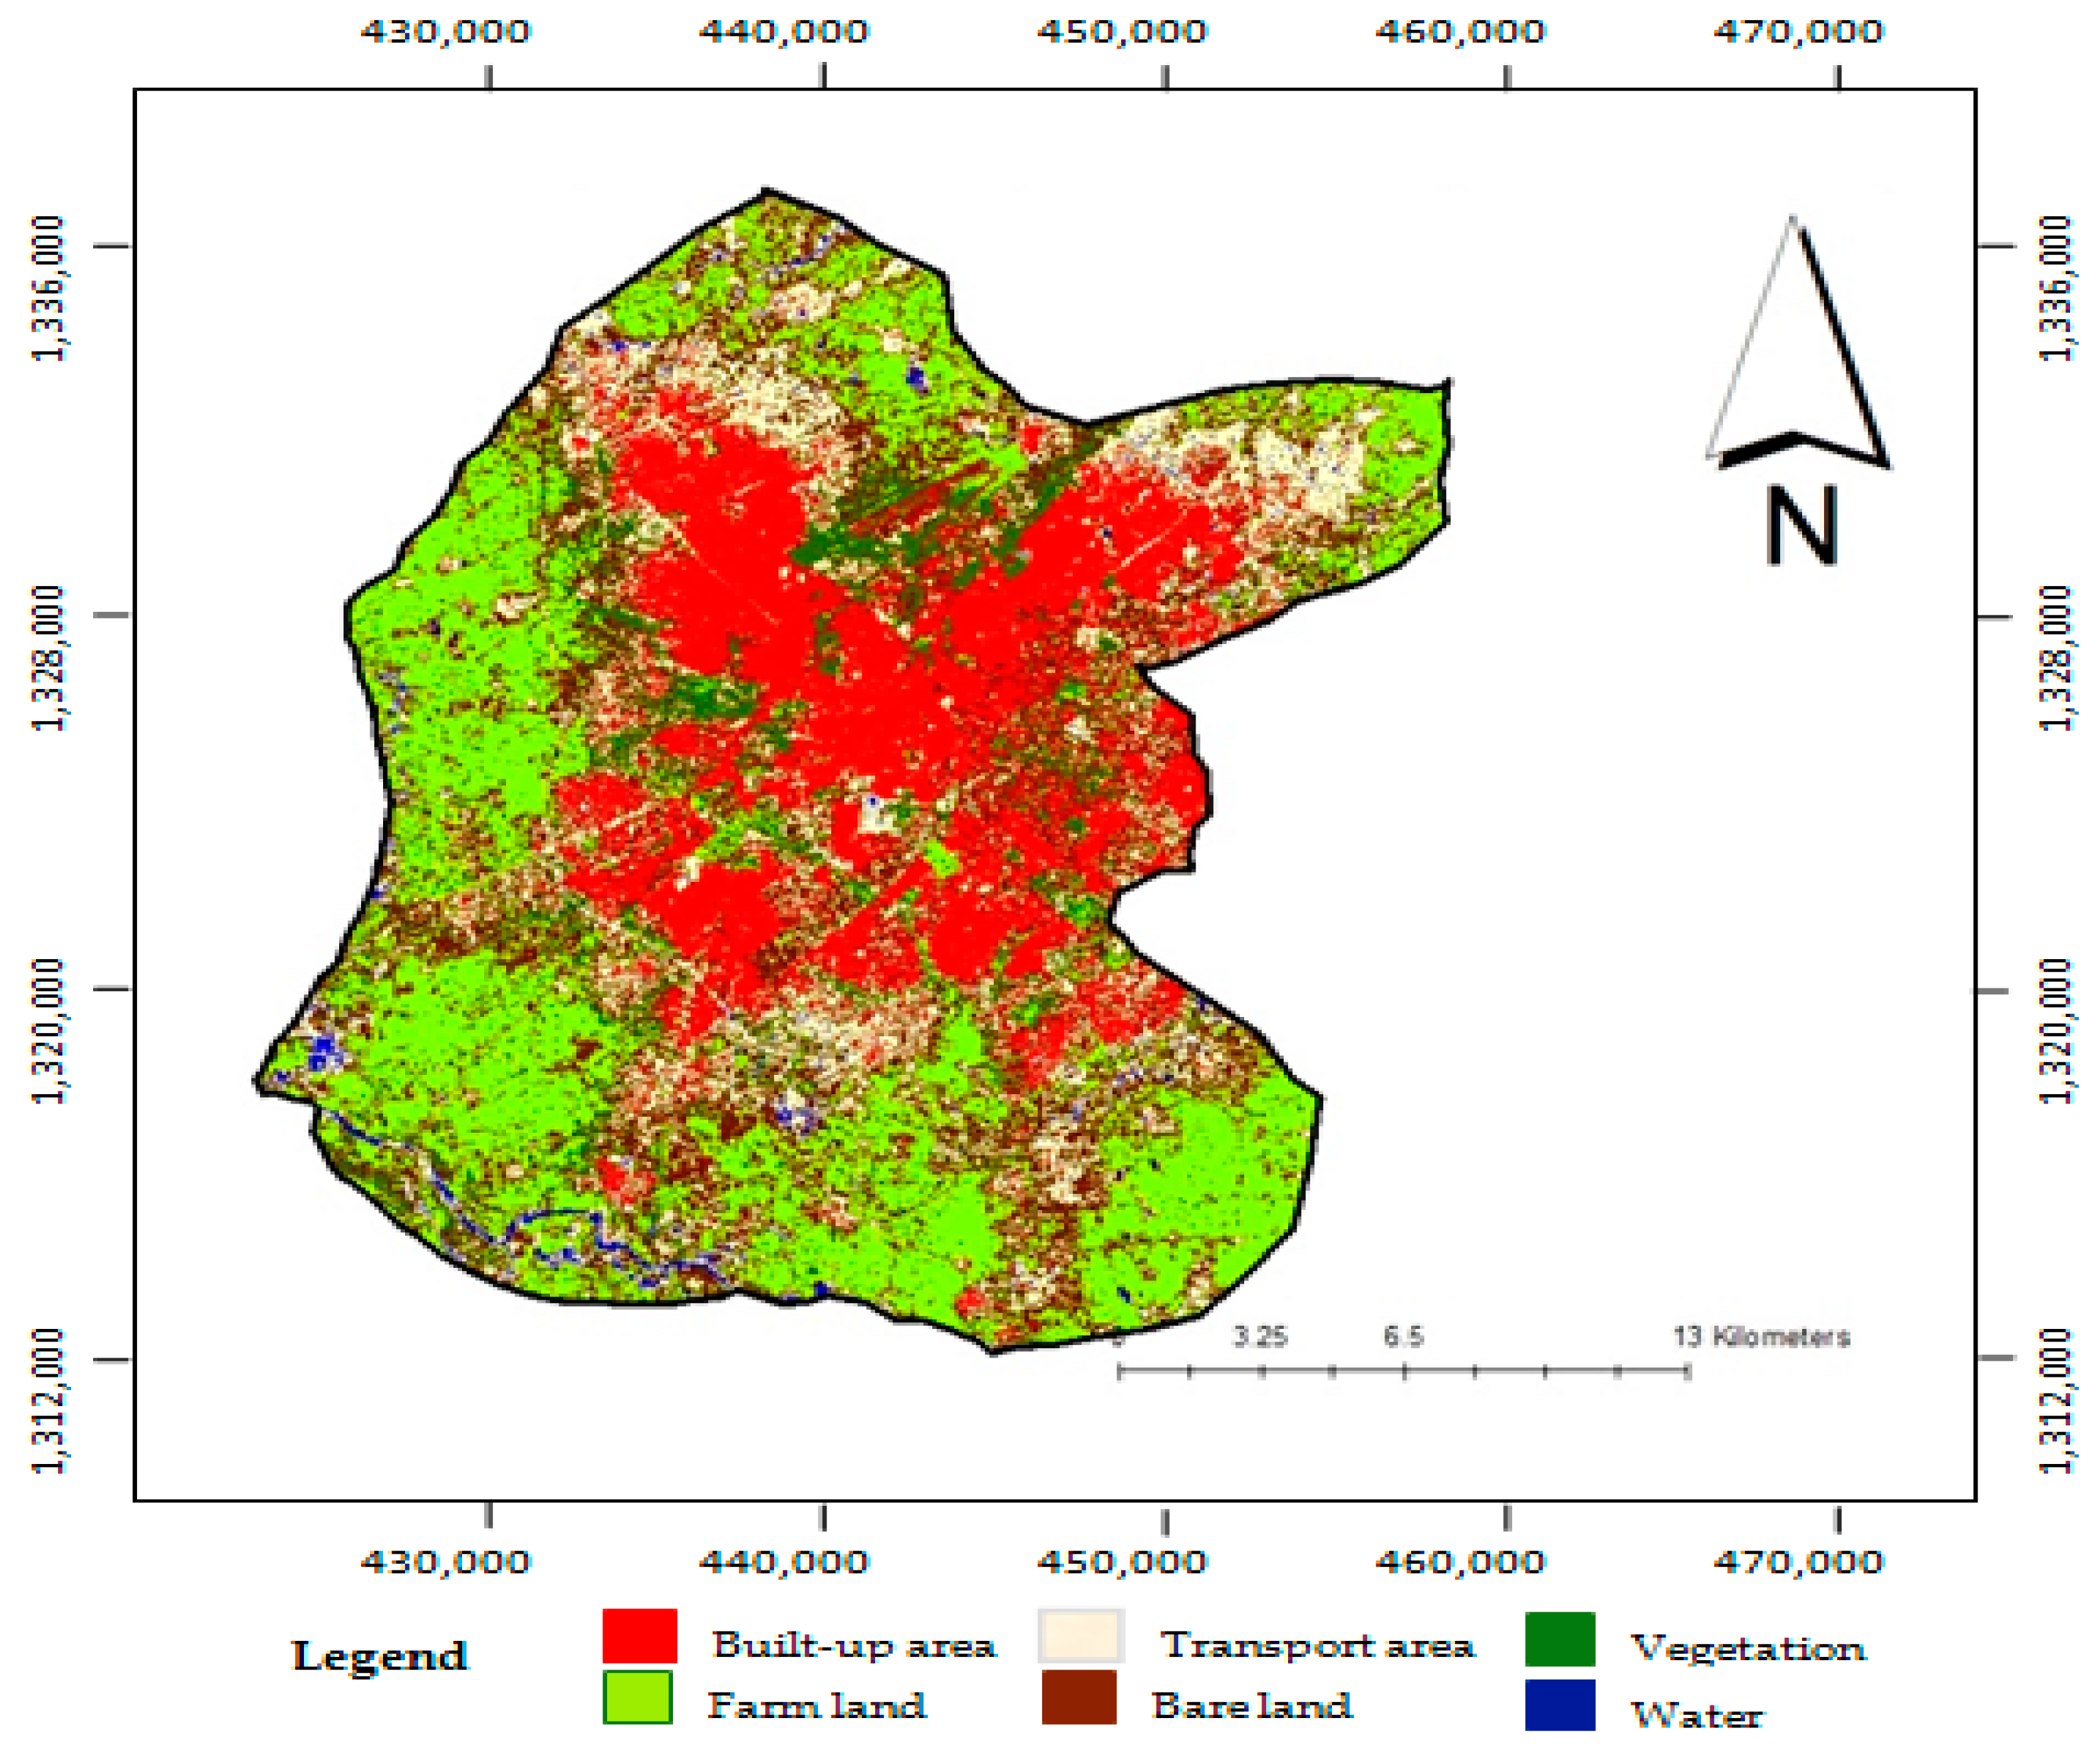
The algorithm also assumes that the data is normally distributed and predicts a high probability that a certain pixel is placed into the right class. Additionally, it has a high probability of quantifying minority groups within the appropriate pixel spectral class without being mis-classified into the larger LULC classes during model training. Landsat image classification was carried out using
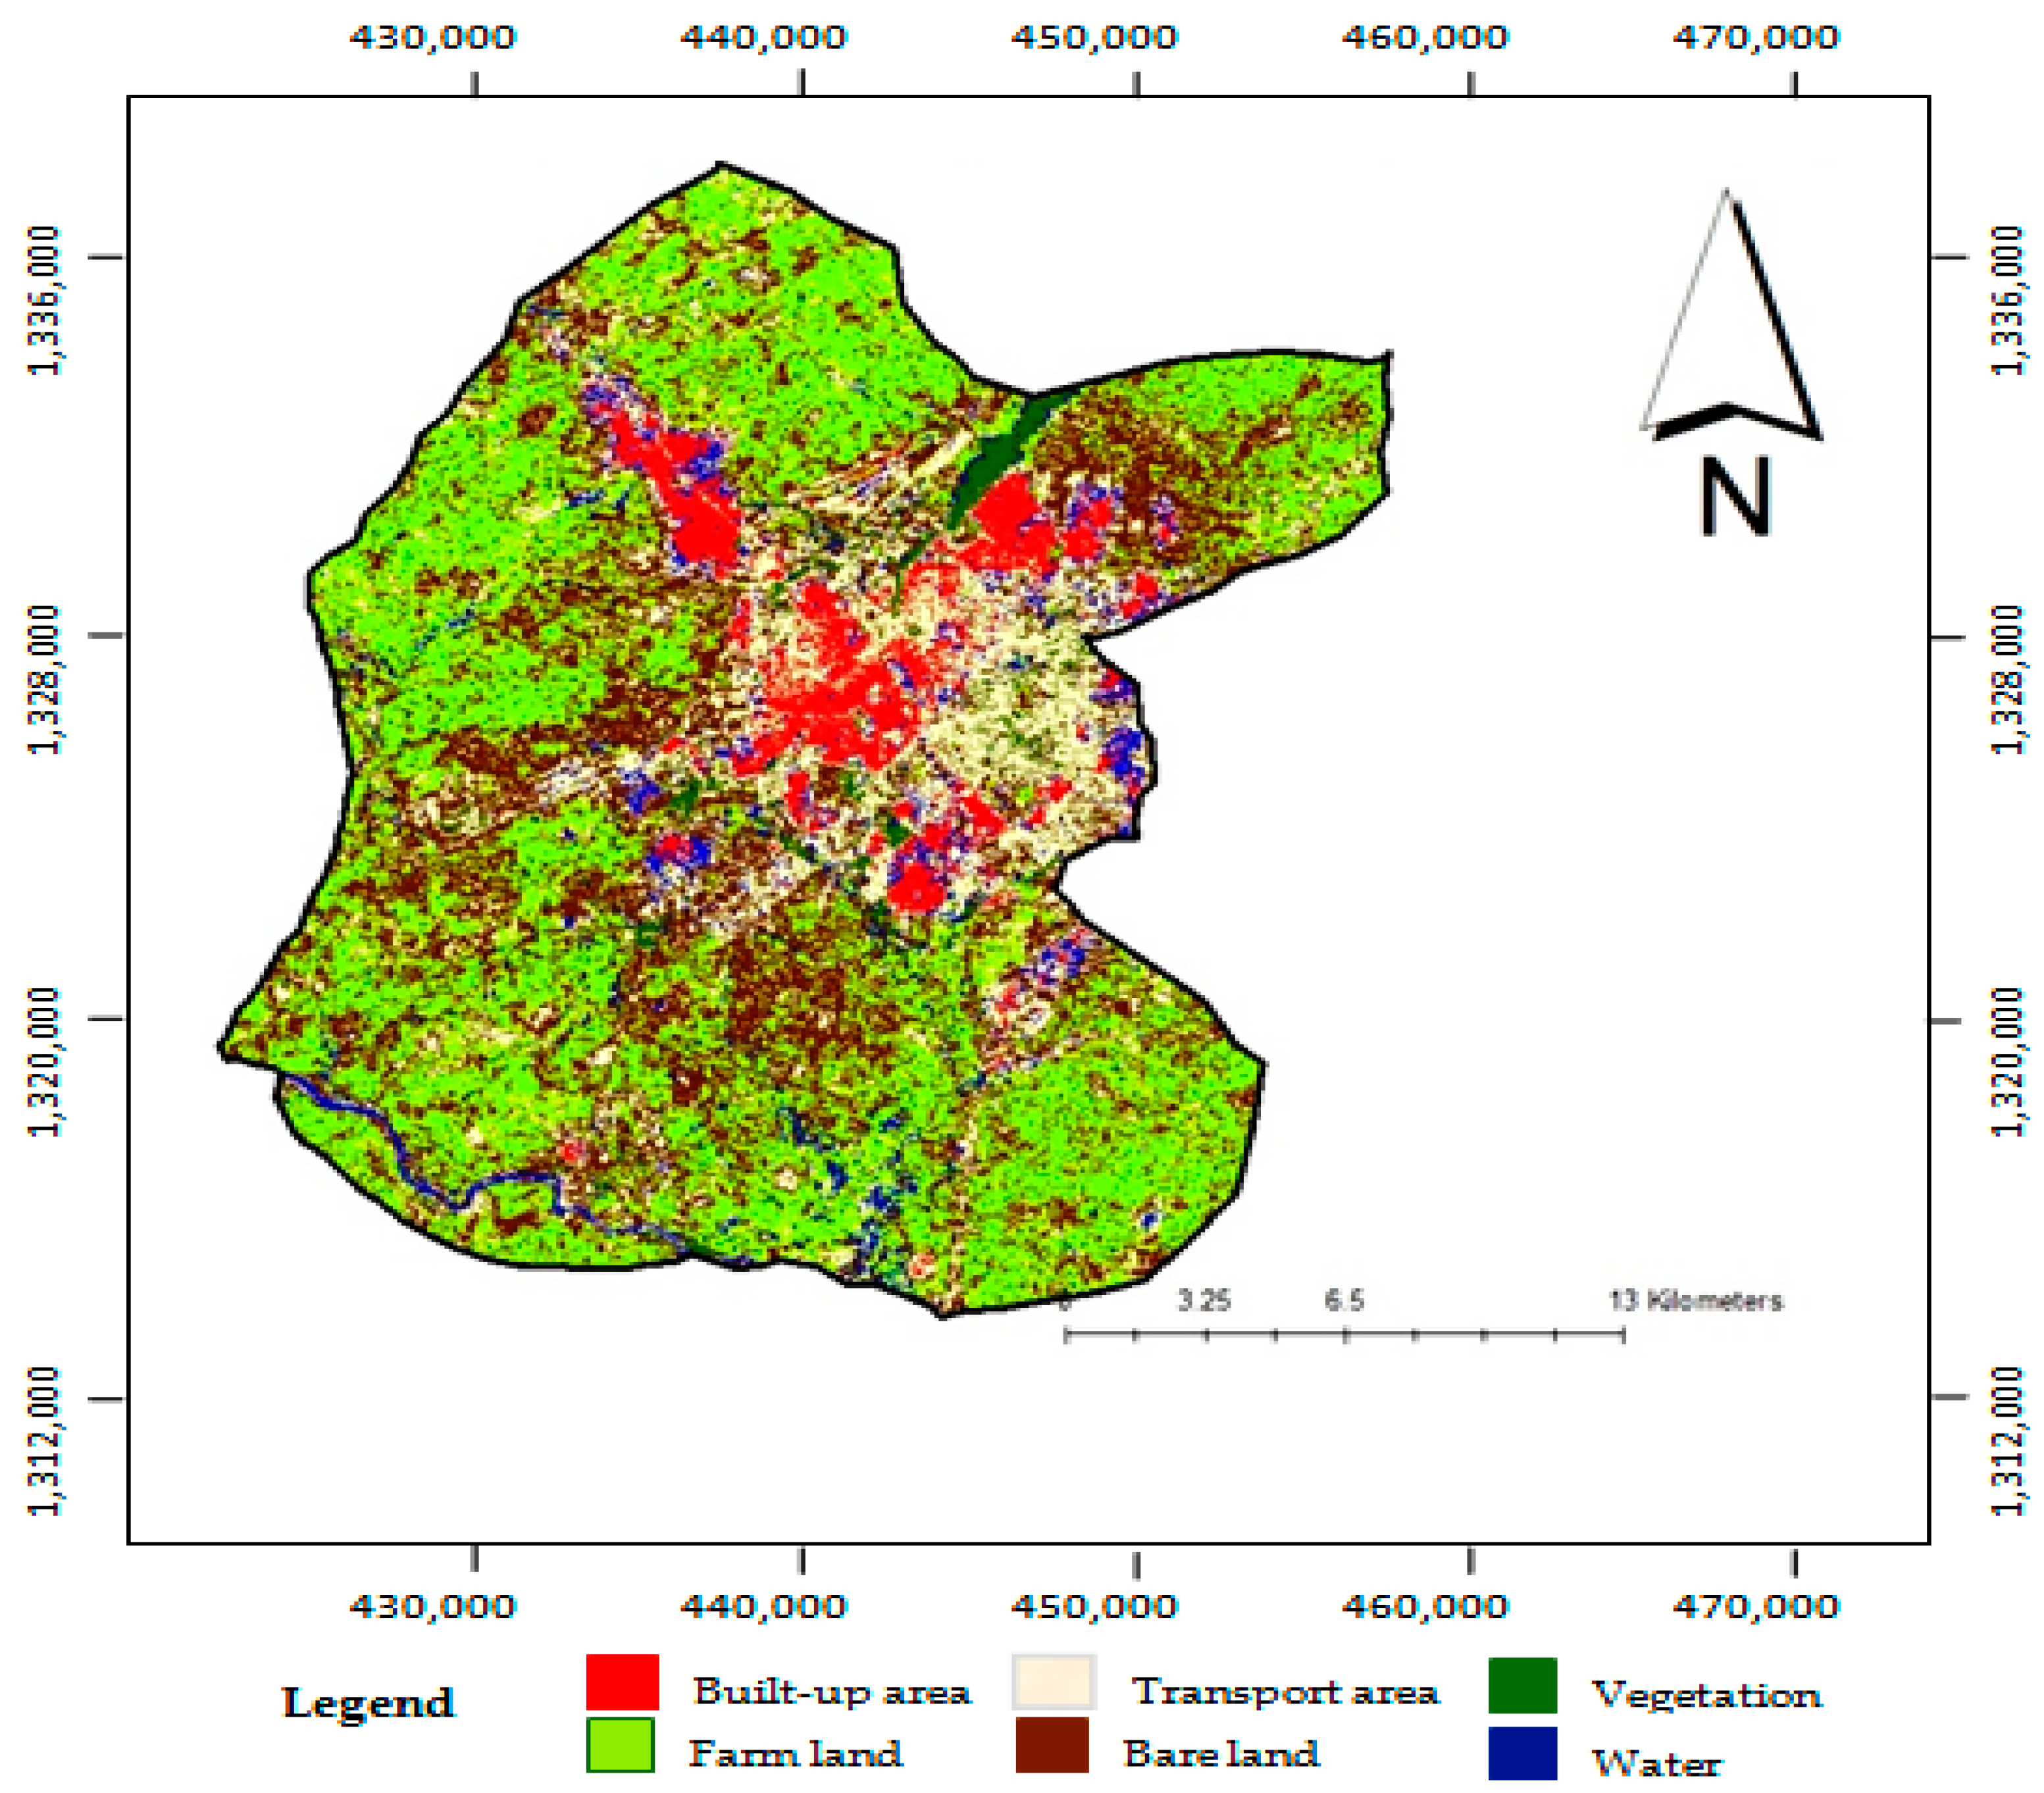
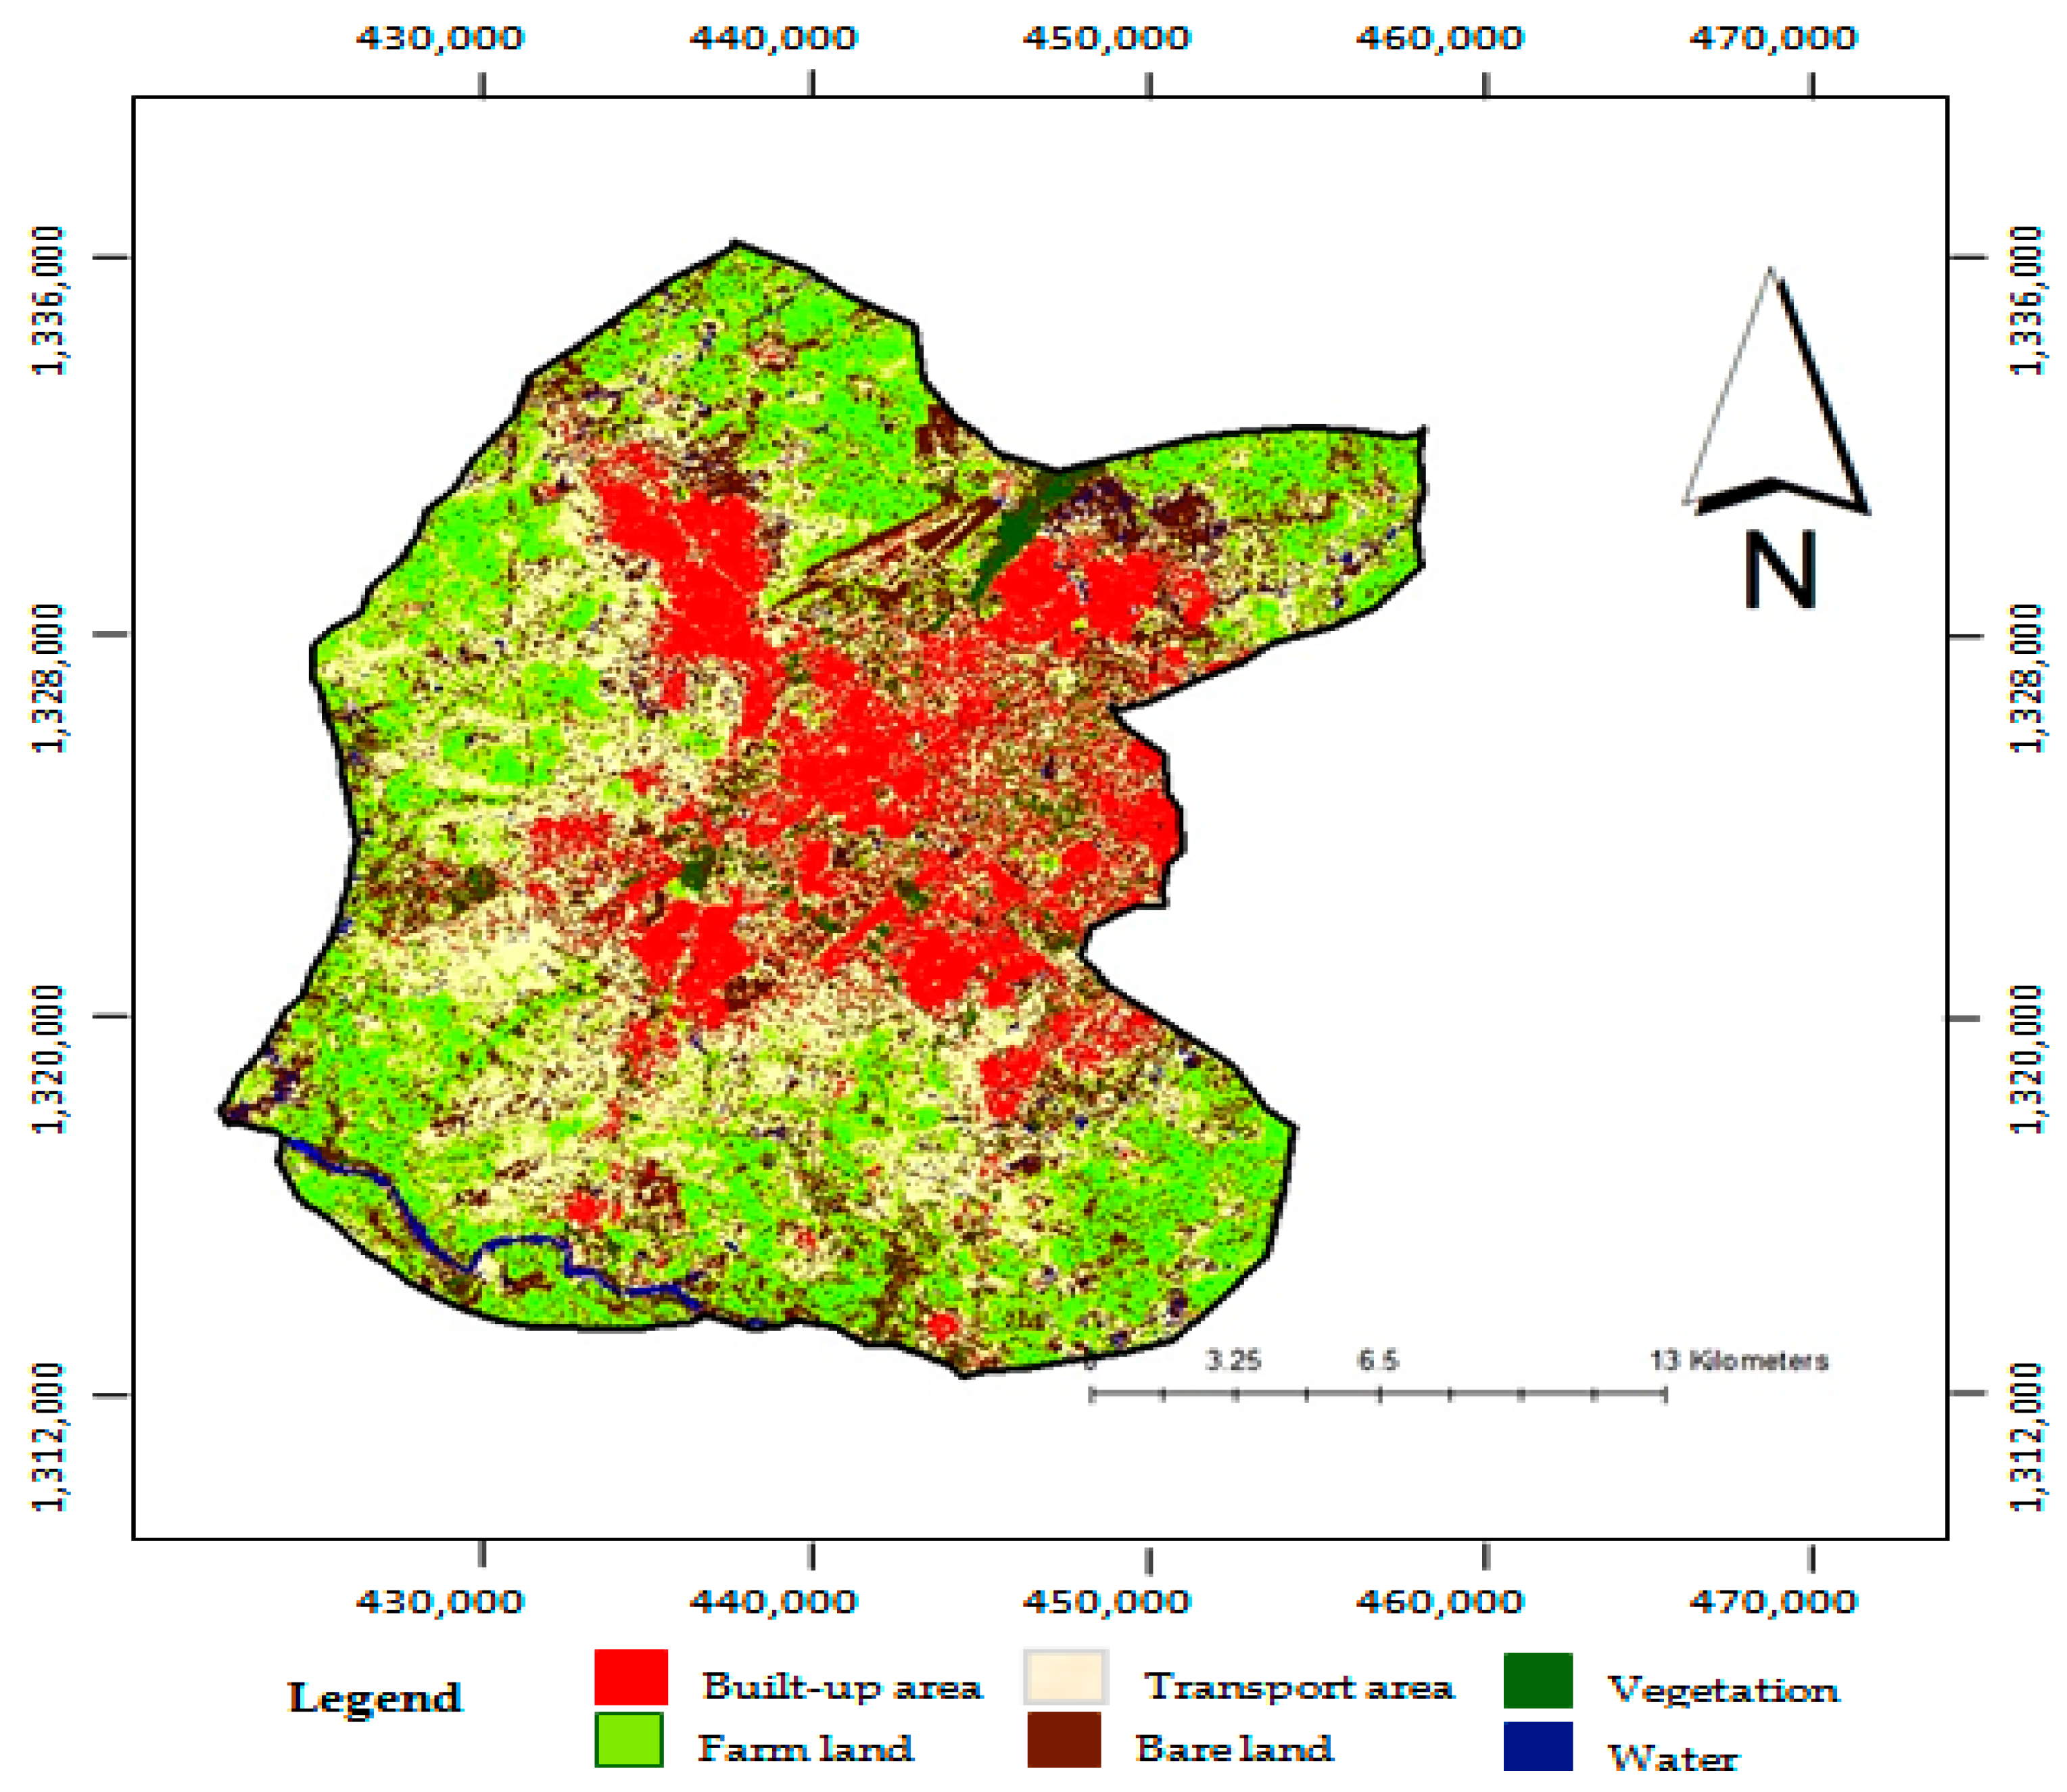
ARC-GIS 10.7 based on supervised classification of maximum likelihood where each pixel was classified into one of the following land use classes: transport infrastructure, built-up areas, farmland, vegetation, bare land and water. The distribution maps were classified into the six LULC categories including its spatial extent, based on the characteristics displayed directly in remote-sensing images (e.g., size, form, texture and hue etc.). Post-classification change detection was implemented in
IDRISI Selva 17 pro version software, which requires two classified images to be compared with details on pixel-based transition [
45].
Since there are uncertainties embedded in every stochastic process, a confusion matrix was created to check for classification and transition change detection accuracies. For instance, while the software user accuracy describes the likelihood that a pixel is actually a particular land-use class or landmark on the ground image, product accuracy defines the probability that a pixel (or raster) is correctly categorized.
A complete pixel-by-pixel ‘ground truth’ map is not feasible; it is important to provide a sufficient selection or sampling pixels to ensure robust accuracy assessment of a classification. An appropriate sampling methodology must be employed that satisfies statistical needs. The amount of reference pixels needed for accuracy evaluation depends on the minimum accuracy level required—e.g., 80% to 85% minimum accuracy is recommended by Jensen (1986) [
46].
We computed the optimal number of pixel sample points for overall classification accuracy evaluation at 85% minimum accuracy level. The number of appropriate sample points decreased as acceptable error increased. Using stratified random sampling, the total sample (204-pixel points in Equation (1)) was further delineated by thematic classification into at least 30 pixels per LULC class to avoid any form of bias. Van Genderen and Lock (1977) recommended a minimum of 20 observation pixels per referenced LULC class for 85% classification accuracy and 30% minimum pixel points per land-use class for 90% observed accuracy.
where
= Total number of sampled pixel points;
= Expected accuracy (%);
;
= 2 (standard normal deviate of 1.96 for 95% confidence level);
= allowable error (usually 5 to 10%)
To check for model reliability, we estimate the value for Cohen’s Kappa Index of Agreement
given by Equation (5). The approximate minimum value of 80% is a substantial agreement between simulated and actual data and an indication that the prediction model fits well [
47].
where
is the number of times there are relative agreements among the layers of raters;
is the hypothetical probability of agreement by chance.
Out of 204 selected training sites identified based on image recognition keys as ground-truthing points, 122-pixel points (60%) were used for training. Validation by Kappa reliability assessment checks was carried out based on 82-pixel points (40% ground reference). The general LULC map trends showed a variable rate of change between different LULC classes in the area of study.
2.4. Transition by Markov Chain Process
A Markov chain process could be defined as a process with changing sets of states, . The process changes from one state to another by scales called steps. We may scale the measure of state transition based on temporal time scales (t), whereby the current state () changes to another state () by likelihood transition probability (). If the case is otherwise, where the system remains in a stationary state (), then, the probability of that state is given by ().
The probability of a shift or conversion of land use from one state to another is dependent only in a set of discrete-time steps if the times are sequentially arranged such that the transition probability matrix is given by:
Empirical findings by researchers [
48,
49], suggested three basic conditions necessary for Equation (3) to converge: firstly,
, such that (
. Second, the assumption should hold that the transition probabilities remain unchanging. Thirdly, the Markov chains are regarded as a model of first order, which only makes the situation of the transient system contingent on the former. If we denote the transient phase time series as
and the initial period as T, Markov stochastic process theory may be used to calculate the state transition probabilities given from the initial state to the
state, as well as a stable state. Thus, Markov transition probability for
is given by the relationship:
where
m = number of columns or rows and the transition probability matrix at
stage is equal to the
power of the first-stage transition probability matrix.
2.5. Cellular Automata-Markov (CA-Markov) Prediction
The CA-Markov specifically uses the transition script in the Markov chain output analysis to apply a contiguity filter which allows creation of land-use characteristics from time-to-time. Based on initial state matrix
and
stage transition probability
, we can estimate transport infrastructure land area and indeed, other land-use transition in Kano metropolis by applying a Markov simulation model
in Equation (6):
5. Conclusions
The findings from the research revealed the following:
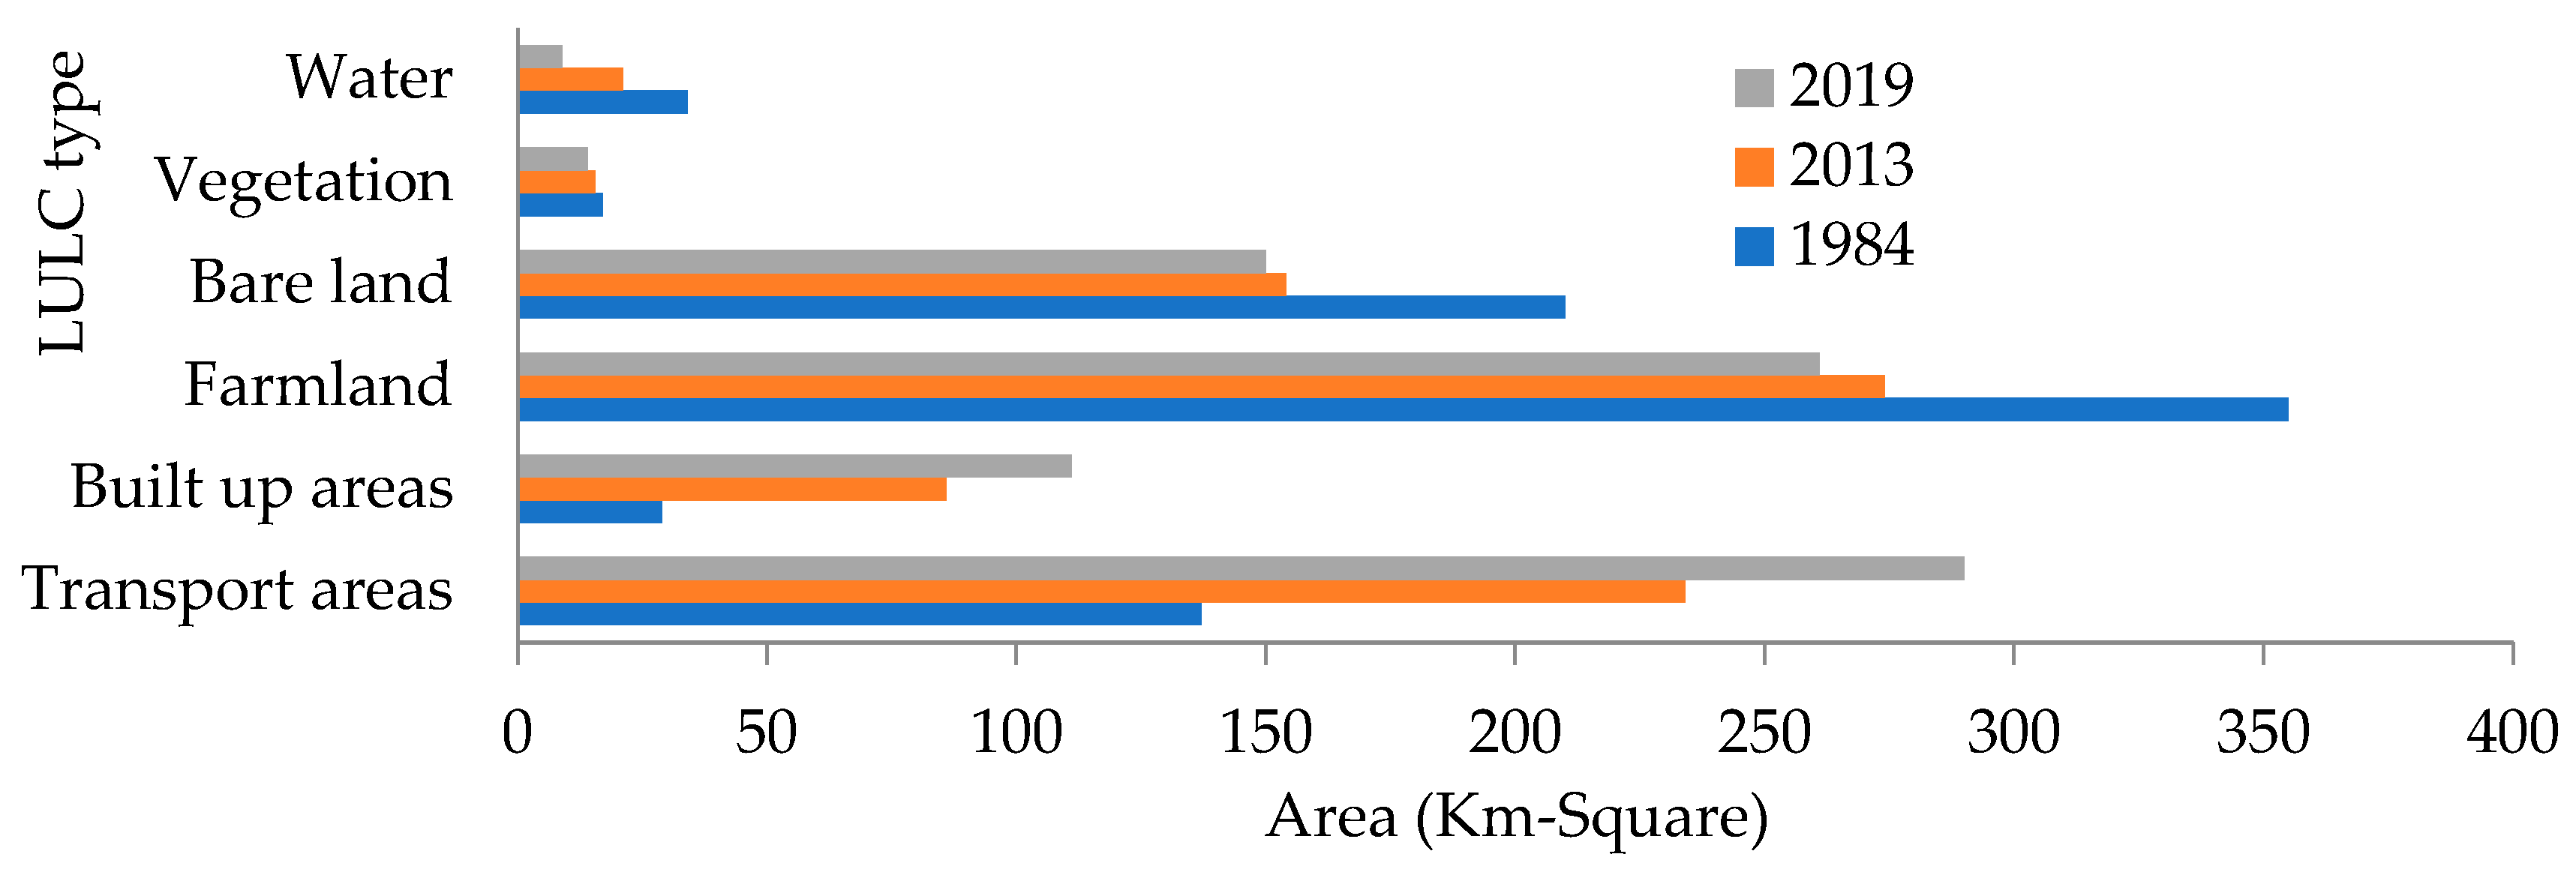
The research has shown that future LULC transition and transport infrastructure spatial demand can be easily predicted using GIS and CA-Markov. Knowledge of the factors driving LULC shift is very critical for precise future outcomes and weighted suitability maps of the MCE process. During the past decades from 1984–2019, urbanization has increased unsuitable LULC changes by exerting demands that aided the spatial transformation of the transport area and built environment, and depleted other land uses. The results of Kappa classification accuracies ranging from 85% to 88% are within the range of 80–85% suggested in the literature.
According to the predictive models of transport infrastructure and metropolitan built-up areas will respectively experience spatial expansion by 345 km2 and 410 km2 from 2019 to 2030. Following the same trend, the prediction estimated a further 140 km2 land area conversion for transport infrastructure and 155 km2 for built-up areas in 2050. These spatial figures established a strong connection between LULC changes and unsuitable urbanization growth, especially in transport systems and built-up areas. LULC losses of farmland, bare land, vegetation and water LULC dynamic transition over the temporal time series pose a significant threat to biodiversity, the climate and environmental disharmony in Kano City.
The Arc-GIS CA-Markov hybrid model is spatially explicit and well-integrated as a means of isolating transport spatial, temporal development of other infrastructure and provides alternative pathways quantitative track evolution of urban process. Over the last three decades (1984–2019) under study, the developmental practices adopted have culminated in fragmented land use in Nigerian cities. The research will serve as a guide for spatial-temporal monitoring and to explore a sustainable approach to improving the relationship between land use and demand for urban transport facilities in many cities.
Although, the forecast of increasing transportation infrastructure could improve urban mobility frustration, congestion, and quality of life, sustained urbanization and population growths are likely to exacerbate the problem. While it is evident that Kano’s population and urbanization booms will continue to grow, exploring the various dimensions of integrated urban planning, sustainable transportation, transport demand management and inter-regional development cooperation could stem down urbanization and improve the wellbeing of urban society.
It is proposed that these future research studies use more comprehensive socioeconomic and environmental variables to enhance understanding of the causes, patterns and regional demographic influences to effectively guide transport and urban planning. Further studies may also attempt to determine possible changes in the intensification of land use resulting from changes in management of land-use resources.


