Abstract
The first of the research objectives discussed in this article was to analyze the differences related to the valuation of particular factors influencing the purchase process in the smartphone industry, expressed by respondents with different sensitivity and environmental awareness, as well as the assessment of their knowledge about the impact of smartphones on the natural environment. The second objective of the research was to determine whether the level of environmental sensitivity, awareness and knowledge about the impact of smartphones on the environment has a statistically significant influence on the respondents’ choice of smartphone brand. The survey was conducted using an on-line questionnaire, distributed by a specialized research agency on a representative sample of over 1000 Polish residents. In order to identify the various customers clusters, the expectation-maximization algorithm and the v-fold cross-validation were used. Additionally, in order to analyze the significance level of differences between clusters the nonparametric Mann-Whitney U-test was carried out. The results show unequivocally that people with a different approach to ecological issues demonstrate statistically significant differences in their purchasing behaviors in the smartphone industry. Furthermore, it was noticed that in the case of comparing some smartphones brands, there is a statistically confirmed difference in the environmental sensitivity and awareness of the customers who use them. Moreover, the research has shown that in Polish customers’ consciousness smartphones are mistakenly considered to be relatively safe and environmentally friendly products.
1. Introduction
Natural resource security and environmental sustainability are today at stake amid growing material flow through trade and domestic material consumption to meet population demand [1]. Many studies carried out during last decade affirm that the amount of damage production activities had imposed on the environment (e.g., pollution, natural resources overconsumption) in the course of rapid growth is unquestionable see: [2,3,4,5]. Initial arguments on environmental sustainability in extant literature divulge that the triad relationship of social, economic and environmental indicators is essential to understanding the global status of sustainability [6].
Authors believe that looking at environmental sustainability from both social and business perspectives requires asking two fundamental questions:
- How can the impact of different products or services on natural environment be calculated?
- How important is the level of impact of different products or services on natural environment for customers and to what extent it is determining their purchasing behaviors on the market?
In order to solve those problems researchers first decided to introduce the concept of “carbon footprint”. The “carbon footprint” term was first developed in the 1990s, deriving from the concept of “ecological footprint” [7], but referring to the measurement of the climate change impacts. The concept since 2005 has begun to be publicized independently, and refers to the impact of human activities on the environment and especially on the climatic conditions, in terms of greenhouse gases (GHG) emissions (or briefly called “carbon emissions”) [8]. According to WHO, a carbon footprint is “…a measure of the impact your activities have on the amount of carbon dioxide (CO2) produced through the burning of fossil fuels and is expressed as a weight of CO2 emissions produced in tonnes…” [9]. Unfortunately, in most cases the total carbon footprint cannot be calculated exactly and directly because of both inadequate knowledge and data about the complex interactions occurring between contributing processes engaged in production and usage of the analyzed product [10]. For this reason, Wright, Kemp, and Williams proposed the following, expanded definition of a carbon footprint: “A measure of the total amount of carbon dioxide (CO2) and methane (CH4) emissions of a defined population, system or activity, considering all relevant sources, sinks and storage within the spatial and temporal boundary of the population, system or activity of interest…” [11]. In the literature one can find many other definitions of carbon footprint which are focusing on more specific subjects for example: [12,13,14]. Wiedmann et al. have proposed the mostly recognized definition of a product carbon footprint: “…the carbon footprint of a product is a measure of the total amount of carbon dioxide emissions directly and indirectly caused by an activity or accumulated over the life stages of a product…” [15].
The concept of carbon footprinting has permeated and is being commercialized in all the areas of life and economy, but there is still little coherence in calculations of carbon footprints among the studies. There are disagreements in the selection of gases, and the order of emissions to be covered in footprint calculations. Standards of greenhouse gas accounting are the common resources used in footprint calculations, although there is no mandatory provision of footprint verification [16].
Taking it into consideration and referring to the main area of interest of the article, authors decide to show some relevant research outcomes about the carbon footprint in the smartphone industry. No one can argue that PCs, smartphones, and other computing devices have not changed the world and our day-to-day lives in an incredible and irreversible ways. However, unfortunately, behind this innovative 21st-century technology lie very outdated supply chain and manufacturing processes still mostly reliant on 19th-century, non-renewable sources of energy, dangerous mining practices, hazardous chemicals, and poorly designed products that dangerously drive consumption of the Earth’s resources. Estimated GHG emissions (both own operations and supply chain) for the 17 of the world’s leading consumer electronics companies were more than 103 million metric tons of Co2e in 2016, or roughly the same level emissions for the Czech Republic in one year [17].
Research conducted by Merchant [18] shows that smartphones should be placed among the most resource intensive personal device products on the planet – miners must dig through more than 30 kilos of rock to obtain the 100 or less grams of minerals used during a typical smartphone production process. What is more, continuous increase in smartphone complexity demands each year greater amounts of energy to produce each device, with 70 to 80% of the energy footprint of personal electronic like smartphones occurring during the main manufacturing phase [19]. In addition to this, recent research also reveals the problem of the durability of modern smartphones. According to iFixit (the US-based repair company which conducts repairability assessments of leading electronic devices) in the past years many companies introduced increasingly less repairable and upgradable products, including Samsung’s and LG’s smartphones [20].
Ericsson Company in 2018 annual report suggest that by the end of 2020, the number of people who owned a smartphone is expected to climb to over 6 billion, more than 70% of global population [21]. This rapid growth rate accompanied with abovementioned problems with environmental sustainability of the smartphone industry shows the urgency of fixing the flaws of the current take-make-waste business model employed by smartphone manufacturers [22].
The concept of Smartphone buyers’ purchasing behavior was the main topic of numerous studies in which a variety of different important factors affecting and determining that process had been analyzed. Nowadays, there are many high technology features of smartphones in the market, therefore different people will choose different features of smartphones that can meet with their needs and desires [23]. For example, according to Ling, Hwang and Salvendy [24] there are five design characteristics of mobile phone that are preferred by consumers such as camera, color screen, voice activated dialing, internet browsing and wireless connectivity. Different research results were obtained by Mokhis and Yakoop [25], who determined seven main components which, according to researchers, depict smartphone buying behavior: inventive and innovative highlighted features, picture quality, value for money, durability, solidness and compatibility, media impact and post sales services. The study conducted by Kim, Proctor and Salvendy [26] showed that design, customer needs and innovativeness in the cell phones were the most important factors rated by the users. In another study, Harris, Brookshire and Chin [27] revealed that the properties of the mobile phones (quality of mobile phone, design/aesthetic, ease of use, extra features), brand (brand loyalty, strong and reliable image), service (post sale service and warranty options) and price are considered to be the most vital factors in smartphones purchasing process.
A different approach to the research of purchase behavior in the smartphone industry has been presented by Tosell et al. [28], who collected data for a specific age group of young consumers (under 18 years old). The authors found that the adaptability and usage was the most vital component of the device and these was mostly perceived by the respondents through the smartphone personalization attitude. Chen, Huang and Chou [29] had made a detailed study on customizations of mobile phones. Authors had found that text messages, battery contact, software design and display size need a very high level of customization in manufacturing of mobile phones in order to obtain the significant benchmark advantage on the market. In addition to this, Ibrahim et al. [30] have deduced that while purchasing mobile phones, the young customers in the society are mostly influenced by celebrity endorsement, frequency of advertisement, discount offers, word of mouth publicity spread through friends, family and relatives.
Based on the study done by the Ley-Yee et al., [31] consumers will look more to software rather than hardware while purchasing the smartphone. Authors define the hardware of the smartphone as the surface of device that can be physically touched such as body of the smartphone, size, weight, color or design, meanwhile software includes computer programs, procedure and documentation.
Despite the numerous studies describing buyers’ purchasing behavior in the smartphone industry, authors could not find in the scientific literature studies which will mainly focus on the ecological features of the smartphone and their importance for the analyzed process.
The vital question is whether investing in pro-environmental activities and manufacturing processes is profitable and economically rationale from the smartphone market and business perspective. In other words, do customer demands of smartphone producers change their business paradigm in the field of environmental sustainability and to what extent are ecology and environmental issues important for smartphone clients? In order to be able to answer to the above-mentioned questions, authors decided to examine in the study the following research variables:
- (a)
- the level of the respondents’ environmental sensibility (in survey described in the scale from 1—“I am not interested in ecological issues”; to 10—“I am very interested in ecological issues”);
- (b)
- the influence of the customers’ environmental awareness on the purchasing process (in survey described in the scale from 1—“during the purchasing process I am not taking into consideration the ecological aspects of the products”; to 10—“during the purchasing process I am taking very seriously into consideration the ecological aspects of the products”);
- (c)
- the level of customers’ ecological knowledge about the smartphone industry and products (in the survey researchers examine the respondents opinion about the level of carbon footprint left by smartphones on the scale from 1—“very low, environmentally friendly products”; to 10—“very high, environmentally harmful products”).
In the article, authors have decided to examine the influence of the above-described factors (customers’ environmental sensibility and awareness as well as their level of ecological knowledge) on the purchase decision-making process in the smartphone industry.
2. Materials and Methods
2.1. The Research Subject
The research area described in this article focused on the smartphone industry. Within the framework of the conducted research authors decided to solve three fundamental research problems:
- Are the respondents’ level of environmental sensitivity, as well as their awareness of the “ecological” nature of products during the purchase processes, statistically significantly differentiate in a given sample? How many statistically separated groups can the investigated community be divided into in the context of such levels of sensitivity, interest and awareness?
- Do the individual clusters identified in the research (distinguished due to the assessment of the abovementioned problem) differ statistically significantly in the assessment of the importance of the analyzed factors influencing the purchase process in the smartphone industry (all factors had been divided by the authors into 4 particular groups: economic, image, technical and environmental)?
- Does the respondents’ choice of the particular smartphone brand correlate with their different opinions about their level of environmental sensitivity and awareness as well as knowledge about the impact of smartphones on the environment?
2.2. The Research Tool
The survey was conducted with use of a standardized online questionnaire, which consisted of the following parts:
- (a)
- three demographical questions: gender, age and place of residence;
- (b)
- five questions about smartphone usage in terms of frequency and reasons for product changes, length of use, preferred brands and market awareness;
- (c)
- eighteen questions about the significance of particular factors when purchasing a smartphone (The questions contained a scale of 1–10, where 1 meant the lowest level of rating and 10 meant the highest. All questions were divided into 4 problem areas: economic, image, technical and environmental parameters);
- (d)
- three questions about the product environmental performance (evaluation of the carbon footprint left by the used smartphone), the respondents’ environmental sensitivity (interest in environmental issues) and its impact on the purchase process (attention paid by the respondents to the “environmental performance” of products during the purchase process).
The development of the research tool final form was preceded by two rounds of pilot surveys, on a sample of 50 respondents each, as a result of which the diagnosed formal and content-related errors were eliminated, which allowed the authors to obtain high and stable reliability level of the discussed tool.
The particular parts of the questionnaire were arranged that the issues related to the smartphones environmental performance, the personal environmental sensitivity assessment and focus on environmental aspects when making purchases were raised at the very end of the survey. As the results of research conducted by, among others, Cross, Tourangeau et al. or Särndal and Lundquist [32,33,34], such a structure of the research tool allowed for the elimination of the potential impact of the abovementioned issues on the significance assessment of the researched factors taken into account by respondents during the purchase process on the smartphone market.
2.3. The Research Period and A Description of The Research Sample
In order to explore Polish residents’ opinions regarding the factors that guide them when buying a smartphone, it was decided to use the services of a specialized research agency BioStat, which carries out the research using the Opinion Research Panel on representative samples of population. The project attempted to examine at least 1000 people whose participation structure according to gender and age corresponds to the image of Polish citizens. In order to determine the weights allowing the authors to obtain parameters representative of the population of Internet research panel users, the percentage of people using the Internet (Based on a CBOS survey report Korzystanie z Internetu, nr 85/2020) (Internet usage means using the Internet at least once a week) was taken into account, divided into adopted differentiation criteria (age and gender). The resulting conversion factors applied to correct the population for the purpose of providing a complete picture of a representative sample of Polish citizens using the Internet.
The survey was conducted between 6 and 13 October 2020 on a sample of 1006 respondents. Table 1, Table 2 and Table 3 show the age, gender and place of residence of the research sample representatives. On the presented results, the survey reflects the assumed structure of the sample in terms of both age and gender of respondents. Using the panel survey method, it is possible to make an assumption about the representativeness of the obtained results in relation to the whole population of Polish Internet users with a high degree of probability.

Table 1.
Actual research sample distribution by age.
Table 2.
Actual research sample distribution by gender.
Table 3.
Actual research sample distribution by place of residence.
3. Results
3.1. Analysis of Respondents’ Opinions of Different Sensitivity and Environmental Awareness
The first of the research objectives was to analyze the significance level of differences in the opinions expressed by respondents with different environmental sensitivity and awareness concerning the valuation of particular factors of the purchase process on the smartphone market and to estimate their knowledge of the smartphones’ environmental impact.
The first step in the analytical process was to divide the respondents into two groups with different levels of pro-ecological behavior and attitude. As segmenting variables in the cluster analysis, the questionnaire questions concerning the respondents’ assessment of their level of interest in environmental issues and their attention to the “environmental performance” of products during the purchase processes were selected. The questions included a scale of 1–10, where 1 corresponded to the low and 10 to the high interest of respondents in the evaluated attitude raised.
Primarily, the case classification validity was conducted based on a hierarchical clustering, with an agglomerate approach using the Ward method and the Euclidean distance measurement see [35]. The analysis has resulted in the dendrogram presented in Figure 1, whose evaluation leads to the conclusion that it is justified to distinguish two separate groups aggregating cases with relatively consistent values of variables included in the analysis. This number was later confirmed using well-established indices applied in estimating the optimal number of clusters, such as the silhouette index and the Calinski-Harabasz index see [36].
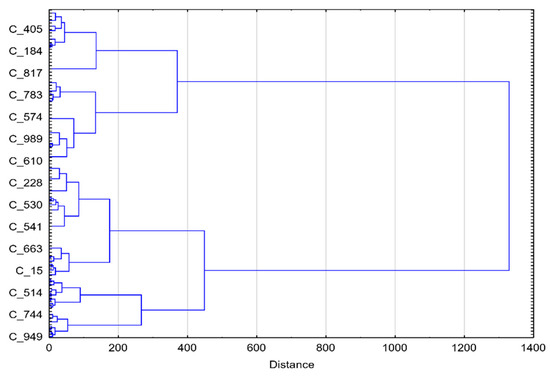
Figure 1.
Results of the hierarchical clustering analysis - agglomerative approach.
The final cluster analysis was carried out using the expectation-maximization (EM) algorithm, see [37], whereas the final number of clusters was determined using the v-fold cross-validation see [38], which also indicated two sets of cases as the most reasonable. Graphical presentation of two designated clusters profiles, being the result of cluster analysis using the EM algorithm, is presented in Figure 2.
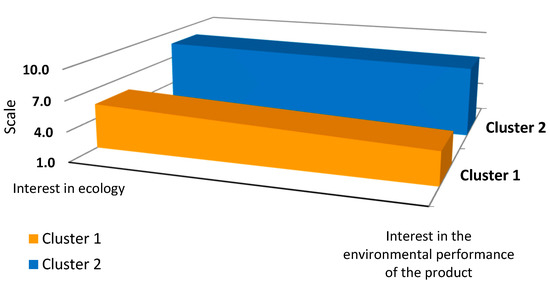
Figure 2.
Cluster analysis results for 2 groups – expectation-maximization (EM) algorithm.
On the presented comparison, as can be seen, the analysis of clusters allowed the sample of respondents to be divided into two statistically separate groups:
- (a)
- Cluster 1—people with a moderate level of interest in ecology and an even lower perception of the importance of the environmental performance of a product when making purchases—called for the purpose of the research “environmentally unaware customers”;
- (b)
- Cluster 2—people with a high level of ratings assigned to both analyzed issues—called for the purpose of the research “environmentally conscious customers”.
First, both estimated groups of respondents were evaluated and assessed for their main socio-demographic aspects (gender, age and place of residence), duration of the phone use and terms of its replacement.
Figure 3 shows that, overall, there were comparable numbers of women and men in the research sample. Interestingly, the gender distribution between the two groups of respondents (cluster 1 and 2) identified in the research shows that in Poland women are more committed and interested in the issue of ecology and take environmental issues into account more often when making purchasing decisions (as can be seen, the different genders’ participation structure in both selected clusters is basically the opposite of the predominance of women in group 2 and men in group 1). These conclusions are confirmed by the work of Bradshaw and Courchamp, Fortnam et al., Yang et al. [39,40,41]. They concern the so-called “eco-gender gap” phenomenon, which generally describes the greater environmental awareness observed among women compared to men.
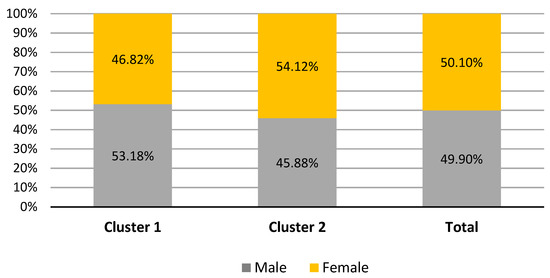
Figure 3.
Gender distribution of research sample and estimated clusters.
The data presented in Figure 4 indicate that the group of people with greater ecological sensitivity (cluster 2) includes significantly more elderly people (55+ category—23.61% to 18.5%) and fewer younger people (18–24 years old—9.35% to 15.43%) compared to the group of people with a moderate approach to ecology (cluster 1). These findings are supported by the results of research by many other authors. Wiernik, Ones and Dilchert [42] found that small but generalizable relationships indicated that older individuals appear to be more likely to engage with nature, avoid environmental harm, and conserve raw materials and natural resources. Additionally, in their later study authors also discovered that relationships with age appeared to be linear for overall, Conserving, Avoiding Harm, and Taking Initiative pro-environmental behaviors [43]. There is also research evidence that not only do environmental values strengthen as people age, and green behaviors at home therefore become more prevalent [44], but also environmental attitudes (as a predictor of employee green behavior) are relatively stable after early adulthood [45]. However, in the literature one can find also opposite research findings. For example, several studies, see [46,47], have discovered that age is negatively correlated with the willingness to contribute to additional environmental protection. In addition to this, Howell and Laska [48] found that younger people are more concerned about environmental problems than older people.
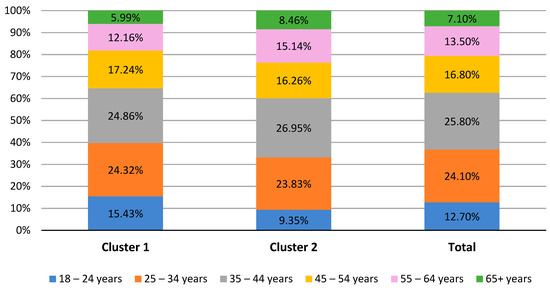
Figure 4.
Age distribution of research sample and estimated clusters.
The analysis of the respondents’ structure of residence from both research groups did not reveal any significant differences in the distribution of particular fractions (the obtained differences did not exceed 3%). This means that the place of residence does not determine the respondents’ environmental awareness or their purchasing process. Those findings are generally supported by results of the study of Platkowska-Prokopczyk [49] from Polish Academy of Science which also did not show any significant differences between residents of towns and villages in terms of their ecological awareness and environmental attitudes and behaviors.
Another noteworthy observation derives from the frequency distribution analysis of smartphone changes frequency among representatives of both researched groups. As is shown in Figure 5, a group of people declaring more pro-environmental behaviors and attitudes (cluster 2) make smartphones changes statistically more often than people declaring lesser attention to environmental issues (cluster 1). This indicates that the declared attention paid to pro-ecological issues in the case of the smartphone industry does not reflect the purchasing behaviour of Polish customers. It should be additionally observed that the results of research conducted by, among others, McDonald et al., Claudy et al., or Kaiser et al. [50,51,52], reveal that excessive consumerism and unjustified (not resulting from the causes of product damage or its technological “backwardness”) excessive purchases of super-basic goods (especially in the electronics area and higher-level goods) are one of the most serious manifestations of customers’ irrational market behaviors contributing to significant environmental degradation.
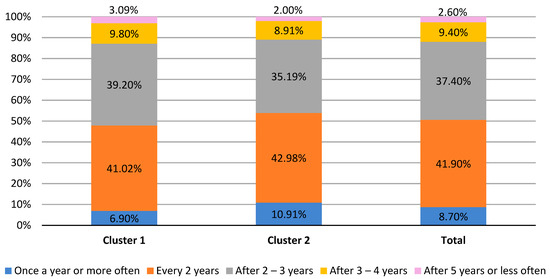
Figure 5.
Frequencies of smartphone changes.
In order to check whether the groups of respondents distinguished within the cluster analysis statistically significantly differ in the individual valuation of factors that influence the purchase process on the smartphones market, and in knowledge of the environmental impact of smartphones, the nonparametric Mann-Whitney U-test was carried out.
In the analysis, the following U statistics were used:
where is the test statistic for the sample of interest, is the number of values from the sample of interest, is the number of values from the first sample, is the number of values from the second sample, and is the sum of the ranks from the sample of interest [53].
Researchers decided to use the Mann-Whitney U-test to estimate the difference between designated two groups of respondents because the measurement was considered to be of ordinal level, moreover, one cannot assume that the research samples are normally distributed [54]. The results of the Mann-Whitney U-test and basic descriptive statistics (mean response values and standard deviations) for both identified groups of respondents are presented in Table 4.
Table 4.
Mann-Whitney U-test results and basic descriptive statistics.
The data presented in Table 4 proves that in the case of the vast majority of the analyzed factors of the purchase process in the smartphone industry, it can be assumed, with a high probability (each time exceeding the assumed level of 95%), that there are statistically significant differences in assessing the impact of the analyzed issues in the opinion of representatives of both designated groups of respondents (p values of Mann- Whitney U-test for analyzed issues ≤0.05). The only problem for which the assumed hypothesis of a different level of the examined issues valuation by the analyzed groups of respondents cannot be accepted unequivocally is the question of the smartphone price influence on the course of the purchase process (statistical value p = 0.140 in the Mann-Whitney U-test). Graphical presentations of the results of basic descriptive statistics obtained for the researched areas in terms of both analyzed clusters and particular groups of factors (economic, image, technical and environmental) are presented in Figure 6, Figure 7, Figure 8 and Figure 9. In the research the scale 1–10 was adopted, where the rating 1 corresponded to the minimum level of significance of the discussed factor and 10 to the maximum level.
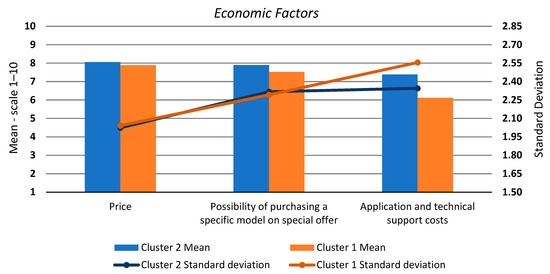
Figure 6.
Means and standard deviations of the Economic Factors.
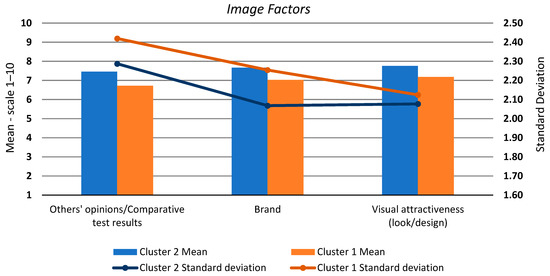
Figure 7.
Means and standard deviations of the Image Factors.
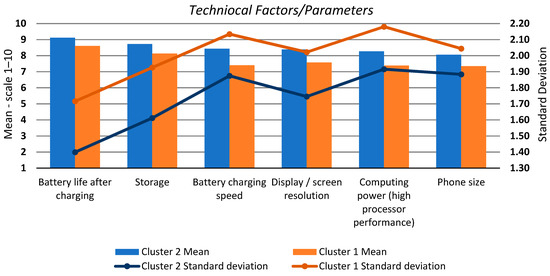
Figure 8.
Means and standard deviations of the Technical Factors/Parameters.
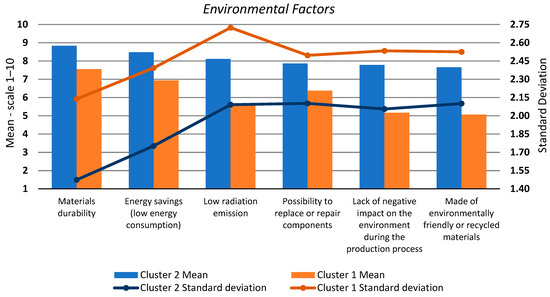
Figure 9.
Means and standard deviations of the Environmental Factors.
Figure 6 presents the data obtained for a group of economic factors. As can be seen, the smartphone price was assessed by both groups of respondents on average at a comparable, relatively high level of about 8 rating points. Additionally, this factor is characterized in comparison with other economic factors by definitely the highest level of respondents’ compliance in expressed opinions. However, aspects related to the possibility of purchasing a smartphone at a special offer are also important for both groups of respondents, although not as much as the price level. The least significant economic factor, for both groups, was the application and technical support costs, with the average response for “environmentally unaware customers” (cluster 1) being significantly lower than for “environmentally conscious customers” (cluster 2). Additionally, it is worth mentioning that both groups of respondents show a relatively low level of compliance in the evaluation of the importance of special offers, as well as application and technical support.
The results of the assessments assigned by both groups of respondents to factors related to the market image are presented in Figure 7. Among the discussed factors one can notice a stable difference in opinions expressed by both groups of respondents with higher average scores obtained for respondents belonging to the group of the “environmentally conscious customers” (cluster 2). In the case of people included in both groups of respondents it can be noted that the highest level of significance was assigned to the issue of products’ visual attractiveness and the lowest for the results of comparative tests and opinions of others. Furthermore, it should be mentioned that the factor which was assessed as the lowest on average is also characterized by the relatively highest level of divergence in the opinions expressed by the respondents of both analyzed groups.
The assessment of the significance level of technical factors and parameters is shown in Figure 8. The structure of significance of individual researched technical factors and parameters is in most cases analogous for both studied groups of respondents with statistically noticeable lower ratings assigned by respondents belonging to the group of the “environmentally unaware customers” (cluster 1) in comparison to people assigned to the group of the “environmentally conscious customers” (cluster 2). In the case of both analyzed groups of respondents, the technical factors with the highest level of significance were the battery life after charging and phone storage. At this point, it should also be noted that the average response result for the battery working time obtained for representatives of “environmentally conscious customers” (cluster 2) was simultaneously the highest score of all analyzed problematic issues without division into categories. Moreover, for the evaluation of both issues discussed above, the respondents showed a very high (for cluster 2) or high (for cluster 1) level of convergence when expressing their opinions. The other problematic issues concerning the assessment of the smartphone significance of technical factors and parameters have been assessed within each group of respondents at a relatively comparable level. Additionally, in the case of both clusters’ representatives, the significance assessing factor for which the respondents were the least unanimous was the smartphone computing power regarding the processor performance level.
In the case of the ratings analysis assigned by both groups of respondents to environmental issues related to the smartphone itself and the process of its use (Figure 9) it can be seen, as predicted, the largest scale of the difference in both average values and standard deviations between the responses given by representatives of both studied clusters. The issues with the greatest diversity opinions of both surveyed groups of customers include: environmental impact during the production process, level of radiation emission and smartphone production from environmentally friendly or recycled materials. Interestingly, for both analyzed group of respondents, these issues are relatively less important compared to other environmental factors that customers consider when making purchase decisions on the discussed market. Environmental aspects of fundamental importance from the perspective of both analyzed groups of customers were issues related to the durability of materials and energy efficiency of the smartphone. It should also be noted that people belonging to the group of the “environmentally unaware customers” (cluster 1) are characterized by a very high level of diversity in the opinions expressed in terms of all problematic issues considered in this category.
Summarizing the data presented in Table 4 and Figure 6, Figure 7, Figure 8 and Figure 9, statistically significant differences can be observed in the evaluation level of individual analyzed factors of the purchase process in the smartphones industry (all factors except the price level were statistically significantly evaluated higher by representatives of the “environmentally conscious customers” (cluster 2) in relation to the “environmentally unaware customers” (cluster 1)). There are also statistically significant differences in the hierarchy structure concerning their relevance in the context of both analyzed clusters, which were selected as a result of cluster analysis. The main differences between the analyzed groups of respondents can be seen in a much higher rank in the hierarchy of significance assigned to the issue of price by cluster 1 representatives (compared to cluster 2) and energy efficiency (understood as low energy consumption on the smartphone) in the opinion of cluster 2 representatives (compared to cluster 1).
As the graphical presentation of the results presented in Figure 10 shows, respondents assigned to the group of the “environmentally conscious customers” (cluster 2) are statistically more critical of the carbon footprint left by smartphones in relation to representatives of “environmentally unaware customers” (cluster 1). However, it should be noted that this is still a moderate result with an average score of 6.24 for the scale 1–10 and a relatively low level of convergence of results. It is worth mentioning here that the answers given to the discussed issue by representatives of the “environmentally unaware customers” (cluster 1) are characterized on the one hand by a very high level of convergence and on the other hand by a low level of reliable knowledge. The obtained results suggest that in the opinion of cluster 1 representatives, the carbon footprint left by smartphones is relatively low (these products are treated by this group of respondents as pro-environmental), which is in clear contradiction with the unequivocally different results of the research, which are discussed in detail in the Introduction to this article.
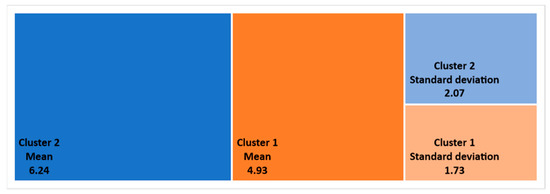
Figure 10.
Means and standard deviation of smartphones carbon footprints assessments (clusters 1 and 2).
3.2. Analysis of Respondents’ Opinions in the Perspective of the Smartphone Brand Users
The second of the research objective was to verify whether the level of environmental sensitivity and awareness as well as knowledge of the smartphones impact on the environment has a statistically significant correlation with the respondents’ choice of smartphone brand. First of all, it was decided to investigate which brands of smartphones are used by the survey respondents. The comparison of answers presented in Figure 11 indicates a definite domination among respondents of two brands: Samsung and Huawei, which together account for over 70% of responses (exactly 71.4%). In addition, the group of brands indicated by more than 10 people can also include companies, respectively: Apple, LG, Motorola and Nokia. The remaining brands were each time indicated by less than 10 respondents.
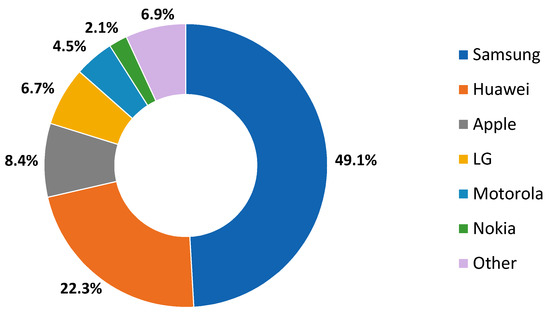
Figure 11.
Brands of the respondents’ smartphones. Other: Lenovo—9; Alcatel, Honor, Redmi—8 each; HTC, OPPO—6 each; Cubot—4; Asus, Neffos, One Plus—3 each; BlackBerry, Dodge—2 each; Google, Horse, Kiano, Kruger & Matz, Microsoft, Orange and Xiaomi—1 each.
Table 5 presents the results of basic descriptive statistics (mean and standard deviation) obtained for particular questions describing: the respondents’ interest in environmental issues, the impact of the product’s environmental performance on the purchase process and the respondents’ opinion on the carbon footprint left by the smartphone used in relation to the most frequently indicated smartphone brands used by the respondents. Table 6 presents the Mann-Whitney U-test results for the discussed questions in the layout of individual pairs of the analyzed smartphone brands.
Table 5.
Means and standard deviation values of different smartphone brands.
Table 6.
Mann-Whitney U-test results for the discussed questions in the layout of individual pairs of the analyzed smartphone brands.
The analysis of the presented results indicates that clearly statistically significant differences in the value of average responses (in the perspective of different smartphones brands) can be observed only for the assessment of the carbon footprint left by the used phone (it should be additionally emphasized that this variable is characterized by a relatively high level of unanimity in the opinions expressed by the respondents).
Within the discussed issue, the highest level of expressed opinions unanimity is shown by Nokia phones users (standard deviation for this group of respondents is only 1.55 for the scale 1–10). Simultaneously, these respondents are much more critical of the assessment of the negative environmental impact of this brand’s products on Apple and LG phone users (the average response levels are 6.29 for Nokia and 5.14 and 5.07 for Apple and LG, respectively). These responses reflect that rather than the real impact of Nokia phones on the environment, they are more likely to be the result of higher awareness and greater interest in environmental issues among Nokia users compared to other brands included in the survey (the highest average response rates of all brands obtained for environmental issues and product performance). LG and Apple users differ statistically significantly in their opinion of the carbon footprint of their smartphones, not only with Nokia but also with Samsung users. The obtained results indicate that statistically more often they consider (compared to Samsung smartphones users) that the phones they use are much more environmentally friendly and that their production and use process degrade the natural environment to a lesser extent.
For the remaining attitudes (the respondents’ interest in environmental issues and the impact of the product’s environmental performance on the purchase process) it is impossible to clearly establish the existence of significant differences in the answers given by the users of individual surveyed smartphone brands (p values of Mann-Whitney U-test for the rest of the analyzed issues ≥ 0.05).
4. Conclusions
The research results presented in the article show that respondents with statistically different levels of environmental sensitivity and awareness differ significantly both in the valuation of the vast majority of factors considered in the purchase process on the smartphone market, as well as in the very structure of the hierarchy of their significance. The obtained data suggest that the representatives of the “environmentally unaware customers” (cluster 1) approach the purchase process in a very classic way, according to the well-known formula of “value for money”, i.e., evaluation of measurable, easy to market comparison, technical aspects of the offer in the context of the price of individual options available on the market. In the case of respondents belonging to the group of the “environmentally conscious customers” (cluster 2) one can see a situation where they are willing to pay a relatively higher price for a smartphone, if it will meet all their technical requirements and some environmental issues (durability of materials and energy efficiency). It should be noticed that important environmental issues for the representatives of the cluster 2 are directly related to the usefulness of the smartphone and not to sustainable development and care for the environment. This situation allows us to categorize them as the so-called calculating and at the same time demanding customers, with strictly defined, high needs and requirements aimed at functional as well as technological and purely design features of smartphones.
Another conclusion from the conducted research is the fact that Polish smartphone users have a relatively low level of knowledge about the impact of these products on the natural environment (both those declaring low and high levels of environmental sensitivity and awareness). Moreover, the respondents in cluster 1 (with a lower level of interest in ecology) are very unanimous in their opinions and treat smartphones as environmentally friendly products with a low level of carbon footprint, which is clearly not consistent with the reliable results of research conducted on the subject, see [17,18,19,20]. Such a situation evidences the very low environmental awareness of this group of customers, who do not attach any importance in the decision-making process to issues related to broadly understood environmental issues.
The primary results of the authors’ research on the relationship between smartphone brands and the assessment of their environmental impact allow us to observe several interesting correlations. First of all, it has been noted that Nokia smartphone users are most critical of the smartphones carbon footprint among users of all smartphone brands. The highest, statistically significant level of differences in the assessment of this issue was observed between Nokia users and Apple as well as LG smartphone users. Additionally, as the results show, LG and Apple smartphone users differ in the way they assess the level of carbon footprint left by their smartphones, not only with Nokia but also with Samsung phones users. The obtained results clearly show that in their opinion, the smartphones that they use are much more environmentally friendly than the competitors’ product. The authors of the research are aware that the discussed dependencies may be the result of differences in the personal (metrical) and characterological characteristics of people using particular smartphone brands, but the obtained empirical material does not allow us to conduct such scientific deliberations. Therefore, the presented dependencies between the used smartphone brands and the assessment by their users of the carbon footprint left by their phones should be treated as a starting point for deeper and more detailed research combining the issues of both the behavioral aspects of the customers’ purchasing processes as well as their psychological and personal characteristics.
5. Discussions
The obtained results according the overall environmental sensitivity and awareness of Polish residents are supported by research carried out by other scientists. The analysis of the ecological awareness and behaviour of Polish citizens conducted for the needs of The Polish Ministry of the Environment [55] also showed that majority of the respondents were indifferent to environmental issues or treated them more seriously, but at that time it was mostly purely transactional relation (the value the customer receives in view of the surplus price to be paid for a more ecological product). Similar conclusions can also be seen in the work of Moser [56], who showed that willingness to pay is the strongest predictor of green purchasing behaviour. However, Moser also discovered that the impact of a pro-ecological attitude was insignificant for customers’ purchasing behavior, in contrast with our research results. Authors also suggest that this issue should be the main topic of the future, more detailed and multi industrial research investigations in order to be able to fully understand the whole relation occurring between the pro-ecological attitude of customers and their purchasing behavior.
Research findings concerning the level of knowledge of Polish smartphone users about the impact of these products on the natural environment are generally supported by research outcomes of Witek [57], who show that only 21% of respondents (Polish customers) indicate knowledge of the production process, certification and control of environmentally friendly products. Even more interestingly, the author has also discovered that a large group of surveyed consumers (43%) showed a willingness to pay higher prices for environmentally friendly products but do not know how to find them and evaluate their quality in a reliable way.
The main outcomes of the estimated relationship between smartphone brands and the environmental impact assessment presented in the article are generally supported by the results of other research which shows that the Samsung Company, despite its central position among smartphones manufacturers, lags far behind other brands in tackling and taking care of its corporate contribution to climate change [17]. Samsung has a weak intensity-based goal for reducing its own GHG emissions, while its absolute emissions are increasing between 10–15% each year [58]. In 2018, Samsung used over 17,500 GWh [59] for its own operations, more energy than the Slovenia or Cuba used in 2017 [60], but only slightly more than 1% came from renewable sources. On the other hand, only Apple and Google products are free of BFR and PVC across their whole product lines, and what is more, Apple is the only smartphone producer company thus far that has committed to 100% renewable power for its supply chain by the end of 2030 [17]. However, one should also be aware of the fact that the Apple company still continues to design products with proprietary parts to limit access and actively lobbies against right to repair legislation in New York and Nebraska [61].
In summary, one should also be aware of the fact that the conclusions of the research presented in the article have two main limitations. Firstly, the survey was only conducted in one country, which makes it impossible to carry out a comparative analysis taking into account the influence of the cultural factor. It should be remembered at this point that Poland has a relatively low profile among other European countries in terms of both the system’s environmental protection measures and the pro-environmental attitudes and behaviors of Polish citizens [62,63]. The second limitation concerns a very specific product that is the object of the research being conducted. In order to estimate the impact of the specificity of the industry on the obtained research conclusions, it would be necessary to verify whether the level of environmental sensitivity and awareness of customers has the same significant impact on the purchase process in other industries with different characteristics and dynamics of changes occurring there.
Author Contributions
Conceptualization: L.S. and M.S.-S.; methodology: L.S. and M.S.-S.; validation: L.S. and M.S.-S.; formal analysis: L.S. and M.S.-S.; investigation: L.S. and M.S.-S.; data curation: L.S. and M.S.-S.; writing—original draft preparation: L.S. and M.S.-S.; writing—review and editing: L.S. and M.S.-S.; visualization: L.S. and M.S.-S.; project administration: L.S. All authors have read and agreed to the published version of the manuscript.
Funding
This research received no external funding.
Institutional Review Board Statement
Not applicable.
Informed Consent Statement
Not applicable.
Data Availability Statement
The data presented in this study are available on request from the corresponding author.
Conflicts of Interest
The authors declare no conflict of interest.
References
- Wiedmann, T.O.; Schandl, H.; Lenzen, M.; Moran, D.; Suh, S.; West, J.; Kanemoto, K. The material footprint of nations. Proc. Natl. Acad. Sci. USA 2015, 112, 6271–6276. [Google Scholar] [CrossRef]
- Apergis, N.; Payne, J.E. Coal consumption and economic growth: Evidence from a panel of OECD countries. Energy Policy 2010, 38, 1353–1359. [Google Scholar] [CrossRef]
- Chandran Govindaraju, V.G.R.; Tang, C.F. The dynamic links between CO2 emissions, economic growth and coal consumption in China and India. Appl. Energy 2013, 104, 310–318. [Google Scholar] [CrossRef]
- Gilberthorpe, E.; Hilson, G. Natural Resource Extraction and Indigenous Livelihoods: Development Challenges in an Era of Globalization; Routledge: London, UK, 2016. [Google Scholar]
- Schaffartzik, A.; Duro, J.A.; Krausmann, F. Global appropriation of resources causes high international material inequality–growth is not the solution. Ecol. Econ. 2019, 163, 9–19. [Google Scholar] [CrossRef]
- Sarkodie, S.A. Causal effect of environmental factors, economic indicators and domestic material consumption using frequency domain causality test. Sci. Total Environ. 2020, 736, 139602. [Google Scholar] [CrossRef]
- Ercin, A.E.; Hoekstra, A.Y. Carbon and Water Footprints—Concepts, Methodologies and Policy Responses; United Nations Educational, Scientific and Cultural Organization: Paris, France, 2012. [Google Scholar]
- Radu, A.L.; Scrieciu, M.A.; Caracota, D.M. Carbon footprint analysis: Towards a projects evaluation model for promoting sustainable development. Procedia Econ. Financ. 2013, 6, 353–363. [Google Scholar] [CrossRef]
- WHO. WHO Carbon Footprint Report; WHO: Geneva, Switzerland, 2009. [Google Scholar]
- Wiedmann, T.; Minx, J. Ecological Economics Research Trends: Chapter 1 “A definition of ‘Carbon Footprint’; Nova Science Publishers: New York, NY, USA, 2008. [Google Scholar]
- Wright, L.A.; Kemp, S.; Williams, I. ‘Carbon footprinting’: Towards a universally accepted definition. Carbon Manag. 2011, 2, 61–72. [Google Scholar] [CrossRef]
- European Investment Bank. European Investment Bank Group Carbon Footprint Report; European Investment Bank: Luxembourg, 2019. [Google Scholar]
- Udara Willhelm Abeydeera, L.H.; Wadu Mesthrige, J.; Samarasinghalage, T.I. Global research on carbon emissions: A scientometric review. Sustainability 2019, 11, 3972. [Google Scholar] [CrossRef]
- Gao, T.; Liu, Q.; Wang, J. A comparative study of carbon footprint and assessment standards. Int. J. Low Carbon Technol. 2014, 9, 237–243. [Google Scholar] [CrossRef]
- Weidemann, T.; Thrane, M.; Christensen, P.; Schmidt, J.; Lokke, S. Carbon footprint. J. Ind. Ecol. 2008, 12, 3–6. [Google Scholar] [CrossRef]
- Pandey, D.; Agrawal, M.; Pandey, J.S. Carbon footprint: Current methods of estimation. Environ. Monit. Assess. 2011, 178, 135–160. [Google Scholar] [CrossRef] [PubMed]
- Cook, G.; Jardim, E. Guide to Green Electronics; Greenpeace Inc. Publishing: London, UK, 2017. [Google Scholar]
- Merchant, B. The One Device: The Secret History of the iPhone; Little, Brown and Company, Hachette Book Group: New York, NY, USA, 2017. [Google Scholar]
- Manhart, A.; Blepp, M.; Fischer, C.; Graulich, K.; Prakash, S.; Priess, R.; Schleicher, T.; Tür, M. Resource Efficiency in the ICT Sector; Final Report; Greenpeace Inc. Publishing: Hamburg, Germany, 2016. [Google Scholar]
- iFixit. iFixit Laptop, Tablet, and Smartphone Repairability Trackers; iFixit Report; iFixit: San Luis, CA, USA, 2017. [Google Scholar]
- Ericsson Company. Mobility Report; Ericsson Company: Stockholm, Sweden, 2018. [Google Scholar]
- Siler, L.; Cornibert, S. Smartphone Ownership Is Growing Rapidly Around the World, but Not Always Equally; Pew Research Center: Washington, DC, USA, 2019; Press release February 2019. [Google Scholar]
- Rahim, A.; Safin, S.Z.; Kheng, L.K.; Abas, N.; Ali, S.M. Factors influencing purchasing intention of smartphone among university students. Procedia Econ. Financ. 2016, 37, 245–253. [Google Scholar] [CrossRef]
- Ling, C.; Hwang, W.; Salvendy, G. Diversified users’ satisfaction with advanced mobile phone features. Univers. Access Inf. Soc. 2006, 5, 239–249. [Google Scholar] [CrossRef]
- Mokhlis, S.; Yakoop, A.Y. Consumer Choice criteria in Mobile Phone selection. Int. Rev. Soc. Sci. Humanit. 2012, 2, 203–212. [Google Scholar]
- Kim, K.; Proctor, R.W.; Salvendy, G. The relation between usability and product success in cell phones. Behav. Inf. Technol. 2012, 31, 969–982. [Google Scholar] [CrossRef]
- Harris, M.A.; Brookshire, R.; Chin, A.G. Identifying factors influencing consumers’ intent to install mobile applications. Int. J. Inf. Manag. 2016, 36, 441–450. [Google Scholar] [CrossRef]
- Tossell, C.C.; Kortum, P.; Shepard, C.; Rahmati, A.; Zhong, L. An empirical analysis of smartphone personalisation: Measurement and user variability. Behav. Inf. Technol. 2012, 31, 995–1010. [Google Scholar] [CrossRef]
- Chen, W.-K.; Huang, H.-C.; Chou, S.-C. Understanding what determines consumers’ expanded use of mobile videophones. Behav. Inf. Technol. 2012, 31, 953–967. [Google Scholar] [CrossRef]
- Ibrahim, I.I.; Subari, K.A.; Kassim, K.M.; Mohamood, S.K.B. Antecedent Stirring Purchase Intention of Smartphone among adolescents in Perlis. Int. J. Acad. Res. Bus. Soc. Sci. 2013, 3, 84–97. [Google Scholar] [CrossRef]
- Lay-Yee, K.L.; Kok-Siew, H.; Yin-Fah, B.J. Factors affecting smartphone purchase decision. Int. J. Asian Soc. Sci. 2013, 3, 2426–2440. [Google Scholar]
- Cross, P.A. Fundaments of Survey Measurement and Analysis. Surv. Rev. 1975, 23, 155–168. [Google Scholar] [CrossRef]
- Tourangeau, R.; Brick, J.; Lohr, S.; Li, J. Adaptive and responsive survey designs: A review and assessment. J. R. Stat. Soc. Ser. A Stat. Soc. 2016, 180, 203–223. [Google Scholar] [CrossRef]
- Särndal, C.-E.; Lundquist, P. An assessment of accuracy improvement by adaptive survey design. Surv. Methodol. 2019, 45, 317–337. [Google Scholar]
- Ward, J.H., Jr. Hierarchical Grouping to Optimize an Objective Function. J. Am. Stat. Assoc. 1963, 58, 236–244. [Google Scholar] [CrossRef]
- Tibshirani, R.; Walther, G.; Hastie, T. Estimating the number of clusters in a data set via the gap statistic. J. R. Stat. Soc. Ser. B Stat. Methodol. 2001, 63, 411–423. [Google Scholar] [CrossRef]
- Dempster, A.P.; Laird, N.M.; Rubin, D.B. Maximum likelihood from incomplete data via the EM algorithm. J. R. Stat. Soc. Ser. B Stat. Methodol. 1977, 39, 1–22. [Google Scholar]
- Kawamoto, T.; Kabashima, Y. Cross-validation estimate of the number of clusters in a network. Sci. Rep. 2017, 7, 1–17. [Google Scholar] [CrossRef]
- Bradshaw, C.J.A.; Courchamp, F. Gender bias when assessing recommended ecology articles. Rethink. Ecol. 2018, 3, 1–12. [Google Scholar] [CrossRef]
- Fortnam, M.; Brown, K.; Chaigneau, T.; Crona, B.; Daw, T.M.; Gonçalves, D.; Hicks, C.; Revmatas, M.; Sandbrook, C.; Schulte-Herbruggen, B. The gendered nature of ecosystem services. Ecol. Econ. 2019, 159, 312–325. [Google Scholar] [CrossRef]
- Yang, Y.E.; Passarelli, S.; Lovell, R.J.; Ringler, C. Gendered perspectives of ecosystem services: A systematic review. Ecosyst. Serv. 2018, 31, 58–67. [Google Scholar] [CrossRef]
- Wiernik, B.M.; Ones, D.S.; Dilchert, S. Age and environmental sustainability: A meta-analysis. J. Manag. Psychol. 2013, 28, 826–856. [Google Scholar] [CrossRef]
- Wiernik, B.M.; Dilchert, S.; Ones, D.S. Age and employee green behaviors: A meta-analysis. Front. Psychol. 2016, 7, 194. [Google Scholar] [CrossRef] [PubMed]
- Whitmarsh, L.; O’Neill, S. Green identity, green living? The role of pro-environmental self-identity in determining consistency across diverse pro-environmental behaviours. J. Environ. Psychol. 2010, 30, 305–314. [Google Scholar] [CrossRef]
- Norton, T.A.; Parker, S.L.; Zacher, H.; Ashkanasy, N.M. Employee green behavior—A theoretical framework, multilevel review, and future research agenda. Organ. Environ. 2015, 28, 103–125. [Google Scholar] [CrossRef]
- Whitehead, J.C. Environmental interest group behaviour and self-selection bias in contingent valuation mail surveys. Growth Chang. 1991, 22, 10–21. [Google Scholar] [CrossRef]
- Carlsson, F.; Johansson-Stenman, O. Willingness to pay for improved air quality in Sweden. Appl. Econ. 2000, 32, 661–669. [Google Scholar] [CrossRef]
- Howell, S.E.; Laska, L.B. The changing face of the environmental coalition: A research note. Environ. Behav. 1992, 24, 134–144. [Google Scholar] [CrossRef]
- Płatkowska-Prokopczyk, L. The level of environmental awareness as a determinant of attitudes and behaviors developed by inhabitants of towns and villages-a comparative case study. In Infrastruktura i Ekologia Terenów Wiejskich; Polish Academy of Science Research Papers; Polish Academy of Science: Warsaw, Poland, 2017. [Google Scholar]
- McDonald, S.; Oates, C.J.; Alevizou, P.J.; Young, C.W.; Hwang, K. Individual strategies for sustainable consumption. J. Mark. Manag. 2012, 28, 445–468. [Google Scholar] [CrossRef]
- Claudy, M.C.; Peterson, M.; O’Driscoll, A. Understanding the Attitude-Behavior Gap for Renewable Energy Systems Using Behavioral Reasoning Theory. J. Macromark. 2013, 33, 273–287. [Google Scholar] [CrossRef]
- Kaiser, F.G.; Wölfing, S.; Fuhrer, U. Environmental Attitude and Ecological Behaviour. J. Environ. Psychol. 1999, 19, 1–19. [Google Scholar] [CrossRef]
- Corder, G.W.; Foreman, D.I. Nonparametric Statistics for Non-Statisticians: A Step-by-Step Approach; John Wiley & Sons: Hoboken, NJ, USA, 2009; p. 58. [Google Scholar]
- Moayedikia, A.; Ong, K.L.; Boo, Y.L.; Yeoh, W.G.; Jensen, R. Feature selection for high dimensional imbalanced class data using harmony search. Eng. Appl. Artif. Intell. 2017, 57, 38–49. [Google Scholar] [CrossRef]
- PBS report prepared for The Ministry of the Environment. Survey of Environmental Awareness and Behaviours of Polish Residents; PBS Report Prepared for The Ministry of the Environment: Sopot, Poland, 2017. [Google Scholar]
- Moser, A.K. Thinking green, buying green? Drivers of pro-environmental purchasing behaviour. J. Consum. Mark. 2015, 32, 167–175. [Google Scholar] [CrossRef]
- Witek, L. Attitude-Behaviour Gap among Polish Consumers Regarding Green Purchases. Visegr. J. Bioecon. Sustain. Dev. 2019, 8, 31–36. [Google Scholar] [CrossRef]
- Samsung. Samsung 2017 Sustainability Report; Samsung: Seoul, Korea, 2017. [Google Scholar]
- Samsung. Samsung 2019 Sustainability Report; Samsung: Seoul, Korea, 2019. [Google Scholar]
- World Energy Council. World Energy Trilema Index 2020; World Energy Council: London, UK, 2020. [Google Scholar]
- Koebler, J. Apple Is Lobbying against Your Right to Repair iPhones, New York State Records Confirms; VICE: Brooklyn, NY, USA, 2017. [Google Scholar]
- Fielding, K.S.; Hornsey, M.J. A social identity analysis of climate change and environmental attitudes and behaviors: Insights and opportunities. Front. Psychol. 2016, 7, 121. [Google Scholar] [CrossRef]
- De Mooij, M.; Hofstede, G. Cross-cultural consumer behavior: A review of research findings. J. Int. Consum. Mark. 2011, 23, 181–192. [Google Scholar]


Publisher’s Note: MDPI stays neutral with regard to jurisdictional claims in published maps and institutional affiliations. |
© 2021 by the authors. Licensee MDPI, Basel, Switzerland. This article is an open access article distributed under the terms and conditions of the Creative Commons Attribution (CC BY) license (http://creativecommons.org/licenses/by/4.0/).