Article

Immobilization of Metanil Yellow Decolorizing Mixed Culture FN3 Using Gelling Gum as Matrix for Bioremediation Application

by
Fatin Natasha Amira Muliadi
1,
Mohd Izuan Effendi Halmi
1,*,
Samsuri Bin Abdul Wahid
1,
Siti Salwa Abd Gani
2,
Khairil Mahmud
3 and
Mohd Yunus Abd Shukor
4
1
Department of Land Management, Faculty of Agriculture, Universiti Putra Malaysia, Serdang 43400, Malaysia
2
Department of Agricultural Technology, Faculty of Agriculture, Universiti Putra Malaysia, Serdang 43400, Malaysia
3
Department of Crop Science, Faculty of Agriculture, Universiti Putra Malaysia, Serdang 43400, Malaysia
4
Department of Biochemistry, Faculty of Biotechnology and Biomolecular Sciences, Universiti Putra Malaysia, Serdang 43400, Malaysia
*
Author to whom correspondence should be addressed.
Sustainability 2021, 13(1), 36; https://doi.org/10.3390/su13010036
Submission received: 30 September 2020 / Revised: 17 November 2020 / Accepted: 18 November 2020 / Published: 22 December 2020
(This article belongs to the Collection Sustainable Integrated Clean Environment for Human & Nature)

Abstract

:
In this study, the Metanil Yellow (MY) decolorizing mixed culture, namely FN3, has been isolated from agriculture soil. The mixed culture was immobilized using gellan gum. In order to optimize the immobilization process for maximal dye decolorization, Response Surface Methodology (RSM) was performed. The optimal conditions for immobilization predicted by desirability function are 130 mg/L of MY dye concentration, 1.478% of gellan gum concentration, 50 beads and 0.6 cm of beads size with the percentage of decolorization of 90.378%. The correlation coefficients of the model (R2 and R2 adj) are 0.9767 and 0.9533, respectively. This indicates that the established model is suitable to predict the effectiveness of dye decolorization under the investigated condition. The immobilized beads of mixed culture FN3 were able to be reused up to 15 batches of decolorization. The immobilized cells also have high tolerance towards heavy metals. This was proven by higher dye decolorization rate by the immobilized cells even with the addition of heavy metals in the media. The decolorization potential of the mixed culture indicates that it could be useful for future bioremediation of soil contaminated sites and treatment solutions of water bodies polluted with MY dye.

1. Introduction

Azo dyes are extensively used in various industries such as textile industry, food, paper-making and cosmetic industries [1,2]. With the growing demand of the textile industry, approximately 40,000 different dyes and pigments are being use and 2000 azo dyes are currently in use. The production of azo dyes annually worldwide is around 7 × 10⁵ tonnes [3]. Azo dyes are highly water-soluble. They include one or more azo (-N=N-) groups and sulfonic (SO3−) groups [4]. Due to the dyeing process, the textile industry releases an enormous amount of wastewater into the environment. Typically, about 10–15% of the dye is lost in effluents, since they do not bind to the fibres [5]. This has led to water pollution.
Metanil Yellow (MY) (3-(4-Anilinophenylazo) benzene sulfonic acid sodium salt is a type of acidic azo dyes [6]. MY is commonly used as soap colouring, spirit lacquer, shoe polish, bloom sheep dip, for preparation of food stains, leather dyeing, for manufacturing of pigment lakes and paper staining [7]. MY is categorized as nonpermitted food colourants. It is widely used as alimentary dye adulterant in India [8]. However, it was found out later that MY is carcinogenic. From the toxicity investigation data, it is known that when MY is fed to the animals, it produces testicular lesions leading a decrease in the rate of spermatogenesis [7]. According to Saratale (2009), exposure to the dyes leads to potential health hazards such as asthma, rhinitis and dermatitis. Apart from the health hazards to human health, azo dyes also affect the ecosystems. When the wastewater effluents are being discharged into the open water sources, it affects the photosynthetic activity of aquatic organisms [9] and the dissolved dyes may also affect the aquatic organisms as it may be toxic to them due to their breakdown products [10].
Researchers are finding various ways of removing dyes from wastewater. As they are relatively resistant to biodegradation, the elimination of coloured effluents in wastewater treatment systems is mainly based on physical or chemical procedures such as adsorption, concentration, chemical transformation and incineration [11]. However, these methods are high-energy costs, high sludge production and formation of byproducts [12]. Therefore, biological methods for removing dyes need to be developed. The advantages of these methods is that they are environmental-friendly, economical and cost-competitive [13]. Biodegradation by different microorganisms appears to be an attractive alternative by using microorganisms as dye decolorizing agent [14].
Generally, degradation and decolorization of azo dye by bacteria proceeds in two stages. The first stage involves reductive cleavage of the dyes’ azo linkages, resulting in the formation of generally colourless but potentially hazardous aromatic amines. The second stage involves the degradation of the aromatic amines [15]. Reductive cleavage of the (-N=N-) bond is the initial step of the bacterial degradation of azo dyes. It can occur by different types of mechanisms such as through enzymes which are azoreductase and laccase enzymes, low molecular weight redox mediators, chemical reduction by biogenic reductants like sulfide or a combination of all of these [14]. The use of enzymes is beneficial according to substrate specificity and may be effectively used in textile water pretreatment. During azoreductase enzymatic dye degradation, azo bond (-N=N-) is being cleaved by the enzyme and four electrons are transferred as reducing equivalent. In each stage, two electrons transfer to the azo dye which is the electron acceptor and decolorization happened when the colourless solution is formed. The resulting intermediate is toxic aromatic amine which is later degraded by the aerobic process or sometimes microaerophilically [4].
It has been reported that bacterial dye decolorization and degradation can occur by a pure culture of bacteria and also by mixed culture of bacteria. According to the previous study, it has been reported that mixed bacterial culture can give a better degradation rate than the individual strain. Individual species have limited metabolic capability to mineralize dye completely and in many cases it has been observed that mainly due to lack of catabolic pathway, aromatic amines are not further degraded. Catabolic and synthrophic interactions of indigenous species lead to the complete degradation of azo dyes [16]. Azo dyes are not readily metabolized under aerobic conditions, and as a result of metabolic pathways, it degraded into intermediate compounds but not mineralized. It can be completely degraded under coupled aerobic, anaerobic degradation. Therefore, coupled anaerobic treatment followed by aerobic treatment can be an efficient and effective degradation method of azo dyes.
Immobilization of bacteria is studied extensively as it offers many advantages in the bioremediation field. There are many ways to immobilize the bacteria such as entrapment, adsorption, encapsulation and crosslinking [17]. Entrapment and encapsulation are considered as some of the preferred methods of immobilization. By immobilization, it prevents cell washout and maintains a high density of bacterial cells in bioreactor. Aside from that, the catalytic stability of bacteria is also improved compared to free cells [18]. Immobilization of whole cells also provides a conducive microenvironment for bacterial cells [19] and the entrapped cells can better tolerate various environmental stresses [20]. There are various immobilization matrices available. One of them is gellan gum. Gellan gum is said to be a premium natural polymer for encapsulation of active microorganisms. Gellan gum gel has better rheological characteristics compared to agar and carrageenan gels at equivalent concentrations [21]. Besides that, the gels are stable in a wide range of pH which is from pH 2−10 [21,22]. The interaction between gellan gums and ions is nonspecific, making the gels able to interact with a wide variety of cations. This is unlikely with other ion-sensitive gelling polysaccharides such as alginate [21].
Conventional method of optimization which is “one factor at a time” (OFAT) approach, is laborious, time consuming and incomplete. It involves varying a single independent variable while the other variables are maintained at a constant level. Thus, response surface methodology (RSM) using Central Composite Design (CCD) and Box–Behnken design (as factorial experimental design) which involves full factorial search by examining the simultaneous, systematic and efficient variation of important components is applied to model the decolorization process, identify possible interactions, higher-order effects and determine the optimum operational conditions [23]. RSM is a collection of statistical and mathematical techniques that are useful for developing, improving and optimizing processes. In this study, decolorization of MY by newly isolated mixed culture from agricultural soil namely FN3 is optimized by a statistical study of Response Surface Methodology (RSM) for optimum decolorization. Box Behnken design matrix is chosen for optimization. The isolated mixed culture is then immobilized using gellan gum. Mixed bacterial culture FN3 consists of bacteria mostly from Bacillus sp and yeasts [24].The immobilized cells are tested with addition of 1 mg/L of various heavy metals to investigate the significant effects to the dye decolorization. Reusability of the immobilized cells are also being tested in this study. To the best of our knowledge, no study has reported on the immobilization of mixed culture using gellan gum to decolorize MY dye. From the previous study, many works reported on the use of pure culture of bacteria instead of the mixed culture of bacteria, as reported in this study.

2. Materials and Methods

2.1. Cultivation of Mixed Culture FN3

The MY decolorizing mixed culture FN3 from an in-house culture collection was provided by the Department of Land Management at University Putra Malaysia [24]. The mixed culture was cultured in minimal salt medium (MSM) that contained (g/L): glucose, 10; (NH4)2SO4, 0.4; KH2PO4, 0.2; K2HPO4, 0.4; NaCl, 0.1; Na2MoO4.2H2O, 0.01; MgSO4.H2O, 0.1; MnSO4.H2O, 0.01; Fe(SO4)3.H2O, 0.01; yeast extract, 1.0 and supplemented with 50 mg/L of MY dye (Sigma-Aldrich, St Louis, MO, USA, 70% purity).

2.2. Immobilization of the Mixed Culture Using Gellan Gum

For the immobilization part, the mixed culture FN3 was grown on a large scale in minimal salt medium (MSM) supplemented with 50 mg/L of MY dye. The medium also contained (g/L): glucose, 10; (NH4)2SO4, 0.4; KH2PO4, 0.2; K2HPO4, 0.4; NaCl, 0.1; Na2M0O4, 0.01; MgSO4.H2O, 0.1; MnSO4.H2O, 0.01; Fe(SO4)3.H2O, 0.01; yeast extract, 1.0. The 5 L conical flask containing 3 L sterile MSM (pH 7.097) supplemented with 50 mg/L of MY dye was set up. A sterile glass-fibre syringe filter with 0.45 μm pores was used to filter microorganism from the incoming air provided by an oxygen pump. The pump was used to enhance the aeration in the flask and speed up the growth of the mixed culture. 300 mL of the selected mixed culture was cultured in 3 L MSM (pH 7.097) in 5 L scale-up set. After two days of incubation, the culture was centrifuged at 15,000× g for 10 min using a high-speed centrifuge (Beckman Coulter, Brea, CA, USA). The pellet was collected and immobilized using gellan gum for the cell immobilization study.
A method for the production of gellan gum beads, as proposed by Moslemy et al. (2003) with some small changes, was used. A 0.75% (w/v) of dispersed gellan gum was first dissolved in 55 mL of distilled water by continuously heating to 75–80 °C. The mixture was continuously stirred to prevent the clumping of gellan gum. Next, its pH was adjusted to 7 with 0.1 M NaOH. For microbial encapsulation, 5.25 g wet weight of microbial cells was dispersed in 150 mL gellan gum solution before emulsification. The mixture was then stirred for 1 min and emulsified dropwise using pipette through 2 mm diameter tips into 2% of CaCl2. The gellan gum droplets immediately gelled in the CaCl2 solution. The beads were then kept in the CaCl2 solution for one hour before being transferred to sterile distilled water. The beads were kept overnight in distilled water at 4 °C before being harvested by filtration. These beads were used for the MY dye decolorization after being washed with sterile distilled water and beads containing no cells served as the control [25].

2.3. Optimization of Immobilized Beads Using RSM

Response surface methodology acts as a modelling technique in determining the optimum conditions in a multivariable system and to evaluate the relationship between controllable experimental factors and observed results [26]. In the optimisation of the medium for optimum MY dye decolorization, Box–Behnken design was chosen as the experimental matrix. The significant parameters involved were dye concentration (A), gellan gum concentration (B), number of beads (C) and beads size (D) with the percentage of dye decolorization as the response. The design of the experiment and the statistical analysis of the data was conducted using Design Expert software, 6.0.10; Stat-Ease Inc, Minneapolis, USA [27] with a total number of 29 runs. The results were analysed using Design Expert add-ons program including ANOVA to find out the interaction between the variables and the response.
The quality of the fit of this model was expressed by the coefficient of determination (R2) in the same program. To start the experiment, the immobilized cells were prepared according to the runs predicted by RSM. The immobilized mixed culture beads were grown in MSM supplemented with MY dye in conical flasks and incubated on a rotary shaker (120 rpm) for 24 h. After 24 h, the percentage of dye decolorization was calculated using the formula as stated above.

2.4. Metabolites Analysis Using High-Performance Liquid Chromatography (HPLC)

The metabolites of the degraded Metanil Yellow were extracted three times using ethyl acetate. Firstly, the minimal salt media supplemented with 50 mg/L of MY was degraded with mixed culture FN3 for 24 h at 120 rpm rotary incubator. After 24 h, the culture broth was centrifuged at 12,000 rpm for 15 min. The metabolites were extracted from the clear supernatant with an equal volume of ethyl acetate. The mixture was vigorously mixed in order to dissolve the metabolites. The organic layer was then separated. The extracts were dried over anhydrous Na2SO4 and evaporated to dryness using a rotary evaporator. The crystals obtained were dissolved in HPLC grade methanol for further analysis of HPLC and FTIR [28,29]. HPLC analysis of the control dye, 50 mg/L of Metanil Yellow and the ethyl acetate extracts were performed using Waters 2690 instrument, Milfrd, USA, equipped with C18 column having symmetry of 250 × 4.6 mm. Methanol was used as the mobile phase with a flow rate of 1.0 mL/min for 15 min and UV detector at 434 nm [30].

2.5. Metabolites Analysis Using Fourier-Transform Infrared Spectroscopy (FTIR)

The metabolites of the degraded dye were extracted using ethyl acetate. The FTIR analysis of the metabolites was carried out on Thermo Nicolet 6700 instrument and compared with a control dye, 50 mg/L of Metanil Yellow dye in the mid-IR region of 400–4000 cm−1 with eight scan speed. The samples were mixed with spectroscopically pure KBr in the ratio of 5:95, pellets were fixed in the sample holder and the analysis was carried out [31].

2.6. Reusability of the Immobilized Beads

The reusability test of the immobilized beads is a critical process in bioremediation. This test was used to determine the ability of immobilized cells for Metanil Yellow dye decolorization after completing one decolorization cycle. The incubation of immobilized cells for 24 h was calculated as one cycle. The microbial beads were prepared according to the optimised parameters obtained from RSM; gellan gum concentration: 1.478%, beads number: 50 beads and beads size: 0.6 cm. The microbial beads and minimal salt media with 50 mg/L of Metanil Yellow dye were prepared in 50 mL liquid phase. The microbial beads were incubated overnight at 120 rpm rotary shaker at room temperature. After 24 h of incubation, 1 mL of the culture was withdrawn aseptically and centrifuged at 10,000× g for 10 min. The supernatant was measured at 434 nm wavelength and the percentage of decolorization was calculated. After the first cycle of decolorization, the beads were filtered from the growth medium and then washed with sterile distilled water. Next, the filtered microbial beads were incubated in the fresh MSM supplemented with 50 mg/L of MY dye. The process was repeated until no more dye decolorization was observed.

2.7. Scanning Electron Microscopy (SEM) of Immobilized Mixed Culture FN3

For scanning electron microscopy of the dye degrading mixed culture, the gel beads were firstly fixated with 2.5% (w/v) of glutaraldehyde solution overnight. After that, the dehydration process was performed. The dehydration started with increasing acetone concentration (35%, 50%, 75%, 95% and 100%). The gel beads were dehydrated subsequently to remove the remaining water. The dehydrated gel beads were then dried under critical conditions in a CO2 atmosphere. The dehydrated gel beads were then cut in half using sterile scalpel before being coated with gold and examined under the scanning electron microscope [32].

2.8. Effects of Heavy Metal Ions on Dye Decolorization of Immobilised Cells

In this study, the effect of heavy metals on the dye decolorization for immobilised cells was also carried out. MSM was separately supplied with one ppm of heavy metals consisting of copper (Cu), arsenic (As), zinc (Zn), chromium (Cr), nickel (Ni), silver (Ag), lead (Pb) and mercury (Hg). The immobilised cells were prepared based on optimum conditions that previously obtained from RSM. The MY dye concentration used was 50 mg/L. The immobilised beads were incubated at 120 rpm on a rotary shaker at room temperature. The microbial beads without heavy metals served as controls. After 24 h of incubation, 1 mL of the culture was withdrawn aseptically and centrifuged at 10,000× g for 10 min. The supernatant was measured at 434 nm wavelength and the percentage of dye decolorization was calculated after that. The studies were performed in duplicates.

3. Results and Discussions

3.1. Optimization of Immobilized Beads Using RSM

This study focused on the combined effects of four significant variables for the decolorization of MY dye by mixed culture FN3. In order to optimize the process variables for maximal dye decolorization, 29 experimental runs were conducted. Table 1 shows the experimental and response results together with the response predicted by RSM. The trial run 12 showed the highest dye decolorization which is 94.37%. The maximal and minimal dye decolorization was observed at run 12 and run 7, respectively, as shown in Table 1. There are few studies that studied favourable conditions for Metanil Yellow dye decolorization. Microorganisms that able to decolorize Metanil Yellow dye with favourable conditions have been listed in Table 2.
ANOVA is a measurable investigation that is part of the analysis in Response Surface Methodology (RSM). It has been applied to identify the contrast between at least two groups that change in an experiment and is typically used to show that there is a significant outcome from the experiment. Along these lines, ANOVA was utilized to evaluate the significance of the model compared with the experimental values [37]. Table 3 showed the analysis of variance (ANOVA) of the regression parameters of the predicted response surface quadratic model for dye decolorization. The regression model was given as follows:
Decolorization = 17.04 − 43.14 * A − 6.08 * B + 1.07 * C + 0.17 * D − 0.87 * AB − 0.76 * AC − 2.55 * AD + 2.43 * BC + 4.97 * BD + 3.15 * CD + 23.7 * A2 + 6.01 * B2 + 5.06 * C2 + 7.77 * D2
The predicted response fitted well with those of the experimentally obtained response. The adequate approximation of the selected model was measured by applying the diagnostic plots available in the Design-Expert version 6.0.10 software, namely the externally studentized residuals plotted against the normal probability, predicted versus studentized residuals, runs versus studentized residuals and actual responses versus the predicted response values.
Figure 1a showed that the externally studentized residuals plotted against the normal probability yielded a straight line showing normal distribution of the experimental data. As shown in Figure 1b, the predicted versus externally studentized residual runs versus externally studentized residuals and actual responses versus predicted responses, respectively, lie below the interval ±4.00 indicating that the approximation of the model was good with no data error. Figure 1d illustrated the actual responses plotted against the predicted responses value which fit each other with correlation coefficients (R2 and R2 adj) of 0.9767 and 0.9533, respectively for dye decolorization. Therefore, the developed model was suitable for predicting the efficiency of dye decolorization under the investigated conditions [38]. Table 2 depicted that the F value of the model is 41.84 with a low probability value (p < 0.001), indicating that the model was significant for dye decolorization. On the other hand, the value of p less than 0.0001 is statistically significant for the quadratic equation of the model [39].
Values of p > F less than 0.0500 indicated that the model terms were significant while values higher than 0.1000 indicated that the model terms were not significant. The lack of fit for the F test (5.8) was statistically insignificant, implying that the model fitted the data. The nonsignificant value of lack of fit (>0.05) revealed that the quadratic model was statistically significant for the response and, therefore, it can be used for further analysis. The goodness of fit of the model was checked using the determination coefficient (R2). In this case, the value of R2 was 0.9767 and the value of adjusted R2 was 0.9533 which was in reasonable agreement with the predicted R2 (0.8719), indicating that the model was adequate for predicting the dye decolorization with any combination values of the variables. The R2 value close to 1.00 showed that the model was sufficiently strong in its prediction [40].

3.2. Determination and Validation of Optimal Conditions

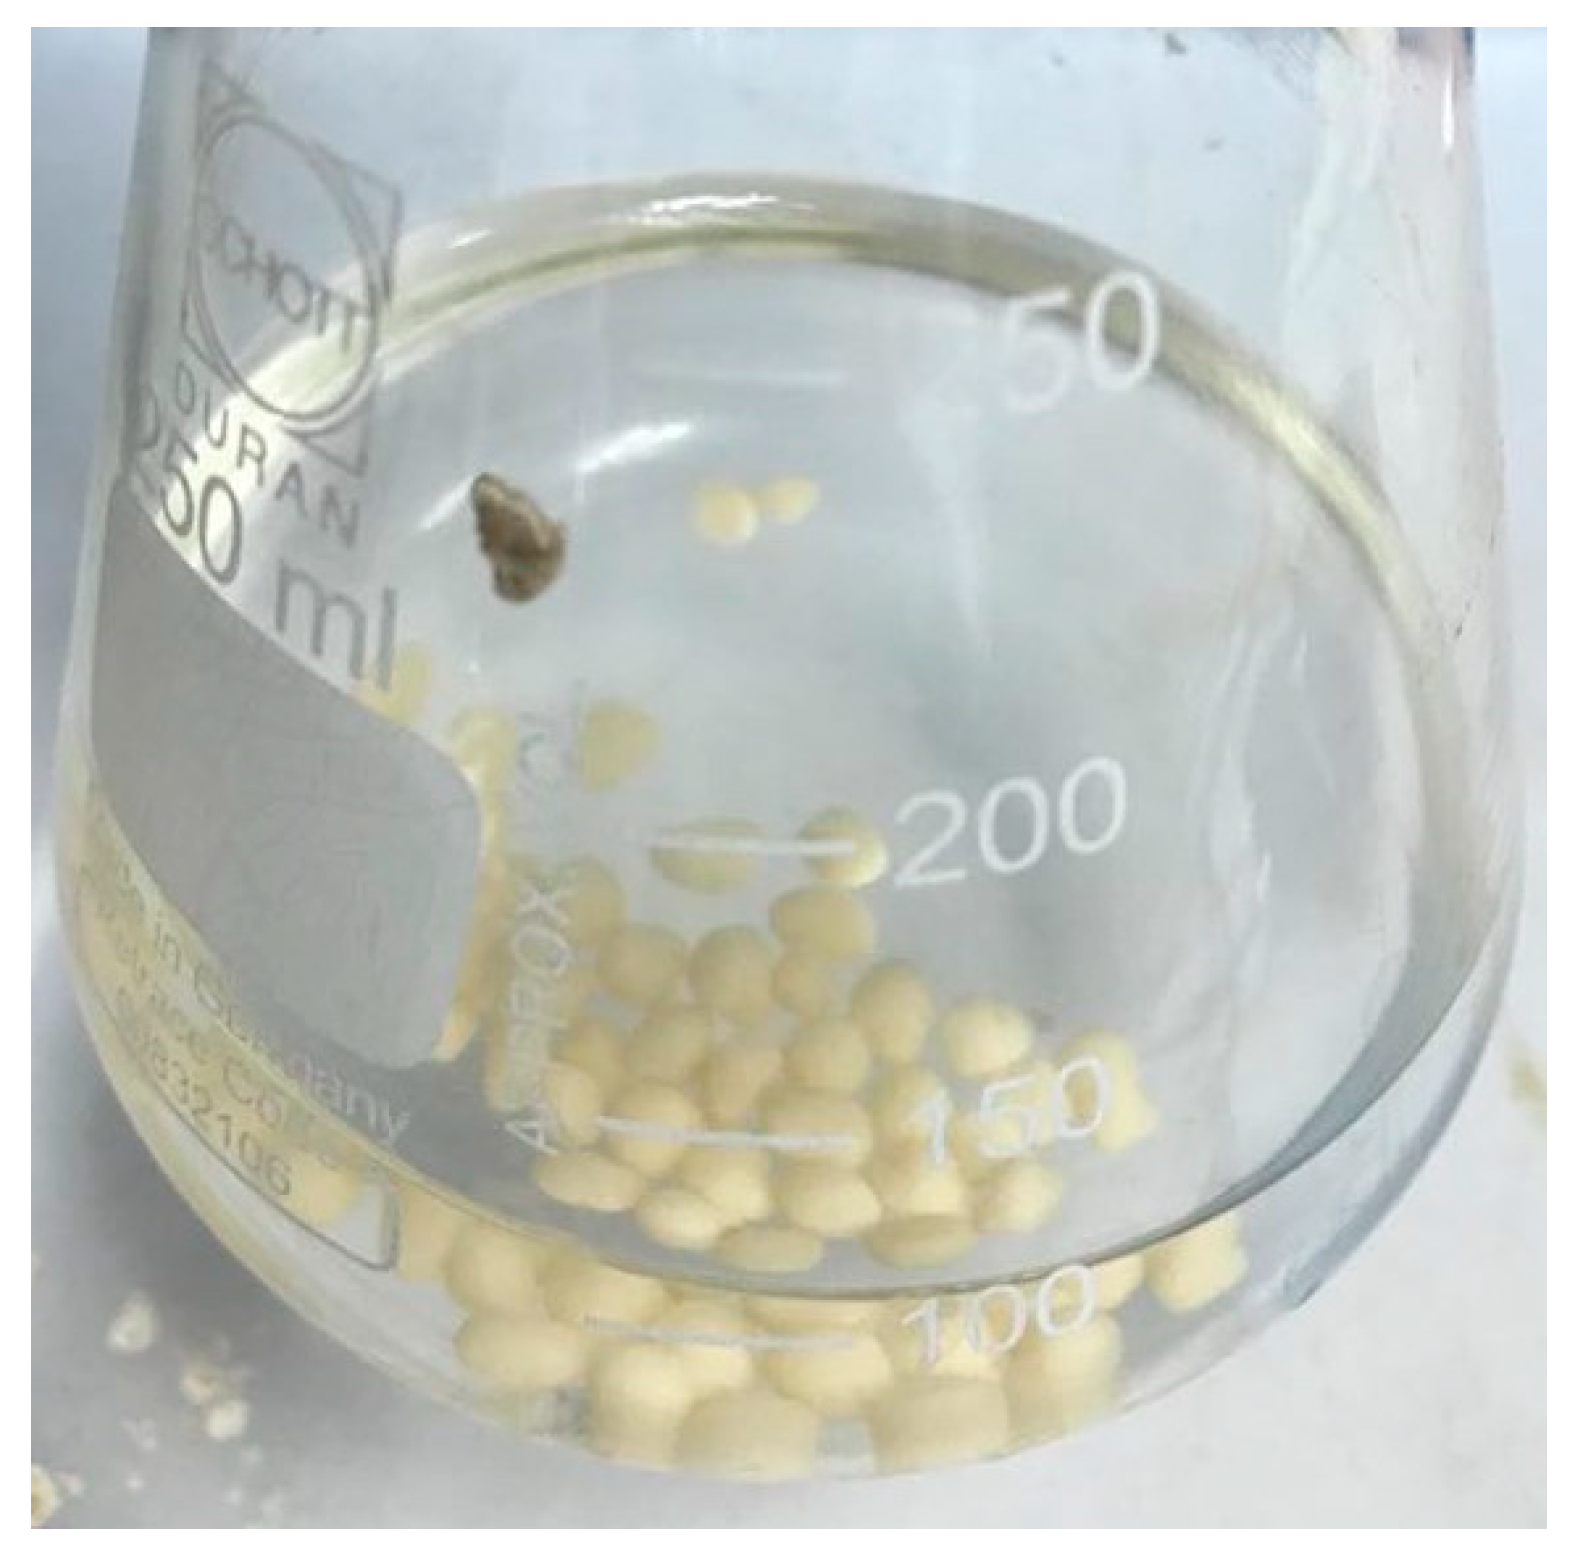
The maximal decolorization was accomplished by the desirability function technique. This technique incorporates the wants and needs for every one of the factors to construct a system for deciding the connection between the anticipated colour decolorization for every factor and the desirability of the reactions. The optimal conditions predicted by RSM were as follows: 130 mg/L of dye concentration, 1.478% of gellan gum concentration, 50 beads and 0.600 cm of beads size, which resulted in an overall 90.378% of dye decolorization with desirability value of 1 (Table 4). Figure 2 showed the immobilized mixed culture beads using gellan gum after optimization process. To verify this optimal condition, a validation experiment was performed according to the predicted condition obtained. The experimental result was compared with the given predicted value by measuring the deviation between both values. Verification experiments were performed at the predicted conditions, indicating the validity and adequacy of the predicted models. The results obtained through the validation of the experiment indicate the suitability of the developed quadratic models, and it may be noted that these optimal values are valid within the specified range of process parameters.

3.3. Response Surface Plots of the Affecting Parameters

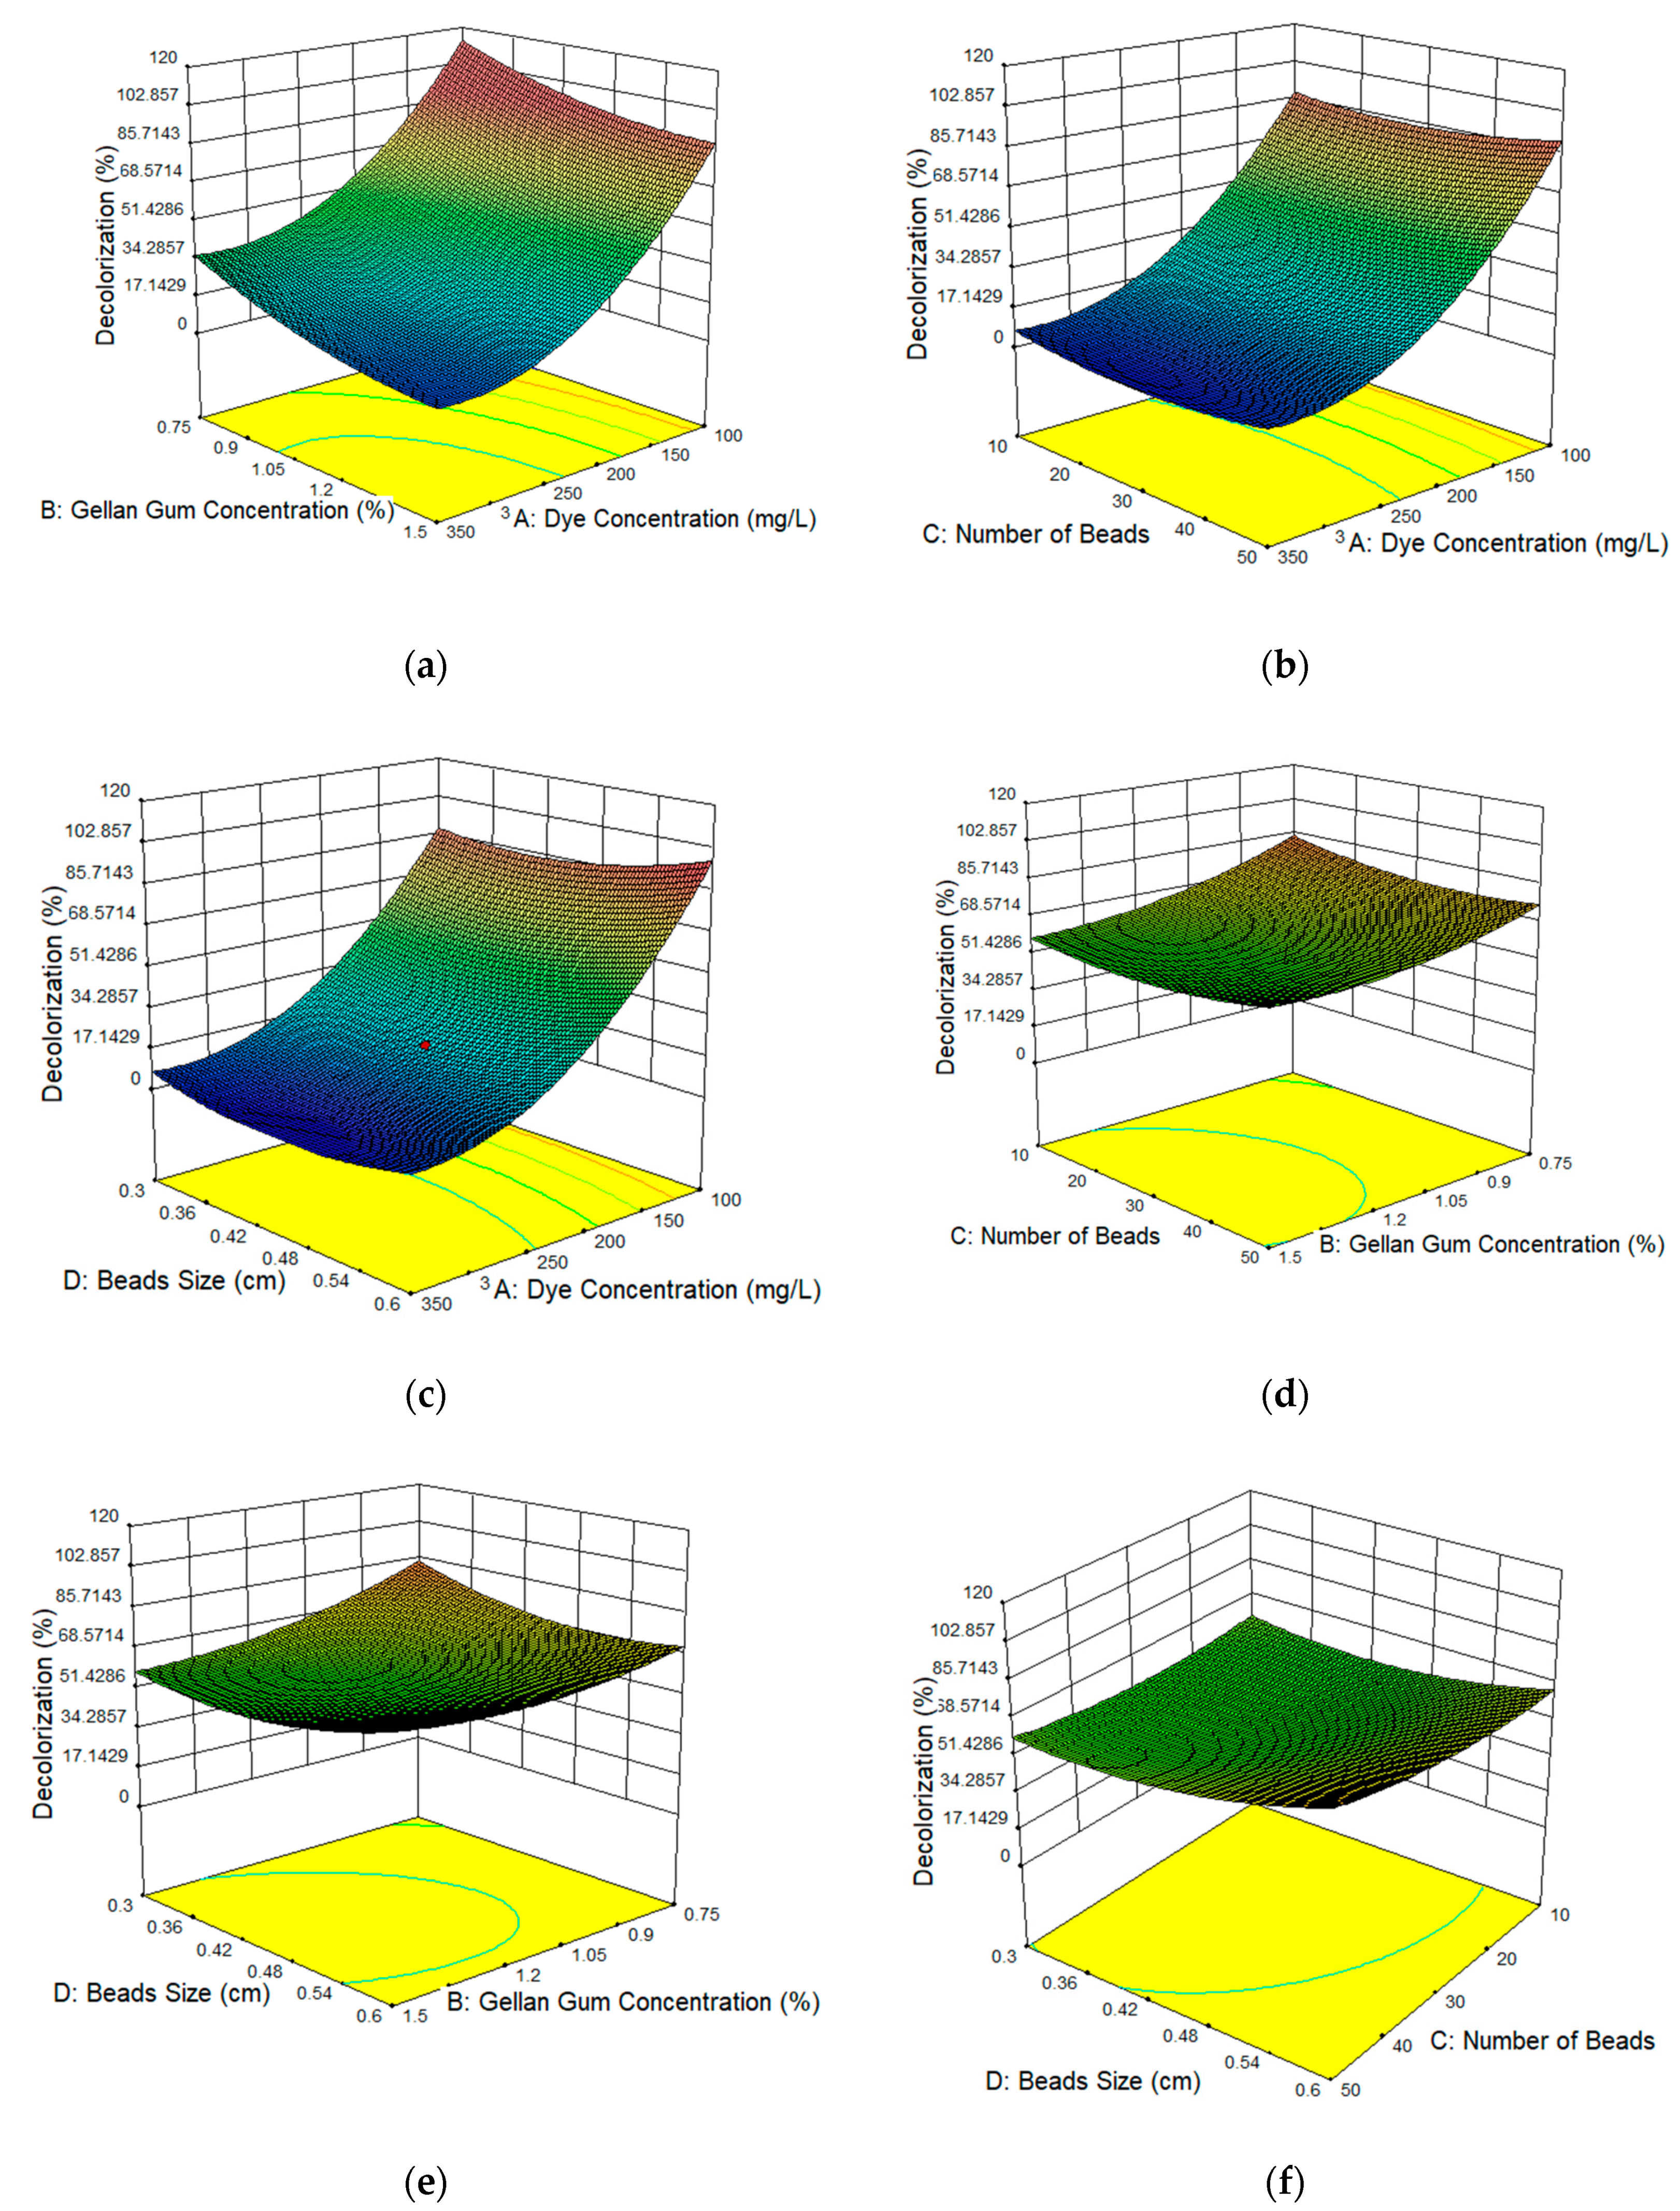
The surface response of quadratic models was applied to visualize the effects of each experimental parameter with two parameters maintained at the optimal value and the other two varying within the experimental ranges as depicted in Figure 3. The three-dimensional response surface plots are the graphical representations of the regression equation. The main goal of the response surface is to track efficiently for the optimum values of the variables such that the response is maximized. By analysing the plots, the best response range can be calculated. Figure 3a showed the 3D surface response of the interaction effect of the dye concentration and gellan gum concentration. The dye decolorization increased when the gellan gum and dye concentration were low. This gave a brief view that with the increasing concentration of gellan gum, the dye decolorization was affected. Optimum gelling gum concentration is needed as it is in charge of the mechanical power of the beads and the efficiency of the beads on decolorizing the dye.
Figure 3b showed the 3D surface response of the interaction effect of the number of beads and dye concentration. The dye decolorization increased when low dye concentration and high number of beads are used. By increasing the number of beads, this means more cell loading is used. This will in turn increase the capability of the beads to decolorize the dye. Figure 3c showed the interaction effect of bead size and dye concentration. The dye decolorization increased when low dye concentration and low bead size are used. The optimum bead size used is 0.6 cm. Small bead size indicates that surface area is small and this increases the biodegradation process [41]. Figure 3d showed the interaction between the gellan gum concentration and the number of beads. The highest dye decolorization was recorded when the low number of beads and gellan gum concentration were used. Figure 3e showed the interaction between the beads size and the gellan gum concentration. Low number of beads size and gellan gum concentration gave the highest dye decolorization. In Figure 3f, the interaction was between beads size and the number of beads. The optimum bead size, 0.6 cm with high number of beads, gave the highest dye decolorization.

3.4. Analysis of High Performance Liquid Chromatography (HPLC) and Fourier-Transform Infrared Spectroscopy (FTIR)

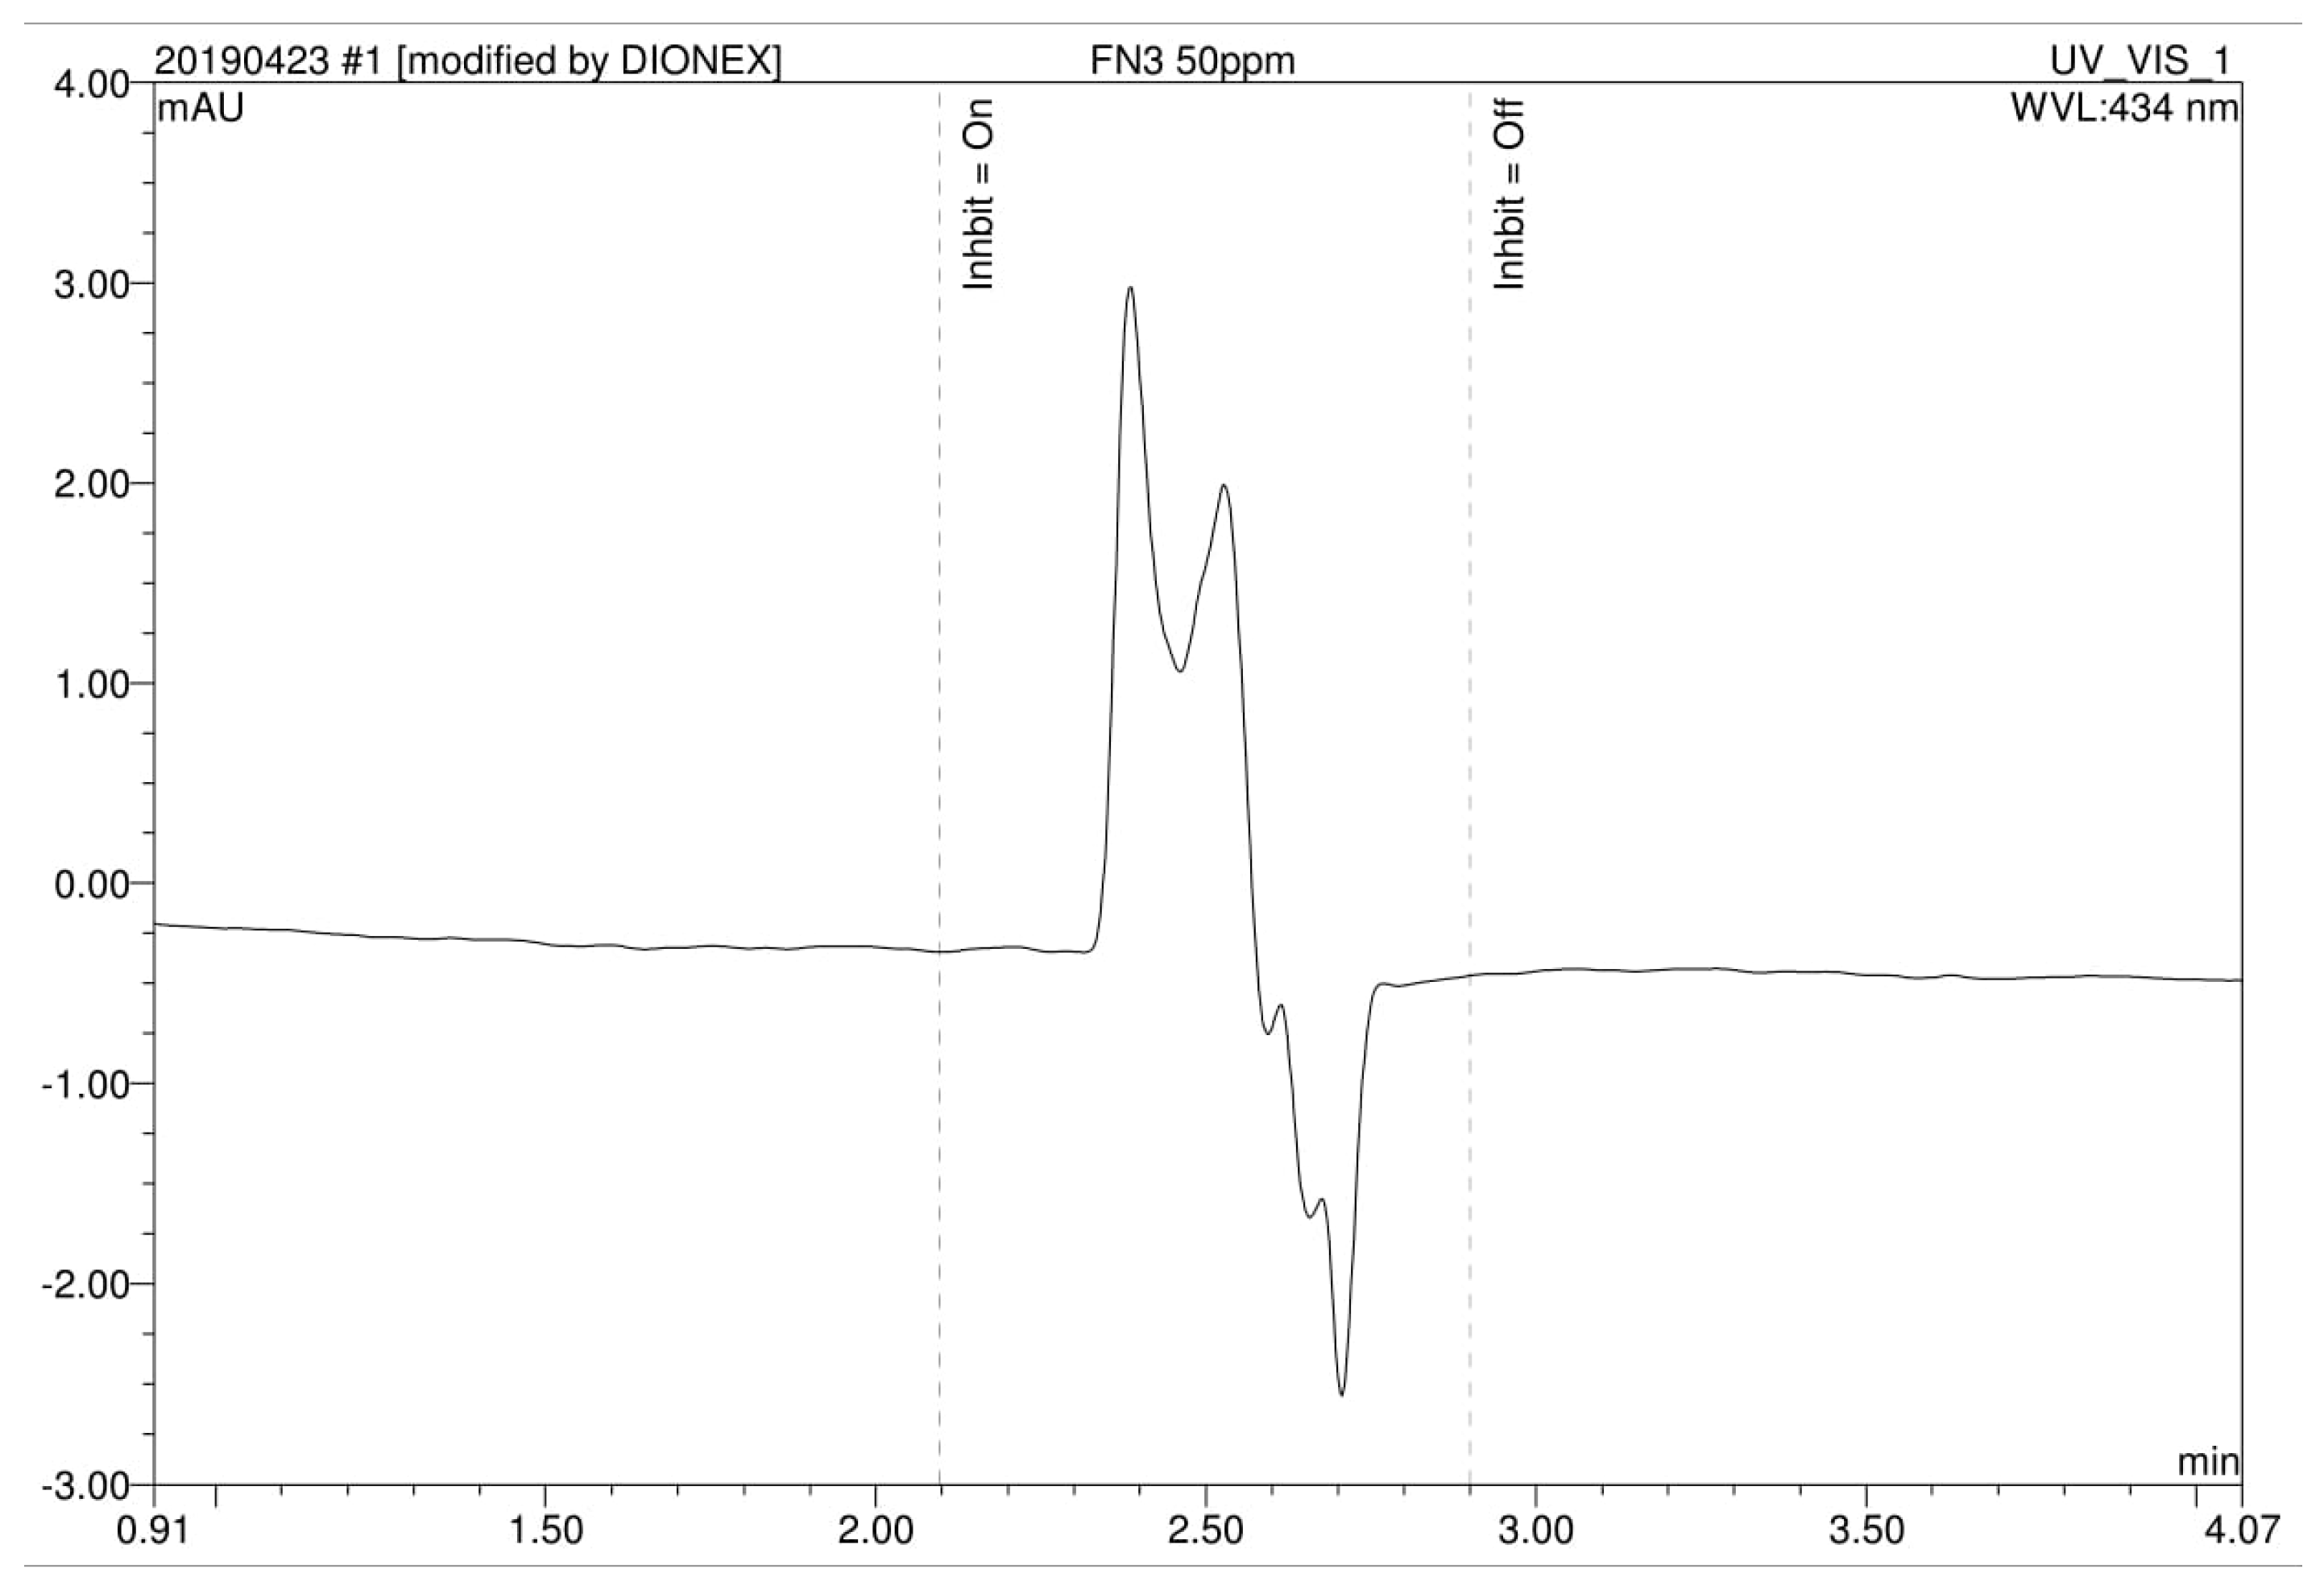
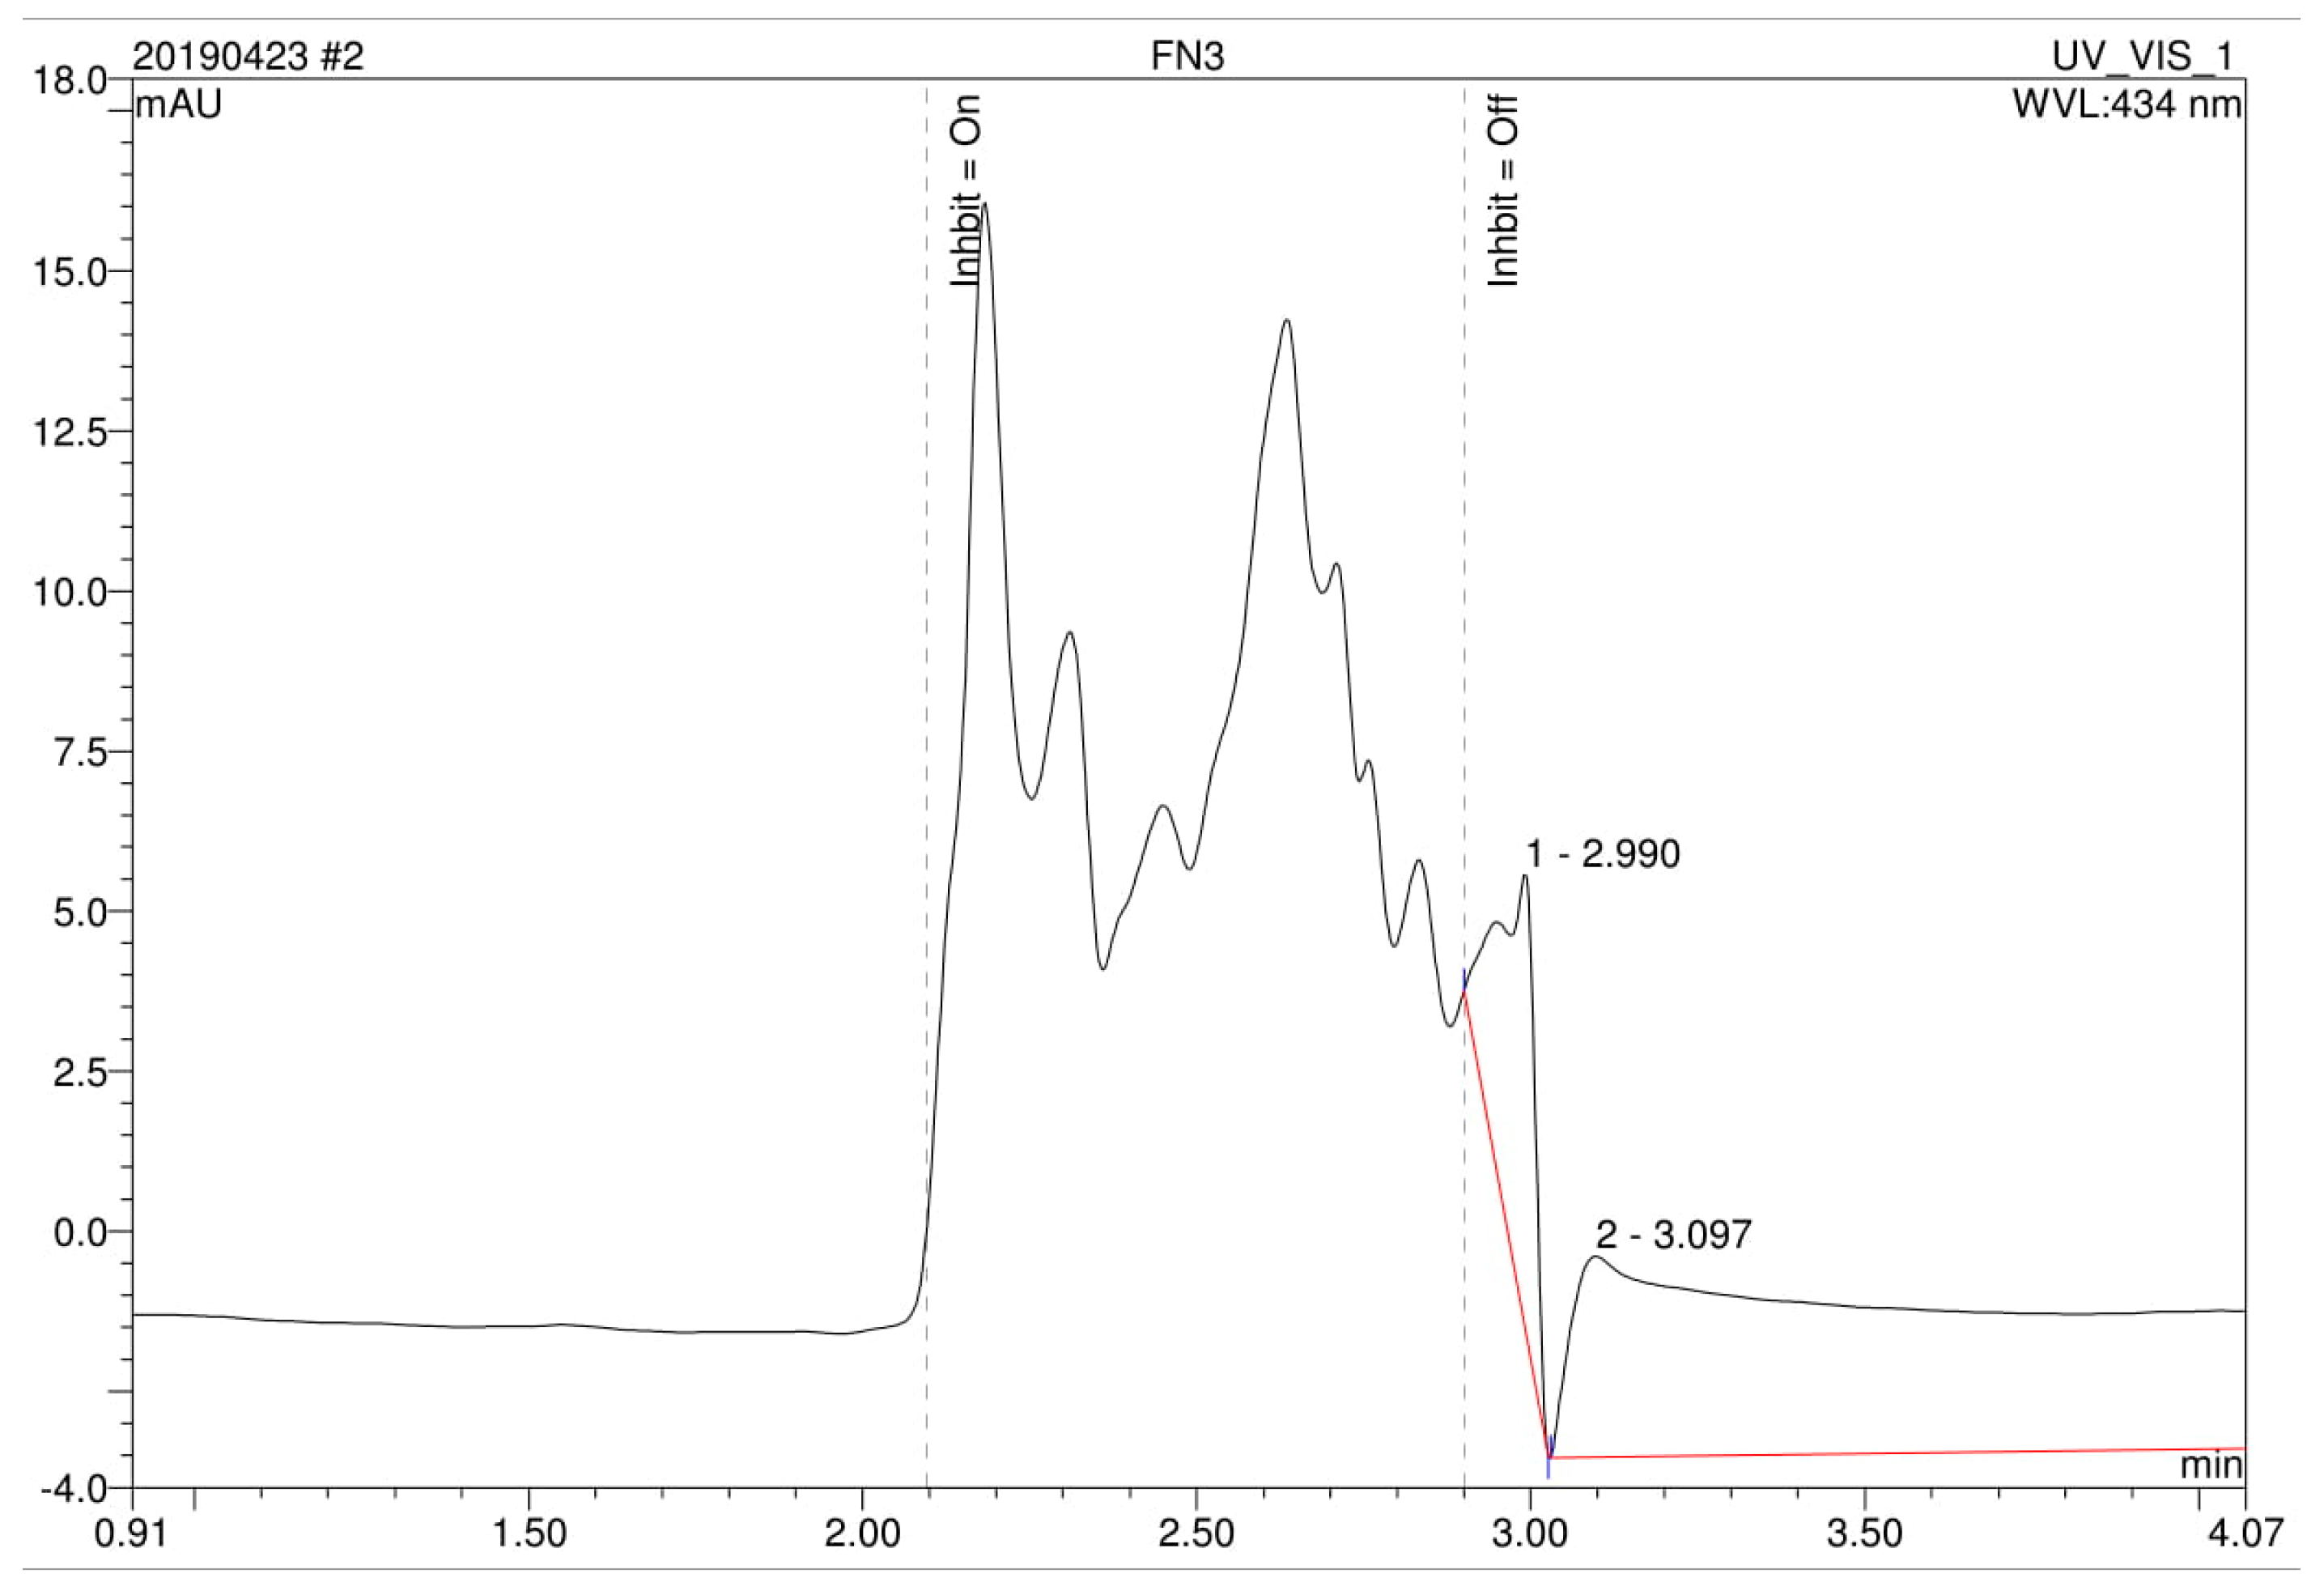
The HPLC analysis of Metanil Yellow dye (control) at 50 mg/L showed that two peaks appeared at retention time of 2.40 min and 2.60 min indicating that Metanil Yellow dye is not 100% pure (Figure 4). After the dye decolorization process, the disappearance of the peaks was seen in the case of controlled dye and formation of completely different peaks at retention time of 2.20 min, 2.30 min, 2.50 min and 2.70 min were observed in Figure 5. The appearance of new peaks in the decolorized dye products and disappearance of peaks in control dye support the Metanil Yellow dye decolorization by the mixed culture [28]. It is not confirmed whether the metabolite or the breakdown product formed is a low molecular weight nontoxic component or another toxic product which needs further analysis. From previous study of Metanil Yellow dye decolorization, peak of RT value 2.8 indicated metanilic acid [7]. However, in this study, negative peak can be seen at RT value of 2.8. This gave indication that in this study, the Metanil Yellow dye decolorization by mixed culture FN3 did achieve the metanilic acid formation. The negative peak could be due to the disturbance of the local equilibrium in the mobile phase and the stationary phase. The disturbance is created when a sample is injected.
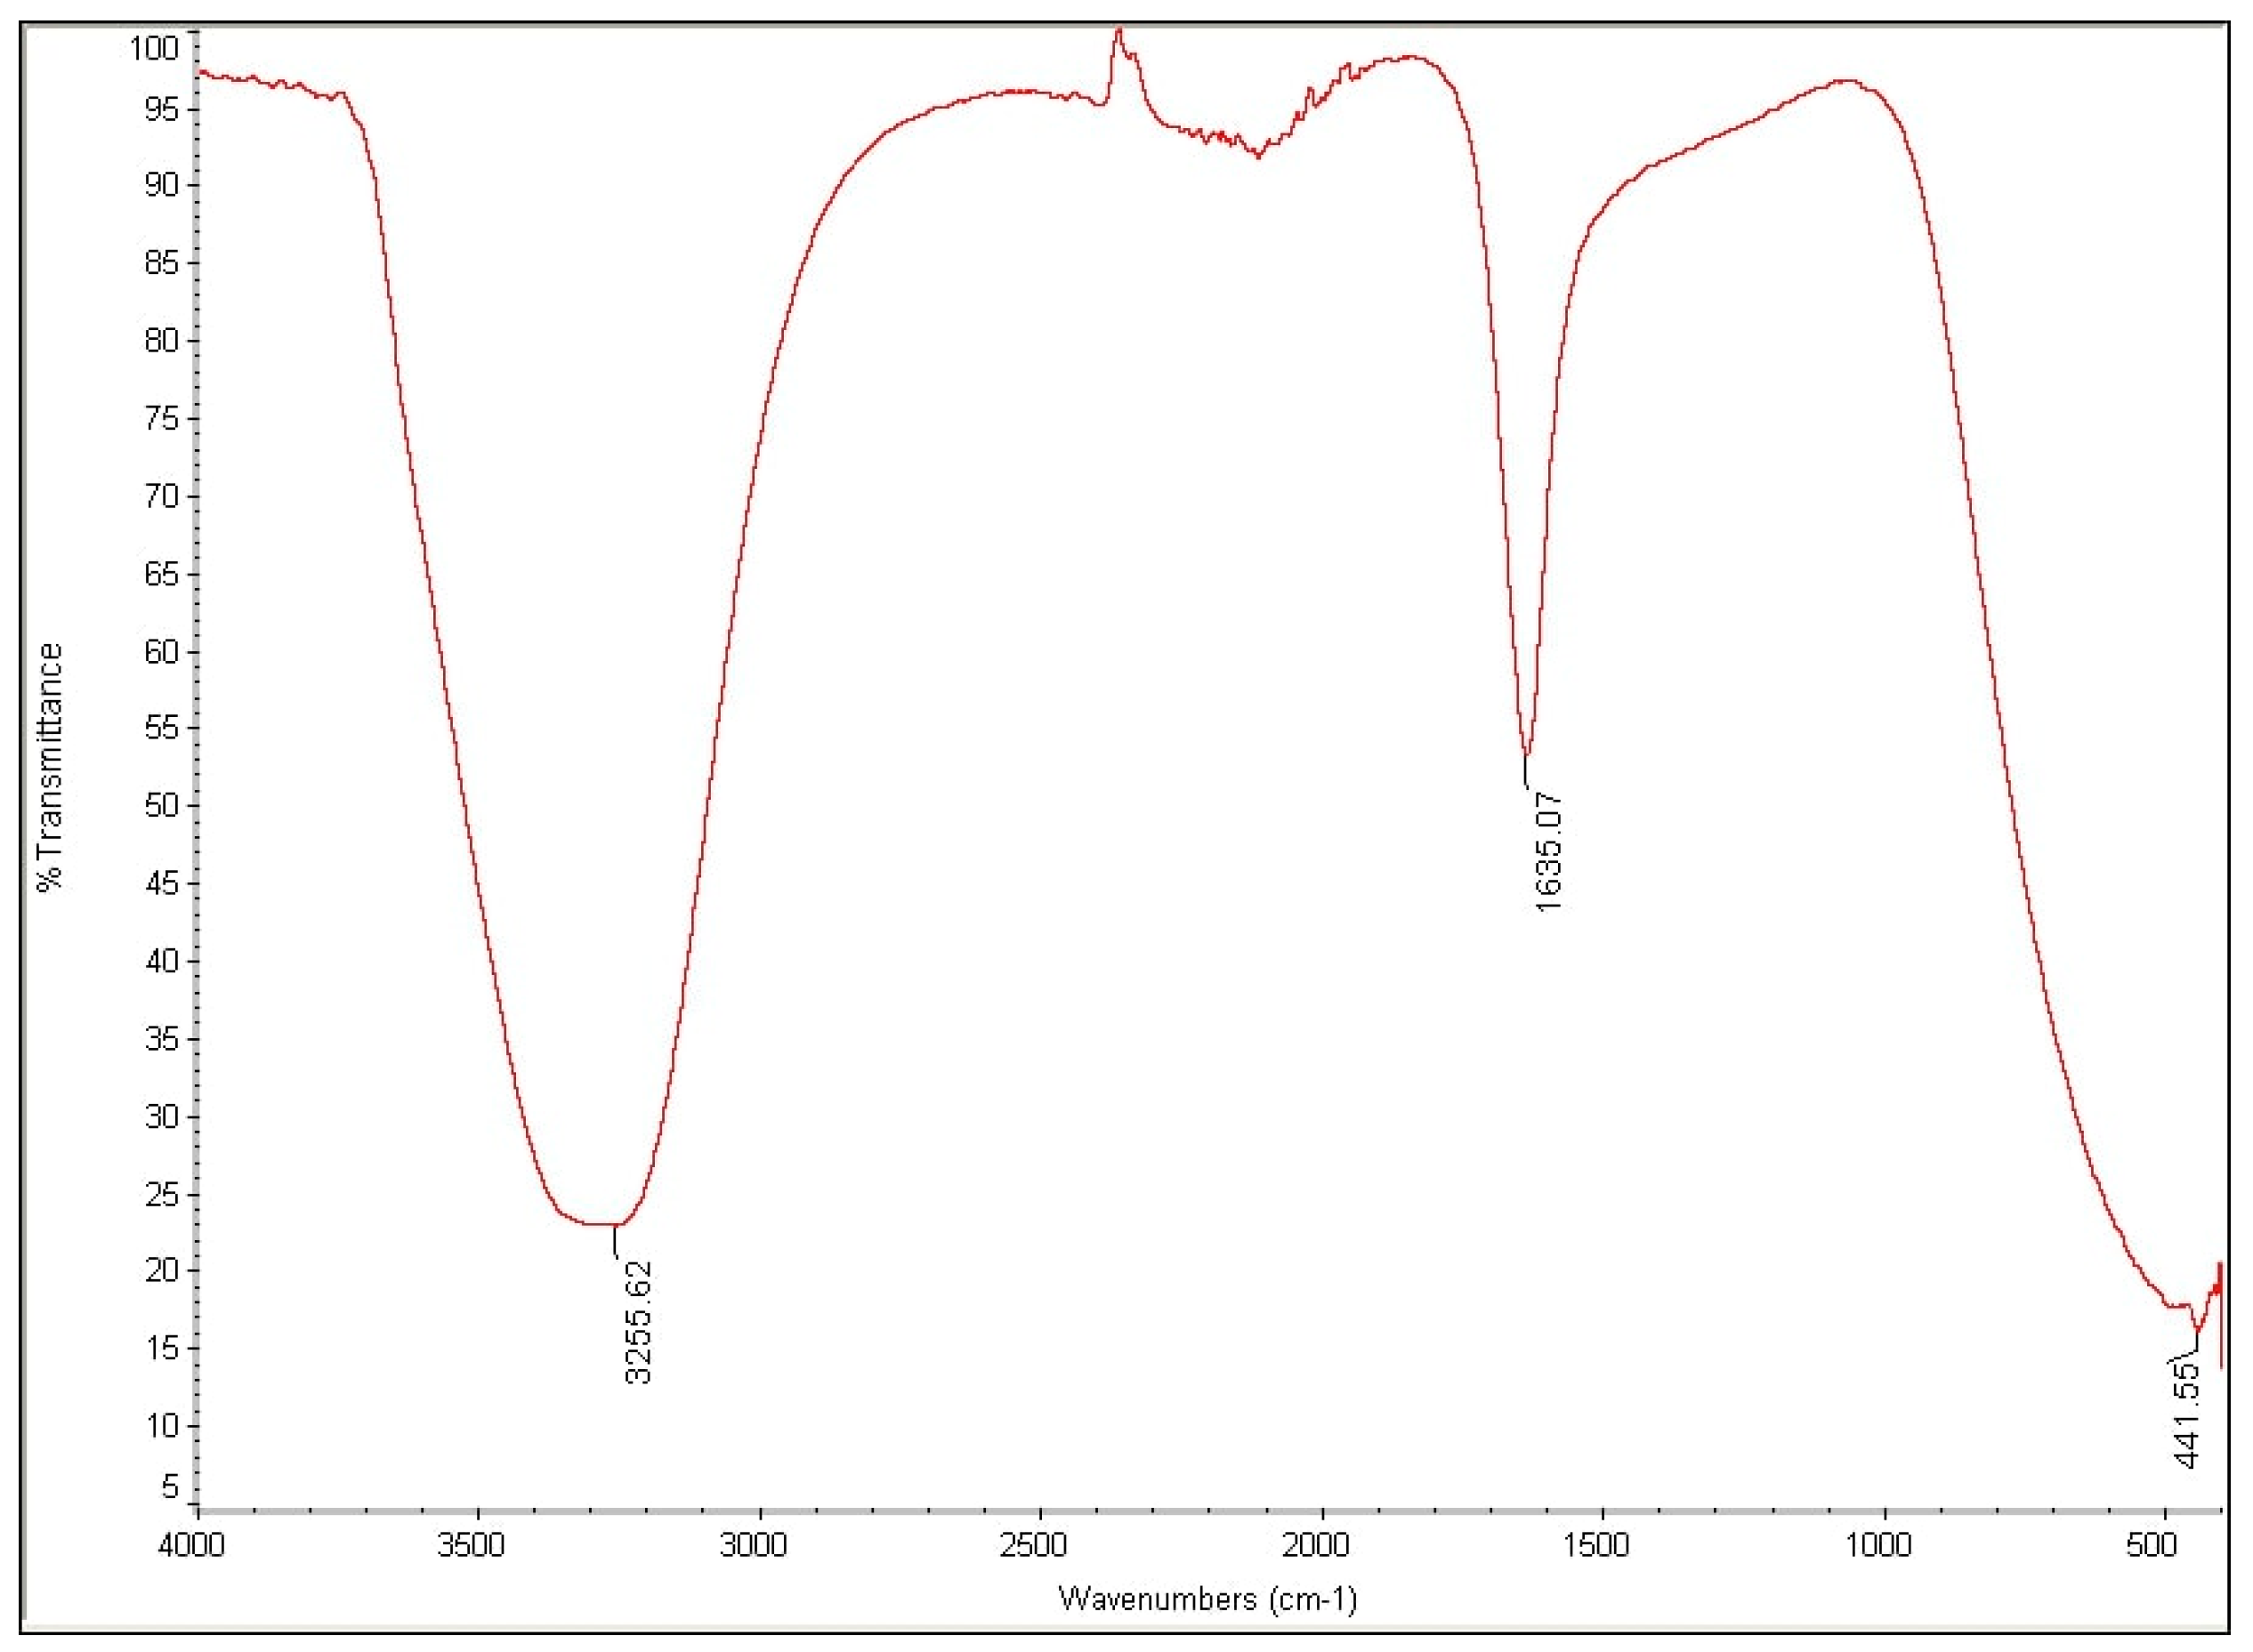
The FTIR spectrum of control dye Metanil Yellow showed peak of wavelength 1635.07 cm−1 that signified presence of (-N=N-) stretching as shown in Figure 6. There were variations in the peaks in the FTIR spectrum of metabolites extracted from decolorized sample of dye when compared to the control dye spectrum as in Figure 7. The absence of peaks with wavelength of 1635.07 cm−1 indicated the reductive cleavage of azo bond [30]. The wavelength of 1671.40 cm−1 indicated the aromatic stretch of C=C. It specified the stretching of benzene rings’ compounds of Metanil Yellow. Other peaks at wavelengths of 2325.84 cm−1, 1048.95 cm−1, 979.67 cm−1, 557.27 cm−1 and 431.08 cm−1 have formed and these changes were clear evidences of the decolorization of Metanil Yellow dye by the mixed culture. The peak of 1048.95 cm−1 indicated the C-N stretching whereas peak of 979.67 cm−1 indicated the bending of C=C [28,30,31]. The peak between 3500 and 3000 cm−1 gave indication of the stretching of (-NH) [42].

3.5. Reusability of the Immobilized Beads

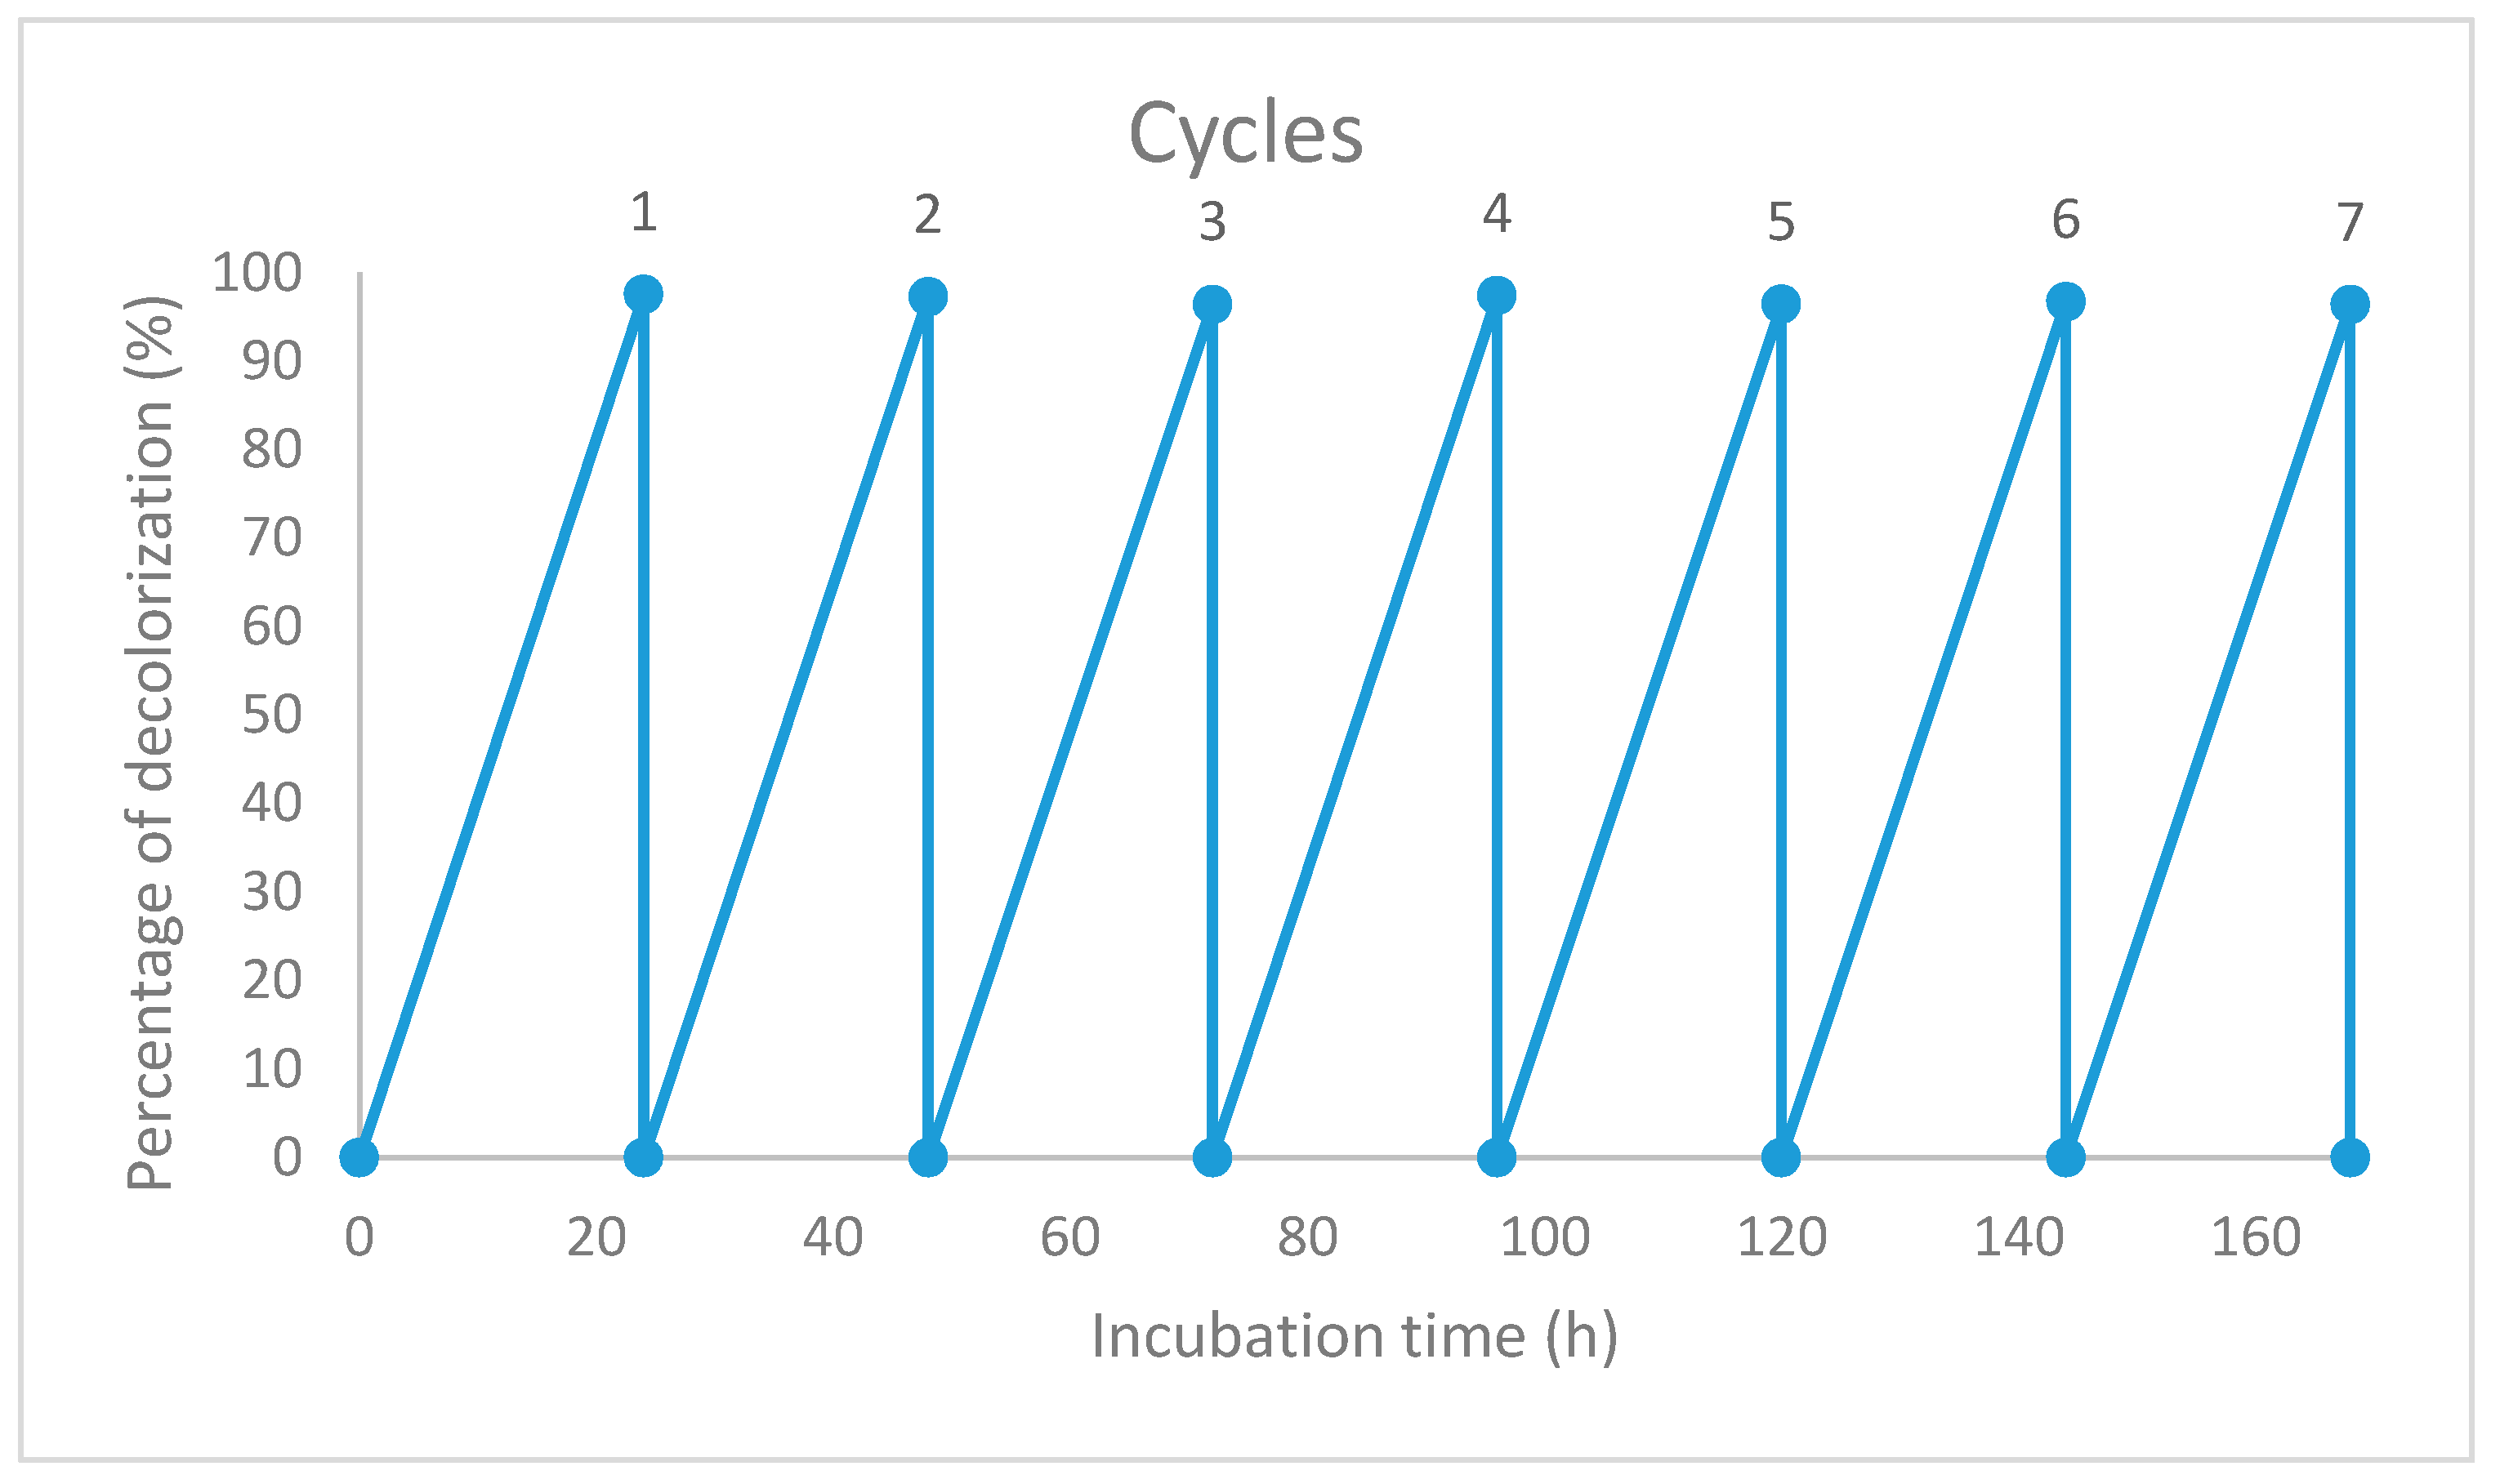
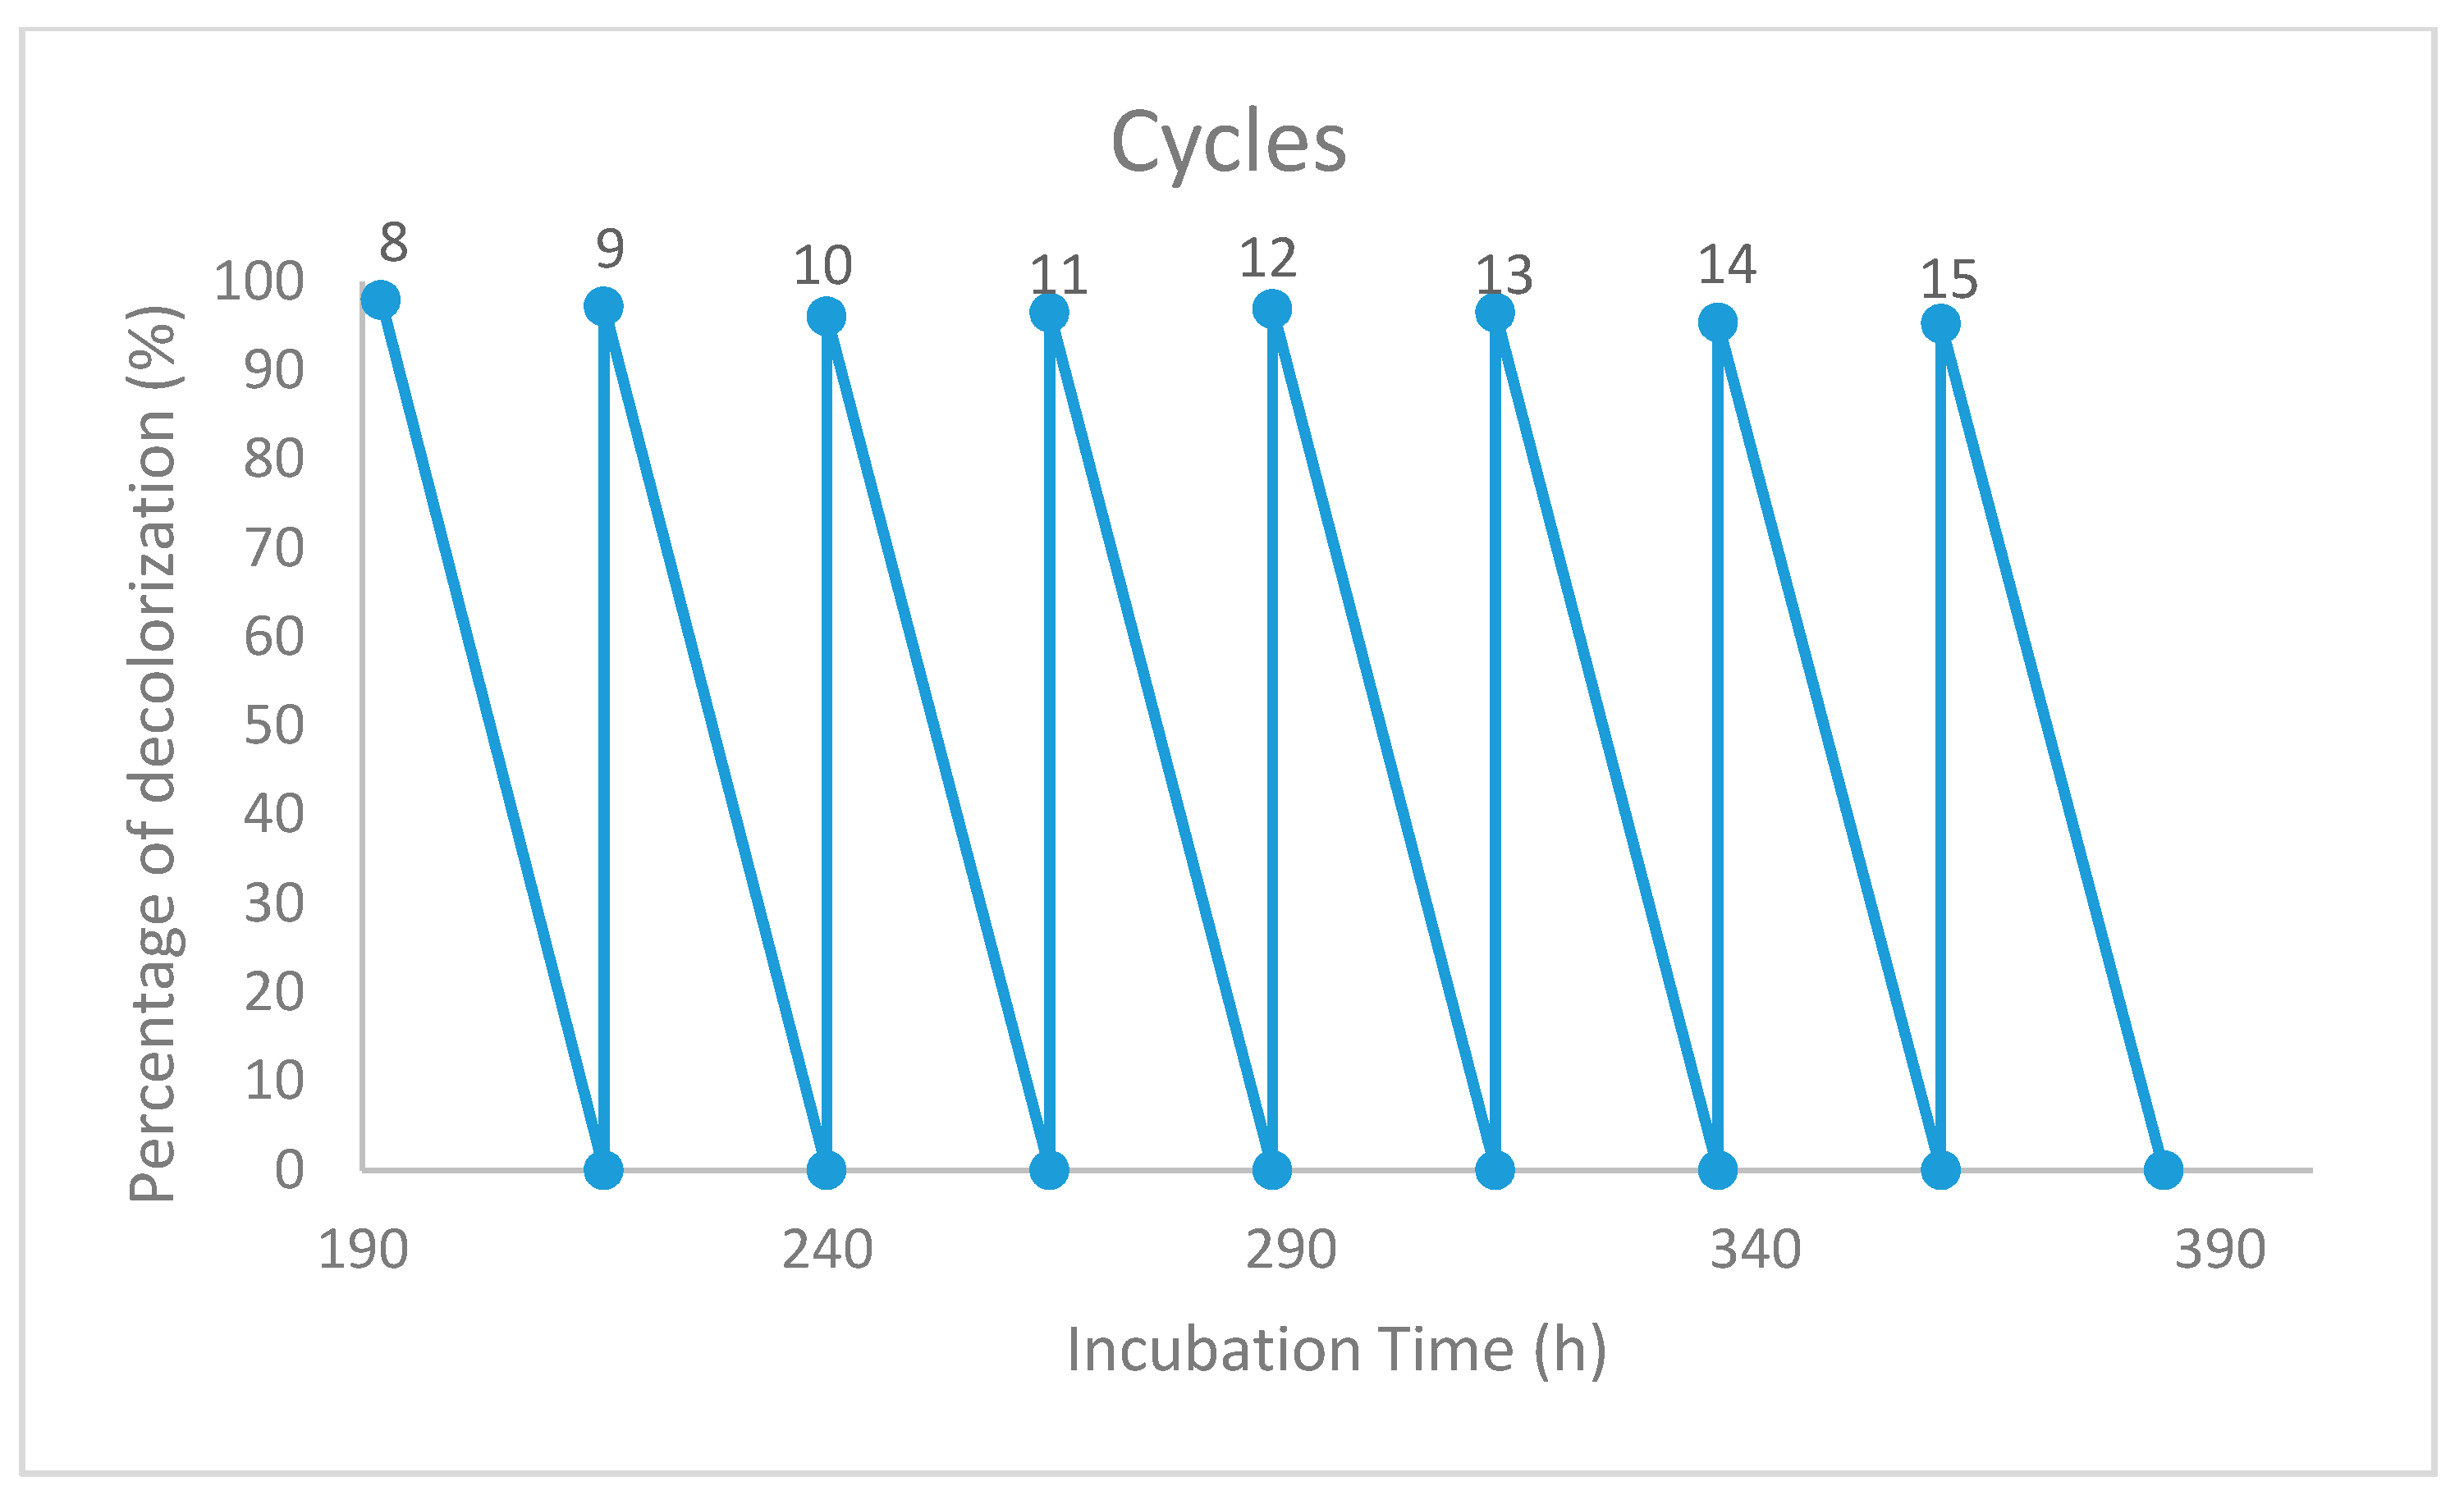
One of the advantages of immobilization is the reusability of the immobilized beads. These experiments were carried out to test the reusability of the gellan gum immobilized beads. Figure 8 and Figure 9 showed the decolorization profile of the immobilized beads with initial dye concentration of 50 mg/L. It is shown that the immobilized beads were able to be reused up to 15 cycles with complete dye decolorization in 24 h.
Studies on the reusability of immobilized beads have been carried out by Chang et al. (2000). In the study, immobilized Pseudomonas luteola with calcium alginate, k-carrageenan and polyacrylamide can be reused up to four times with 75, 85 and 80% of dye decolorization [43]. Another study has shown that the gellan gum immobilized beads were able to be reused up to 20 times without substantial loss of catalytic activity [44]. No data was available on the reusability of gellan gum immobilized cells in Metanil Yellow dye decolorization. Based on this study, the immobilized beads have showed positive results on its continuous use in dye decolorization. These immobilized beads of mixed culture FN3 could be used to decolorize Metanil Yellow dye up to 15 batches.
Nowadays, immobilization method has become one of the important measures to tackle bioremediation effectively. One of the immobilization techniques, encapsulation, has emerged as a promising solution to overcome practical limitations of using free cell formulations. A defined stable, consistent and protective microenvironment is provided by the polymeric matrix of the support material, where cells can survive and metabolic activity can be maintained for extended periods without the immediate release of a large number of cells. Better toleration towards numerous environmental stresses by the entrapped cells may be released after adaptation to surrounding environmental conditions [20].
The mechanical strength of immobilized cells depends on the types of matrices of immobilization used. In this study, gellan gum was chosen to immobilize the mixed culture of FN3. Gellan gum is an ionic heteropolysaccharide. It is also believed able to be used repetitively up to 20 batches without substantial loss of catalytic activity [44]. This proves that the durability of the beads is above adequate.

3.6. Scanning Electron Microscopy (SEM) of Immobilized Mixed Culture FN3

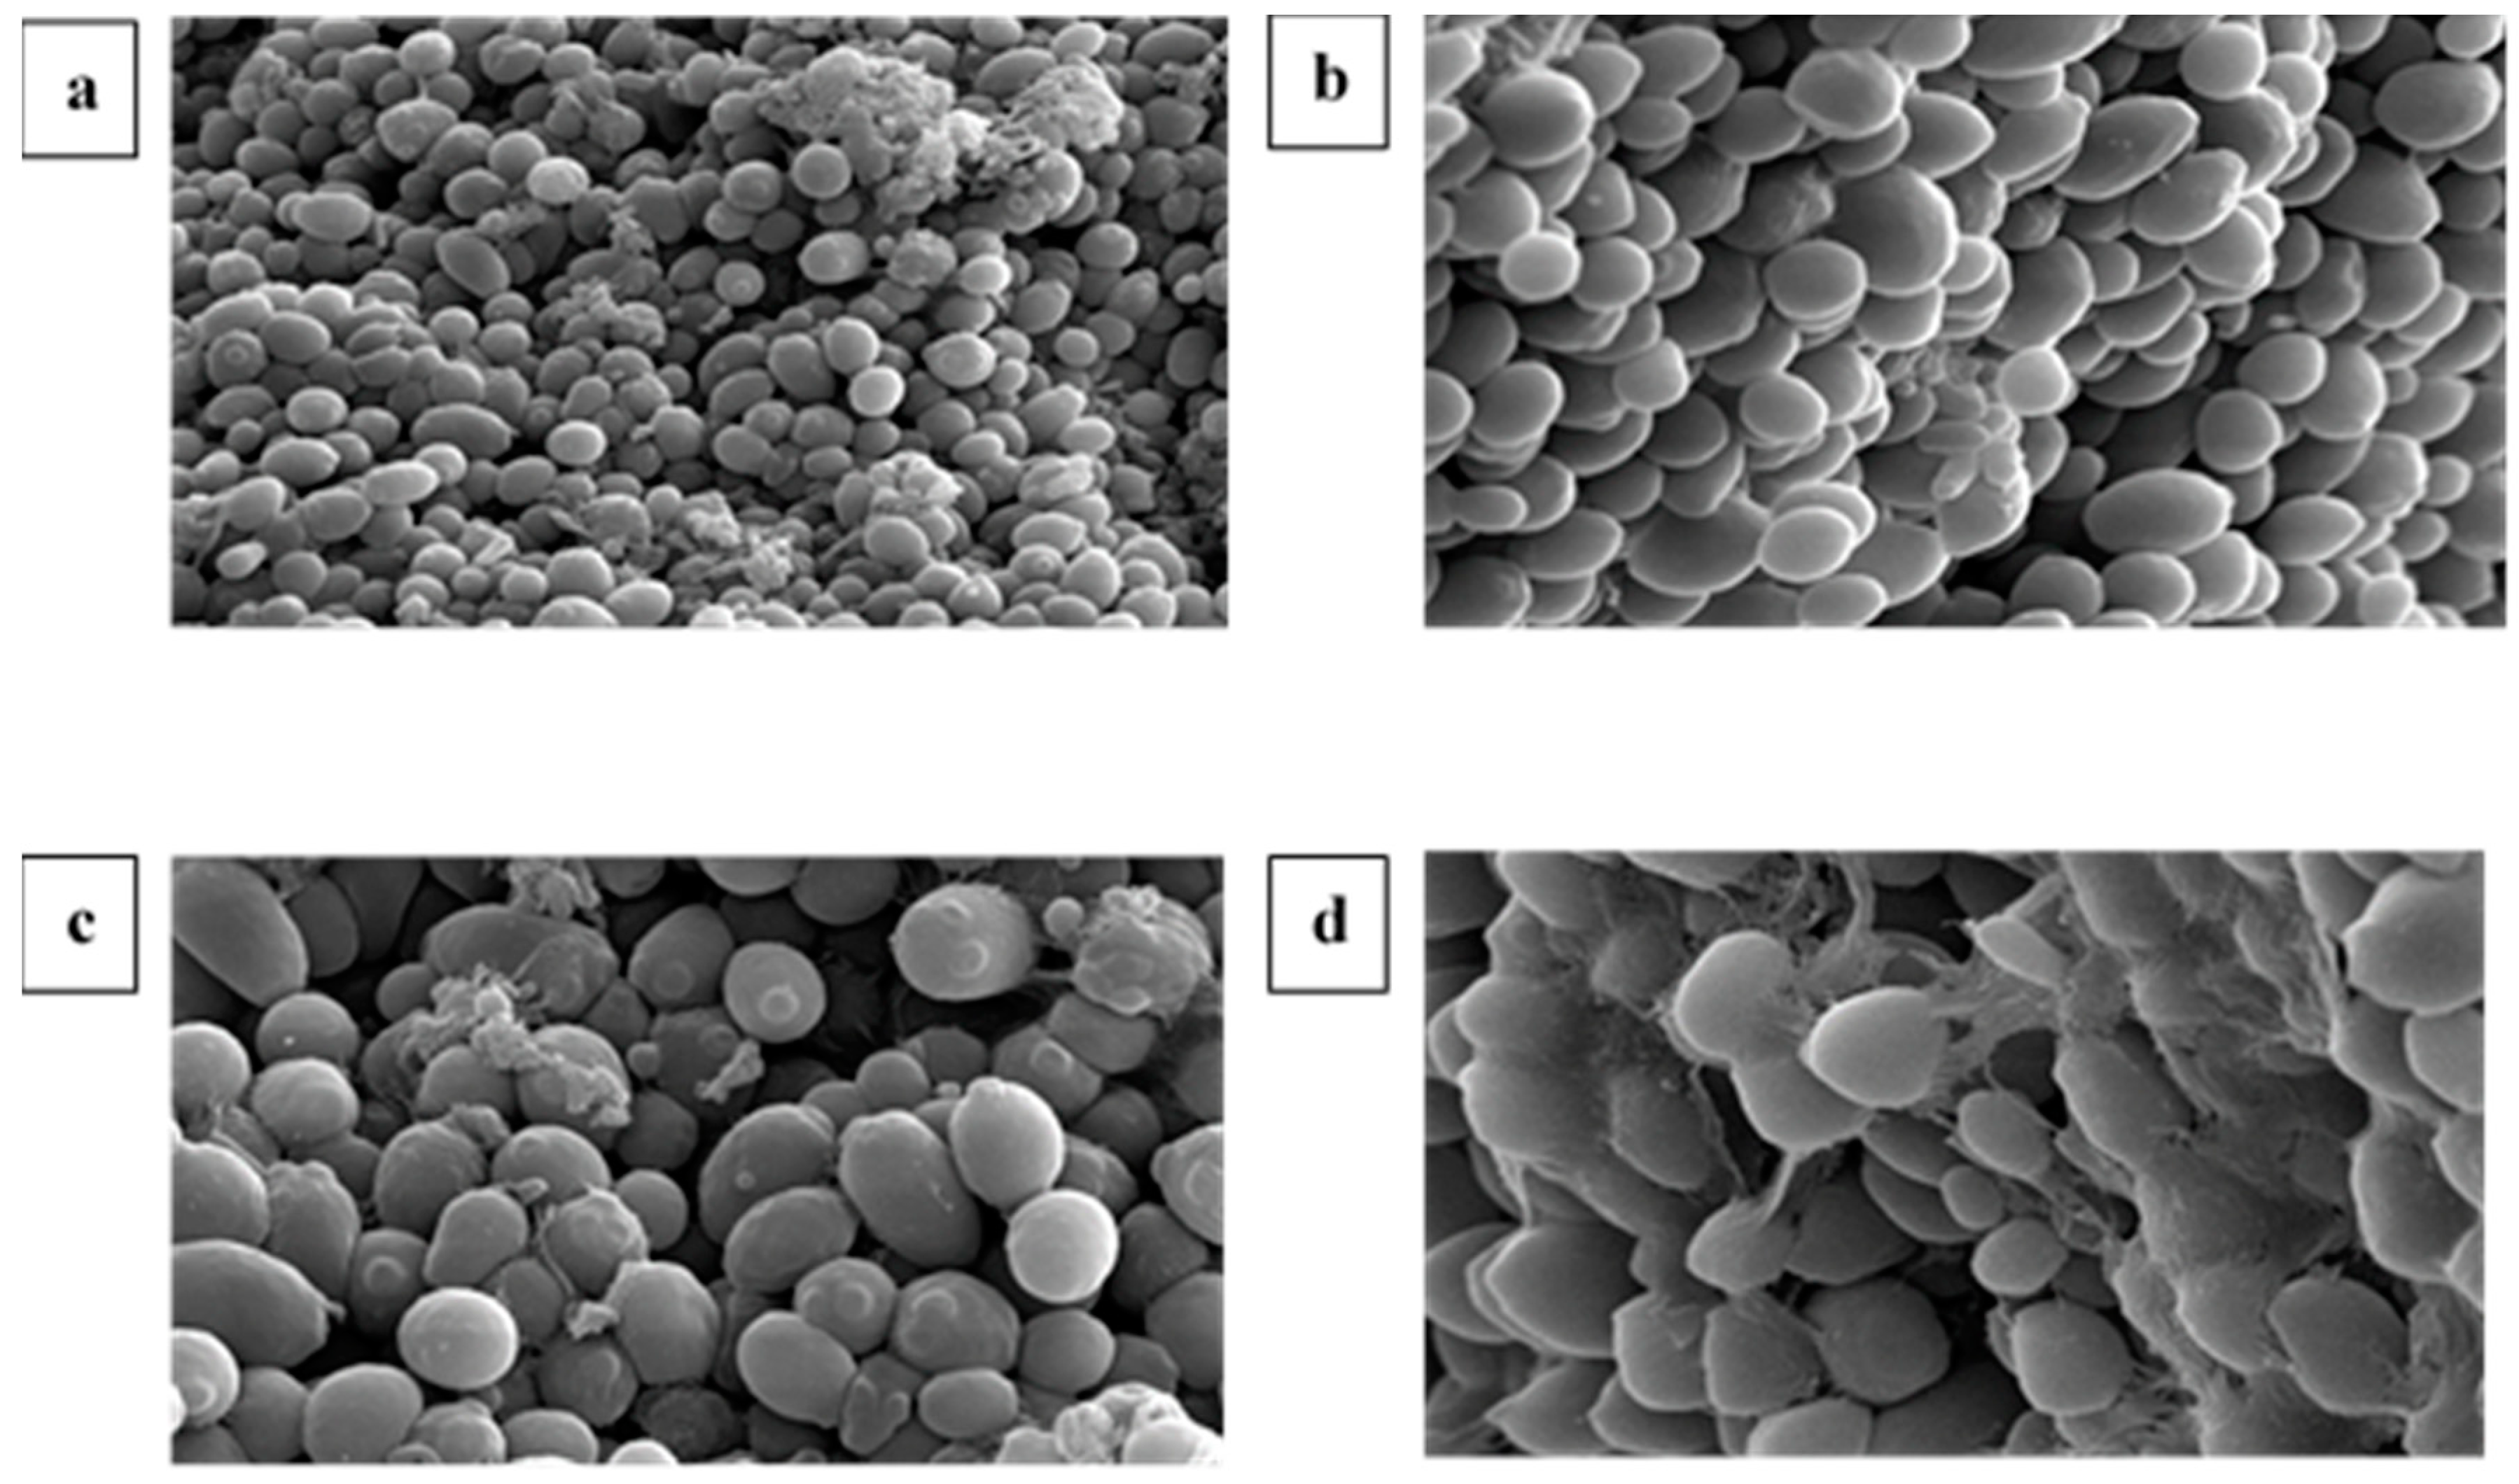
The SEM micrographs of mixed culture FN3 immobilized in gellan gum matrix were presented in Figure 10. The microscopic observation revealed that in Figure 10a, the mixed culture FN3 had been successfully entrapped in the gellan gum. In Figure 10b, the micrograph showed the mixed culture FN3 which is the rod-shaped bacterium and Candida sp budding. There are quite a number of studies regarding dye decolorization by yeast. From a study, Candida palmioleophila JKS4 isolated from activated sludge from wastewater treatment plants have been reported to be able to decolorize various types of azo dyes [45]. As identified from the metagenomics analysis, the most abundant percentage of bacteria in mixed culture FN3 was Bacillus sp. We can conclude that the rod-shaped bacterium in the microscopic observation was Bacillus sp. Bacillus sp was one of the early discovered bacteria with dye decolorizing [46]. In Figure 10c, the micrograph showed the cross-section of the gellan gum before the dye decolorization was performed. It was proven that the mixed culture FN3 was successfully immobilized in the gellan gum. The micrograph was compared with Figure 10d where Figure 10d showed the cross section of the beads after dye decolorization. The mixed culture FN3 was still entrapped within the gellan gum matrix even after Metanil Yellow dye decolorization. This indicated that the immobilized beads could be reused as the mixed culture was still available in the beads. This also proved that gellan gum has strong and rigid characteristic as immobilization matrix.

3.7. Effects of Metal Ions on Dye Decolorization of Immobilised FN3

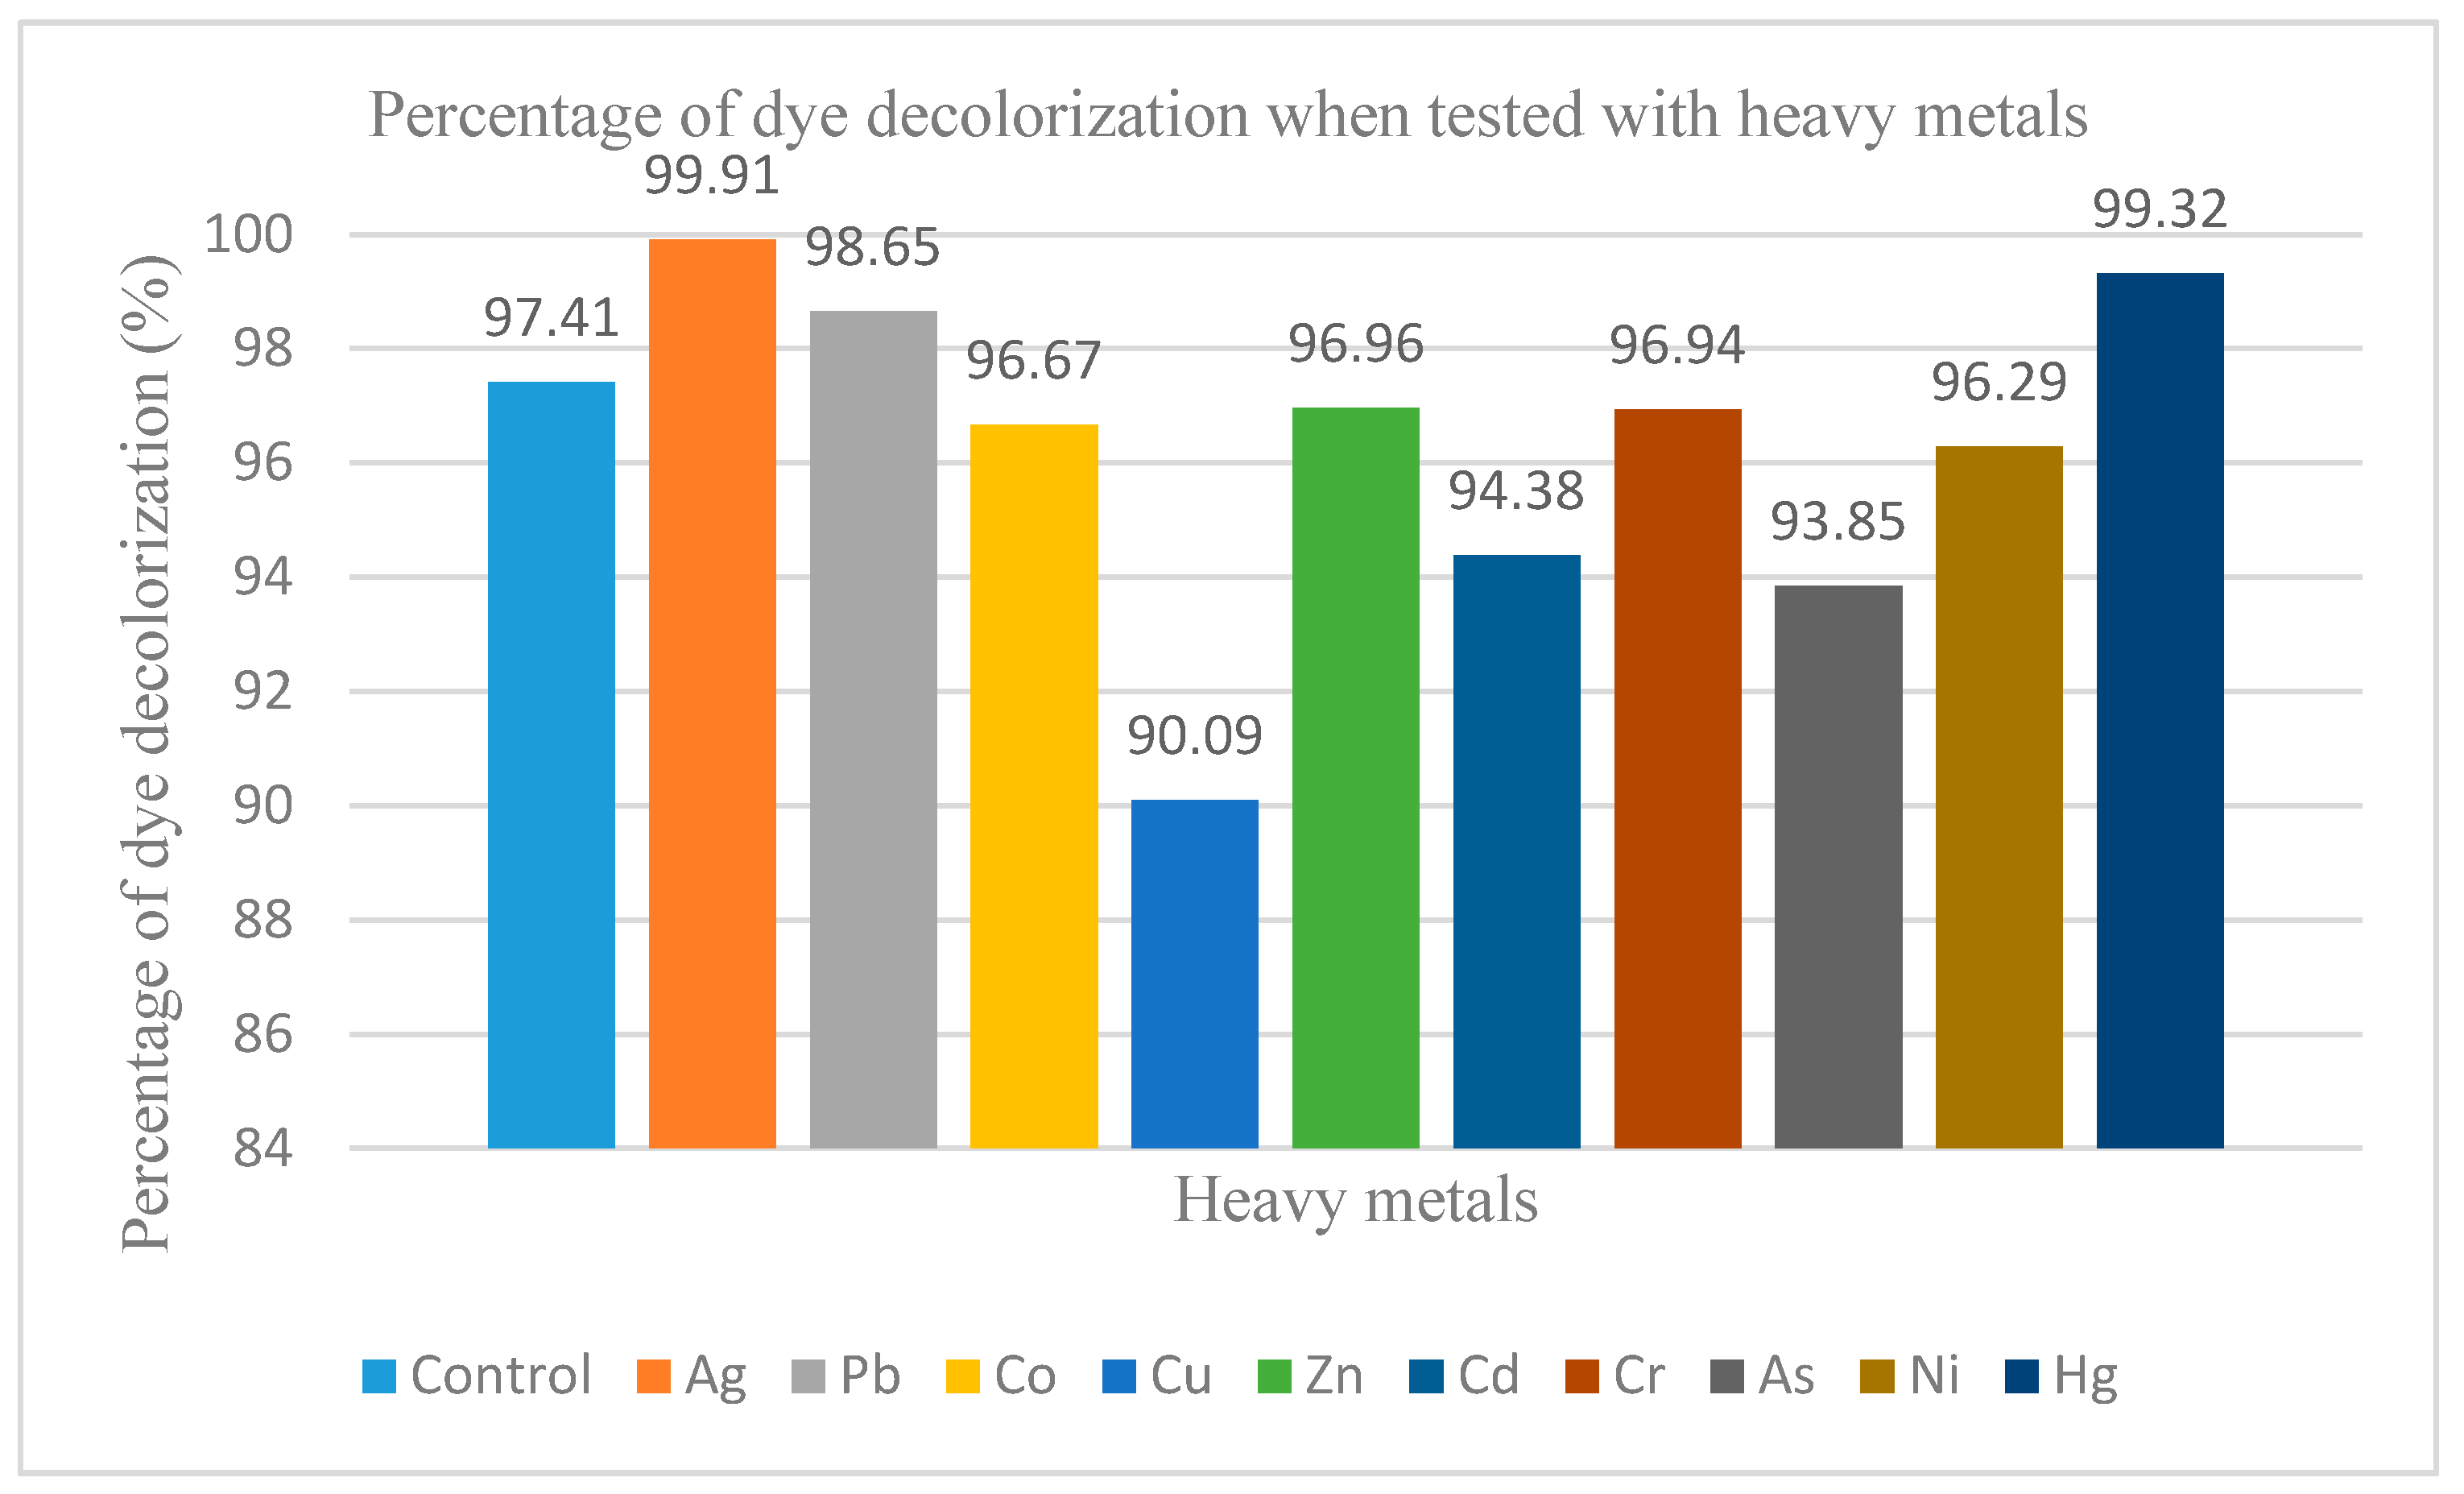
Heavy metals exist particularly in various contaminated sites. Bioremediation of certain pollutants is often affected by the presence of heavy metals. Thus, to determine the effects of the metal ions on decolorization, these experiments were performed. In this study, one mg/L of heavy metals such as nickel (Ni), copper (Cu), lead (Pb), chromium (Cr), silver (Ag), zinc (Zn), mercury (Hg) and arsenic (As) were used. Figure 11 demonstrated the percentage of dye decolorization of immobilized beads with the presence of heavy metals as listed. The medium with no addition of heavy metals served as control and the percentage of decolorization was high. Medium supplemented with Cu inhibited the dye decolorization of Metanil Yellow where the percentage of decolorization was 90.09%, which was the lowest compared to the others. Medium with the addition of Ag, Pb, Co, Zn, Cd, Cr, As, Ni and Hg gave 99.91%, 98.65%, 96.67%, 96.96%, 94.38%, 96.94%, 93.85%, 96.29% and 99.32% of dye decolorization, respectively.
Heavy metals are detrimental to microbes as they affect the enzymatic functions, act as redox catalysts in the production of reactive oxygen species (ROS), destruct the ion regulation and affect the DNA and protein production [47]. From the data observed, this shows that the immobilized beads of microbes have a high tolerance towards heavy metals as the metal ions do not have significant effects on the Metanil Yellow dye decolorization. Dye decolorization is achieved with the addition of most heavy metals such as Ag, Co, Pb, Zn, Cd, Cr, As, Ni and Hg. From this study, the mixed culture FN3 was able to tolerate the toxic effect of heavy metals to achieve decolorization. In this study, 90.09% of dye decolorization was achieved by immobilized beads when one ppm of Cu is added. The percentage of dye decolorization is low compared with the others. Thus, it may be related to the Cu inhibition of enzymes and metabolic pathways [48].

4. Conclusions

As for the conclusion, the mixed culture FN3 has been successfully immobilized using gellan gum. The optimization of the dye decolorization by the immobilized beads has been performed using Response Surface Methodology (RSM), an optimization method that has many advantages as compared to a conventional optimization method, One Factor at a Time (OFAT). The optimum conditions obtained are 130 mg/L of dye, 1.478% of gellan gum concentration, 50 beads and 0.6 cm of beads size with decolorization up to 90.38%. The immobilized beads are also tested for the reusability purpose and it is proven that gellan gum immobilized beads are able to be reused up to 15 batches of dye decolorization without loss of decolorizing activity. The effects of heavy metals ions are also tested with the immobilized beads. From the data, most of the heavy metals do not give a significant effect on the Metanil Yellow dye decolorization. Therefore, the findings from the study established the fact that technology of immobilization could be chosen as a practical strategy to enhance the working performance of bioremediation of Metanil Yellow dye.

Author Contributions

Conceptualization, M.I.E.H.; methodology, F.N.A.M.; software, M.I.E.H. and M.Y.A.S.; validation, M.I.E.H.; formal analysis, F.N.A.M.; investigation, F.N.A.M.; resources, M.I.E.H.; data curation, M.I.E.H., and S.S.A.G.; writing-original draft preparation, F.N.A.M.; writing-review and editing, F.N.A.M. and M.I.E.H.; visualization, M.I.E.H. and F.N.A.M; supervision, M.I.E.H., S.B.A.W., M.Y.A.S., S.S.A.G., and K.M.; project administration, M.I.E.H.; funding acquisition, M.I.E.H.. All authors have read and agreed to the published version of the manuscript.

Funding

This project was financed by funds from Putra Grant (GP-IPM/2017/9532800) and Yayasan Pak Rashid Grant UPM (6300893-10201).

Institutional Review Board Statement

Not applicable.

Informed Consent Statement

Not applicable.

Data Availability Statement

The data presented in this study are available on request from the corresponding author. The data are not publicly available due to privacy.

Conflicts of Interest

The authors declare no conflict of interest.

References

  1. Chang, J.-S.; Chou, C.; Lin, Y.-C.; Lin, P.-J.; Ho, J.-Y.; Hu, T.-L. Kinetic characteristics of bacterial azo-dye decolorization by Pseudomonas luteola. Water Res. 2001, 35, 2841–2850. [Google Scholar] [CrossRef]
  2. Singh, R.P.; Singh, P.K.; Singh, R.L. Bacterial Decolorization of Textile Azo Dye Acid Orange by Staphylococcus hominis RMLRT03. Toxicol. Int. 2014, 21, 160–166. [Google Scholar] [CrossRef] [Green Version]
  3. Puvaneswari, N.; Jayarama, M.; Gunasekaran, P. Toxicity assessment and microbial degradation of azo dyes. Indian J. Exp. Boil. 2006, 44, 618–626. [Google Scholar]
  4. Sarkar, S.; Banerjee, A.; Halder, U.; Biswas, R.; Bandopadhyay, R. Degradation of Synthetic Azo Dyes of Textile Industry: A Sustainable Approach Using Microbial Enzymes. Water Conserv. Sci. Eng. 2017, 2, 121–131. [Google Scholar] [CrossRef] [Green Version]
  5. Sudha, M.; Saranya, A.; Gopal, S.; Natesan, S. Microbial degradation of Azo Dyes: A review. Int. J. Curr. Microbiol. Appl. Sci. 2014, 3, 670–690. [Google Scholar]
  6. Sivashankar, R.; Velmurugan, S.; Sathya, A.B.; Pallipad, S. Biosorption of Hazardous Azo Dye Metanil Yellow using Immobilized Aquatic weed. In Proceedings of the International Conference on Future Trends in Structural, Civil, Environmental and Mechanical Engineering–FTCEM, Bangkok, Thailand, 13–14 July 2013. [Google Scholar]
  7. Anjaneya, O.; Souche, S.Y.; Santoshkumar, M.; Karegoudar, T.B. Decolorization of sulfonated azo dye Metanil Yellow by newly isolated bacterial strains: Bacillus sp. strain AK1 and Lysinibacillus sp. strain AK2. J. Hazard. Mater. 2011, 190, 351–358. [Google Scholar] [CrossRef]
  8. Ghosh, D.; Singha, P.; Firdaus, S.; Ghosh, S. Metanil yellow: The toxic food colorant. Asian Pac. J. Health Sci. 2017, 4, 65–66. [Google Scholar] [CrossRef]
  9. Aksu, Z.; Kılıç, N.K.; Ertuğrul, S.; Dönmez, G. Inhibitory effects of chromium(VI) and Remazol Black B on chromium(VI) and dyestuff removals by Trametes versicolor. Enzym. Microb. Technol. 2007, 40, 1167–1174. [Google Scholar] [CrossRef]
  10. Hao, O.; Kim, H.; Chiang, P.-C. Decolorization of Wastewater. Crit. Rev. Environ. Sci. Technol. 1999, 30, 449–505. [Google Scholar] [CrossRef]
  11. Moreira, R.; Peruch, M.G.; Kuhnen, N.C. Adsorption of textile dyes on alumina. Equilibrium studies and contact time effects. Braz. J. Chem. Eng. 1998, 15, 21–28. [Google Scholar] [CrossRef]
  12. Sarioglu, M.; Bali, U.; Bisgin, T. The removal of C.I. Basic Red 46 in a mixed methanogenic anaerobic culture. Dye. Pigments 2007, 74, 223–229. [Google Scholar] [CrossRef]
  13. Wang, H.; Su, J.; Zheng, X.; Tian, Y.; Xiong, X.; Zheng, T. Bacterial decolorization and degradation of the reactive dye Reactive Red 180 by Citrobacter sp. CK3. Int. Biodeter. Biodegr. 2009, 63, 395–399. [Google Scholar] [CrossRef]
  14. Pandey, A.; Singh, P.; Iyengar, L. Bacterial decolorization and degradation of azo dyes. Int. Biodeter. Biodegr. 2007, 59, 73–84. [Google Scholar] [CrossRef]
  15. Alabdraba, W.; Bayati, M. Biodegradation of Azo Dyes a Review. Int. J. Environ. Eng. Nat. Resour. 2014, 1, 179–189. [Google Scholar]
  16. Jain, K.; Shah, V.; Chapla, D.; Madamwar, D. Decolorization and degradation of azo dye–Reactive Violet 5R by an acclimatized indigenous bacterial mixed cultures-SB4 isolated from anthropogenic dye contaminated soil. J. Hazard. Mater. 2012, 213-214, 378–386. [Google Scholar] [CrossRef]
  17. Partovinia, A.; Rasekh, B. Review of the immobilized microbial cell systems for bioremediation of petroleum hydrocarbons polluted environments. Crit. Rev. Environ. Sci. Technol. 2018, 48, 1–38. [Google Scholar] [CrossRef]
  18. Unnikrishnan, S.; Ramamoorthi, P.; Sridhar, S. Studies on decolorization of malachite green using immobilized Pseudomonas putida. J. Chem. Pharm. Res. 2015, 7, 589–596. [Google Scholar]
  19. Ge, X.; Yang, L.; Xu, J. Cell Immobilization: Fundamentals, Technologies, and Applications. Ind. Biotechnol. 2017, 205–235. [Google Scholar] [CrossRef]
  20. Moslemy, P.; Guiot, S.R.; Neufeld, R.J. Encapsulation of bacteria for biodegradation of gasoline hydrocarbons. In Immobilization of Enzymes and Cells; Springer Science and Business Media LLC: Berlin/Heidelberg, Germany, 2006; pp. 415–426. [Google Scholar]
  21. Moslemy, P.; Neufeld, R.J.; Millette, D.; Guiot, S.R. Transport of gellan gum microbeads through sand: An experimental evaluation for encapsulated cell bioaugmentation. J. Environ. Manag. 2003, 69, 249–259. [Google Scholar] [CrossRef]
  22. Ashtaputre, A.A.; Shah, A.K. Studies on a Viscous, Gel-Forming Exopolysaccharide from Sphingomonas paucimobilis GS1. Appl. Environ. Microbiol. 1995, 61, 1159–1162. [Google Scholar] [CrossRef] [Green Version]
  23. Sharma, D.C.; Satyanarayana, T. A marked enhancement in the production of a highly alkaline and thermostable pectinase by Bacillus pumilus dcsr1 in submerged fermentation by using statistical methods. Bioresour. Technol. 2006, 97, 727–733. [Google Scholar] [CrossRef] [PubMed]
  24. Muliadi, F.N.A.; Halmi, M.I.E.; Abdul Wahid, S.; Abd Gani, S.S.; Uswatun, H.; Mahmod, K.; Abd Shukor, M.Y. Biostimulation of Microbial Communities from Malaysia Agriculture Soil for Detoxification of Metanil Yellow Dye; Response Surface Methodological Approach. Sustainability 2020. (Accepted). [Google Scholar]
  25. Survase, S.; Annapure, U.; Singhal, R.S. Gellan Gum as Immobilization Matrix for Production of Cyclosporin A. J. Microbiol. Biotechnol. 2010, 20, 1086–1091. [Google Scholar] [CrossRef]
  26. Murugesan, K.; Dhamija, A.; Nam, I.-H.; Kim, Y.-M.; Chang, Y.-S. Decolourization of reactive black 5 by laccase: Optimization by response surface methodology. Dyes Pigm. 2007, 75, 176–184. [Google Scholar] [CrossRef]
  27. Bezerra, M.A.; Santelli, R.E.; Oliveira, E.P.; Villar, L.S.; Escaleira, L.A. Response surface methodology (RSM) as a tool for optimization in analytical chemistry. Talanta 2008, 76, 965–977. [Google Scholar] [CrossRef] [PubMed]
  28. Lade, H.; Govindwar, S.; Paul, D. Low-Cost Biodegradation and Detoxification of Textile Azo Dye C.I. Reactive Blue 172 by Providencia rettgeri Strain HSL1. J. Chem. 2015, 2015, 894109. [Google Scholar] [CrossRef] [Green Version]
  29. Saratale, R.G.; Saratale, G.D.; Kalyani, D.C.; Chang, J.S.; Govindwar, S.P. Enhanced decolorization and biodegradation of textile azo dye Scarlet R by using developed microbial consortium-GR. Bioresour. Technol. 2009, 100, 2493–2500. [Google Scholar] [CrossRef]
  30. Ajaz, M.; Rehman, A.; Khan, Z.; Nisar, M.A.; Hussain, S. Degradation of azo dyes by Alcaligenes aquatilis 3c and its potential use in the wastewater treatment. AMB Express 2019, 9, 64. [Google Scholar] [CrossRef]
  31. Kurade, M.B.; Waghmode, T.R.; Jadhav, M.U.; Jeon, B.-H.; Govindwar, S.P. Bacterial–yeast consortium as an effective biocatalyst for biodegradation of sulphonated azo dye Reactive Red 198. RSC Adv. 2015, 5, 23046–23056. [Google Scholar] [CrossRef]
  32. He, F.; Hu, W.; Li, Y. Biodegradation Mechanisms and Kinetics of Azo Dye 4BS by a Microbial Consortium. Chemosphere 2004, 57, 293–301. [Google Scholar] [CrossRef]
  33. Ozdemir, G.; Pazarbasi, B.; Kocyigit, A.; Ersoy Omeroglu, E.; Yaşa, İ.; Karaboz, I. Decolorization of Acid Black 210 by Vibrio harveyi TEMS1 a Newly Isolated Bioluminescent Bacterium Enhanced Decolorization of Cibacron Red FN-2BL by Schizophyllum Commune from Izmir Bay. World J. Microbiol. Biotechnol. 2007, 24, 1375–1381. [Google Scholar] [CrossRef]
  34. Johari, W.L.W.; Isa, R.I.M.; Ghazali, N.; Arif, N.M.; Shukor, M.Y.A. Decolorization of Azo Dyes by Local Microorganisms. In Proceedings of the From Sources to Solution; Springer Science and Business Media LLC: Berlin/Heidelberg, Germany, 2013; pp. 357–361. [Google Scholar]
  35. El Ahwany, A.M.D. Decolorization of Fast red by metabolizing cells of Oenococcus oeni ML34. World J. Microbiol. Biotechnol. 2008, 24, 1521–1527. [Google Scholar] [CrossRef]
  36. Mansur, R.; Gusmanizar, N.; Roslan, M.A.H.; Ahmad, S.A.; Shukor, M.Y. Isolation and Characterisation of a Molybdenum-reducing and Metanil Yellow Dye-decolourising Bacillus sp. strain Neni-10 in Soils from West Sumatera, Indonesia. Trop. Life Sci. Res. 2017, 28, 69–90. [Google Scholar] [CrossRef] [PubMed]
  37. Sanusi, S.N.A.; Halmi, M.I.E.; Abdullah, S.R.S.; Hassan, H.A.; Hamzah, F.M.; Idris, M. Comparative process optimization of pilot-scale total petroleum hydrocarbon (TPH) degradation by Paspalum scrobiculatum L. Hack using response surface methodology (RSM) and artificial neural networks (ANNs). Ecol. Eng. 2016, 97, 524–534. [Google Scholar] [CrossRef]
  38. Halmi, M.I.E.b.; Abdullah, S.R.S.; Wasoh, H.; Johari, W.L.W.; Ali, M.S.b.M.; Shaharuddin, N.A.; Shukor, M.Y. Optimization and maximization of hexavalent molybdenum reduction to Mo-blue by Serratia sp. strain MIE2 using response surface methodology. Rendiconti Lincei 2016, 27, 697–709. [Google Scholar] [CrossRef]
  39. Toolabi, A.; Malakootian, M.; Taghi Ghaneian, M.; Esrafili, A.; Ehrampoush, M.; Askarishahi, M.; Tabatabaei, M.; Khatami, M. Optimizing the photocatalytic process of removing diazinon pesticide from aqueous solutions and effluent toxicity assessment via a response surface methodology approach. Rendiconti Lince- 2019, 30, 155–165. [Google Scholar] [CrossRef]
  40. Gunawan, E.; Basri, M.; Rahman, M.; Bakar Salleh, A.; Rahman, R. Study on response surface methodology (RSM) of lipase-catalyzed synthesis of palm-based wax ester. Enzym. Microb. Technol 2005, 37, 739–744. [Google Scholar] [CrossRef]
  41. Beshay, U. Production of alkaline protease by Teredinobacter turnirae cells immobilized in Ca-alginate beads. Afr. J. Biotechnol. 2003, 2, 60–65. [Google Scholar] [CrossRef] [Green Version]
  42. Pokharia, A.; Singh, S. Biodecolorization and degradation of xenobiotic azo dye -Basic Red 46 by Staphylococcus epidermidis MTCC 10623. Int. J. Res. Biosci. 2016, 5, 10–23. [Google Scholar]
  43. Chang, J.-S.; Chou, C.; Chen, S.-Y. Decolorization of azo dyes with immobilized Pseudomonas luteola. Process. Biochem. 2001, 36, 757–763. [Google Scholar] [CrossRef]
  44. Nallapan maniyam, M.; Latif Ibrahim, A.; Cass, T. Enhanced cyanide biodegradation by immobilized crude extract of Rhodococcus UKMP-5M. Environ. Technol. 2017, 40, 1–41. [Google Scholar] [CrossRef]
  45. Jafari, N.; Kasra-Kermanshahi, R.; Soudi, M.R. Screening, identification and optimization of a yeast strain, Candida palmioleophila JKS4, capable of azo dye decolorization. Iran J. Microbiol. 2013, 5, 434. [Google Scholar] [PubMed]
  46. Saratale, R.G.; Saratale, G.D.; Chang, J.S.; Govindwar, S.P. Bacterial decolorization and degradation of azo dyes: A review. J. Taiwan Inst. Chem. Eng. 2011, 42, 138–157. [Google Scholar] [CrossRef]
  47. Gauthier, P.T.; Norwood, W.P.; Prepas, E.E.; Pyle, G.G. Metal–PAH mixtures in the aquatic environment: A review of co-toxic mechanisms leading to more-than-additive outcomes. Aquat. Toxicol. 2014, 154, 253–269. [Google Scholar] [CrossRef] [PubMed]
  48. Shah, M.P.; Patel, K.A.; Nair, S.S.; Darji, A. Microbial decolorization of methyl orange dye by Pseudomonas spp. ETL-M. Int. J. Environ. 2013, 1, 54–59. [Google Scholar]
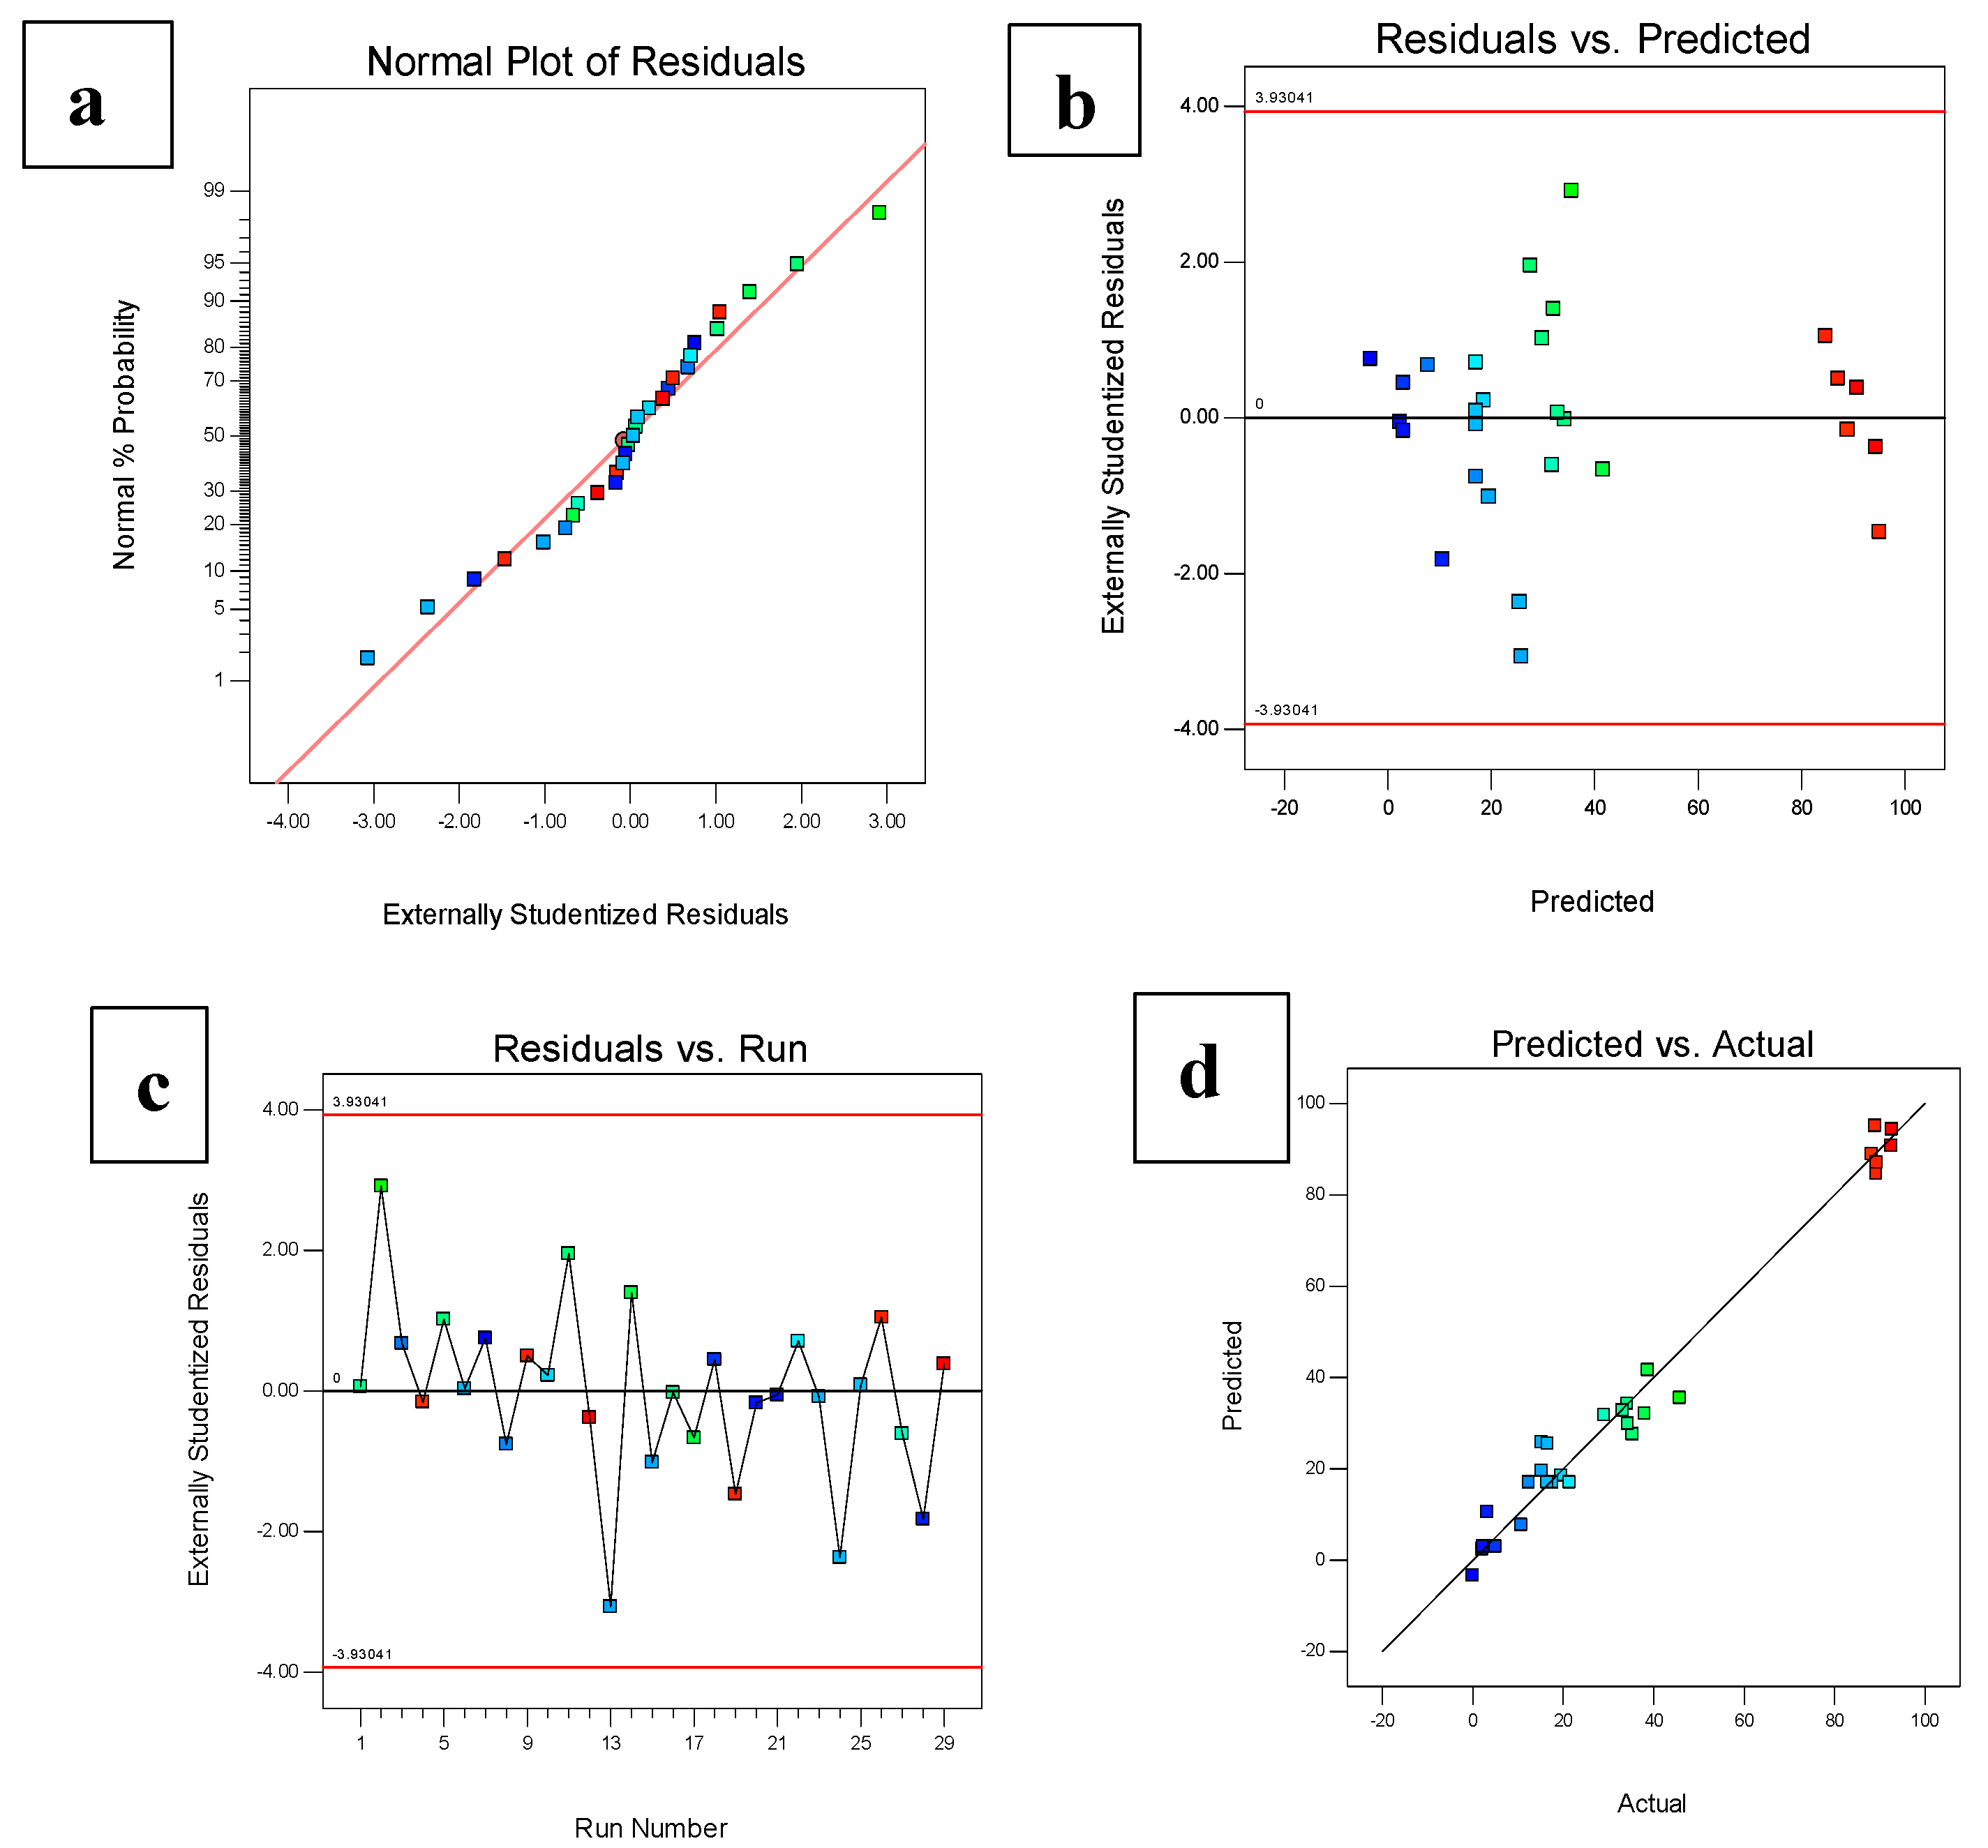
Figure 1. Diagnostic plots showing (a) the externally studentized residuals plotted against the normal probability, (b) the predicted versus the externally studentized residuals, (c) the run number versus externally studentized residuals, (d) the actual responses versus the predicted responses.
Sustainability 13 00036 g001
Figure 2. The immobilized mixed culture beads using gellan gum.
Sustainability 13 00036 g002
Figure 3. 3D plot and contour plot showing (a) the effects of dye concentration and gellan gum concentration, (b) the effects of dye concentration and number of beads, (c) the effects of dye concentration and beads size, (d) the effects of gellan gum concentration and number of beads, (e) the effects of gellan gum concentration and beads size, (f) the effects of number of beads and beads size.
Sustainability 13 00036 g003
Figure 4. HPLC chromatogram of the control dye, Metanil Yellow.
Sustainability 13 00036 g004
Figure 5. HPLC chromatogram of the decolorized products obtained after treatment with mixed culture FN3.
Sustainability 13 00036 g005
Figure 6. FTIR spectrum of the control Metanil Yellow dye.
Sustainability 13 00036 g006
Figure 7. FTIR spectrum of decolorized products of Metanil Yellow dye decolorization by mixed culture FN3.
Sustainability 13 00036 g007
Figure 8. The repeated usage (cycles 1 to 7) of the immobilized cells with initial dye concentration of 50 mg/L. Cycles 1 to 7 took 24 h per cycle for complete Metanil Yellow decolorization.
Sustainability 13 00036 g008
Figure 9. The repeated usage (cycles 8 to 15) of the immobilized cells with initial dye concentration of 50 mg/L. Cycles 8 to 15 took 24 h per cycle for complete Metanil Yellow decolorization.
Sustainability 13 00036 g009
Figure 10. Scanning electron micrographs of (a) mixed culture FN3 successfully being entrapped in gellan gum matrix, (b) mixed culture FN3 showing a rod-shaped bacterium and budding of yeasts, (c) the mixed culture fn3 before dye decolorization and (d) after dye decolorization.
Sustainability 13 00036 g010
Figure 11. Effects of different heavy metals on Metanil Yellow dye decolorization by immobilized cells of mixed culture FN3.
Sustainability 13 00036 g011
Table 1. The Box–Behnken design for the four independent variables on dye decolorization in actual and predicted values.
RunA: Dye Concentration(mg/L)B: Gellan Gum Concentration (%)C: Number of BeadsD: Beads Size (cm)Decolorization (%)Predicted RSM Decolorization (%)
12250.750500.4533.1232.82
22250.750100.4545.8035.55
33501.125300.3010.757.74
41001.125300.3088.2388.93
52251.500300.6034.3129.87
62251.125300.4517.2717.04
73501.500300.450.00-3.35
82251.125300.4512.4017.04
91001.125100.4589.3687.11
102251.500100.4519.5318.52
112251.125500.335.3827.61
121001.125300.692.6794.37
132251.125100.615.2625.82
142250.750300.638.0032.10
152251.500300.315.1819.59
162251.125500.634.1634.25
172250.750300.338.7341.69
183501.125300.65.002.99
191000.750300.4588.9695.10
203501.125500.452.202.96
213501.125100.452.102.35
222251.125300.4521.4017.04
232251.125300.4516.5317.04
242251.500500.4516.5725.52
252251.125300.4517.5917.04
261001.500300.4589.2384.67
272251.125100.329.0731.77
283500.75300.453.2010.55
291001.125500.4592.5090.77
Table 2. Lists of microorganisms that are able to decolorize Metanil Yellow (MY) dye with the favourable conditions.
MicroorganismsOptimal pH and Temperature for ReductionOptimal C SourceDye Concentration Tested (mg/L)References
Vibrio harveyi TEMS120 °CGlucose100[33]
Bacillus sp AK1
Lysinibacillus sp AK2
7.2
37 °C
Metanil Yellow200[7]
Unknown local isolates (NII and RHG)-Glucose50[34]
Oenococcus oeni ML347.0
30 °C
Glucose1000[35]
Bacillus sp Neni-106.3
34 °C
Glucose150[36]
Table 3. Analysis of variance (ANOVA) for the fitted quadratic polynomial order for optimization of dye decolorization of Metanil Yellow dye by immobilized cells of mixed culture FN3.
ANOVA for Response Surface Quadratic Model
Analysis of Variance Table [Partial Sum of Squares—Type III]
SourceSum of SquaresdfMean SquareF Valuep-Value
Prob > F
Model26,709.35141907.8141.84<0.0001significant
A: Dye concentration22,334.7122,334.7489.87<0.0001
B: Gellan Gum Concentration444.071444.079.740.0075
C: Number of beads13.67113.670.30.5927
D: Beads size0.3510.357.75−30.9311
AB3130.0660.8014
AC2.3112.310.0510.8252
AD25.94125.940.570.4632
BC23.64123.640.520.4833
BD98.62198.622.160.1635
CD39.62139.620.870.367
A23643.9413643.9479.92<0.0001
B2233.921233.925.130.0399
C2165.931165.933.640.0772
D2391.461391.468.590.011
Residual638.31445.59
Lack of fit597.151059.715.80.0524Not significant
Pure Error41.15410.29
Cor Total27,347.6628
Table 4. The optimum conditions obtained by using the desirability function technique.
Dye Concentration (mg/L)Gellan Gum Concentration (%)Number of BeadsBeads Size (cm)Decolorization (%)Desirability
1301.478500.60090.3781
Publisher’s Note: MDPI stays neutral with regard to jurisdictional claims in published maps and institutional affiliations.