Abstract
The Korean National Pension Service (NPS) is a partially funded and defined-benefit system. Although the accumulated Fund of the NPS has been increased gradually, this large fund is concerned about depletion in the near future due to the unprecedented aging population and the low fertility rate. In this study, we have developed an asset-liability management (ALM) model that endogenizes variables which were regarded as being exogenous by including them in investable assets. We present the multistage stochastic programming (MSP) formulation incorporating the population structure as a variable that is new to ALM. The optimal portfolio encompassing the investment in raising the fertility rate is obtained. Extending the scope of ALM to social investment is a new approach that has not been attempted in other ALM studies. We demonstrate that socially driven investments can also be a good investment asset in which the NPS should consider to invest.
1. Introduction
The main function of a pension plan is to provide a stable life to pensioners; however, according to the National Pension Actuarial Projection conducted in 2018 [1], it is expected that the Korean National Pension Service (NPS) will not be able to realize this major function in the future. The accumulated amount of funds of the NPS will continue to grow until 2041, reaching a maximum of 1778 trillion KRW, which is estimated to be approximately 44% of the national gross domestic product (GDP). However, this high amount of funds will be exhausted by 2057. The main cause of the fund depletion is the change in the demographic structure. Owing to the rapid aging and low fertility rate, the working-age population will decrease, whereas the number of pension beneficiaries will increase. This change in population structure increases future liabilities in the national pension. The exhaustion of the NPS implies an unstable old age for the current generation, as well as a burden for the future generation. It is not a problem confined to the NPS, as it can lead to social problems, such as a slowdown in economic growth and an increase in welfare budget expenditure, which can become substantial threats to the entire country. Under this special circumstance, the NPS is focusing solely on increasing the investment rate of return. In this work, we have developed an asset-liability management (ALM) model of the NPS with a focus on the future population structure in Korea.
Pension funds greatly impact financial markets and the economy because of the substantial fund size. To manage pension funds, the study of the ALM has been conducted. Modeling and optimization of allocation strategies for ALM using stochastic programming techniques were introduced in the work of Ziemba and Mulvey [2]. In pension fund management, there are several studies on multistage stochastic programming (MSP) and ALM. Bogentoft et al. [3] developed an ALM model for a pension fund using conditional value-at-risk (CVaR) constraints. Mulvey et al. [4] used multi-period stochastic programming in a long-term horizon framework for a pension fund. Some studies employed robust methods in an ALM model for pension plans [5,6]. To apply the ALM structure to pension funds in each country, the pension system and regulations should be considered. Høyland and Wallace [7] analyzed legal regulations in the Norwegian life insurance using MSP. Board and Sutcliffe [8] applied an ALM model to UK pension funds, and Hilli et al. [9] analyzed the Finnish pension system. Moreover, several studies addressed the Dutch pension system [10,11,12]. Dondi et al. [13] presented a dynamic ALM for Swiss pension funds.
Until now, ALM studies on pension funds have been mostly based on techniques using MSP. However, we try to apply ALM to pension funds by including a new type of asset in existing assets. We consider social investment—investment for the increase in the fertility rate, in particular—since the demographic structure is one of the most important factors affecting the pension system, and its impact on pension dynamics can be formulated clearly. One of the shortcomings of social investment is that its effect is indirect and appears over a long period. Because of this, measuring the performance of social investment is complicated and inherently difficult to evaluate. As a result, social investment has not been employed as widely as traditional financial assets. If one can model the effect of the socially driven investment accurately, this investment can be considered as an investment asset, such as traditional financial investments. Increasing the viable types of assets to invest would allow the NPS to make a better decision among more varied options.
In this work, we find the optimal portfolio decision of the NPS, including the investment in raising the fertility rate, by employing MSP. We try to determine whether the investment in population growth could be a more attractive investment vehicle than other financial assets.
To the best of our knowledge, this is the first study to include social investment as an investment asset of pension funds in the optimization problem to obtain optimal asset allocation. The crucial difference between this study and the other ALM studies is that we consider “investing in population growth” as an independent investment vehicle. This is an approach that has never been attempted in the other ALM studies in the past; it is meaningful to transform the population structure, which has been regarded as an exogenous variable, into an endogenous variable so that it would become controllable. The main contribution of this study is that it presents a new concept extending the scopes of ALM and investment portfolio to social investment.
The rest of the paper is organized as follows. Section 2 summarizes the pension fund system in Korea. In Section 3, we introduce the concept of investment in population growth, assumptions, and formulation of our framework. Then, the scenario tree generation procedure used in our model is presented in Section 4. Section 5 and Section 6 exhibit a numerical example with discussions. The last section concludes this study.
2. Korean National Pension Service
2.1. The Korean Pension System
Koreans over the age of 65 can receive three types of pension income: social welfare, a public pension, and a private pension. The pillar structure of Korea’s old-age income security system can be summarized, as shown in Table 1. The NPS corresponds to a public pension.

Table 1.
Old-age income security system.
The NPS was established to efficiently offer services that would contribute to the stabilization of livelihoods and would promote national welfare by providing pension benefits to cases of old-age, disability, or death (The National Pension Act). The general criteria for national pension coverage are age and residence. Participation is mandatory for all citizens in Korea aged between 18 and 59, except for public officials and private school teachers. In 2016, the age at which the beneficiary starts receiving benefits was 61. By 2033, the age will be gradually raised to 65.
The NPS is a partially funded, defined-benefit (DB) system. Currently, the operation of the system and the operation of the fund are maintained in a separate structure. In addition, the operation of the fund presents a similar tendency to the operation of large trust funds [14]. The Fund of the NPS is financed by collected contributions from the insured, investment returns, and settlement surplus, etc. The remainder after deducting the pension benefits and other expenses is reserved as an asset under management. The National Pension Service Investment Management was launched in 1999 under the mission of professionally managing the Fund of the NPS. The NPS has set a 5-year period asset allocation to achieve excess returns against benchmarks. The contribution rate of the NPS is 9%; basically, employers and employees each contribute 4.5% of their wages. A benefit formula consists of basic and earning-related portions. In this formula, the average income of all pension members is included—the formula that redistributes the income. Then, the actual value of the pension benefit is adjusted based on the national consumer price fluctuation. There are four types of NPS benefits: old-age pension, disability pension, survivor pension, and lump-sum refund. Among these, the old-age pension is the most substantial benefit, which guarantees old-age income security when the insured person becomes economically inactive.
There are several types of benefits for specific purposes, but the funds are managed as one fund. This one fund is managed under three sectors: financial sector, welfare sector, and the other sectors. As of August 2020, about 99.9% of the fund reserve is currently invested in the financial sector, and only 0.1% of the fund is in welfare and the other sectors. The portfolio of the financial sector contains a large proportion of bonds and an increasing proportion in equity markets.
2.2. Analysis of Major Issues of the NPS
One of the most critical problems is the pension fund exhaustion coming in the future. According to the 2018 NPS Actuarial projection [1], the accumulated fund will be depleted by 2057 due to the increase in the aging population and the low birth rate. As the proportion of the elderly continues to increase, payment expenditure will increase, and future contributions will decrease. In other words, future pension liabilities will increase significantly more than future assets.
Although the accumulated Fund of the NPS is more than 700 trillion KRW as of the end of 2019, it is not sufficient to prevent the depletion of pension funds. This means that the amount of current unfunded liability is greater than the accumulated fund. The contribution rate was set to be low at the initial stage of the scheme to alleviate the financial burden on pension members. Their benefits are substantially higher than their actual contributions. Until now, owing to the contributions of the baby-boom generation, there has been no major problem in the management of pension funds, despite the large unfunded liability. However, it will become difficult to disburse the pensions of the baby-boom generation after its retirement if the current management policy is maintained.
After the depletion of funds, the NPS will be transformed into a pay-as-you-go scheme. For beneficiaries to receive benefits, the contribution rate should be raised to 26.8% by 2060 [1]. This will become a heavy burden to the next generation and a cause of numerous social problems. To delay the occurrence of fund depletion, the government has raised the beginning age of pension benefit, and has lowered the pension benefit in two system reforms since 1998, when the NPS was established.
Recently, there has been a claim that the income replacement rate should be increased. The income replacement rate of the NPS is defined as a proportion of the first monthly pension benefit over the average income of the total period of contribution by beneficiaries. It has been decreased gradually ever since the establishment of the NPS. This controversy arises from the need for adequate welfare payments to the elderly because the Korean poverty rate of the aged population is the highest among the OECD countries. To raise the income replacement rate, an increase in the contribution rate or tax is necessary; this is not an easy decision, owing to public resistance. If the sustainability problem of the NPS cannot be solved, it may cause economic and social problems and seriously increase the burden of later generations. However, the exhaustion of funds is inevitable under current management [1]. Hence, it may be helpful to consider a new approach, as discussed in the next section.
3. Model
3.1. Investment in Population Growth
Due to the unprecedented aging population and low fertility rate, the majority of pension funds are suffering from deficits, and there are many concerns about their sustainability. As a result, numerous studies have been carried out on the financial sustainability of funds due to changes in demographic structure. There have been many studies [15,16,17,18,19,20,21] that illustrate changes in the wealth path of pension funds influenced by demographic change or demographic policy reform. However, most of them have assessed the sustainability of the fund by simulation under certain forecasting models on a demographic structure. There is a lack of research on the implications of social investment in fund management and its efficacy as an investment vehicle. Existing approaches are not well suited to conclude that investing in raising the fertility rate could be more attractive than investing in other traditional financial assets [22].
As the current investment management method cannot prevent the depletion of funds, we present an optimal decision-making process by including the investment in population growth, which is a new investment asset. Herein, the investment in population growth implies all direct and indirect investments that raise the fertility rate: for example, investing in childcare facilities or awarding a childbirth grant. A careful analysis should be performed to determine how much of the fertility rate would be increased for the investment for enhancing the fertility rate.
In Figure 1, the ALM system of a pension plan is composed of four kinds of main parts: a pension plan, an insured person, a beneficiary, and government agencies related to the policy decision of the pension plan. The current system treats the insured person, the beneficiary, and the government agencies as exogenous variables. In other words, it is difficult to control future premiums and payments for the existing ALM. Certainly, it is possible to influence future assets and liabilities by changing the premium rate; however, it is not easy because there are various problems in the process, such as generation conflict and procedural issues. Therefore, the current NPS system concentrates on a high expected return from financial investments for the sustainability of the fund.
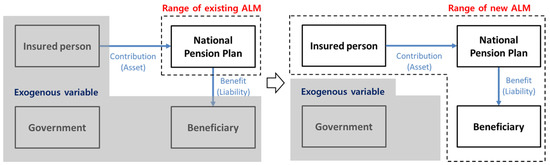
Figure 1.
Range of new asset-liability management (ALM) model of a pension plan with investment in population growth.
In this study, with the inclusion of the investment in population growth, the population that was considered as an exogenous variable can be regarded as an endogenous variable. The investment in population growth does not directly affect the fund as follows. First of all, the increased number of newborn infants by investment does not affect the NPS for the first 20 years. From a short-term perspective, it can be regarded as a −100% return on investment. However, after 20 years, they become economically active and start to pay pension premiums. Consequently, they increase the contributions and income of the NPS over the next 40 years before they retire. Then, they would affect the liabilities of the NPS from the age of 65 until their death. Thus, this investment can affect the assets and liabilities of the NPS because the number of future insured persons and beneficiaries would have changed. Consequently, introducing investment in population growth may extend the scope of the pension portfolio. In this paper, we model the management of the NPS fund by reflecting the cash flow of the investment in population growth.
3.2. Demographic Structure
Classification into two groups, pension members and beneficiaries, is insufficient to reflect the demographic change. Since there is a difference in the survival rate, and the fertility rate by age group, the population structure of our model changes every 5 years. We divided the population of Korea for each five-year age group and sex. In our model, the demographic structure was modeled on a discrete timeline. We only considered the population aged 0 to 99 (0–4, 5–9, …, 95–99) since the data for the population over 100 years of age are unclear. In addition, we assumed that the population of Korea is closed to international migration since the net immigration rate of Korea is expected to decrease gradually [1], and we disregarded this term in the long-run. We illustrated the population dynamics in the form of the well-known Leslie matrix, which is widely adopted in the projection of age group- and sex-specific population growth, by the following equation [17],
and and indicate the year, scenario, male, female, fertility rate, and mortality rate, respectively; the population vector, denotes the number of each age group- and sex-specific population; and represent the fertility rate for each male and female of the fertile women belonging to age group i; and represent the mortality rate of the male or female age group i. Every data required to create the Leslie matrix were based on the Korean statistical information service. For the sake of simplicity, the sex ratio of birth was supposed to be constant at 105.
In our framework, fertility rates were affected by the amount of investment in raising the fertility rate. It was assumed that the increase in the fertility rate according to investment in population was immediately reflected in the corresponding stage. The results may differ depending on the extent to which the fertility rate responded to a change in the amount of investing in population growth. We also assumed the fertile age of females to be 20–49; that is, fertility rates for a female outside this range were set to 0. Although the fertile age is widely used as 15–49 years, we assumed that the age to enter fertility was the same as the age to enter NPS. With this trick, we also supposed that the population structure was affected by investment until only 20 years from the beginning, which is the period from the beginning of time until the child born in the first stage enters fertility. These assumptions allow us to avoid multiplication between variables in the MSP formulation.
There is still an ambiguity concerning the amount of investment in population growth required to lead to an increase in the fertility rate. For example, mathematical analysis is required on how much the fertility rate can be increased when investing in childcare facilities or awarding a childbirth grant. There are several studies on the effect of childbirth promotion. As a result of analyzing the effect of the incentive policy implemented in Quebec, Canada, a 1000 CAD increase in first-year benefits was estimated to increase the probability of having a child by 16.9% [23]. In the work of Larogue and Salanié [24], child support of 500 EUR per month per child less than 3 years old induces a major increase in fertility of the order of 180,000 extra annual births in France. In the case of Korea, a panel analysis of 25 boroughs in Seoul from 2005 to 2009 revealed that the incentive for childbirth does not affect the fertility rate [25]. On the contrary, another research [26] shows that if the childbirth grant were increased by 100,000 KRW, the average number of newborns in the borough would increase by 2.71 persons.
Previous studies have had mostly hypothesis tests to see if investing in population growth is effective. In addition, there are differences in the results for each study owing to differences in the region and various conditions. If we limit the conditions to only a certain region, it is hard to show the change in the fertility rate according to the family benefits because the public spending of the nation does not change greatly within the country. Even if there is a difference in spending on family benefits, it is not easy to simply compare the effect of the policy due to the large gap in the timing of the budget used in most cases.
Under such circumstances, to quantify the effect of the investment in population structure approximately, we applied linear regression to each female age group-specific fertility rate and public spending on family benefits (in % of GDP) of OECD countries within the recent 3-year period from 2013 to 2015 (available in OECD family database). Herein, public spending on family benefits included all spending types, such as cash, services, and tax breaks for families. The regression results are shown in Table 2.
Table 2.
Slopes of the fertility rate (births per 1000 women) of each age group with respect to public spending (% GDP) on family benefits.
According to the results, it can be observed that the youngest age group was negatively affected by the increase in public spending on family benefits. It can be considered that the recent increase in the mean age of women at childbirth induced this effect. The fertility rate of the oldest age group is rarely affected by public spending, whereas the fertility rates of the rest of the groups are positively affected by additional public spending.
These slopes in linearized effect functions were used to estimate the increase in fertility rates according to the additional investment of NPS in population growth as reference values. To reflect the uncertainty in investment effect on population growth, we supposed that the noises of these slopes were normally distributed respectively with a zero mean. It was assumed that the population is determined by the investment in population growth of NPS in the previous stage (5 years ago). Furthermore, we supposed that public expenditure on the family benefits of Korea returns to the value at the beginning and is maintained after 20 years.
3.3. Model Description
In our proposed model, we applied the ALM methodology using MSP. We defined the target planning stage as , and the length of each period as . Investment and borrowing decisions occurred at each stage. Uncertainty was expressed as distinct realizations, called scenarios, . Nodes of the scenario tree represented possible outcomes for the uncertainties, and each node had a probability of realizations. In this model, asset returns, and the effect of population growth presented uncertainty. We will explain the generation procedure of the scenario tree in Section 4.
Asset classes were defined by set , with asset class 1 representing stock, 2 representing bond, and 3 representing an investment in population growth. We defined a person aged within the range of 20–59 years old as an active member and over 65 years old as a pensioner.
The data required for the forecasting follow the results of the 2018 NPS Actuarial projection [1]. In accordance with the revision of the National Pension Act, the NPS actuarial committee has carried out the national pension financing calculation, which reveals the future cash flow of the NPS every five years since 2003. Furthermore, this provides the financial estimation and assumptions of economic variables used in the forecast process. Various data, such as the number of future pension members and beneficiaries, premium income, pension expenditure, and economic variables required in this model are determined based on the assumptions and results derived from [1]. Then, given that the available financial estimation results extend to as far as 2088, data after the year 2088 are assumed to be the same as those in 2088.
3.4. MSP Formulation
A scenario tree and an optimization model are the main elements of MSP, which is a widely used methodology to solve a multistage decision-making problem under uncertainty [27]. An MSP model shows the optimal solutions at each node of the tree, given the information available at that point. Decisions do not depend on future observations, but on possible random future realizations, as well as on the decisions made in the previous stage.
We formulated an MSP model to find the optimal asset allocation for the NPS. For each , , and , we defined the following parameters and decision variables
- Parameters
| Length of stage t in years. | |
| Asset return during periods of stage t for asset i under scenario s. | |
| Annualized rate of the cost of borrowing. | |
| Rate of the transaction cost. | |
| Discounting factor for one year. | |
| Limit on the asset amount sold in one year. | |
| Initial wealth of NPS. | |
| Initial weight of asset i. | |
| Average pension benefit per person of age group j at stage t. | |
| Average contribution per person of age group j at stage t. | |
| Percentage of insured persons of age group j at stage t. | |
| Percentage of pension beneficiaries of age group j at stage t. | |
| Probability of scenario s, . |
- Decision Variables
| Amount allocated to asset i after rebalancing at the beginning of stage t under scenario s. | |
| Amount of asset i purchased at the beginning of stage t under scenario s ( | |
| Amount of asset i sold at the beginning of stage t under scenario s ( | |
| Amount borrowed at the beginning of stage t, under scenario s. | |
| Amount of debt paid back at the beginning of stage t, under scenario s. | |
| Age group- and sex-specific population vector at stage t under scenario s. | |
| Total Liability payment at stage t under scenario s. | |
| Total contribution of all active members at stage t under scenario s. | |
| End effect under scenario s. |
- MSP Model
| Maximize , where | (2) | |
| Subject to | ||
| (3) | ||
| (4) | ||
| (5) | ||
| (6) | ||
| (7) | ||
| (8) | ||
| (9) | ||
| (10) | ||
| (11) | ||
| (12) | ||
| (13) | ||
| (14) | ||
| (15) | ||
| , | (16) | |
| , , , | and with identical past up to time t. | (17) |
| , ,, | (18) | |
The objective of our MSP model was to maximize the expected utility of NPS. We defined the expected utility (2) as a linear combination of the expected final wealth and the expected penalty, which measures the performance and the risk, respectively. The risk of the pension plan was measured as a one-sided downside risk based on the expected borrowings at the final stage T. Parameter represents the risk preference of NPS, which indicates the relative importance of risk as compared with the expected value. Higher values of parameter represent that the NPS is aggressive. On the contrary, if holds low values, the NPS is conservative in terms of risk.
The cash balance Equation (3) represents cash inflow and outflow at each stage t under scenario s. The cash account shows inflows owing to cash earned from selling assets, contributions from active members of the pension fund, and from borrowing. The cash outflow includes cash for buying assets, pension payment to pensioners of the pension fund, and debt from borrowing at stage . For the constraints (4) and (5), the contributions and liability payments are composed of two parts: the existing population and the additional population owing to investment in population growth. The number of pension members of the population owing to investment was calculated as in the manner shown in Figure 2. The ratios of active pension members and pensioners to the population were assumed to remain constant over the projection period as the values based on the Korean statistical information service as of 2018.
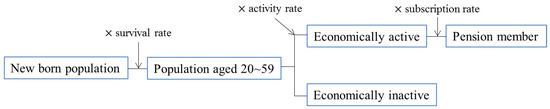
Figure 2.
The method employed for the calculation of the number of additional pension members owing to investment.
Constraints (6) and (7) indicate population dynamics of each age group- and sex-specific group introduced in Section 3.2. Constraint (8) represents the end effect, which is a discounted value of the future cash flow of the remaining population at the final stage.
Inventory balance Equations (9)–(11) show how the pension plan invests its wealth on each asset class at stage t under scenario s. The initial asset allocation of the fund refers to the portfolio of NPS as of the year 2020. The constraints (13) and (16) represent the cost of borrowing of NPS and the limit on the range of asset variation in one stage, respectively. Additional constraints for specific stages are given as constraints (12), (14), (15). The constraint (17) is the non-anticipative constraint required in the tree structure of the stochastic programming because decisions should be made without knowing the future. The constraint (18) is a non-negative constraint for all decision variables.
The linearized effect of investment in population growth affects the Leslie matrix in constraint (7) as a form illustrated in Equation (1). Regarding this constraint, for the convex programming problem, we assumed that the investment in population growth was allowed for the first 20 years (1~4 stage). After 20 years, the fertility rate remained at the initial level in 2020 until the final stage of our model.
4. Scenario Tree Generations
To construct the MSP problem, the generation of scenario trees for uncertain parameters is important. There are several works in which financial scenario trees have been generated. Mulvey and Zenios [28], Zenios [29] presented simulation techniques to generate scenarios based on interest rate lattice [28,29]. A clustering algorithm was introduced in the work of Carino et al. [30]. This method reduced a large random sample variable to a small number of representative nodes while preserving important statistical properties. Høyland and Wallace [7] introduced the moment matching approach. This method was based on the solution of an optimization problem with values of random variables and scenario probabilities. Dupačová et al. [31], Gülpınar and Rustem [32] presented a combined simulation technique and optimization approach. In this study, we used the sequential simulation method, which is the clustering method introduced in the work of Mulvey et al. [4]. The sequential simulation method generates a one-stage scenario fan at each clustered scenario instead of a full fan at the initial stage. At first, we determined the number of stages and nodes to construct the scenario tree. For each node, we created a one-period scenario fan for asset returns with N nodes by using the Monte Carlo simulation. We adopted the k-means clustering method to determine scenario values in each cluster for one stage. The full scenario tree was constructed by repeating for every node of the stage.
In this model, there were two kinds of uncertainties: the asset returns and the effect of population growth. We assumed that the asset returns and the effect of population growth were independent of each other. To generate the scenario trees of our model, the duration of the entire period was set to be 80 years and was divided into 5-, 5-, 5-, 5-, 30- and 30-year intervals to form seven stages. The clustering parameters for the asset return scenario tree are listed in Table 3.
Table 3.
Clustering settings for scenarios of asset returns.
For the asset returns for the scenario tree, we assumed that there were two asset classes, namely stocks and bonds. We derived the expected returns of the stocks and bonds from confidential data of NPS based on the 2018 NPS Actuarial projection [1]. In addition, volatilities and correlation of the benchmarks of NPS for the stocks and bonds were used as the return distribution parameter for scenario generations.
5. Numerical Example
In this section, we demonstrate the obtained optimization result of the MSP problem presented in Section 3 by applying the generated scenario tree to the problem. For the empirical test, parametric assumptions are defined as the following Table 4.
Table 4.
Summary of parametric assumptions.
The parameter was set to be very high compared to the expected returns of the stocks and bonds on account of the fact that a huge capital infusion through borrowing is practically impossible. The transaction cost was also set high enough in consideration of the penalty for changing positions. We set these values to large values as the role of penalty. The parameters and were chosen as widely used values. These parameters could be adjusted depending on the purpose and circumstances of the defined problem. The financial condition of NPS in 2020 was used as the initial asset value. We defined the other parameters as the commonly used values.
For each stage, we calculated the probability-weighted average values of the optimal asset allocation from obtained optimal strategies under a generated scenario. Thereafter, the average value of the decision on the weight of each stage was calculated from 5 different generated scenarios to increase the accuracy of the solution. Table 5 illustrates the optimal portfolio weight for the case with higher contribution rates compared to the current 9%.
Table 5.
Expected optimal portfolio weight for each stage: different contribution rates.
If the contribution rate remained at the current level of 9%, the optimal policy in the first stage was investing 20.60% of the fund in population growth. Due to the defined population dynamics introduced in Section 3.2., the weight of investing in the fertility rate after stage 4 was 0. It is especially notable that optimal asset allocation at the first stage was the same for all cases. Only initial assets were reallocated to three types of assets in the first stage. On the other hand, for the other stages, except for the first stage, there were accumulated contributions, premium payments, and investment management income during the preceding period since 5 or 30 years have passed from the previous stage. Hence, this allowed decisions on a much larger amount of assets than stage 1 at once. Moreover, there are constraints which limit the amount of asset sold. This caused the decision at the first stage for all cases to be the same. Moreover, as the premium rate increased, the amount of investment in population tended to increase.
Due to differences in the effect of the investments between countries and insufficiency in data, it was not enough to simply analyze the effect of investment in population growth. Therefore, we analyzed the case where the effect was low or high: when the slope of the effect functions for the existing effects increased by 50% or decreased by 50%. Table 6 shows the optimal portfolio for each case.
Table 6.
Expected optimal portfolio weight for each stage: different investment effects in the fertility rate.
This result confirms that the greater the investment effect, the higher the weight on the investment in population, especially in stage 3 rather than stage 2. In what follows, Table 7 shows the optimal weight on investment in population growth of three representative choices of utility: conservative, moderate, and aggressive. The results under different risk preference levels reveal that the conservative case is more likely to invest in population growth relatively earlier compared to other cases.
Table 7.
Expected optimal portfolio weight for each stage: different risk preferences.
All in all, excluding the first stage, it can be seen that the optimal solution tends to give more weight on investment in population at earlier stages. This empirical analysis leads us to conclude that investment in population by the fund of NPS could be an attractive investment vehicle.
6. Discussion
In spite of many studies about the impact of population structure on pension finances, most of them propose simulation results under certain assumptions of total fertility rates. This study aims to determine whether population investment is a viable option. Although our results varied depending on the parameters and assumptions about the practical effect of population investment on the fertility rate, it should be highlighted that this paper provides a formulation that encompasses a concept new to the literature in ALM.
We note that the values of results are the optimal solution when the investment in population has an effect on the population as the regression results in Section 3.2. The obtained optimal amount of investment in population growth was positive in all cases. This corroborates that investing in population growth would be the optimal decision in this proposed framework. Therefore, the results lead us to conclude that investment in population growth could be a sufficiently attractive asset. Moreover, the results indicate that a larger amount is invested in the population at earlier stages except for the first stage with greater limitations in rebalancing. This is consistent with our intuition.
In addition, investment in population growth has another great advantage in terms of the ALM model. Investment in population growth can be regarded as an asset different from the existing asset classes because it increases the assets of the pension plan until retirement and affects liabilities after retirement until death. From this point of view, the investment for raising the fertility rate can be an investment vehicle that can diversify the risk of financial instruments because of low correlations with existing financial assets. In other words, this investment is already sufficiently attractive because it can become a risk-hedging instrument, even if the effect of investment is not high. Therefore, it is necessary to seriously consider investing in population growth from the perspective of ALM and risk management.
7. Conclusions
In this study, we presented an ALM model, which included risky assets, via the methodology of MSP to investigate the effect of population growth on the optimal portfolio decisions. To extend the scope of ALM to social investment, we applied our model to the NPS in Korea. Although we made several assumptions because of the lack of numerical research on the effects of population growth, MSP formulation and its numerical example were provided. In light of our results, the investment in population growth could be an attractive alternative. In other words, it has been understood that investment in changing the demographic structure as well as increasing the investment returns through various investment strategies in the traditional financial market can produce satisfactory results. However, caution must be taken when interpreting our numerical results since they were necessarily inaccurate and may vary depending on the detailed assumption on the investment effect on the fertility rate and the choice of parameter values.
We restricted the range of social investment to investment in population growth in our model. However, other social investments, such as investment in the public sector, can be applied in a similar manner if the effect on pension dynamics is analyzed proactively. Of course, it is premised that the effect of social investment must be clear. We analyzed the pension system in Korea. However, the key concept that extends the scope of ALM to social investment can be applied to other frameworks with a similar form of the public pension system. The implication of this study was to propose an ALM model that endogenizes the demographic structure, which was an exogenous variable.
One of the problems that can arise when the social investment of the NPS is actually implemented is whether it is appropriate for the national pension to spend welfare costs on behalf of the central government directly. The way to solve this is to analyze the cash flows related to the social investment of the NPS and to securitize it. Through this, the NPS and the government make the financial transactions, and the actual subject of welfare expenditure can become the government rather than the NPS. In reality, it is difficult for the national pension to provide welfare in the form of childbirth and childcare directly. Therefore, if the central government issues long-term bonds and the NPS purchases them, the government can use the revenue from selling bonds as a welfare expenditure for population growth. However, introducing this requires sufficient discussion and considerable social consensus to be implemented. It would take a lot of verification processes for this idea to be adopted as an actual policy.
To improve our model, further studies regarding the effect of population growth are required. Future research should include not only the investment decisions discussed in this study but also the optimal policy, such as premium rate changes as decision variables. The management of pension funds is different from the general asset management in terms of its size, which can affect financial and economic indicators. Therefore, we need a model that takes into account the impact of investment decisions on future macroeconomic indicators.
Author Contributions
Conceptualization: W.B.C. and W.C.K.; Methodology: W.B.C., D.L. and W.C.K.; Investigation: W.B.C. and D.L.; Writing―original draft: W.B.C., D.L. and W.C.K.; Writing―review & editing: W.B.C., D.L. and W.C.K.; Supervision: W.C.K.; Funding acquisition: W.C.K. All authors have read and agreed to the published version of the manuscript.
Funding
This research was supported by the Basic Research Fund of Korea Advanced Institute of Science and Technology (KAIST) (A0601003029).
Conflicts of Interest
The authors declare no conflict of interest.
References
- National Pension Service Actuarial Projection Committee. 2018 National Pension Service Actuarial Projection. 2018. Available online: https://fund.nps.or.kr/jsppage/fund/mpc_e/mpc_e_03.jsp (accessed on 4 January 2021).
- Ziemba, W.T.; Mulvey, J.M.; Moffatt, H. Worldwide Asset and Liability Modeling; Cambridge University Press: Cambridge, UK, 1998; Volume 10. [Google Scholar]
- Bogentoft, E.; Romeijn, H.E.; Uryasev, S. Asset/liability management for pension funds using CVaR constraints. J. Risk Financ. 2001, 3, 57–71. [Google Scholar] [CrossRef]
- Mulvey, J.M.; Simsek, K.D.; Zhang, Z. Improving investment performance for pension plans. J. Asset Manag. 2006, 7, 93–108. [Google Scholar] [CrossRef]
- Gülpınar, N.; Rustem, B.; Settergren, R. Simulation and optimization approaches to scenario tree generation. J. Econ. Dyn. Control 2004, 28, 1291–1315. [Google Scholar] [CrossRef]
- Pachamanova, D.; Gülpınar, N.; Çanakoğlu, E. Robust approaches to pension fund asset liability management under uncertainty. In Optimal Financial Decision Making Under Uncertainty; Springer: Berlin/Heidelberg, Germany, 2017; pp. 89–119. [Google Scholar]
- Høyland, K.; Wallace, S.W. Analyzing legal regulations in the Norwegian life insurance business using a multistage asset–liability management model. Eur. J. Oper. Res. 2001, 134, 293–308. [Google Scholar] [CrossRef]
- Board, J.; Sutcliffe, C. Joined-up pensions policy in the UK: An asset-liability model for simultaneously determining the Asset allocation and contribution rate. In Handbook of Asset and Liability Management; Elsevier: Amsterdam, The Netherlands, 2008; pp. 1029–1067. [Google Scholar]
- Hilli, P.; Koivu, M.; Pennanen, T.; Ranne, A. A stochastic programming model for asset liability management of a Finnish pension company. Ann. Oper. Res. 2007, 152, 115. [Google Scholar] [CrossRef]
- Haneveld, W.K.; Streutker, M.; van der Vlerk, M. Implementation of New Regulatory Rules in a Multistage ALM Model for Dutch Pension Funds; Research Report 07005; University of Groningen, Research Institute SOM (Systems, Organisations and Management): Groningen, The Netherlands, 2007. [Google Scholar]
- Haneveld, W.K.K.; Streutker, M.H.; Van Der Vlerk, M.H. An ALM model for pension funds using integrated chance constraints. Ann. Oper. Res. 2010, 177, 47–62. [Google Scholar] [CrossRef][Green Version]
- Klein Haneveld, W.K.; Streutker, M.H.; van der Vlerk, M.H. Indexation of Dutch pension rights in multistage recourse ALM models. Ima J. Manag. Math. 2010, 21, 131–148. [Google Scholar] [CrossRef]
- Dondi, G.; Herzog, F.; Schumann, L.M.; Geering, H.P. Dynamic asset and liability management for Swiss pension funds. In Handbook of Asset and Liability Management; Elsevier: Amsterdam, The Netherlands, 2008; pp. 963–1028. [Google Scholar]
- Won, C.H. Necessity of stipulate of national payment in the view of asset allocation of national pension plan. Welf. Trend (Korean) 2013, 177, 29–41. [Google Scholar]
- Colombo, L.; Haberman, S. Optimal contributions in a defined benefit pension scheme with stochastic new entrants. Insur. Math. Econ. 2005, 37, 335–354. [Google Scholar] [CrossRef]
- Angrisani, M.; Attias, A.; Bianchi, S.; Varga, Z. Sustainability of a pay-as-you-go pension system by dynamic immigration control. Appl. Math. Comput. 2012, 219, 2442–2452. [Google Scholar] [CrossRef]
- Tian, Y.; Zhao, X. Stochastic forecast of the financial sustainability of basic pension in China. Sustainability 2016, 8, 46. [Google Scholar] [CrossRef]
- Chen, X.; Yang, Z. Stochastically Assessing the Financial Sustainability of Individual Accounts in the Urban Enterprise Employees’ Pension Plan in China. Sustainability 2019, 11, 3568. [Google Scholar] [CrossRef]
- Wang, H.; Huang, J.; Sun, S. Assessment of the Financial Sustainability of China’s New Rural Pension Plan: Does the Demographic Policy Reform Matter? Sustainability 2019, 11, 5110. [Google Scholar] [CrossRef]
- Zhao, Q.; Mi, H. Evaluation on the Sustainability of Urban Public Pension System in China. Sustainability 2019, 11, 1418. [Google Scholar] [CrossRef]
- Zhao, Y.; Bai, M.; Liu, Y.; Hao, J. Quantitative analyses of transition pension liabilities and solvency sustainability in China. Sustainability 2017, 9, 2252. [Google Scholar] [CrossRef]
- Jo, W.-H.; Kye, B.-O.; Ryu, J.-R. Ultra-Low Fertility in Korea and Social Investment by National Pension Fund Focusing on Demographic Change, Social Investment, and the National Pension Finance. Korea J. Popul. Stud. (Korean) 2018, 41, 61–90. [Google Scholar] [CrossRef]
- Milligan, K. Subsidizing the stork: New evidence on tax incentives and fertility. Rev. Econ. Stat. 2005, 87, 539–555. [Google Scholar] [CrossRef]
- Laroque, G.; Salanié, B. Fertility and financial incentives in France. Cesifo Econ. Stud. 2004, 50, 423–450. [Google Scholar] [CrossRef]
- Suk, H.W. Study on the impact of Maternity subsidies policy: Focusing on Local governments in Seoul Metropolis. Korea Local Adm. Rev. (Korean) 2011, 25, 143–180. [Google Scholar]
- Park, C.W.; Song, H.J. The Effect of Child Birth Grants on the Fertility: Evidence from South Korea. Appl. Econ. (Korean) 2014, 16, 5–34. [Google Scholar]
- Birge, J.R.; Louveaux, F. Introduction to Stochastic Programming; Springer Science & Business Media: New York, NY, USA, 2011. [Google Scholar]
- Mulvey, J.M.; Zenios, S.A. Capturing the correlations of fixed-income instruments. Manag. Sci. 1994, 40, 1329–1342. [Google Scholar] [CrossRef]
- Zenios, S.A. Asset/liability management under uncertainty for fixed-income securities. Ann. Oper. Res. 1995, 59, 77–97. [Google Scholar] [CrossRef]
- Carino, D.R.; Myers, D.H.; Ziemba, W.T. Concepts, technical issues, and uses of the Russell-Yasuda Kasai financial planning model. Oper. Res. 1998, 46, 450–462. [Google Scholar] [CrossRef]
- Dupačová, J.; Consigli, G.; Wallace, S.W. Scenarios for multistage stochastic programs. Ann. Oper. Res. 2000, 100, 25–53. [Google Scholar] [CrossRef]
- Gülpınar, N.; Rustem, B. Worst-case robust decisions for multi-period mean–variance portfolio optimization. Eur. J. Oper. Res. 2007, 183, 981–1000. [Google Scholar] [CrossRef]


Publisher’s Note: MDPI stays neutral with regard to jurisdictional claims in published maps and institutional affiliations. |
© 2021 by the authors. Licensee MDPI, Basel, Switzerland. This article is an open access article distributed under the terms and conditions of the Creative Commons Attribution (CC BY) license (http://creativecommons.org/licenses/by/4.0/).