Article

Performance Analysis of Topologies for Autonomous Hybrid Microgrids in Remote Non-Interconnected Communities in the Amazon Region

Energy Group of the Department of Energy and Electrical Automation Engineering of the Polytechnic School, University of Sao Paulo, 05508-900 São Paulo, Brazil
*
Author to whom correspondence should be addressed.
Sustainability 2021, 13(1), 44; https://doi.org/10.3390/su13010044
Submission received: 26 September 2020 / Revised: 22 October 2020 / Accepted: 3 November 2020 / Published: 23 December 2020
(This article belongs to the Section Energy Sustainability)

Abstract

:
This work presents a detailed comparative analysis of dispersed versus centralized Alternating Current (AC)-coupling topologies and AC-coupling versus Direct Current (DC)-coupling topologies in autonomous Photovoltaic (PV)-diesel-battery microgrids for remote/isolated communities in the Brazilian Amazon region. The comparison concerned the power losses occurring in power conversion devices and in a low-voltage distribution network by using the balance-of-system (BOS) efficiency as a performance index. The analyses were performed by an analytical approach and by detailed computer simulations in MATLAB/Simulink software. Based on the matching factor (MF), the gain obtained in BOS efficiency is 1.5% for low values of the MF, and for high values of the MF, the centralized topology has the same BOS efficiency as the dispersed topology. In conclusion, this factor proved to be useful as a design parameter for selecting the optimal topology of a PV-diesel-battery microgrid.

1. Introduction

Electricity is a basic part of life, and it is one of the most widely used forms of energy today [1]. However, access is limited for a number of people, especially in developing and underdeveloped countries [2]. Currently, 2.7 billion people rely on traditional biomass for subsistence, and 1.3 billion people lack access to modern energy services [3], which means they do not have access to electricity and its benefits. [4]. One of the main reasons for the lack of electricity and energy poverty in the lives of thousands of millions of people in the world is poverty combined with their geographical isolation [5], and this implies that electricity and energy poverty need to be incorporated into the design of development strategies [6].
Increasing access to electricity has an overall positive impact on the isolated community, such as on academic activities, by extending the daily classroom and audio-visual resources available and by providing food conservation for fisheries and agriculture [7]. Nevertheless, the electrification proposition for remote and isolated communities should be preceded by planning that includes the establishment of management mechanisms to ensure the long-term sustainability of electrification projects [8].
There are currently many studies that consider social criteria to design and optimize renewable energy systems. Cuesta et al. [9] reviewed and analysed whether the tools for designing hybrid renewable systems include social indicators. As a result, only one tool included two social parameters—Human Development Index (HDI) and job creation. However it is limited for small communities, and all others do not consider social parameters. This concurs with works related to the integrated resource plan [10,11,12,13,14], which evaluate the supply and demand side under the lens of the social, political, and environmental dimensions plus the traditional technical and economic approach.
In many places, there are remote communities, ranging from islands to hundreds of kilometres of coastline as well as continental areas far from conventional connection centres [8,15,16,17,18,19,20,21,22,23,24,25], in which the connection to conventional power grids is too expensive or impractical, and decentralized generation is the only efficient way to provide electricity [26].
In these remote communities, it is common to use small and medium diesel generators (gensets) for supplying electricity [27], which is costly, finite, and has relatively high carbon emissions [15]. This is because gensets are widely available in a broad range, from several kW to hundreds of kW, and there are decades of experience in their operation, maintenance, and control [28].
However, to reduce the consumption of fossil fuels and to minimize the need for maintaining gensets, the use of renewable energy sources, such as solar, wind, and biomass, combined with gensets is becoming more common [4,17,21,23,25,29,30,31,32]. Another important factor to consider is the season throughout the year, i.e., Ayodele et al. [33] demonstrated that during the dry season, the combination of Photovoltaic (PV)-wind power is the best renewable energy generation option, meanwhile, the best renewable energy generator option for the rainy season is the combination of PV-wind power-hydrokinetic turbine. In this context, autonomous PV-diesel-battery microgrids emerge as a technically and economically viable opportunity to meet the electricity demand of people who, for several reasons, do not have—or have limited—access to electricity.
In recent years, to reduce costs and increase the overall efficiency of the systems, many academic works—and commercial software—to optimize the size of the main components of an autonomous microgrid have been developed or are still under development [27,34,35,36,37,38,39,40,41]. As an example, Al-Shamma’a et al. [27] proposed a methodology for optimal sizing of an autonomous microgrid based on genetic algorithms. The optimum configuration is only achieved by selecting the power source combination with the lowest cost and finding a suitable renewable energy ratio, however, the microgrid topology is not considered.
Ohijeagbon et al. [30] analysed the feasibility and techno-economic viability of wind and solar standalone systems for isolated-grid communities, showing that adopting wind resources, as standalone or in a hybrid format with PV, for power generation is more viable than the use of diesel generators.
Sharafi et al. [34] suggested a dynamic multi-objective particle swarm optimization method for the optimal design of a hybrid renewable energy system. The main goal of this design is to minimize simultaneously the total net present cost of the system, unmet load, and fuel emission.
Balderrama et al. [42] developed an open-source modelling framework that is applied to real local data to consolidate field practices and two-stage stochastic modelling approaches for isolated hybrid microgrids in a rural context. Christo et al. [43] proposed multi-objective optimization algorithm search for the set of plans that minimizes both the cost of energy production and the discomfort of the isolated communities when they indicate that the proposed method can contribute to the adjustment of the aggregate demand profile of users.
Mandelli et al. [44] implemented the application of a mathematical model to formulate the daily load profiles of isolated consumers in rural areas. Mi et al. [45] developed a coordinated control strategy for the stability operation of an isolated Direct Current (DC) microgrid based on hierarchical droop control by detecting the voltage deviation to avoid over-charging or deep-discharging in certain storage units.
However, the techniques are used to find only the best combination of the components and control strategies. The optimization of the microgrid topology is not addressed. This is true for references [36,37,38,39,40,41] as well. In brief, most of the articles focused on the design of microgrid components but not on its topology. Very few papers analyse the impact of the microgrid topology on system performance, and the ones addressing this issue carried out the analyses in a simplified form [46,47,48,49].
Nguyen [46] presented a comparison of microgrid topology concerned with the economic operation, power losses, and interruption cost in a deregulated market model. The author suggested that the single Alternating Current (AC) microgrid takes advantage of high energy efficiency and flexibility in operations. On the other hand, the three-phase AC configuration shows its benefits in customizing loads, i.e., loads are classified into different networks as their reliability preferences. In this article, the relationship between the load profile, solar profile, and PV penetration was not studied. Furthermore, power losses incurred in the network were neglected in the comparison of different topologies.
Phrakonkham et al. [47] reviewed microgrid topologies and software tools dedicated to the optimization of the hybrid system. This paper presented the main advantages and disadvantages of DC, AC, and hybrid microgrid topologies; however, no detailed comparative analysis was performed. In addition, it concluded that the commercial software tools used for system optimization are not specifically designed to enable connection flexibility among components making up a hybrid system via power electronics converters.
Mariam et al. [48] and Justo et al. [49] presented an introspective review of AC and DC microgrids with distributed generation units based on renewable energy sources and energy storage devices available in recent literature. These papers also described the problems associated with the conventional distribution system and the roles of the microgrid systems in the conventional power systems. Again, no detailed comparative analysis was performed.
Castillo-Calzadilla et al. [50] analysed and compared an equivalent AC and DC distribution network for three DC microgrids; two were fed by solar PV and one by the electricity grid based on fossil fuel. They concluded that DC distribution is best suited for buildings with a large solar capacity, a large battery bank, and a high voltage distribution backbone and determined that a large battery capacity is crucial for islanding microgrid buildings.
Regarding PV source coupling, the topologies of PV-diesel-battery microgrids can be classified as (i) AC-coupling and (ii) DC-coupling. The AC-coupling topology can be sub-classified into dispersed and centralized topologies. The main contribution of this paper is a detailed comparative study of dispersed versus centralized AC-coupling topologies and AC-coupling versus DC-coupling topologies in autonomous PV-diesel-battery microgrids.
The analyses were performed from a system efficiency perspective, i.e., the comparison concerned power losses occurring in power conversion devices and in a low-voltage distribution network by using the balance-of-system (BOS) efficiency as a performance index, calculated according to the IEC Standard 61724:1998 [51]. Analyses related to the reliability, flexibility, and costs of these topologies were not in the scope of this work.
A new factor, called the matching factor (MF), was introduced by the authors to allow a better understanding of the microgrid performance as a function of the relationship between the load profile, solar profile, and PV penetration.

2. PV-Diesel-Battery Microgrid Topologies

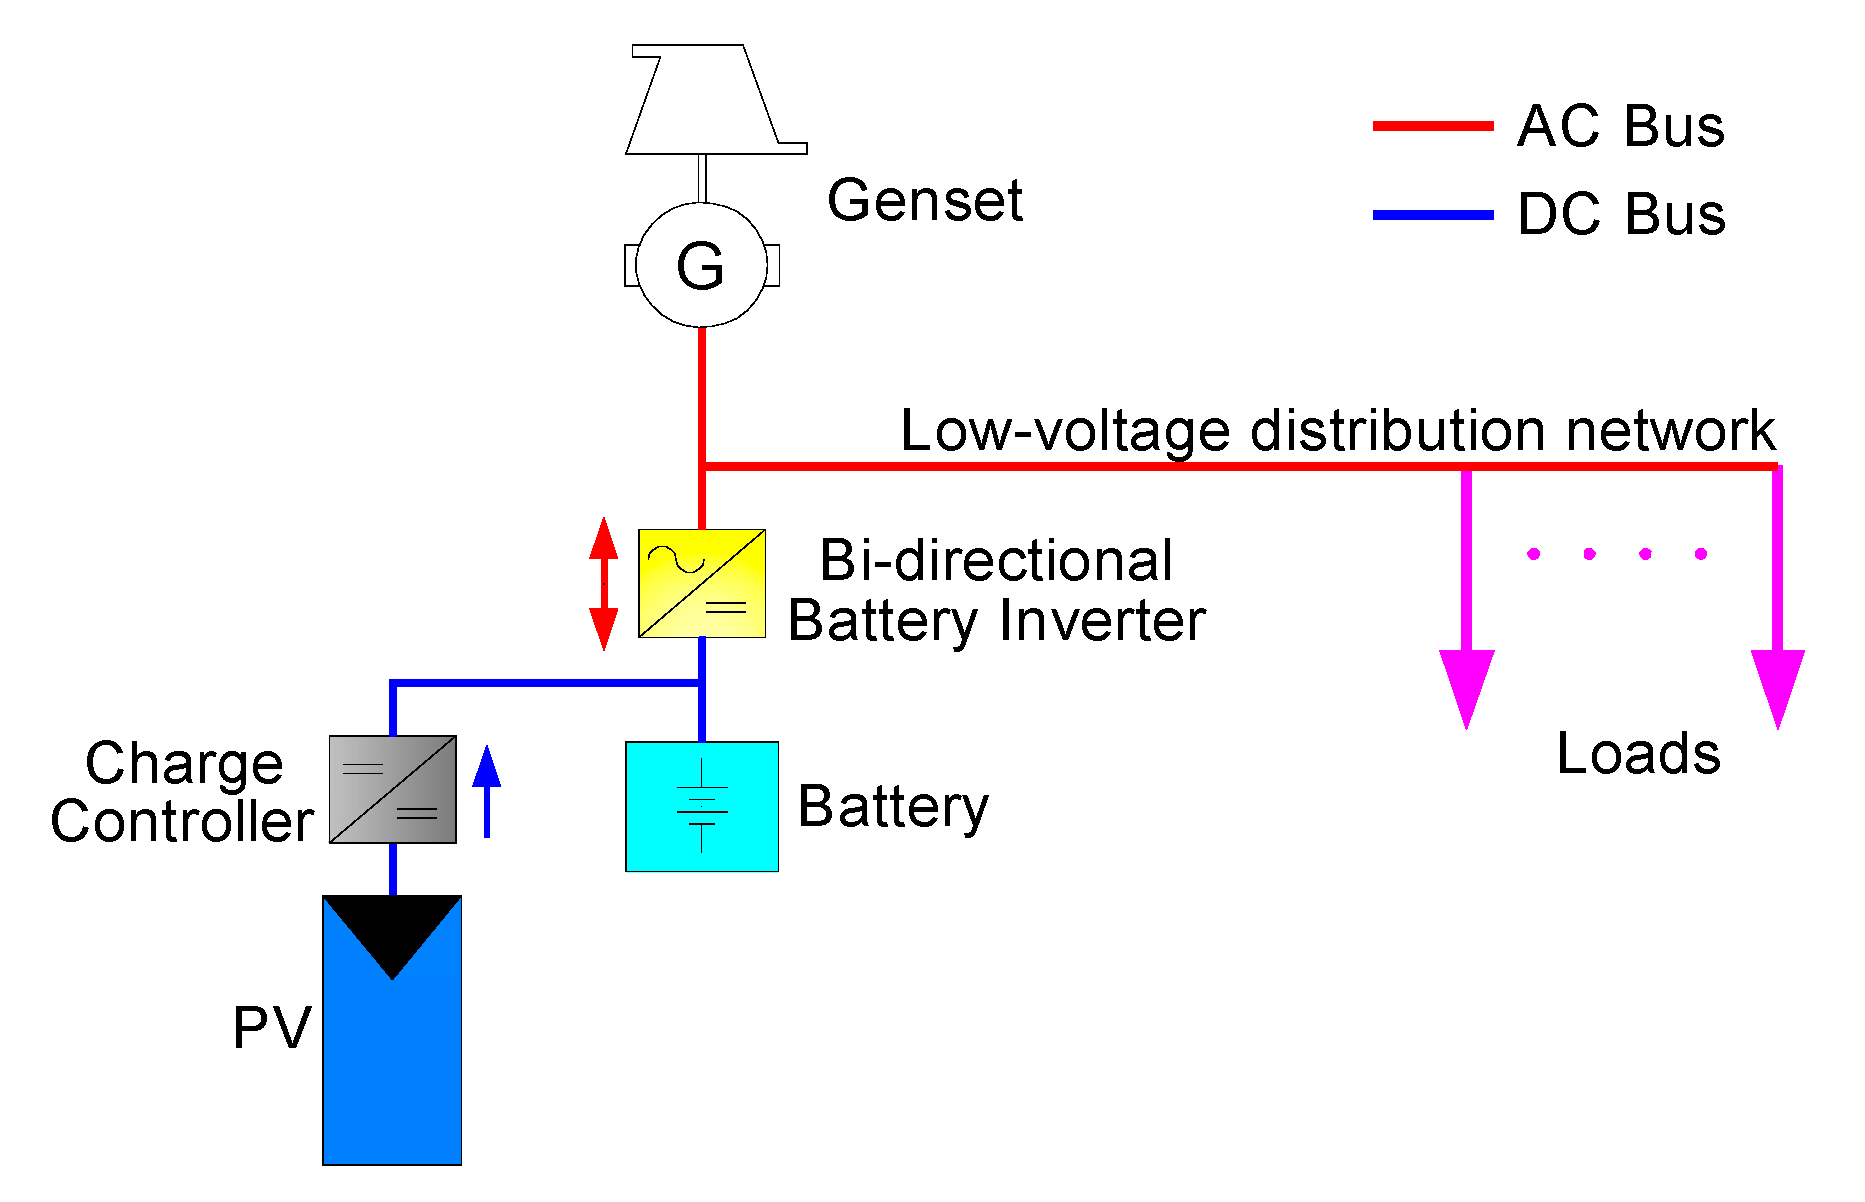
2.1. DC-Coupling Topology

In the DC-coupling topology, a PV array is connected directly to the battery system by a charge controller before being connected to the AC side via battery inverter, as shown in Figure 1. Although there are elements on the AC side, this system is considered DC-coupled because all PV sources are connected on the DC side. A DC bus voltage is typically 12 V, 24 V, or 48 V; therefore, the charge controller is required to regulate the variable output voltage of PV and to help prevent damage to the battery resulting from the charging process. There is currently a variety of charge controller design and regulation methods, with outputs ranging from a few watts up to 3 kW. The power range for a DC-coupled topology is broad and can be used cost-effectively for various off-grid applications [47].

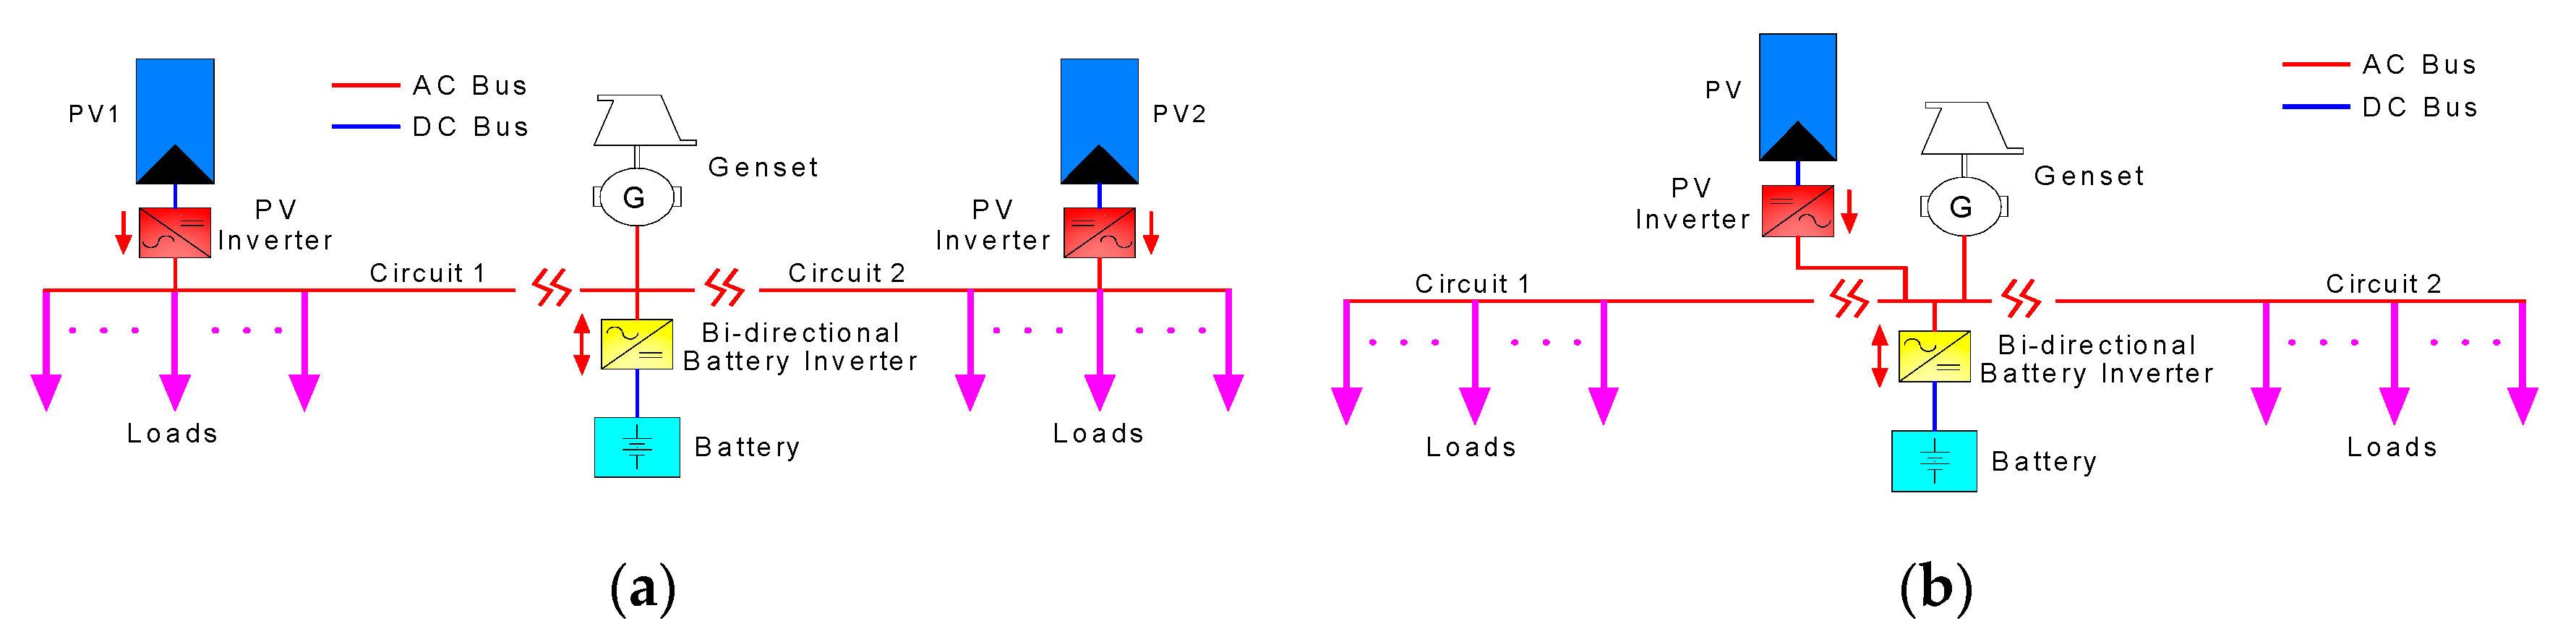
2.2. AC-Coupling Topology

In this type of topology, the coupling of the PV array occurs via an AC power bus by proper DC/AC converters (PV inverter), as shown in Figure 2a. This is the predominant type of microgrids in the literature [39]. In this configuration, the PV inverter operates as a current source with the PQ control strategy, which requires a reference of voltage and of frequency to inject pre-specified values of active and reactive power into the system [44].
Generally, the bi-directional battery inverter provides this reference; however, this can also be provided by the genset. Today, the bi-directional battery inverter is generally associated with the use of the V/f droop functions (droop control) for compatible parallel operation with a genset [32]. Note that by combining the two previous topologies (DC- and AC-coupling), it is possible to create a combined AC-DC-coupling topology, with part of the solar system connected directly to the DC bus and part to the AC side.
The AC-coupling topology can also be sub-classified into dispersed and centralized topologies. In centralized topologies, all PV arrays are connected to a single AC bus (close to the battery inverter and the genset) before connecting to the distribution network, as shown in Figure 2a. In contrast, in dispersed topologies, the PV sources are connected directly to the distribution network at multiple points close to the load, as shown in Figure 2b.

3. Comparative Analyses

Each of the above-mentioned topologies has advantages in one or few aspects among them. Therefore, a quantitative evaluation of PV-diesel-battery microgrid topologies regarding different issues is needed. Herein, the comparison concerns power losses occurring in power conversion devices and in low-voltage distribution networks.
It should be noted that the most important factor influencing power losses is verified to be the balance of the load profile compared to the solar production profile and the PV penetration. This work introduces a new factor, called the matching factor (MF), to weight this balance. The MF is defined as the ratio between the energy factor (EF) and PV penetration.
The EF is calculated by Equation (1), where Edaytime,i is the average daily energy consumed by the load (in the ith month) during the daytime period (12h fixed per day throughout the year is considered as they are communities located close to the equator’s latitude), and ETotal,i is the total average daily energy consumed by the load.
E F = [ i = 1 12 E d a y t i m e , i E T o t a l , i ] / 12 ,
EF in the range of 0.3 to 0.5 can be achieved in the tropical zones, depending on whether the consumption profile is predominantly residential (intensive consumption of energy at night and at dawn) or commercial (intensive energy consumption in the morning and in the afternoon) [52], such as grocery stores, office buildings, health centres, schools, solar-powered pumps, etc. [53]. Therefore, the MF is calculated by Equation (2), where PVpenetration is defined as the ratio of annual PV energy production to the annual energy consumption, expressed as a percentage. MF is a dimensionless parameter and indicates how the energy generated by the PV source could match the electrical load of a community without the need for storage.
M F = E F × 100 P V p e n e t r a t i o n ,
A high value of the MF (MF > 0.8) indicates that solar energy could be used directly by the load. Conversely, a low value (MF < 0.6) indicates that solar energy must be stored for use at night because the demand does not occur at the same time as the solar production, meaning that the power losses in the power converters and in the distribution grid depend on the MF values and on the topology of the microgrid.

3.1. Dispersed Versus Centralized AC-Coupling Topologies

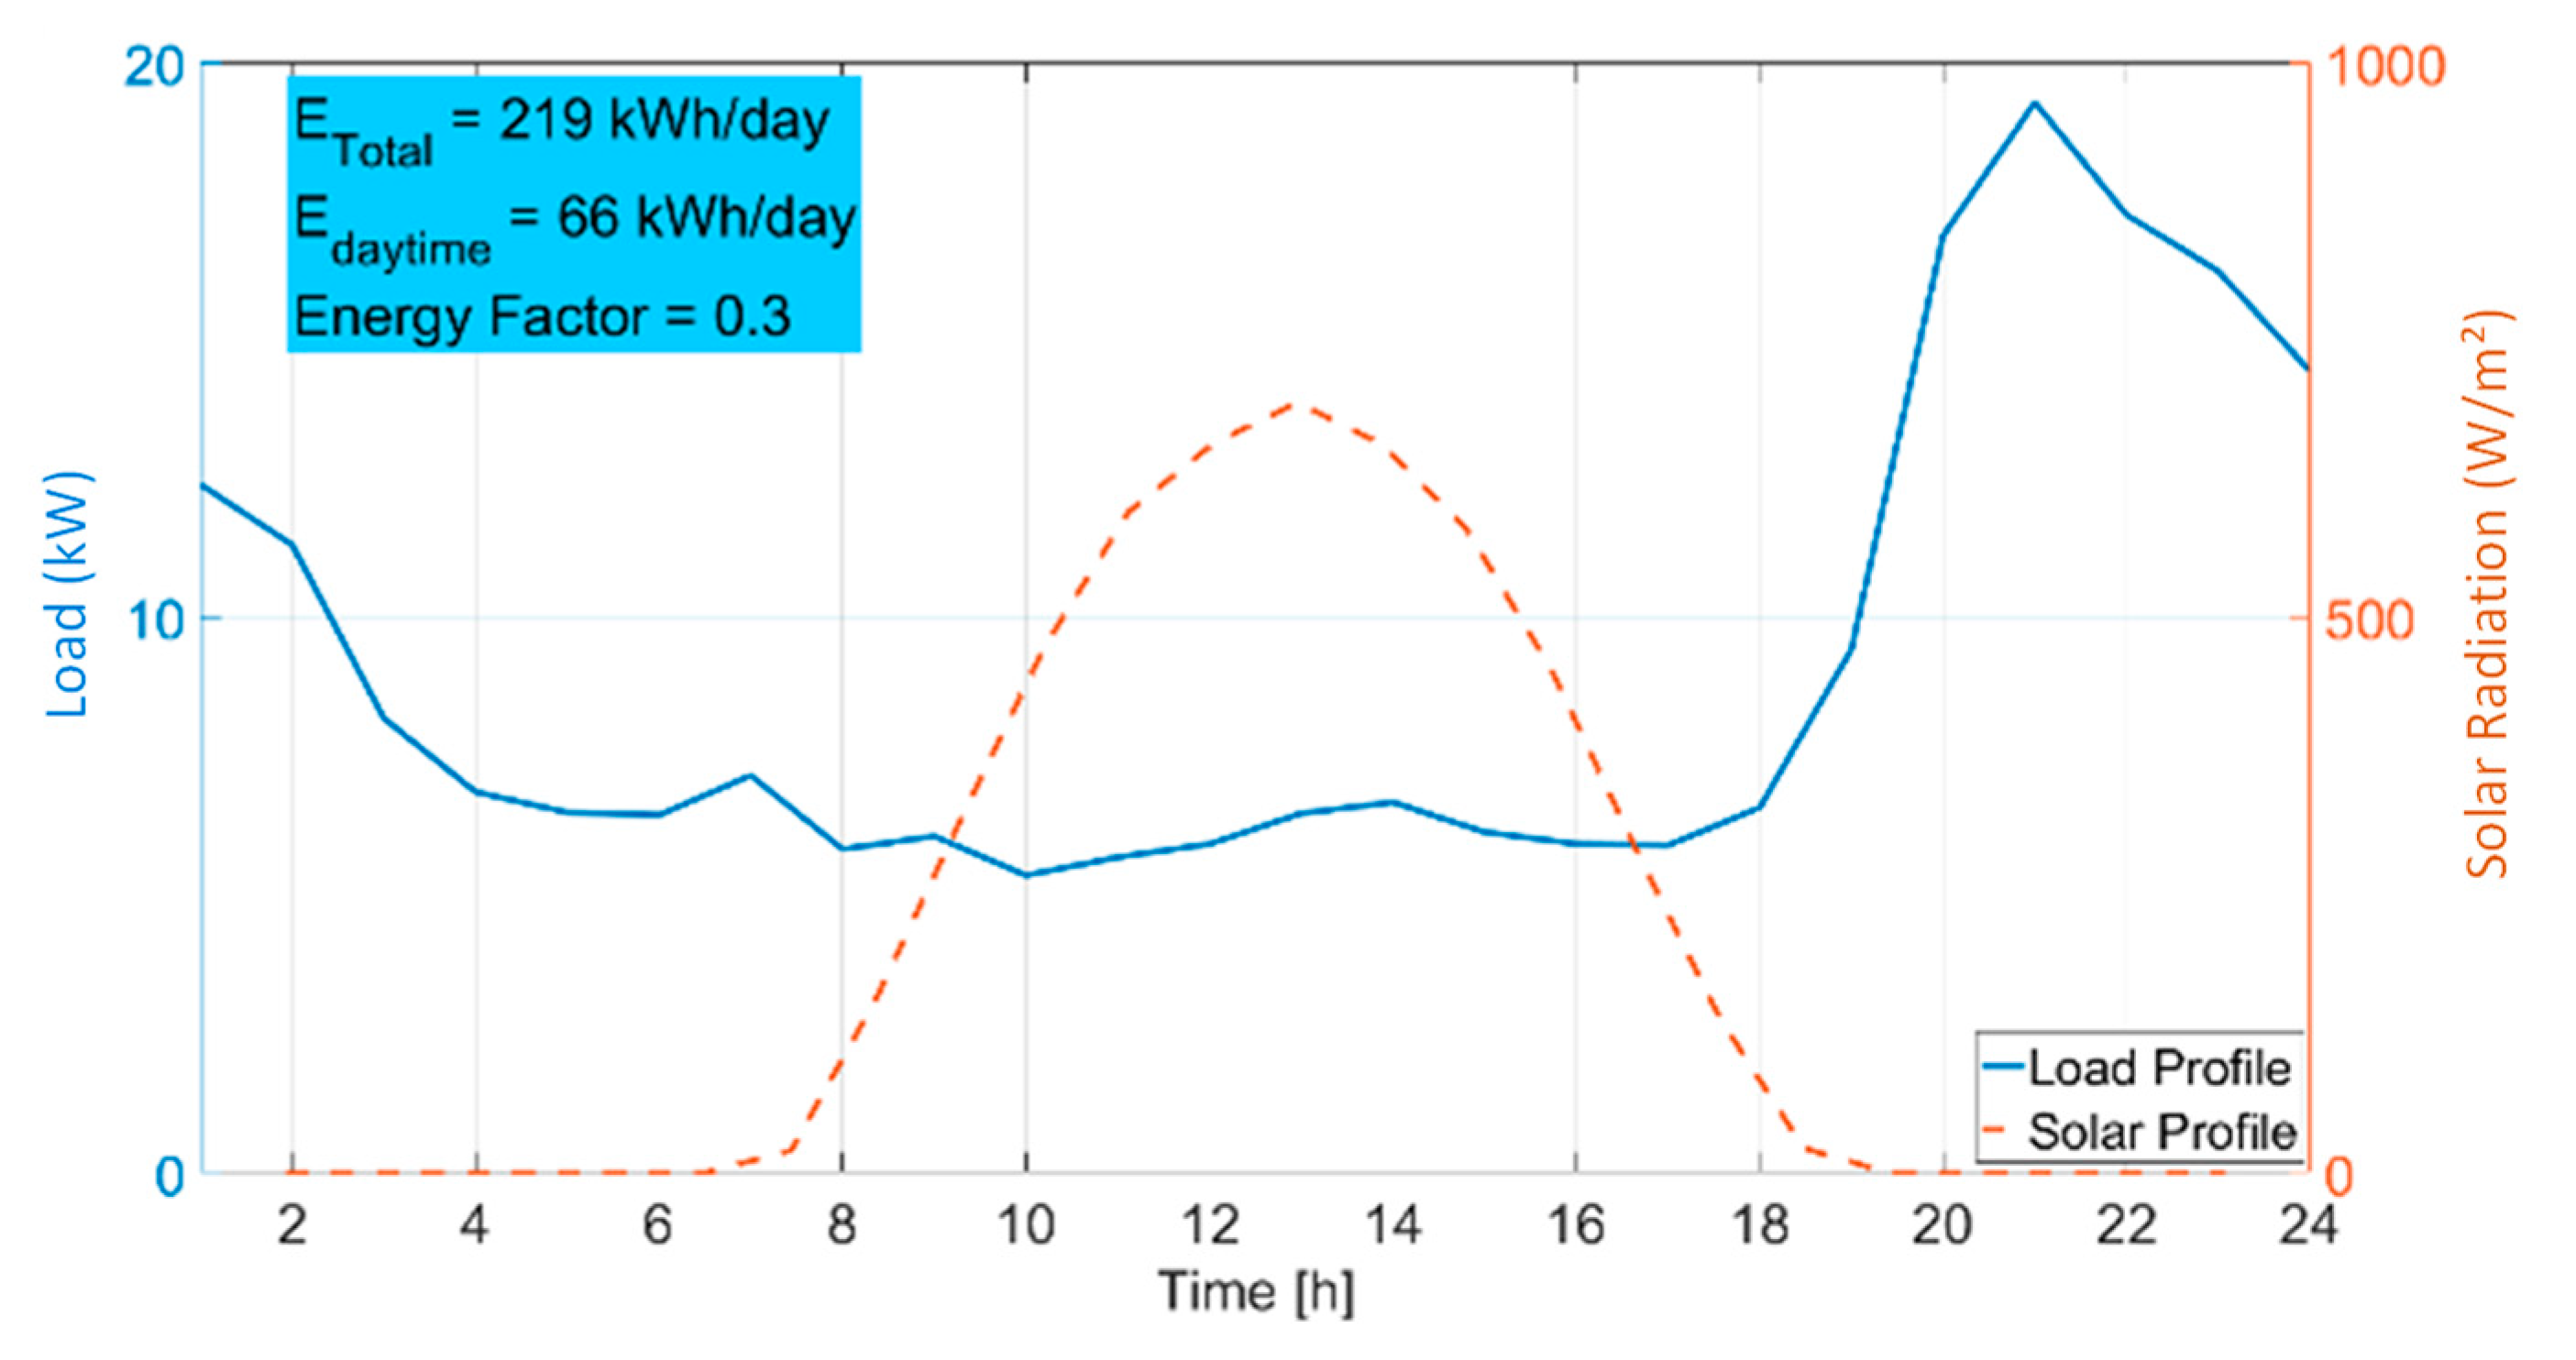
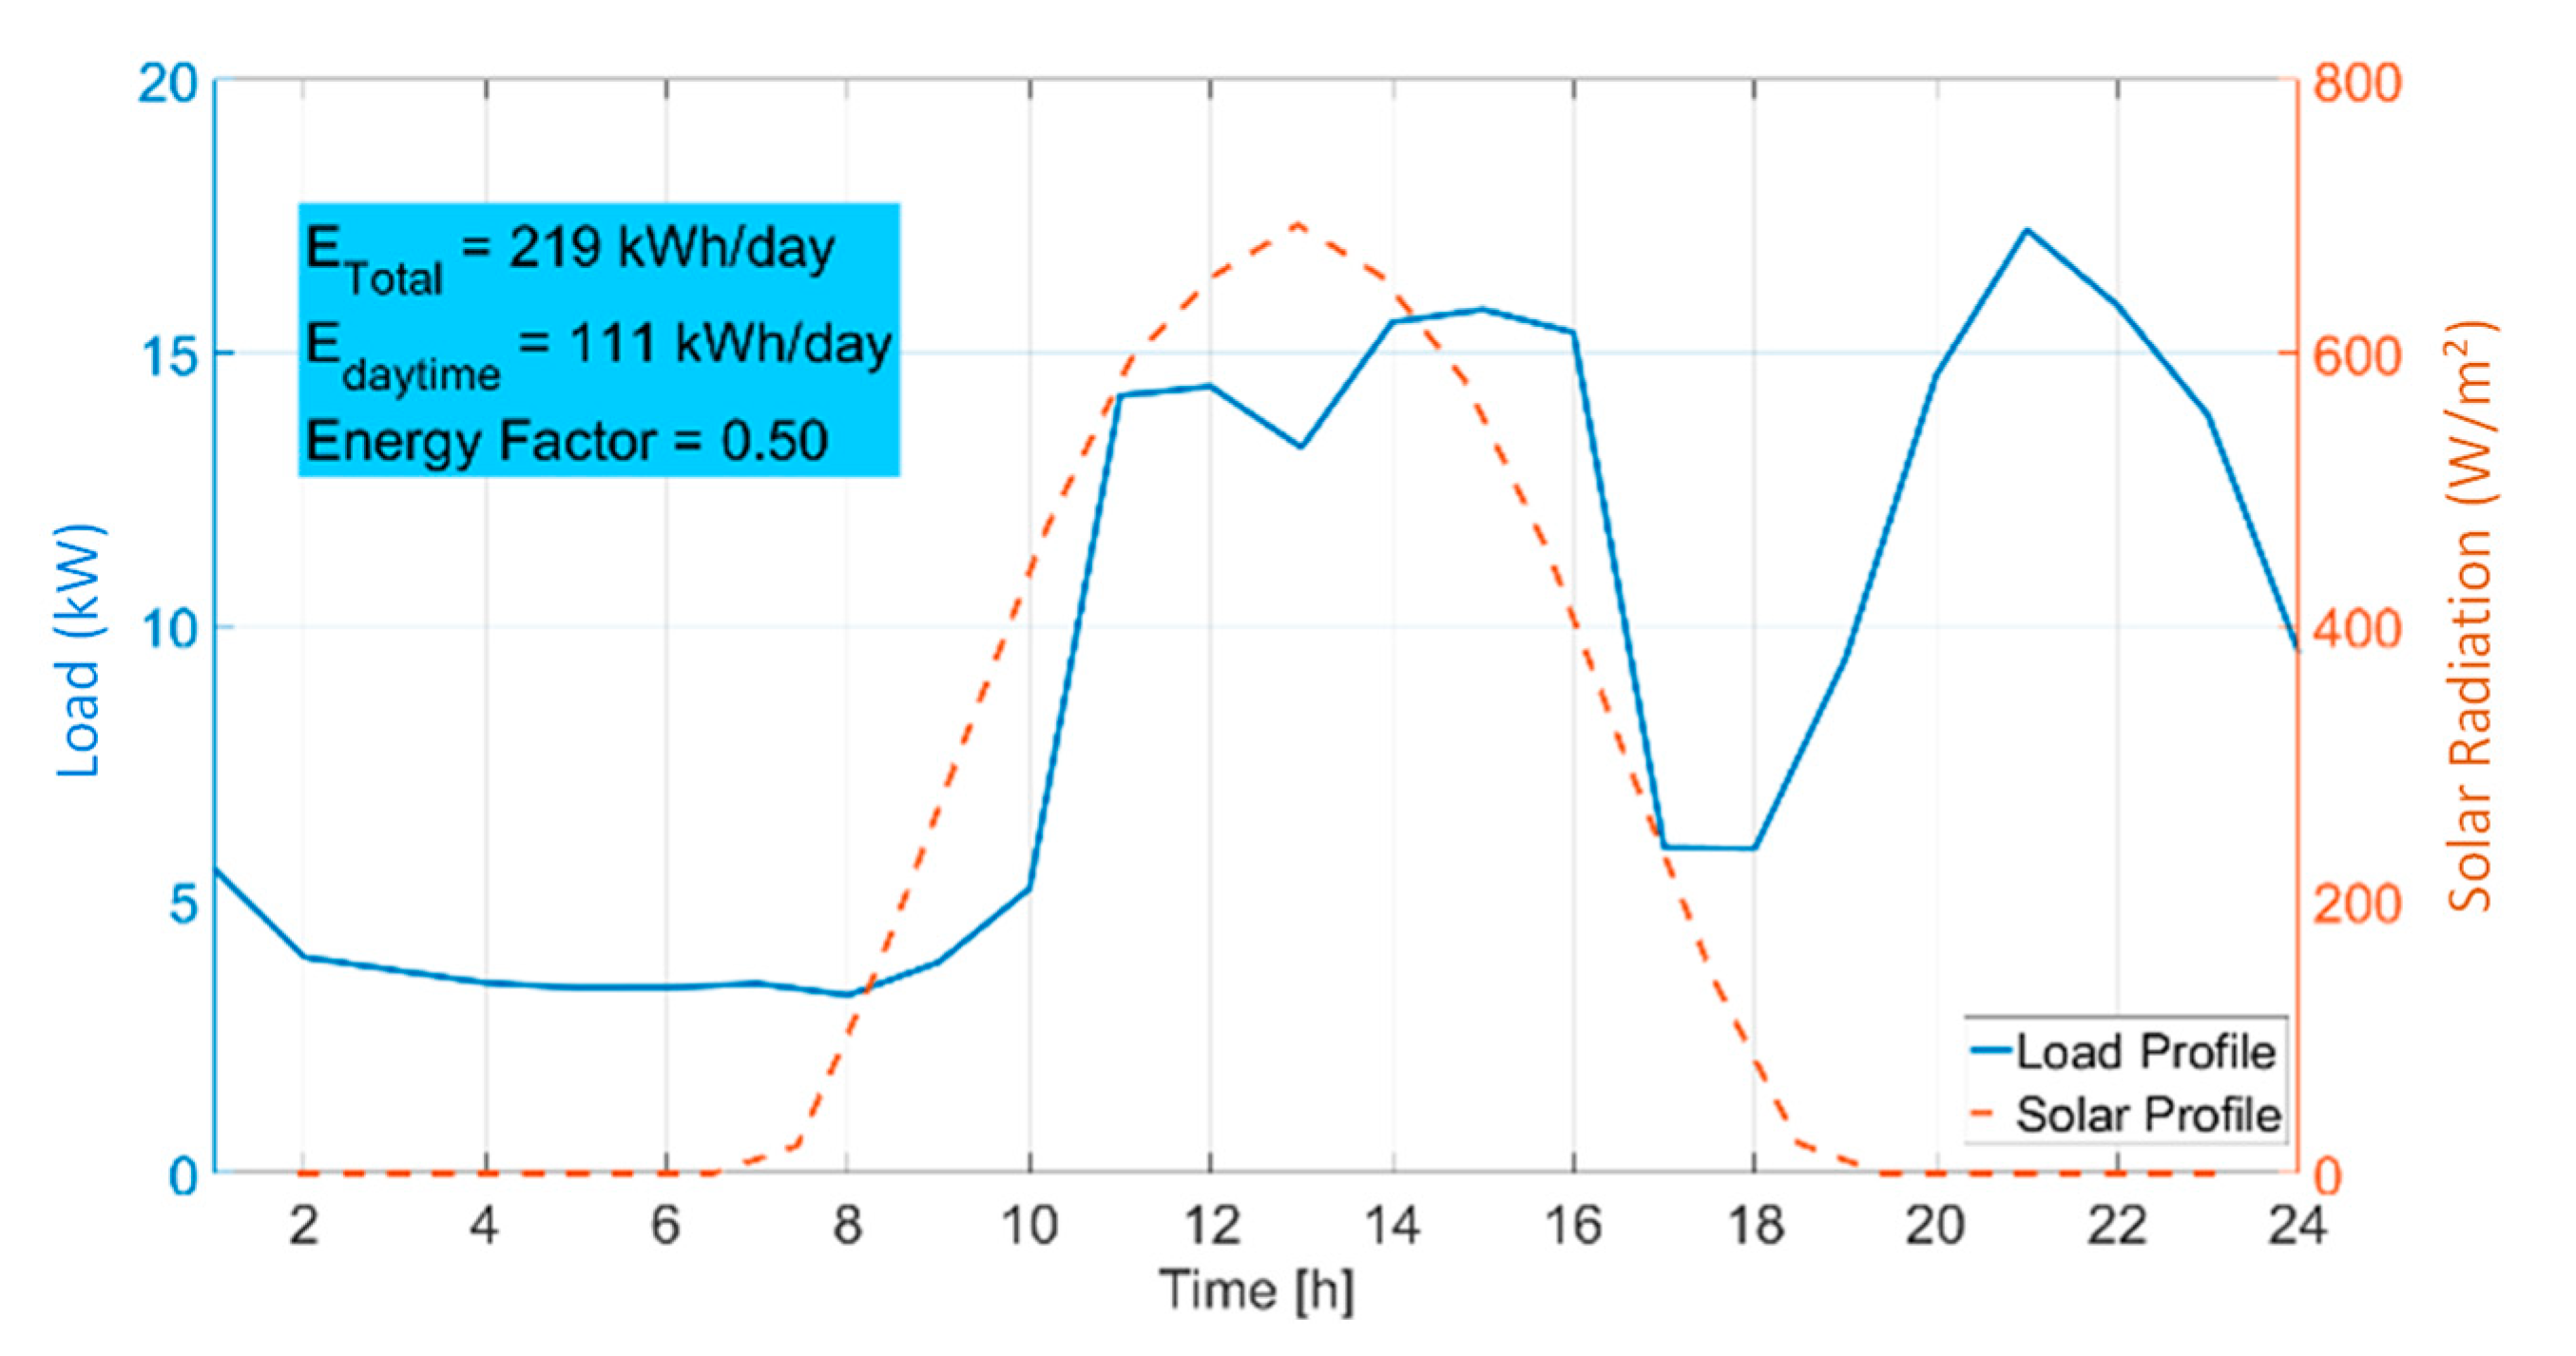
3.1.1. Analytical Approach

The difference between these two topologies is the relative position of the PV source in relation to the load and the battery. In the dispersed topology, the PV source is close to the load but far from the battery. In the centralized topology, the PV source is coupled to the same bus as the battery inverter, therefore close to the battery but far from the load.
Although the losses in the power converters are the same for both topologies, since the conversion steps are the same, it is evident that the dispersed topology has larger power losses in the distribution network than the centralized topology for communities with low MF values, residential profile, and high PV penetration. In this case, there is often an excess of PV energy during the day, which must flow through a long extension of the distribution network until it is finally stored in the battery.
It seems reasonable to think that the opposite is also true, i.e., in communities with high MF values, residential profile with many commercial loads, and low PV penetration, the centralized topology should have higher power losses than the dispersed topology in the distribution network. However, this does not always occur due to the resistive characteristic (R>>X) of the low voltage distribution feeders as explained below.
In phasor notation, the apparent power (S) flowing between the PV inverter and the battery inverter (see Figure 2b) can be calculated by Equation (3) [54], where V1 and V2 are the busbar voltages of the battery inverter and the PV inverter respectively, and Z is the distribution network impedance (R+jX).
S = V 2 ( V 2 V 1 Z ) * ,
By assuming R>>X, Equation (3) can be divided into two equations, which separately express the values of the active and the reactive power, see Equations (4) and (5) [54], where δ is the angle between V1 and V2.
P = | V 2 | · ( | V 2 | | V 1 | · cos δ ) R ,
Q = | V 1 | · | V 2 | · sin δ R ,
As Equation (4) shows, in low-voltage networks, the voltage difference ( | V 2 | | V 1 | ) is proportional to the active power. Thus, the injection of active power will lead to a voltage increase, which can be a problem since the PV inverter bus voltage would exceed the permissible values, and the PV inverter would disconnect from the grid. Therefore, the absorption of a large amount of reactive power by the PV inverter is necessary to reduce the voltage again.
However, Equation (5) shows that the absorption of reactive power leads to an increase of δ and, consequently, to a substantial increase of the current flow between the PV inverter and the battery inverter, which finally causes an increase in power losses ( I 2 . R ) in the distribution network.
Consequently, it should not be a foregone conclusion that a dispersed AC-coupling topology would automatically have fewer power losses than a centralized AC-coupling topology in communities with a high MF. It all depends on the amount of reactive power needed to keep the voltage at proper levels, which depends on the electrical characteristics of the network. Therefore, regarding power losses in the distribution network, the operation of the PV inverter with the unity power factor (PF) is the best alternative, as long as the voltage does not exceed the maximum limits.
Notice that the internal losses in the PV inverters also increase as the PF drops due to several reasons (conduction losses, switching losses, level of ripple on the DC bus, etc.) [55]; however, these losses are common to both topologies.

3.1.2. Simulation Approach

In this section, detailed long-term simulations of dispersed and centralized AC-coupling topologies are performed with the aid of MATLAB/Simulink, and the efficiency of each topology is analysed in different situations. It should be emphasized that the mathematical models used in the simulations were validated by real data monitored for a period of one year (between 2015 and 2016) in four isolated communities located in the state of Pará, in the Brazilian Amazon region [56].
This region has almost 45% of the Brazilian territory, although it has approximately 3% of the population [49]. In addition, it has the largest number of households without access to the electricity grid in the country [49,50,51]. In this sense, it is necessary to improve and expand access to energy for the region, which includes understanding social dynamics and human factors [14], and this depends on individual decision-making [52] and energy policies linked to public electrification policies [3,53]. It must also create opportunities for private sector participation, and for this, it is important that the government establishes appropriate policies for the expansion of private business [54].
In this case, given the importance of ensuring access to quality energy and flexibility over time. A typical riverside community of the Brazilian Amazon was used, composed of 40 to 65 families, with monthly residential electricity consumption between 50 kWh and 100 kWh, distributed over an area of approximately 10 hectares to analyse the performance of the centralized and dispersed topology via simulation.
The PV-diesel-battery microgrid used in the simulation is composed of one genset of 24 kW rated power, assumed to run on cycle charging mode with a setpoint state of charge of 85%, it means that the genset does not stop charging the battery bank until it reaches 85% state of charge (SOC), [57,58,59] and one battery bank of 9000 Ah × 48 V (432 kWh), designed to provide a minimum autonomy of 48 h for the system as established by the Brazilian electricity standards [55].
The distribution network (three-phase: 220 V phase-to-phase) consists of two radial feeders, with a cable cross-section of 35 mm2 and a length of 300 m (Z = 0.33 + j0.035 Ω), designed to have a maximum voltage drop of 0.05 pu during the maximum demand condition (~21 h) at the farthest point of the network, as established by the Brazilian electricity standards. For the dispersed topology, see Figure 3a, the microgrid is considered to have two PV generators, one in each feeder, located in the load centre of each circuit. In contrast, in the centralized topology, see Figure 3b, there is only one PV generator connected to the same bus of the genset and the battery inverter. The PV generators comprise polycrystalline PV modules of 275 Wp, connected in either parallel or series combinations to reach the desired power level, since the installed capacity of the PV modules is not a fixed value, as it varies depending on the PV penetration considered in each simulated case, as shown in Table 1.
By keeping the size of the genset and the battery bank constant, as well as the average daily electricity consumption and solar radiation, the PV penetration and the load profile were modified, and the effect on the power losses in the distribution network for both topologies was investigated.
The three load profiles correspond to (i) a typical residential curve (see Figure 4), (ii) a residential curve with a small number of commercial loads (see Figure 5), and (iii) a curve with a lot of commercial loads as well as residential load (see Figure 6). Note that all load profiles have the same average daily electricity consumption (219 kWh/day); however, the energy factors are different for each case, varying between 0.3 and 0.5. In turn, the solar profile is constant for all cases and corresponds to a location near the equator (0.5° S).
In order to evaluate the influence of the PF of the PV inverter on the power losses in the distribution network, two scenarios were considered for the dispersed AC-coupling topology. In the first, the solar inverters operate with unity PF. In the second, the inverters operate with 0.9 lagging (inductive) PF. The results are presented in Table 1. It is worth noting that the maximum busbar voltage observed during the simulations for scenarios with unity PF was 1.05 pu. For a better understanding of the results, the annual power losses in the distribution network were plotted as a function of the matching factor (see Figure 7).
As expected, the analysis of Figure 7 shows that in a dispersed topology, the power losses increase due to the non-unity PF operation of the PV inverters, regardless of the MF value. However, the relationship between dispersed and centralized power losses is observed to be a function of the MF and PF. For unity PF, the dispersed topology has lower power losses than the centralized topology for an MF above 0.8, and it is necessary to achieve MF values above 1.2 to have the same result with a 0.9 lagging PF.
From Table 1, it is possible to verify that these high MF values, in which MF values below 0.6 are considered as “low MF” and MF values greater than 0.8 are considered as “high MF”, correspond to scenarios with PV penetration smaller than or equal to 50%. Conversely, there is a difference of about 50% in the level of power losses, between dispersed and centralized topologies, for low MF values. However, as the MF increases, this difference drops to approximately 15%.
In order to analyse the impact of the topology on the overall performance of the PV-diesel-battery microgrid, the BOS efficiency performance index was used, calculated according to the IEC Standard 61724:1998 [51] (see Figure 8). Note that the BOS efficiency represents the efficiency of all components of a microgrid other than the PV modules. This includes inverters, charge controllers, battery bank, and distribution network.
From the results, the centralized topology is beneficial in most situations. For low values of the MF, the gain obtained (with the centralized topology) in BOS efficiency is 1.5% as compared to the dispersed topology operating with a 0.9 lagging PF (this gain drops to 0.9% for unity PF). For high values of the MF, the centralized topology has almost the same BOS efficiency as the dispersed topology, regardless of the PF. Yet, as the MF increases, the BOS efficiency also increases, independently of the topology of the microgrid (centralized or dispersed). This is because high MF values are associated with low PV penetration, as shown in Table 1. Consequently, power losses in PV inverters are lower for high MF values than for low ones.
Considering the high initial capital cost of an autonomous PV-diesel-battery microgrid, it is imperative to operate the system as efficiently as possible. Thus, although a gain of 1.5% may seem insignificant, notice that in terms of energy for the presented example, this percentage represents 138 kWh/month, i.e., close to the consumption of two consumer units with average monthly electricity consumption of 70 kWh.

3.2. AC- Versus DC-Coupling Topologies

3.2.1. Analytical Approach

The emphasis in this section is on power losses occurring in the battery inverter, which are different according to the microgrid topology and the MF value, as explained below.
If the MF is low (residential profile and high PV penetration), the excess of solar energy generated during the day must be stored in the battery for later use. In this case, the DC topology is verified to have better efficiency than the AC topology due to the removal of one conversion step in the battery inverter. In the AC topology, solar energy must pass through the bi-directional battery inverter in the AC/DC direction (rectifier mode) during the day and in the DC/AC direction (inverter mode) at night. This dual conversion results in reduced conversion efficiency.
The opposite occurs in the case of a high MF value (residential profile with a lot of commercial loads and low PV penetration). In this scenario, the AC topology presents lower power losses because the solar energy is consumed directly by the loads, without the need to pass through the battery inverter, improving the efficiency of the system due to the removal of a conversion step.
To approximately calculate the efficiency with which the solar energy is transmitted to the loads, the following assumptions and simplifications were made to compare both topologies: (i) solar energy, at a given moment, is transmitted entirely to the load or stored in the battery but not both at the same time; (ii) regardless of which topology is used, the efficiency of the main components of the microgrid are considered constant and similar to those shown in Table 2; and (iii) the power losses in the DC network are null for all cases.
Thus, for low MF values it has:
E l o a d A C = E s o l a r × η P V   i n v . ×   η B a t   i n v . × η B a t ×   η B a t   i n v . = 0.72   E s o l a r ,
E l o a d D C = E s o l a r   ×   η c h a r g .   c o n t   ×   η B a t   ×   η B a t   i n v . = 0.77   E s o l a r ,
where E l o a d A C and E l o a d D C are the solar energy (Esolar) transmitted to the loads in an AC and a DC topology, respectively. On the other hand, for high MF values it has:
E l o a d A C = E s o l a r   ×   η P V   i n v . = 0.96   E s o l a r ,
E l o a d D C = E s o l a r   ×   η c h a r g     c o n t   ×   η B a t   i n v . = 0.88   E s o l a r ,
As observed, there is a 5% difference in the efficiency with which the solar energy is transmitted to the loads between an AC or DC topology for low MF values and a slightly larger difference of 8% for high MF values. Table 1 illustrates that low MF values correspond to scenarios with high PV penetration (~75%) and high MF values are associated with low PV penetration scenarios (~25%). Thus, the difference in BOS efficiency ( Δ B O S   e f f i ) for both topologies can be calculated by (10), where Δ E l o a d = | E l o a d A C E l o a d D C |   is calculated for low and high values of the MF. The results are presented in Table 3. Notice that for low MF values, the DC-coupling topologies show a 3.8% gain in the BOS efficiency as compared to the AC-coupling topologies. In contrast, for high MF values, the AC-coupling topologies have a 2% gain over DC-coupling topologies.
Δ B O S   e f f i = Δ E l o a d   ×   P V p e n e t r a t i o n ,

3.2.2. Simulation Approach

In this section, detailed simulations of centralized AC- and DC-coupling topologies are performed with the aid of MATLAB/Simulink. The same PV-diesel-battery microgrid example of Section 3.1.2 is used, with the three annual average load profiles and the solar profile shown in Figure 4, Figure 5 and Figure 6.
To broaden the analyses, combined AC-DC-coupling topologies were also analysed. For this, the AC-coupled PV power was varied between 100% and 0% in steps of 33%, maintaining the total PV power of the system (PVAC + PVDC) constant. Notice that a value of 100% corresponds to a topology coupled only in AC, and 0% corresponds to a topology coupled purely in DC. The BOS efficiency for each scenario is shown in Figure 9.
As expected, for low values of the MF, the DC topology has better performance than the AC topology and vice versa; however, the difference in BOS efficiency is not as significant as that shown in Table 3, mainly for low values of the MF. For both high and low MF values, the difference in BOS efficiency is approximately 1.2%.
This can be explained by the assumptions made in Section 3.2.1. Not being entirely true. First, the DC topology has an extra power loss in the DC network. Second, the battery efficiency is not constant, and it strongly depends on the charging current. In the AC topology, the battery charging current is limited by the maximum power of the battery inverter, which, for economic reasons and optimized system design, is much less than the maximum charging power that the battery can withstand for states of charge between 0% and 85%. In contrast, in the DC topology, the battery charging current only depends on the PV power installed on the DC side, within the battery charging limits. Thus, the battery charging current for DC topologies is often higher than for AC topologies; consequently, the average battery efficiency is lower in DC topologies, as shown in Figure 10.
Finally, not all solar energy at a given moment is transmitted entirely to the load or stored in the battery. There is a midway point between these two extremes that depends on the MF value. For this reason, the combined AC-DC-coupling topologies have better performance than the AC or DC topologies for a wide range of MF values.
It is observed that combined AC-DC topologies with 33% AC have the best performance up to values of 0.6 MF. Between 0.6 MF and 0.8 MF, the combined topologies with 66% AC have the best performance. For high MF values, greater than 0.8, the AC-coupling topologies (100% AC) have the best efficiency.

4. Conclusions

A detailed comparative study of dispersed versus centralized AC-coupling topologies and AC-coupling versus DC-coupling topologies in autonomous PV-diesel-battery microgrids was performed. The analyses were performed from the point of view of system efficiency, i.e., the comparison concerns power losses occurring in power conversion devices and low-voltage distribution network by using the BOS efficiency as a performance index.
A new factor, called the matching factor (MF), was introduced to allow a better understanding of the microgrid performance as a function of the relationship among the load profile, solar profile, and PV penetration. A high MF value (>0.8) indicates that the solar energy could be used directly by the load; a low MF value (<0.6) indicates that the solar energy must be stored for the night period; the demand does not occur at the same time as the solar production. The MF proved to be useful as a design parameter for selecting the optimal topology of a PV-diesel-battery microgrid.
The results show that when comparing dispersed and centralized AC topologies, a centralized topology is beneficial in most situations. For low values of the MF, the gain obtained in BOS efficiency is 1.5%. For high values of the MF, the centralized topology has almost the same BOS efficiency as the dispersed topology.
On the other hand, when comparing DC, AC, and combined AC-DC-coupling topologies, the 33% AC combined topology has the best performance up to values of 0.6 MF. The best performance between an AC and DC topology depends on the MF. An AC topology will not always perform better than a DC. In the case of having a reduced MF (<0.6), a DC topology presents better efficiency. A reduced MF represents a predominantly residential load profile, which is the most common case found in isolated communities in the Amazon region. The gains in BOS efficiency are approximately 1.2%.

Author Contributions

Conceptualization, V.S. and S.R.; methodology, J.M.-B. and R.H.; software, J.M.-B.; validation, J.M.-B., R.H., and V.S.; formal analysis, J.M.-B. and V.S.; investigation, V.S. and S.R.; resources, M.Z., M.S., and E.F.; data curation, J.M.-B. and R.H.; writing—original draft preparation, J.M.-B., V.S., and S.R.; writing—review and editing, M.Z.; supervision, E.F. and M.S.; project administration, M.S.; funding acquisition, E.F. and M.S. All authors have read and agreed to the published version of the manuscript.

Funding

This work was partially financed by Coordenação de Aperfeiçoamento de Pessoal de Nível Superior Brasil (CAPES). Vinicius Silva and Stefania Relva thank especially CNPQ (Conselho Nacional de Desenvolvimento Científico e Tecnológico) for the scholarship. The authors thank especially the current financial support from ANEEL through the R and D ANEEL PD-2331-0021-2011.

Conflicts of Interest

The authors declare no conflict of interest.

References

  1. Grimoni, J.A.B.; Galvão, L.C.R.; Udaeta, M.E.M.; Kanayma, P.H. Introduction to Concepts of Energy Systems for Clean Development [Iniciação a conceitos de sistemas energéticos para o desenvolvimento limpo], 2nd ed.; Edusp: São Paulo, Brazil, 2015. [Google Scholar]
  2. The World Bank. The World Bank Data. 2018. Available online: https://data.worldbank.org/country/brazil?view=chart (accessed on 10 May 2018).
  3. International Energy Agency. WEO-2017 Special Report: Energy Access Outlook; International Energy Agency: Paris, France, 2017. [Google Scholar]
  4. Macedo, W.N.; Monteiro, L.G.; Gorgozinho, I.M.; Macedo, E.N.; Rendeiro, G.; Braga, V.; Bacha, L. Biomass based microturbine system for electricity generation for isolated communities in amazon region. Renew. Energy 2016, 91, 323–333. [Google Scholar] [CrossRef]
  5. REN21. Renewables 2019: Global Status Report; REN21 Secretariat: Paris, France, 2019. [Google Scholar]
  6. González-Eguino, M. Energy poverty: An overview. Renew. Sustain. Energy Rev. 2015, 47, 377–385. [Google Scholar] [CrossRef]
  7. Figueirêdo Neto, G.S.; Rossi, L.A. Photovoltaic energy in the enhancement of indigenous education in the Brazilian Amazon. Energy Policy 2019, 132, 216–222. [Google Scholar] [CrossRef]
  8. Andrade, C.S.; Rosa, L.P.; da Silva, N.F. Generation of electric energy in isolated rural communities in the Amazon Region a proposal for the autonomy and sustainability of the local populations. Renew. Sustain. Energy Rev. 2011, 15, 493–503. [Google Scholar] [CrossRef]
  9. Cuesta, M.A.; Castillo-Calzadilla, T.; Borges, C.E. A critical analysis on hybrid renewable energy modeling tools: An emerging opportunity to include social indicators to optimise systems in small communities. Renew. Sustain. Energy Rev. 2020, 122, 109691. [Google Scholar] [CrossRef]
  10. Udaeta, M.E.M.; Gimenes, A.L.V.; Rigolin, P.H.D.; Bernal, J.L.D. Model of Energy Planning Considering both Energy Supply & Demand as Resources for Sustainable Development. In Energy Planning: Approaches and Assessment, 1st ed.; Gonzalez, J., Ed.; Nova Science Publisher: Hauppauge, NY, USA, 2016; pp. 1–34. [Google Scholar]
  11. Udaeta, M.E.M.; Galvão, L.C.R.; da Rigolin, P.H.C.; de, O.; Bernal, J.L. Full assessment energy-sources for inclusive energy-resources planning. Renew. Sustain. Energy Rev. 2016, 66, 190–206. [Google Scholar] [CrossRef]
  12. de, O.; Bernal, J.L. Model of Integration of Energy Resources with Consideration of Delimiters of Potential Energy Resources Aiming at the Preferential Plan of Integrated Resource Planning [Modelo de Integração de Recursos Energéticos com Consideração de Delimitadores de Pote; Escola Politécnica da Universidade de São Paulo: São Paulo, Brazil, 2018. [Google Scholar]
  13. da, C.; Rigolin, P.H. Development of a System to Classify Energy Resources of Supply and Demand based on the Calculation and Valuation of the Full Potential of Energy Resources within the Integrated Planning of Energy Resources [Desenvolvimento de um Sistema para Classificar r; Escola Politécnica da Universidade de São Paulo: São Paulo, Brazil, 2013. [Google Scholar]
  14. Maruyama, F.M.; Udaeta, M.E.M.; da Silva, V.O.; Gimenes, A.L.V. Bases for the Preferential Plan from an Integrated Energy Resources Planning; IOP Conf. Ser. Earth Environ. Sci. 2018, 188, 012046. [Google Scholar] [CrossRef]
  15. Cross, S.; Padfield, D.; Ant-Wuorinen, R.; King, P.; Syri, S. Benchmarking island power systems: Results, challenges, and solutions for long term sustainability. Renew. Sustain. Energy Rev. 2017, 80, 1269–1291. [Google Scholar] [CrossRef]
  16. Sánchez, A.S.; Torres, E.A.; Kalid, R.A. Renewable energy generation for the rural electrification of isolated communities in the Amazon Region. Renew. Sustain. Energy Rev. 2015, 49, 278–290. [Google Scholar] [CrossRef]
  17. Hatziargyriou, N.; Margaris, I.; Stavropoulou, I.; Papathanassiou, S.; Dimeas, A. Noninterconnected Island Systems: The Greek Case. IEEE Electrif. Mag. 2017, 5, 17–27. [Google Scholar] [CrossRef]
  18. Yao, L.; Shi, X.; Andrews-Speed, P. Conceptualization of energy security in resource-poor economies: The role of the nature of economy. Energy Policy 2018, 114, 394–402. [Google Scholar] [CrossRef]
  19. Ehnberg, J. Generation Reliability for Isolated Power Systems with Solar, Wind and Hydro Generation; Chalmers University of Technology: Gothenburg, Sweden, 2003. [Google Scholar]
  20. Mazzone, A. Decentralised energy systems and sustainable livelihoods, what are the links? Evidence from two isolated villages of the Brazilian Amazon. Energy Build. 2019, 186, 138–146. [Google Scholar] [CrossRef]
  21. Ahadi, A.; Kang, S.K.; Lee, J.H. A novel approach for optimal combinations of wind, PV, and energy storage system in diesel-free isolated communities. Appl. Energy 2016, 170, 101–115. [Google Scholar] [CrossRef]
  22. Shahsavari, A.; Akbari, M. Potential of solar energy in developing countries for reducing energy-related emissions. Renew. Sustain. Energy Rev. 2018, 90, 275–291. [Google Scholar] [CrossRef]
  23. Carta, J.A.; González, J.; Gómez, C. Operating results of a wind-diesel system which supplies the full energy needs of an isolated village community in the Canary Islands. Sol. Energy 2003, 74, 53–63. [Google Scholar] [CrossRef]
  24. Chauhan, A.; Saini, R.P. Techno-economic feasibility study on Integrated Renewable Energy System for an isolated community of India. Renew. Sustain. Energy Rev. 2016, 59, 388–405. [Google Scholar] [CrossRef]
  25. Ranaboldo, M.; Domenech, B.; Reyes, G.A.; Ferrer-Martí, L.; Pastor Moreno, R.; García-Villoria, A. Off-grid community electrification projects based on wind and solar energies: A case study in Nicaragua. Sol. Energy 2015, 117, 268–281. [Google Scholar] [CrossRef] [Green Version]
  26. Hills, J. Getting the Measure of Fuel Poverty: Final Report of the Fuel Poverty Review; ASE: London, UK, 2012. [Google Scholar]
  27. Al-Shamma’a, A.A.; Addoweesh, K.E. Techno-economic optimization of hybrid power system using genetic algorithm. Int. J. Energy Res. 2014, 38, 1608–1623. [Google Scholar] [CrossRef]
  28. Rashed, M.; Elmitwally, A.; Kaddah, S. New control approach for a PV-diesel autonomous power system. Electr. Power Syst. Res. 2008, 6, 949–956. [Google Scholar] [CrossRef]
  29. Malla, S.G.; Bhende, C.N. Enhanced operation of stand-alone ‘Photovoltaic-Diesel Generator-Battery’ system. Electr. Power Syst. Res. 2014, 107, 250–257. [Google Scholar] [CrossRef]
  30. Ohijeagbon, O.D.; Oluseyi, A.; Waheed, O.; Adekojo, M.; Salawu, E.Y.; Oyawale, F.A. Design of Optimal Hybrid Renewable Energy System for Sustainable Power Supply to Isolated-grid Communities in North Central, Nigeria. Procedia Manuf. 2019, 35, 278–284. [Google Scholar] [CrossRef]
  31. Rakhshani, E.; Mehrjerdi, H.; Iqbal, A. Hybrid wind-diesel-battery system planning considering multiple different wind turbine technologies installation. J. Clean. Prod. 2020, 247, 119654. [Google Scholar] [CrossRef]
  32. Martinez, J.R.; Saidel, M.A.; Fadigas, E.A. Influence of non-dispatchable energy sources on the dynamic performance of MicroGrids. Electr. Power Syst. Res. 2016, 131, 96–104. [Google Scholar] [CrossRef]
  33. Ayodele, T.R.; Ogunjuyigbe, A.S.O.; Ibitoye, T.Y. Optimal selection of pumped hydro storage based renewable energy generator(s) for isolated community using binary sort and search algorithm. Renew. Energy Focus 2019, 28, 100–111. [Google Scholar] [CrossRef]
  34. Sharafi, M.; ElMekkawy, T.Y. A dynamic MOPSO algorithm for multiobjective optimal design of hybrid renewable energy systems. Int. J. Energy Res. 2014, 38, 1949–1963. [Google Scholar] [CrossRef]
  35. Hassan, M.A.; Abido, M.A. Real time implementation and optimal design of autonomous microgrids. Electr. Power Syst. Res. 2014, 109, 118–127. [Google Scholar] [CrossRef]
  36. Xiao, J.; Bai, L.; Li, F.; Liang, H.; Wang, C. Sizing of energy storage and diesel generators in an isolated Microgrid using discrete fourier transform (DFT). IEEE Trans. Sustain. Energy 2014, 5, 907–916. [Google Scholar] [CrossRef]
  37. Mizani, S.; Yazdani, A. Design and operation of a remote microgrid. In Proceedings of the 2009 35th Annual Conference of IEEE Industrial Electronics, Porto, Portugal, 3–5 November 2009; pp. 4299–4304. [Google Scholar] [CrossRef]
  38. Liu, G.; Starke, M.; Xiao, B.; Zhang, X.; Tomsovic, K. Microgrid optimal scheduling with chance-constrained islanding capability. Electr. Power Syst. Res. 2017, 145, 197–206. [Google Scholar] [CrossRef] [Green Version]
  39. Bhuiyan, F.A.; Yazdani, A.; Primak, S.L. Optimal sizing approach for islanded microgrids. IET Renew. Power Gener. 2015, 9, 166–175. [Google Scholar] [CrossRef]
  40. Alharbi, H.; Bhattacharya, K. Optimal sizing of battery energy storage systems for Microgrids. In Proceedings of the 2014 IEEE Electrical Power and Energy Conference, Calgary, AB, Canada, 12–14 November 2014. [Google Scholar]
  41. HOMER Energy LLC. HOMER ENERGY” The HOMER Pro® Microgrid Software by HOMER Energy. Available online: https://www.homerenergy.com/ (accessed on 26 September 2020).
  42. Balderrama, S.; Lombardi, F.; Riva, F.; Canedo, W.; Colombo, E.; Quoilin, S. A two-stage linear programming optimization framework for isolated hybrid microgrids in a rural context: The case study of the ‘El Espino’ community. Energy 2019, 188, 116073. [Google Scholar] [CrossRef]
  43. de Christo, T.M.; Perron, S.; Fardin, J.F.; Simonetti, D.S.L.; de Alvarez, C.E. Demand-side energy management by cooperative combination of plans: A multi-objective method applicable to isolated communities. Appl. Energy 2019, 240, 453–472. [Google Scholar] [CrossRef]
  44. Mandelli, S.; Merlo, M.; Colombo, E. Novel procedure to formulate load profiles for off-grid rural areas. Energy Sustain. Dev. 2016, 31, 130–142. [Google Scholar] [CrossRef]
  45. Mi, Y.; Chen, X.; Ji, H.; Ji, L.; Fu, Y.; Wang, C.; Wang, J. The coordinated control strategy for isolated DC microgrid based on adaptive storage adjustment without communication. Appl. Energy 2019, 252, 113465. [Google Scholar] [CrossRef]
  46. Nguyen, M.Y.; Yoon, Y.T. A comparison of Microgrid topologies considering both market operations and reliability. Electr. Power Components Syst. 2014, 6, 585–594. [Google Scholar] [CrossRef]
  47. Phrakonkham, S.; Le Chenadec, J.Y.; Diallo, D.; Remy, G.; Marchand, C. Reviews on MicroGrid configuration and dedicated hybrid system optimization software tools: Application to Laos. Eng. J. 2010, 14, 20. [Google Scholar] [CrossRef] [Green Version]
  48. Mariam, L.; Basu, M.; Conlon, M.F. A Review of Existing Microgrid Architectures. J. Eng. 2013, 2013, 1–8. [Google Scholar] [CrossRef] [Green Version]
  49. Justo, J.J.; Mwasilu, F.; Lee, J.; Jung, J. AC-microgrids versus DC-microgrids with distributed energy sources: A review. Renew. Sustain. Energy Rev. 2013, 24, 387–405. [Google Scholar] [CrossRef]
  50. Castillo-Calzadilla, T.; Macarulla, A.M.; Kamara-Esteban, O.; Borges, C.E. A case study comparison between photovoltaic and fossil generation based on direct current hybrid microgrids to power a service building. J. Clean. Prod. 2020, 244, 118870. [Google Scholar] [CrossRef]
  51. International Electrotechnical Commission. Photovoltaic System Performance Monitoring—Guidelines for Measurement, Data Exchange and Analysis—IEC 61724; International Electrotechnical Commission: Geneva, Switzerland, 1998; Available online: https://webstore.iec.ch/preview/info_iec61724%7Bed1.0%7Den.pdf. (accessed on 26 September 2020).
  52. Operador Nacional do Sistema. Operation Results: Operation History [Resultados da Operação: Histórico da Operação]; Hourly Load Curve; 2018. Available online: http://www.ons.org.br/paginas/resultados-da-operacao/historico-da-operacao (accessed on 26 September 2020).
  53. Empresa de Pesquisa Energética. Brazilian Energy Balance 2018: Year 2017 [Balanço Energético Nacional 2018: Ano base 2017]; Empresa de Pesquisa Energética: Rio de Janeiro, Brazil, 2018. Available online: http://epe.gov.br/sites-pt/publicacoes-dados-abertos/publicacoes/PublicacoesArquivos/publicacao-303/topico-419/BEN2018.pdf. (accessed on 26 September 2020).
  54. Kundur, P. Power System Stability and Control; McGraw-Hill: New York, NY, USA, 1994. [Google Scholar]
  55. Gonzalez, S.; Stein, J.; Fresquez, A.; Ropp, M.; Schutz, D. Performance of utility interconnected photovoltaic inverters operating beyond typical modes of operation. In Proceedings of the 2013 IEEE 39th Photovoltaic Specialists Conference, Tampa Bay, FL, USA, 16–21 June 2013; pp. 2879–2884. [Google Scholar] [CrossRef]
  56. Saidel, M.A.; Fadigas, E.; Martinez, A.; Mocelin, J.; Haideier, R.; Mendonça, B.; Valer, L.; Flores, T.; Zucchi, M.; Barros, C.; et al. Mini-Networks with Intermittent Sources to Serve Isolated Areas [Minirredes com Fontes Intermitentes para Atendimento de áreas Isoladas]; Escola Politécnica da Universidade de São Paulo: São Paulo, Brazil, 2016. [Google Scholar]
  57. Al Essa, M.J.M. Power management of grid-integrated energy storage batteries with intermittent renewables. J. Energy Storage 2020, 31, 101762. [Google Scholar] [CrossRef]
  58. Benlahbib, B.; Bouarroudj, N.; Mekhilef, S.; Abdeldjajil, D.; Abdelkrim, T.; Bouchafaa, F.; Iakhdari, A. Experimental investigation of power management and control of a PV/wind/fuel cell/battery hybrid energy system microgrid. Int. J. Hydrogen Energy 2020. [Google Scholar] [CrossRef]
  59. Martinez-Bolanos, J.R.; Udaeta, M.E.M.; Gimenes, A.L.V.; da Silva, V.O. Economic feasibility of battery energy storage systems for replacing peak power plants for commercial consumers under energy time of use tariffs. J. Energy Storage 2020, 29, 101373. [Google Scholar] [CrossRef]
  60. SMA. SMA Energy System Home; Solar Inverters. Available online: https://www.sma.de/en/products/solarinverters.html. (accessed on 26 September 2020).
  61. SMA, “SUNNY ISLAND 4.4M / 6.0H / 8.0H,” Proven Technology Now Even More Affordable. Available online: https://www.sma.de/en/products/battery-inverters/sunny-island-44m-60h-80h.html (accessed on 26 September 2020).
  62. Fulguris, “Battery [Bateria],” Products [Produtos]. Available online: http://www.fulguris.com.br/ (accessed on 20 June 2003).
  63. Morningstar, “Produt Catalog,” Products. Available online: https://www.morningstarcorp.com/ (accessed on 26 September 2020).
Figure 1. DC-coupling topology.
Sustainability 13 00044 g001
Figure 2. Topology: (a) AC-coupling; (b) Dispersed AC-coupling.
Sustainability 13 00044 g002
Figure 3. Microgrid topologies for simulation: (a) Dispersed AC-coupling topology; (b) Centralized AC-coupling topology.
Sustainability 13 00044 g003
Figure 4. Annual average load profiles and solar profile: low EF (residential profile).
Sustainability 13 00044 g004
Figure 5. Annual average load profiles and solar profile: medium EF (residential with a small number of commercial loads).
Sustainability 13 00044 g005
Figure 6. Annual average load profiles and solar profile: high EF (residential with a lot of commercial loads).
Sustainability 13 00044 g006
Figure 7. Annual power losses per year in the distribution network of AC-coupling topologies—centralized versus dispersed, with unity PF and 0.9 lagging PF.
Sustainability 13 00044 g007
Figure 8. Balance-of-system (BOS) efficiency—dispersed versus centralized AC-coupling topologies.
Sustainability 13 00044 g008
Figure 9. BOS efficiency for AC, DC, and combined AC-DC-coupling topologies.
Sustainability 13 00044 g009
Figure 10. Battery efficiency for AC, DC, and combined AC-DC-coupling topologies.
Sustainability 13 00044 g010
Table 1. Annual power losses in the distribution network of AC-coupling topologies—centralized versus dispersed, with unity power factor (PF) and 0.9 lagging PF. EF: energy factor; MF: matching factor.
EFPVPenetration (%)MFPower Losses (kWh/y)
PF = 1.0PF = 0.9
DispersedCentralizedDispersed
0.3251.20102811371145
0.3500.60138611461717
0.3750.40215711592812
0.4251.608161045978
0.4500.80106410511482
0.4750.53173510642523
0.5252.0094113561165
0.5501.00103313621573
0.5750.67155613742529
Table 2. Average efficiency of the main components of the microgrid considering maximum power point tracking (MPPT) [60,61,62,63].
ComponentEfficiency
PV inverter (with MPPT)0.96
Battery inverter0.93
Charge controller (with MPPT)0.95
Battery efficiency0.87
Table 3. Difference in BOS efficiency for low and high values of the matching factor—analytical approach.
Matching FactorEsolar (%) Δ B O S   e f f i   ( % )
AC-CoupledDC-Coupled
Low72% Esolar77% Esolar3.8%
High96% Esolar88% Esolar2.0%
Publisher’s Note: MDPI stays neutral with regard to jurisdictional claims in published maps and institutional affiliations.

