Abstract
This work addresses the joint management of residual microalgae and pine wood waste through pyrolysis to obtain a solid product for its use as soil amendment and two other by-products (liquid and gaseous) that can be used for energy purposes. Two management routes have been followed. The first route is through the co-pyrolysis of mixtures of both residual materials in several proportions and the later use of their solid fraction for soil amendment. The second route is the pyrolysis of pine wood waste and its direct combination with dried residual microalgae, also using it as soil amendment. The solid fraction assessment shows that from seven solid products (biochar) three stand out for their positive applicability in agriculture as soil amendment. In addition, they also present the benefit of serving as carbon sink, giving a negative balance of CO2 emissions. However, caution is suggested due to biochar applicability being subject to soil characteristics. To ensure the sustainability of the overall process, the energy available in liquid and gaseous fractions has been assessed for covering the drying needs of the residual microalgae in both cases. These results suggest that the pyrolysis process is a sustainable way to manage specific evaluated residues and their products.
1. Introduction
The use of alternative energy resources and unconventional fuels can help to solve some of the most challenging problems the world is currently facing, like environmental problems or the scarcity of food and fresh water. Biomass as an energy source has always been there throughout the human history, but it is again gaining attention in the developed world to reduce dependence on fossil fuels and to mitigate greenhouse gas emissions (GHG). Therefore, the conventional biomass coming from lignocellulosic material, such as wood residues from wood exploitations and those coming from forest maintenance practices can be valued as raw material for thermochemical processes to obtain heat and energy [1]. In addition, biomass coming from algae have become increasingly attractive for the production of biofuels and the remediation of environmental pollution [2]. In fact, the use of microalgae for the fixation of CO2 coming from the industrial combustion gases is of great interest as a new technology used for reducing GHG in industry [3,4,5]. It has been reported that both algae and microalgae have an important role in carbon sequestration and it is estimated that they are responsible for up to 50% of the total photosynthetic activity on the planet, capturing CO2 during its growth [6].
The energy use of both wood waste and microalgae biomasses does not contribute to the CO2 increment in the atmosphere because they have already fixed any emitted CO2 during the growing process of the microalgae and lignocellulosic biomass [6,7]. This hypothesis requires to be addressed by a life cycle assessment of this treatment as, for example, in the study of the production and application to soil of biochar from vine wood [8].
One of the most common thermochemical processes used for biomass processing is the pyrolysis process. From this process, three products are generated: a gaseous, liquid and solid fraction, named gas, bio-oil, and charcoal (or simply char), respectively. It is possible to maximize the yield of one fraction at the expense of the others, depending on the production conditions and the type of pyrolytic reactor. For example, conventional or slow pyrolysis, which occurs at low temperatures (around 400 °C) and long residence time of solids is used to maximize the fraction of charcoal [9]. On the other hand, higher temperatures and short vapours/gases’ residence time favours the yield of liquid fraction in fast pyrolysis [9]. There are also other promising technologies, such as ablative pyrolysis [10], microwave pyrolysis [11,12], and hydrothermal carbonization [13], (useful for biomass with high water content) but the study of these technologies is out of scope for this study. When charcoal is specifically produced for application to soil, it can be named biochar [14]. There are other innovative uses of biochar, such as an additive to improve anaerobic digestion processes [15,16], as dye adsorber [17], or even some energy applications such as co-firing in power plants [18].
The gaseous fraction is susceptible to thermal energy production or chemical transformation to liquid biofuels by Fischer-Tropsch reactions [19]. Bio-oil is of particular interest, because a liquid state can be stored and transported [20], and it can be also used in the generation of electricity as a substitute for fuel oil [21]. Charcoal can have several applications, can be used to produce energy or being an adsorbent. However, there are other interesting applications if solid fraction from pyrolysis is biochar, such as its use as soil organic amendment or fertilizer acting at the same time as a carbon sink [20,22,23]. Thereby, the total CO2 balance of the global process may even be negative if the biochar is used in the agricultural sector, considering it has a greater benefit in reducing GHGs emissions. However, despite the benefit of biochar on agricultural soils, many recent studies suggest possible negative effects as carrier of heavy metals [24], toxic compounds formed when biochar originates from fast pyrolysis (polynuclear aromatic hydrocarbons (PAHs), dioxins, and volatile organic compounds (VOCs)) [25], as well as suppression of the efficacy of applied pesticides due to retention and ecotoxicology effects on soil microbes [26].
During the last decades, the use of microalgae in the agricultural sector has become popular for its benefits in the soil. Those benefits include the contribution of their mineral matter for the plants’ nutrients availability and also for the crop yield improvement given its antimicrobial properties to deal with the removal of some plant pathogens [27]. Regarding the application of carbonized products, there is evidence from the past that its use in soils is a very old practice in some regions of the planet. The best example known is the case of Terra Preta in Brazil, where the fertility of its lands is attributed to the carbonized content derived from this practice [28]. Furthermore, it has been proven its application increases soil fertility [29] and has positive effects on the biota [30], and it has also been demonstrated that it reduces CO2 and CH4 emissions from the soil [31].
The co-pyrolysis of microalgae and pine wood has not been studied so far by conventional pyrolysis for agricultural purposes. However, a few publications have been found in which the kinetic behaviour of pyrolysis of microalgae with wood has been studied but with the presence of some third element (polymers, tires, or additives) [32,33,34]. The novelty of this work lies in the proposal of environmentally friendly waste management and, at the same time, to obtain a series of products suitable for fertilizer or soil amendment use in agriculture. Furthermore, the work assesses the possibility of drying the microalgae by using the energy contained in liquid and gaseous pyrolysis fractions.
Therefore, this work is focused on two ways of waste biomass management obtaining two types of solid products:
- (1)
- Co-pyrolysis of residual microalgae and pine wood waste for solid fraction (biochar) main production and end-use in agriculture.
- (2)
- Individual pine waste pyrolysis for solid fraction (biochar) main production and combination with the microalgae waste to mix them for end-use in agriculture.
In both alternatives the first objective is to evaluate the agronomic properties of the solid products in the two ways of management for their agricultural application. The second objective is to assess if both liquid and gaseous fractions generate enough heat to be used for the previous thermal drying of the residual microalgae. In that case, the moisture content of the residual microalgae must be reduced to a maximum value of 10%, otherwise the pyrolysis process would be inefficient with the energy recoverable in gas and bio-oil [35,36,37].
Finally, this experimental work is part of a global objective, a net CO2 capture, which is based on using microalgae waste that have previously fixed the CO2 generated in the combustion of fossil fuels. Then these microalgae are used to produce the two types of solid products previously described. The idea come from the CO2 benefits that these waste biomasses can contribute, and the characteristic of the microalgae high nitrogen content (beneficial in agriculture). According to [38], the total nitrogen content for various microalgae spices is between 6.76 wt% and 12.03 wt%. If this nitrogen is available for the plants, it can be beneficial for its agricultural application and at the same time reducing CO2 emissions by supplying the soil with high carbon content materials.
2. Materials and Methods
2.1. Materials
Residual microalgae (MA) and pine wood waste (PW) from wood exploitations were the raw material for this work. The microalgae (Scenedesmus almeriensis) were cultured under laboratory conditions and grown in a closed tubular photobioreactor. The growth of the microalgae and the drying was carried out by Palmerillas Experimental Station, Fundación Cajamar de Almería (Spain). This foundation supplied the dry microalgae (moisture content below 10 wt%) coming from CO2 capture processes. The PW (Pinus sylvestris) is exclusively called “soria pine” or “red pine” and came from the waste obtained from local sawmills and from cleaning and maintenance activities of logging operations in the Community of Castilla y León (Spain). The PW were pre-treated to reduce the particle size to a range of 0.25–2 mm (cutting mill model SM 100 from Retsch Mill), whilst the MA were already supplied with a particle size below 0.125 mm.
The samples for the co-pyrolysis and mixtures of biochar of pine wood waste (CPW) and non-pyrolyzed MA were prepared accordingly, the descriptions are below:
- (a)
- For the co-pyrolysis of MA and PW, the mixtures of the original residues were prepared in different proportions (wt%) as shown in Table 1.
 Table 1. Ratios of parent materials in blends.
 - (b)
- For the biochar of pine wood waste (CPW) and non-pyrolyzed MA blends, the mixtures were prepared in different proportions (wt%), as shown in Table 2:
Table 2. Ratios of residual microalgae and biochar of pine wood waste in blends.
2.2. Pyrolytic Reactor
The pyrolysis experiments were carried out with 30 g samples in a batch reactor shown in Figure 1. The reactor consisted of a quartz tube 400 mm long and 95 mm diameter. It was externally electrically heated by a ring furnace. It had helium as carrier gas set at a fixed measured flow rate (100 mL/min). The helium gas flowed before starting the experiment and during and after the pyrolysis process to ensure the inert pyrolysis conditions. The gas products were pushed out with the helium gas flow, which was injected through the upper part of the reactor, and it was exited through the lower part of the reactor. The experiments were carried out from room temperature to 550 °C at a heating rate of 27 °C/min. A thermocouple inside the furnace was used to monitor the present temperature of the process. When the reactor reached 550 °C, it was held for about 1 min and then the experiment was stopped.
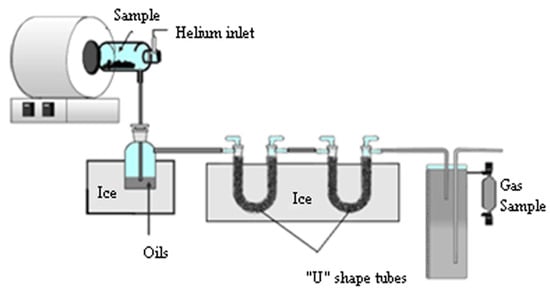
Figure 1.
Pyrolytic reactor diagram.
The sample train setup includes a bubbler and two “U” shaped glass tubes filled with raschig rings immersed in an ice bath (0 °C) to cool the gases and collect the condensable fraction. The gases produced were sampled from the gas fraction container, at the end of the traps for condensable, using a glass ampoule and analyzed by gas chromatography. The mass balances were closed using the weights of the collected condensable fraction and the biochar weight. Therefore, the gas fraction was obtained by difference. Each experiment was carried out three times to check the reproducibility and the mean values were taken. This methodology has been used in previous experiments [39].
2.3. Analysis Techniques
The analytical techniques of the raw materials and products are detailed in the following subsections.
2.3.1. Solid Samples
Solid samples were analyzed for both their chemical composition and agronomical features.
Chemical Analysis
Raw materials and solid fractions were analyzed through proximate and ultimate composition and heating value. Proximate analysis was performed to determine total moisture, volatile matter, and ashes according to the ASTM D3302, UNE 3219 and UNE 32004/ASTM E1755–01 (2015) norms, respectively. Ultimate composition analysis was performed to determine the amount of the main chemical elements present in the sample such as carbon, hydrogen, nitrogen, sulphur, and oxygen. A LECO CHN-600 (all LECO equipment are from LECO Corporation, St. Joseph, Michigan, USA.) analyzer was used to determine the first three elements (C, H and N), following ASTM 5373. Total sulphur content was determined with a LECO SC-132 analyzer according to ASTM 4239. Oxygen content was obtained by difference. The heating value was determined with a LECO AC-300 analyzer, using an adiabatic method in accordance with UNE 32006.
Agronomic Characterization
Characterization of any organic waste before its use as an organic amendment in agriculture is highly recommended. Thus, an agronomic characterization of the biochar was made to evaluate its potential as an agricultural amendment in areas where nutrients are needed and may enhance soil properties or phytoremediation. The pH and electrical conductivity (EC) were measured in a biochar:deionized water suspension (1:5 w/v) [40]. The pH was evaluated using a glass electrode with a pH-meter CRISON micropH 2001, whereas EC was evaluated with a conductivity-meter CRISON conductimeter 522. The Ca, Mg, K, P, Fe, Mn, Cu, Zn, and B contents were extracted through a wet digestion method with an acid mixture [41] and the nutrient contents evaluated in the extracts by ICP-AES (iCAP 7000 series, Thermo Scientific). Organic carbon content was evaluated by gravimetric method; the procedure was conducted in a muffle furnace at 550 °C for 5 h, which representing the complete oxidation of the organic carbon fraction in biochar [42]. Kjeldhal nitrogen method was used to determine organic-N in a BUCHI KjelFLex K-360 equipment through distillation in an alkaline environment and titration with boric acid [43], whereas C/N ratio was simply obtained from the quotient of the organic carbon and nitrogen.
2.3.2. Gas Fractions
Gaseous samples taken in glass ampoules were analyzed in an HP 5890 (HP-Agilent, Santa Clara, CA, USA) chromatograph using three separation columns and two detectors. An HP-AL/S semi-capillary column (50 m long × 0.35 mm inner diameter) was used to analyze hydrocarbons (CxHy) with helium as the carrier gas and with a flame ionisation detector (FID). A 5 Å molecular exclusion packed column (1.83 m long × 3.175 mm outer diameter) with a mesh size of 60/80 was used for H2, O2, N2, CH4 and CO gases. Helium was the carrier gas and a thermal conductivity detector (TCD) included. CO2 gas composition was determined with a Chromosorb 102 packed column (1.83 m long × 3.175 mm outer diameter) with a mesh size of 80/100 and He as the carrier gas; a TCD was used. Once the composition of the gases had been determined, their heating values were calculated, according to UNE-EN ISO 6976.
2.3.3. Liquid Fractions
There were two phases identified in the liquid fraction (heavy and light phases) which visually exhibited different density and viscosity properties. The phases were successfully separated by decantation. The light phase was only considered for mass balance due to its high-water content. To attain overall knowledge of the chemical compound distribution, the heavy liquid phase was subjected to ultimate analysis and heating value calculation following the previously described method in the Chemical Analysis section.
2.4. Energy Balance
As previously mentioned, the objective of the energy balance is to determine whether the energy content of gaseous and liquid fractions cover the drying process of the amount of MA to be used.
In order to assess the energy balance of the process a few premises were considered. With the objective to have the process in a real situation, it has been considered that the MA are thickened by mechanical means (centrifugation) until obtaining a paste. Moisture values between 35% and 55% are considered valid for the moisture levels of the concentrated MA paste [24]. The energy balance calculations are performed for these two moisture values and the drying process is considered completed when the moisture of the MA is reduced to 10 wt%. This moisture content is suitable for its co-pyrolysis and it is also valid for the mixtures with biochar of pine wood waste. The drying process is carried out at 100 °C at atmospheric pressure and considered the inlet temperature of the MA paste at 25 °C.
2.4.1. Available Energy
The available energy estimated for drying the MA is that contained in the gaseous and liquid fractions. The solid fraction was not taken into account for the energy balance because their use would be only with agricultural purposes. The energy contained in each one of the fractions expressed per kg of treated material is estimated by the following equation adapted from [25] once the distribution of fractions has been determined:
where:
- Ƞ = yield of pyrolysis products
- LHV = lower heating value of pyrolysis products
- g, l = gaseous and liquid products
The energy available in the liquid and gaseous fractions can be considered constant according to the value of each sample pyrolyzed.
2.4.2. Required Energy for the Residual Microalgae Drying
The basis for calculating the energy required for drying the microalgae will be 1 kg of final solid product. (a) In the case of MA and PW co-pyrolysis, it will be considered 1 kg of biochar from each sample. (b) In the case of the blends for biochar of pine wood waste and non-pyrolyzed MA, 1 kg of mixture will also be considered. The amount of MA to dry will be the corresponding amount to meet the adequate mixing proportions.
The energy required for drying the MA was estimated according to the following expression adapted from [44]:
where:
- Qdrying = energy required for drying MA (kJ)
- m = mass of wet MA to dry (kg)
- CpMA = specific heat capacity of wet algae (kJ/kg °C)
- ΔT = temperature rise (25 °C to 100 °C)
- mwater = mass of water to evaporate (kg)
- ΔHvap = enthalpy of vaporization of water at 100 °C and atmospheric pressure (kJ/kg)
The specific heat capacity (kJ/kg °C) of the wet MA can be estimated if the water content of the mixture is known. The following expression is followed from [45] for temperatures above the freezing point:
where p = percentage of moisture content in the sample.
An overall yield of 65% of the energy contained is assumed based on [45] and technical literature [46,47] for the energy use of gaseous and liquid coproducts for drying the MA, it includes yields of the equipment involved such as combustor and dryer.
3. Results and Discussion
3.1. Biomass Chemical Characterization
Table 3 shows the proximate and elemental analyses and the calorific value of the original biomasses (MA and PW). The proximate and elemental analyses of the PW is in line with those obtained by [48]. This type of lignocellulosic biomass is characterized by very low ash content, normally below 1% and with relatively high volatile matter values compared to its fixed carbon.
Table 3.
Biomass characterization.
The analytical characterization of the residual MA has shown similarities with the microalgae of other authors [49,50]. When both biomasses are compared, similar carbon content can be found, given most of the carbon is creating organic structures that are also reflected in volatile content. In addition, the ash content is much higher in microalgae than in pine wood, given higher inorganic material. The percentage of nitrogen in the microalgae is caused by the protein content that is present in them. Microalgae are formed mainly (between 60% and 80%) of different proportions of proteins, lipids, and carbohydrates [51,52], and the two major components in wood are lignin, between 18% and 35%, and carbohydrate (65–75%) [53].
3.2. Pyrolysis Tests
3.2.1. Products Yield
The Table 4 shows the solid, liquid, and gaseous fractions obtained in the pyrolysis tests of the original samples and their blends (summarized in Table 1).
Table 4.
Pyrolysis products distribution of blends and crude samples.
It is worth pointing out that due to thermal stress and fatigue, the quartz bottle reactor broke during the MA75 essay, thus the pyrolysis products where lost with no means for extra tests. The solid fraction (biochar) blend yields have values that are between those of the raw materials (MA100 and PW100), decreasing as the amount of pine wood increases in co-pyrolysis. On the contrary, the yields of the gaseous fraction increase when the pine wood increases in the pyrolyzed blends. The behaviour of these two fractions is easily deducible by observing the yields of the primary materials separately. However, the values of the liquid yields have been higher than those obtained by the primary materials. This behaviour is probably explained by the interactions that can arise during the thermal reactions of the co-pyrolysis process as other authors found [32]. The gaseous and liquid yields will be relevant to calculating the energy to be obtained from them in the energy balance for the microalgae drying process.
3.2.2. Solid Fraction (Biochar) Characterization
Results of the characterization of the biochar of co-pyrolysis are presented in Table 5. If the volatile matter of non-pyrolyzed biomasses (see Table 3) is compared with the biochar volatile matter there is a great decrease in this parameter what result as an inherent consequence of the pyrolysis process itself [54]. In fact, the biochar derived from these biomasses has concentrated all the components that are not thermally degraded in the solid fraction, in this way the percentages of ash and fixed carbon also increase compared to the original samples. The increment of ash content is higher in the biochar of MA (CMA100) than in the biochar of PW (CPW100) because the non-pyrolyzed biomass of microalgae have a higher ash percentage (17.04%) than the PW (0.46%). Thereby the ash content increases from the CPW100 biochar (2.68%) to the CMA100 biochar (53.43%), while in the blends the ash content correlate with the corresponding content in MA and PW. In addition, the volatile matter trend is directly proportional to the content of microalgae in the blend. Finally, it is observed that the fixed carbon content increases from 37.17% for CMA100 to 93.22% for CPW100, this trend is closely related to the ash content of the mixtures discussed above.
Table 5.
Biochar characterization results.
In the immediate analysis of the biochar blend samples showed in Table 5, there is a clear trend that C, N, H, S, and O contents have kept concentrated between the values of CMA100 and CPW100. One of the most important parameters for the use of biochar as organic fertilizer is the nitrogen content. As can be seen, this percentage increases as the MA content increases in the blends—biochar of co-pyrolysis of MA at 50 wt% and PW (CMA50), and biochar of co-pyrolysis of MA at 25 wt% and PW (CMA25). This behaviour is explained by the higher concentration of the nitrogen content in the microalgae waste biomass (see Table 3) and it is reflected in the high concentration of nitrogen in the CMA100 sample.
3.2.3. Gas Fraction Characterization
The main gases found were mainly light hydrocarbons, CO, and CO2, the Table 6 shows the main gas of pyrolysis composition. During the biomass decomposition in the pyrolysis process, the heavier hydrocarbons from volatiles are cracked into shorter chain hydrocarbons, such as methane and ethane, which provides higher LHV values than other components of the gas fraction; and CO, hydrogen, or CO2 are also obtained during the biomass decomposition and cracking process [39].
Table 6.
Gas fraction composition, lower heating value, and density.
From the comparison of the gas composition of the blends and MA100 and PW100, it was found that the methane values were very similar between them, producing the microalgae sample (MA100) the highest concentration. In the case of MA, the gas sample account for high content of light hydrocarbons, which was almost 50% of the identified species. According to [52], the evolution of gas formation is described next, once the decarboxylation processes and CO2 emission finished, the CH4, C2H4, and C2H6 formation appeared after the second endothermic peak detected through thermal characterisation of six algae species.
In addition, as the proportion of microalgae increased in the blends, the hydrocarbon content also rose, except for methane which was almost constant. This might be caused of the secondary reactions of the gases during pyrolysis. Therefore, there were not a clear trend on the gas composition of the blends with respect to the percentage of microalgae or pine waste.
The main components detected in the gas fraction were CO and CO2, which represented more than 50% of the compounds. From the samples of MA and PW alone, the higher CO2 contribution came from the microalgae. This behaviour was also found by other authors [52] in which the high production of CO2 was demonstrated during pyrolysis of microalgae under slow pyrolysis conditions. On the other hand, it can be seen that the higher CO content came from the contribution of the pine waste. It has been shown by other authors that its production during the pyrolysis of lignocellulosic materials can be even higher than that of CO2, depending on the pyrolysis conditions and the secondary reactions of the species produced in the early stages [55].
The LHV increases with the microalgae content in the samples as the MA100 sample presented the highest LHV despite its high CO2 content. This was a consequence of its high content of light hydrocarbons, coming from the microalgae lipid content [56]. The LHV of the blend gaseous fractions are marked by the CO and CO2 content. Finally, the pine wood waste gas samples obtained have a low content of hydrocarbons, what affect directly on the LHV being the lowest despite the higher hydrogen content.
3.2.4. Liquid Fraction Characterization
The liquid fraction collected in traps with an ice bath was separated in two phases based on their different densities (heavy phase and light phase). The percentages of the different phases are presented in Figure 2. It should be noted that, for this work, the light phase was only considered for the calculation of the mass balance.
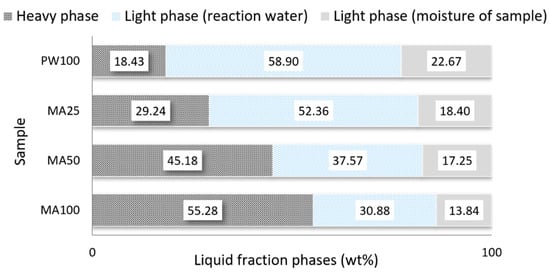
Figure 2.
Heavy and light phase amounts in the liquid fraction from pyrolytic reactor.
In the pyrolysis test the PW has produced a significant amount of light phase in the liquid fraction which is a characteristic of the pyrolysis process of lignocellulosic materials [37]. This light phase contains considerable amounts of sugar derived from cellulose and anhydrous sugars [38]. However, due to the large percentage of water it has no energy value. The sugars in this light phase could be used as fermentable sugars for the manufacture of liquid or gaseous fuels by microbial fermentation or chemical conversion [39]. In the case of MA, the heavy phase was the main one, exceeding 55% of the total. The percentage of the heavy phase decreased when the proportion of PW in the mixtures increased. Table 7 shows the chemical characterization through the elemental analysis and calorific value of the heavy phase.
Table 7.
Ultimate analysis and lower heating value (LHV) of heavy phase.
The chemical characterization of microalgae pyrolysis liquids are characterized by higher hydrogen, and generally higher carbon content than those from wood under the same pyrolysis conditions [57]. Likewise, the low oxygen content in microalgae pyrolysis liquids [2] is indicative of greater oxidative stability compared to those obtained from PW [58]. Microalgae has also high nitrogen content that can be also observed in the liquid samples. Then, the liquid fractions obtained from the mixtures with a high proportion of microalgae presented a higher nitrogen content than those of lignocellulosic materials.
The LHV values of the heavy liquid phase from the two main materials and their blends ranged from 22.1 MJ/kg to 29.4 MJ/kg. The low oxygen content and higher LHV of the liquid fraction of the microalgae compared to that obtained from PW is in line with the results reported by other authors [2].
3.3. Characterization of Biochar for Its Agricultural Use
The basic chemical properties of the solid products (biochar) are showed in Table 8. Their main characteristics were: (1) that both acid and alkaline in nature are presented in the samples; and (2) the EC and C/N ratio have varied over a wide range (from 0.22 to 53.3 dS/m and 6.88 to 202, respectively).
Table 8.
Result of the analysis of the solid products obtained from their evaluation as fertilizers.
The ability of biochar as soil organic amendment to improve soil fertility conditions depends on its physical and chemical properties, which vary according to pyrolysis characteristics [59]. One type of biochar is not always a universal solution for all types of soils because each soil amendment requirements depend on specific soil fertility conditions. Thereby, the biochar application should be assessed previous to any application. If not, biochar amendment may not necessarily play a positive role for all types of soils [60].
From the production conditions (550 °C), it is very likely to expect a biochar with high surface area [61] and highly aromatic composition, which implies a high recalcitrance [62] and good adsorption properties [63]. Considering the C/N relations from Table 8, the best solid products for their use as organic amendments were CMA50, MA50 + CPW, and MA75 + CPW. It can be suggested that the increase of soil adsorption sites, as a consequence of the use of CMA50, MA50 + CPW, and MA75 + CPW, could imply an effective way of soil capacity improvement as a reservoir of mineral nutrients, which plays a key role in enhancing crop production and productivity. Additionally, the presence of a labile carbon fraction, which can be consumed by microorganisms, in the solid products may subsequently enhance the biological component of soil aggregation [64], and thus ameliorate the physical fertility of the agricultural soils amended. On the other hand, this situation would highly improve the biochar porous structure. The expected high surface area of the solid products makes them a potential organic amendment to immobilize metals in agricultural contaminated soils, which eventually can leads to decreased metal uptake into crop tissues [65].
Crop stress is one of the major problems in agricultural environments. The degree of soil acidity or alkalinity, expressed as soil pH, is one of the main abiotic stresses types which greatly impacts chemical and biological properties. Although crop plants vary in their tolerance to soil acidity, it seems clear that the use of this solid product can significantly improve the chemical environment of those amended soils for a wide range of the more common crop plants and forage species. The CMA50 biochar would be more suitable for being used on acidic soils. Its use could contribute to increase soil pH and the corresponding reduction in exchangeable Al. CMA50 can neutralize or partially neutralize soil acidity, precipitating Al3+ to less toxic species, or complexing it by functional groups of our solid product by specific adsorption [66]. Although it has been suggested that biochar could be used to liming acid soils [67], especially those with a fine granulometry, the solid product CMA50 could be considered to reduce rates of lime rather than to replace lime application. In addition, this solid product, like most biochar contain high levels of K; thus, its use in acidic soils with a very low content in Mg, alone or combined with an inappropriate liming source, could depress and reduce Mg uptake by plants, due to the cation antagonism among them [68]. On the other hand, MA50 + CPW, and MA75 + CPW present low pH and they would be more appropriate in soils with alkalinity conditions, which are largely caused by calcium carbonate-rich parent materials, where they could contribute to decrease soil pH and subsequently, alleviate micronutrient and phosphorus deficiencies in crops. To conclude, the choice of one or another type of solid material will be based on the nature of the soil and affecting the promotion of the abundance of fungi or bacteria. This is given the pH in soils has been identified as a key parameter influencing microbial community composition and activity [69].
Based on the typical major nutrient element contents of dairy, horse, poultry, and sheep manure materials [70], the mineral composition (N, P2O5, and K2O) of the solid products selected as potential organic amendments (CMA50, MA50 + CPW, and MA75 + CPW) have showed good agronomic values, particularly in its N and P2O5 content. It is particularly significant the P2O5 contributions of the three solid products. Low phosphorus availability in agricultural soils often leads to productive crop problems and phosphorus is not only essential for profitable agriculture, but it is widely recognized as a non-renewable resource. Nitrogen (N) mineralization, is always coupled with immobilization, which operates in the reverse direction, with the soil microbial biomass assimilating inorganic N forms and transforming them into organic N constituents in their tissues during the metabolization of suitable C substrates [71]. Although C/N ratio in a soil amendment cannot explain all differences in N mineralization, it is a key parameter in its prediction. Based on the above, the solid products CMA50, MA50 + CPW, and MA75 + CPW have showed a good humification and N mineralization potential, whereas CMA25, CPW100, and MA25 + CPW would be much more complicated to be decomposed by the soil microbiome, which could imply a depressive effect on soil fertility. This is particularly important in farming systems where mineral fertilizers are excluded. The amount of N potentially mineralized from organic amendments is an important variable when recommending the appropriate rate to apply to meet N needs for optimal crop production [72].
With regard to the micronutrients content (Fe, Mn, Cu, Zn, and B) of the most interesting solid products (CMA50, MA50 + CPW, and MA75 + CPW), it is worth mentioning those found in MA50 + CPW, and MA75 + CPW. They are more suitable under alkalinity conditions in agricultural soils (where both micronutrient cations and B are less soluble and available). This is especially important in Fe, Cu, and Zn availability, because it is governed predominantly by its pH and adsorption on the organic fraction in soils under basic conditions [73]. This is also true for B, whereas on the other hand, oxidation-reduction processes and complexation with natural organic chelates govern the Mn bioavailability. Thus, the addition of MA50-CPW and MA75 + CPW as organic amendments to improve soil chemical properties and providing soil micronutrients directly in calcareous agricultural soils have a great potential.
3.4. Energy Balance
The calculations of the energy balance were carried out considering as a basis 1 kg of final solid product obtained both for the individual pyrolysis of the main materials and for the blends of MA and PW (see Section 2.3).
3.4.1. Case 1: Energy Balance for the Co-Pyrolysis of Microalgae Waste and Pine Waste for Biochar (Solid Fraction) Main Production and End-Use in Agriculture
The purpose of this section is to study if the energy available in the gaseous and liquid co-products is enough to dry the input MA for the pyrolysis process. In Table 9, the base data are shown for the calculation of the energy balance of the co-pyrolysis of MA and PW.
Table 9.
Premises for calculating the energy balance for the co-pyrolysis char of pine wood waste and microalgae to produce 1 kg of solid final product.
The energy balance of the co-pyrolysis of MA and PW is visually presented in Figure 3. It can be concluded that the combination of the energy from the liquid and the gaseous co-products is higher that the energy needed for the microalgae drying process.
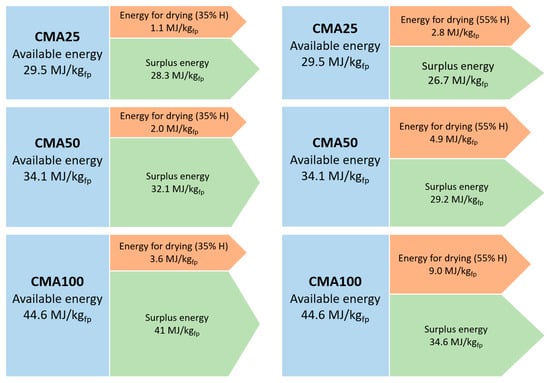
Figure 3.
Graphic representation of the energy balance for microalgae drying (co-pyrolysis of residual microalgae and pine wood waste cases).
Furthermore, the surplus of energy available after drying the microalgae is directly proportional to the amount of microalgae in the mixture under co-pyrolysis, which is indicative of the relevant energy contribution of the microalgae. The MA100 sample is the one with the highest energy demand for drying the microalgae but it is also the one with the highest excess energy. In the case of CMA50, the energy for drying represents 5.88% and 15.41% of the energy available for the moisture content of 35% and 55%, respectively; and finally, in the case of CMA25 co-pyrolysis, the percentages of energy required with respect to that available energy is 5.88% and 15.41% for the moisture content of 35% and 55%, respectively. This detriment trend is caused by the lower energy demand that the process needs given a lower microalgae content in the samples to be pyrolyzed.
3.4.2. Case 2: Energy Balance for the Biochar of Pine Waste Mixed with Dried Residual Microalgae to End-Use in Agriculture
The calculations of the energy balance were carried out considering as a basis 1 kg of final solid product (MA + CPW). Thereby despite of the yield of pine wood waste biochar is constant, the amount of PW to be pyrolyzed varies depending on its percentage in the mixture. The base data for the calculation of the energy balance of Case 2 are shown in Table 10.
Table 10.
Premises for calculating the energy balance of residual microalgae (MA) + pine wood waste (CPW) to produce 1 kg of solid final product.
Results of the energy balance of the drying process of MA, from the pyrolysis of PW are presents in Figure 4. The available energy for drying the microalgae decreases as the microalgae content in the final product increases. This is due to the higher energy demand needed as the microalgae increases in the final product and considering that the energy for drying it only comes from the gaseous and liquid pyrolysis products of PW.
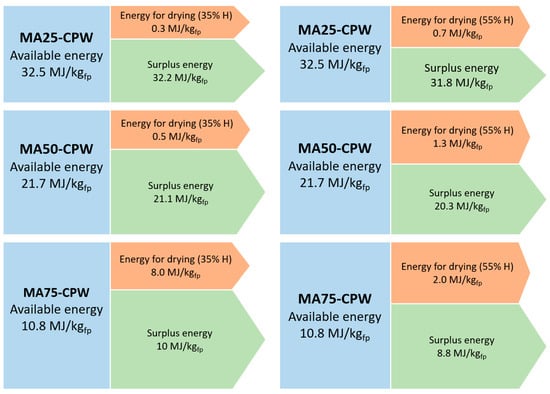
Figure 4.
Graphical representation of the energy balance for microalgae drying (MA+CPW cases).
The energy required for drying the MA is less than 1% of the energy available in the case of the sample MA25 + CPW, for a microalgae 35% moisture content; and it is 2.04% for 55% microalgae moisture content. For the sample MA50 + CPW the energy required is 2.30% and 5.99% for a microalgae 35% and 55% moisture content, respectively. Finally, the least favourable case energetically is the sample MA75 + CPW in which the energy necessary to dry the microalgae represents 7.45% for a microalgae 35% moisture content and 18.4% for 55% microalgae moisture content, of 10.8 MJ available.
It should be noted that, although the energy levels for drying the MA appear to be low, this is due to the humidity level of the MA paste when it leaves the centrifuge (between 35% and 55% humidity by mass). Assuming a humidity level of the initial environment at 85% of the MA (without the centrifugation of the MA), the energy demand of the MA drying process is in order of 13 MJ/kg of to achieve 10% moisture content [74,75] what still would covered the entire drying process of samples MA25 + CPW and MA50 + CPW and 79.63% of the energy demand needed for MA75 + CPW.
4. Conclusions
This work reflects a joint and adequate management of these two wastes, in total harmony with the concept known as circular economy. These three products, CMA50, MA50 + CPW, and MA75 + CPW have showed good agronomic values, particularly in its N and P2O5 content. In addition, on top to the benefit of using these materials in agriculture, the storage of carbon in the soil is also promoted.
Regarding energy balance, it can be concluded that the energy contained in the liquid and gaseous fractions obtained cover the energy needs for drying the microalgae used in each case. It should be noted that the energy available after drying the microalgae is notably higher in the case of co-pyrolysis than in the case of mixing the microalgae with the pine wood biochar. A future work will consider the use of the “excess” energy after drying, integrating it for energy recovery at some other point in the microalgae production process or for drying the wood if necessary.
Thereby, this work has covered the evaluation of specific biomass residues coming from industrial processes and that need a way to be manage. The evaluation has included to integrate the liquid and gaseous fraction within the production cycle to reduce the energy demand making the process sustainable. In addition, the main coproduct, the solid fraction, has been evaluated according to their agricultural characteristics and their carbon sink potential closing the circularity of the process, finding an appropriate application at the same time as managing the residues.
Author Contributions
Conceptualization, J.G.R., N.G. and J.C.-J.; methodology, J.G.R., N.G. and M.Á.O.; software, J.G.-A.; validation, J.C.-J. and M.E.S.; formal analysis, J.G.R., N.G. and M.Á.O.; investigation, J.G.R., N.G. and M.Á.O.; resources, J.G.-A.; data curation, M.E.S.; writing—original draft preparation, J.G.R. and N.G.; writing—review and editing, M.E.S. and J.C.-J.; visualization, J.G.-A.; supervision, J.C.-J.; project administration, M.E.S.; funding acquisition, M.E.S. and J.C.-J. All authors have read and agreed to the published version of the manuscript.
Funding
This research received no external funding.
Acknowledgments
The authors wish to thank the University of León for funding the project. We are also grateful to “Palmerillas Experimental Station, Fundación Cajamar” that supplied the microalgae biomass for this work.
Conflicts of Interest
The authors declare no conflict of interest.
References
- Domínguez, A.; Menéndez, J.A.; Fernández, Y.; Pis, J.J.; Nabais, J.M.V.; Carrott, P.J.M.; Carrott, M.M.L.R. Conventional and microwave induced pyrolysis of coffee hulls for the production of a hydrogen rich fuel gas. J. Anal. Appl. Pyrolysis 2007, 79, 128–135. [Google Scholar] [CrossRef]
- Yang, C.; Li, R.; Zhang, B.; Qiu, Q.; Wang, B.; Yang, H.; Ding, Y.; Wang, C. Pyrolysis of microalgae: A critical review. Fuel Process. Technol. 2019, 186, 53–72. [Google Scholar] [CrossRef]
- Chen, C.; Ma, X.; He, Y. Co-pyrolysis characteristics of microalgae Chlorella vulgaris and coal through TGA. Bioresour. Technol. 2012, 117, 264–273. [Google Scholar] [CrossRef] [PubMed]
- Mata, T.M.; Martins, A.A.; Caetano, N.S. Microalgae for biodiesel production and other applications: A review. Renew. Sustain. Energy Rev. 2010, 14, 217–232. [Google Scholar] [CrossRef]
- Phukan, M.M.; Chutia, R.S.; Konwar, B.K.; Kataki, R. Microalgae Chlorella as a potential bio-energy feedstock. Appl. Energy 2011, 88, 3307–3312. [Google Scholar] [CrossRef]
- Ynalvez, R.A.; Dinamarca, J.; Moroney, J.V. Algal Photosynthesis. In eLS; John Wiley & Sons, Ltd.: Chichester, UK, 2018; pp. 1–9. [Google Scholar]
- Amaro, H.M.; Guedes, A.C.; Malcata, F.X. Advances and perspectives in using microalgae to produce biodiesel. Appl. Energy 2011, 88, 3402–3410. [Google Scholar] [CrossRef]
- JRosas, G.; Gómez, N.; Cara, J.; Ubalde, J.; Sort, X.; Sánchez, M.E. Assessment of sustainable biochar production for carbon abatement from vineyard residues. J. Anal. Appl. Pyrolysis 2015, 113, 239–247. [Google Scholar] [CrossRef]
- Bridgwater, A. Biomass Pyrolysis. 2007. Available online: https://www.ieabioenergy.com/wp-content/uploads/2013/10/Task-34-Booklet.pdf (accessed on 17 December 2020).
- Uddin, M.N.; Techato, K.; Taweekun, J.; Mofijur, M.; Rasul, M.G.; Mahlia, T.M.I.; Ashrafur, S.M. An Overview of Recent Developments in Biomass Pyrolysis Technologies. Energies 2018, 11, 3115. [Google Scholar] [CrossRef]
- Lam, S.S.; Chase, H.A. A Review on Waste to Energy Processes Using Microwave Pyrolysis. Energies 2012, 5, 4209–4232. [Google Scholar] [CrossRef]
- Beneroso, D.; Bermúdez, J.M.; Arenillas, A.; Menéndez, J.A. Microwave pyrolysis of microalgae for high syngas production. Bioresour. Technol. 2013, 144, 240–246. [Google Scholar] [CrossRef]
- González-Arias, J.; Sánchez, M.E.; Martínez, E.J.; Covalski, C.; Alonso-Simón, A.; González, R.; Cara-Jiménez, J. Hydrothermal carbonization of olive tree pruning as a sustainableway for improving biomass energy potential: Effect of reaction parameters on fuel properties. Processes 2020, 8, 1201. [Google Scholar] [CrossRef]
- Hyland, C.; Sarmah, A.K. Advances and Innovations in Biochar Production and Utilization for Improving Environmental Quality. In Bioenergy Research: Advances and Applications; Elsevier: Amsterdam, The Netherlands, 2014; pp. 435–446. [Google Scholar]
- Gómez, X.; Meredith, W.; Fernández, C.; Sánchez-García, M.; Díez-Antolínez, R.; Garzón-Santos, J.; Snape, C.E. Evaluating the effect of biochar addition on the anaerobic digestion of swine manure: Application of Py-GC/MS. Environ. Sci. Pollut. Res. 2018, 25, 25600–25611. [Google Scholar] [CrossRef] [PubMed]
- Sevillano, C.B.A.; Chiappero, M.; Gomez, X.; Fiore, S.; Martínez, E.J. Improving the Anaerobic Digestion of Wine-Industry Liquid Wastes: Treatment by Electro-Oxidation and Use of Biochar as an Additive. Energies 2020, 13, 5971. [Google Scholar] [CrossRef]
- Saeed, A.A.; Harun, N.Y.; Sufian, S.; Siyal, A.A.; Zulfiqar, M.; Bilad, M.R.; Vagananthan, A.; Al-Fakih, A.; Ghaleb, A.A.; Almahbashi, N. Eucheuma cottonii Seaweed-Based Biochar for Adsorption of Methylene Blue Dye. Sustainability 2020, 12, 10318. [Google Scholar] [CrossRef]
- Jeong, Y.; Lee, Y.-E.; Kim, I.-T. Characterization of Sewage Sludge and Food Waste-Based Biochar for Co-Firing in a Coal-Fired Power Plant: A Case Study in Korea. Sustainability 2020, 12, 9411. [Google Scholar] [CrossRef]
- Lange, J.-P. Lignocellulose conversion: An introduction to chemistry, process and economics. Biofuels Bioprod. Biorefining 2007, 1, 39–48. [Google Scholar] [CrossRef]
- Pütün, A.E.; Özean, A.; Pütün, E. Pyrolysis of hazelnut shells in a fixed-bed tubular reactor: Yields and structural analysis of bio-oil. J. Anal. Appl. Pyrolysis 1999, 52, 33–49. [Google Scholar] [CrossRef]
- Becidan, M.; Skreiberg, Ø.; Hustad, J.E. Products distribution and gas release in pyrolysis of thermally thick biomass residues samples. J. Anal. Appl. Pyrolysis 2007, 78, 207–213. [Google Scholar] [CrossRef]
- McHenry, M.P. Agricultural bio-char production, renewable energy generation and farm carbon sequestration in Western Australia: Certainty, uncertainty and risk. Agric. Ecosyst. Environ. 2009, 129, 1–7. [Google Scholar] [CrossRef]
- Smith, J.L.; Collins, H.P.; Bailey, V.L. The effect of young biochar on soil respiration. Soil Biol. Biochem. 2010, 42, 2345–2347. [Google Scholar] [CrossRef]
- Hospido, A.; Moreira, M.T.; Martín, M.; Rigola, M.; Feijoo, G. Environmental evaluation of different treatment processes for sludge from urban wastewater treatments: Anaerobic digestion versus thermal processes. Int. J. Life Cycle Assess. 2005, 10, 336–345. [Google Scholar] [CrossRef]
- Tisserant, A.; Cherubini, F. Potentials, limitations, co-benefits, and trade-offs of biochar applications to soils for climate change mitigation. Land 2019, 8, 179. [Google Scholar] [CrossRef]
- Hussain, M.; Farooq, M.; Nawaz, A.; Al-Sadi, A.M.; Solaiman, Z.M.; Alghamdi, S.S.; Ammara, U.; Ok, Y.S.; Siddique, K.H.M. Biochar for crop production: Potential benefits and risks. J. Soils Sediments 2017, 17, 685–716. [Google Scholar] [CrossRef]
- Renuka, N.; Guldhe, A.; Prasanna, R.; Singh, P.; Bux, F. Microalgae as multi-functional options in modern agriculture: Current trends, prospects and challenges. Biotechnol. Adv. 2018, 36, 1255–1273. [Google Scholar] [CrossRef] [PubMed]
- Sohi, S.P.; Krull, E.; Lopez-Capel, E.; Bol, R. A review of biochar and its use and function in soil. In Advances in Agronomy; Academic Press: Cambridge, MA, USA, 2010; Volume 105, pp. 47–82. [Google Scholar]
- Cao, H.; Ning, L.; Xun, M.; Feng, F.; Li, P.; Yue, S.; Song, J.; Zhang, W.; Yang, H. Biochar can increase nitrogen use efficiency of Malus hupehensis by modulating nitrate reduction of soil and root. Appl. Soil Ecol. 2019, 135, 25–32. [Google Scholar] [CrossRef]
- Lehmann, J.; Rillig, M.C.; Thies, J.; Masiello, C.A.; Hockaday, W.C.; Crowley, D. Biochar effects on soil biota—A review. Soil Biol. Biochem. 2011, 43, 1812–1836. [Google Scholar] [CrossRef]
- Walkiewicz, A.; Kalinichenko, K.; Kubaczyński, A.; Brzezińska, M.; Bieganowski, A. Usage of biochar for mitigation of CO2 emission and enhancement of CH4 consumption in forest and orchard Haplic Luvisol (Siltic) soils. Appl. Soil Ecol. 2020, 156, 103711. [Google Scholar] [CrossRef]
- Azizi, K.; Moraveji, M.K.; Najafabadi, H.A. Characteristics and kinetics study of simultaneous pyrolysis of microalgae Chlorella vulgaris, wood and polypropylene through TGA. Bioresour. Technol. 2017, 243, 481–491. [Google Scholar] [CrossRef] [PubMed]
- Azizi, K.; Haghighi, A.M.; Moraveji, M.K.; Olazar, M.; Lopez, G. Co-pyrolysis of binary and ternary mixtures of microalgae, wood and waste tires through TGA. Renew. Energy 2019, 142, 264–271. [Google Scholar] [CrossRef]
- Chen, L.; Yu, Z.; Xu, H.; Wan, K.; Liao, Y.; Ma, X. Microwave-assisted co-pyrolysis of Chlorella vulgaris and wood sawdust using different additives. Bioresour. Technol. 2019, 273, 34–39. [Google Scholar] [CrossRef] [PubMed]
- Demirbas, A. Effect of initial moisture content on the yields of oily products from pyrolysis of biomass. J. Anal. Appl. Pyrolysis 2004, 71, 803–815. [Google Scholar] [CrossRef]
- Ball, R.; McIntosh, A.C.; Brindley, J. The role of char-forming processes in the thermal decomposition of cellulose. Phys. Chem. Chem. Phys. 1999, 1, 5035–5043. [Google Scholar] [CrossRef]
- Di Blasi, C. Modeling intra- and extra-particle processes of wood fast pyrolysis. AIChE J. 2002, 48, 2386–2397. [Google Scholar] [CrossRef]
- López, C.V.G.; García, M.d.C.; Fernández, F.G.A.; Bustos, C.S.; Chisti, Y.; Sevilla, J.M.F. Protein measurements of microalgal and cyanobacterial biomass. Bioresour. Technol. 2010, 101, 7587–7591. [Google Scholar] [CrossRef] [PubMed]
- Sánchez, M.E.; Lindao, E.; Margaleff, D.; Martínez, O.; Morán, A. Pyrolysis of agricultural residues from rape and sunflowers: Production and characterization of bio-fuels and biochar soil management. J. Anal. Appl. Pyrolysis 2009, 85, 142–144. [Google Scholar] [CrossRef]
- Wolf, N. Determination of Manure pH; Cooperative Extension Publishing Operations: Madison, WI, USA, 2003. [Google Scholar]
- Motsara, M.R.; Roy, R.N. Guide to Laboratory Establishment for Plant Nutrient Analysis; Food and Agriculture Organization of the United Natios: Rome, Italy, 2008. [Google Scholar]
- Netherton, E. Biochar Effects on Soil Quality as Evaluated by Physical, Chemical, and Biological Parameters. 2013. Available online: https://ddd.uab.cat/record/126980 (accessed on 7 September 2020).
- Watson, M.; Wolf, A.; Wolf, N. Total Nitrogen, in Recommended Methods of Manure Analysis; Peters, J., Ed.; Cooperative Extension Publishing Operations: Madison, WI, USA, 2008; pp. 18–24. [Google Scholar]
- Hosseinizand, H.; Lim, C.J.; Webb, E.; Sokhansanj, S. Economic analysis of drying microalgae Chlorella in a conveyor belt dryer with recycled heat from a power plant. Appl. Therm. Eng. 2017, 124, 525–532. [Google Scholar] [CrossRef]
- Earle, R.L. Unit Operations in Food Processing—R. L. Earle. Available online: https://nzifst.org.nz/resources/unitoperations/about.htm#copyright (accessed on 27 July 2020).
- Mukherjee, R.M. Effectively design shell-and-tube heat exchangers. Chem. Eng. Prog. 1998, 94, 21–37. [Google Scholar]
- Hovalpartners. Available online: https://www.hovalpartners.com/zoolu-website/media/document/5320/{Industrial}_boilers_Planner_Guide_(steam_systems_1).pdf (accessed on 27 July 2020).
- Arregi, A.; Amutio, M.; Lopez, G.; Artetxe, M.; Alvarez, J.; Bilbao, J.; Olazar, M. Hydrogen-rich gas production by continuous pyrolysis and in-line catalytic reforming of pine wood waste and HDPE mixtures. Energy Convers. Manag. 2017, 136, 192–201. [Google Scholar] [CrossRef]
- Li, F.; Srivatsa, S.C.; Bhattacharya, S. A review on catalytic pyrolysis of microalgae to high-quality bio-oil with low oxygeneous and nitrogenous compounds. Renew. Sustain. Energy Rev. 2019, 108, 481–497. [Google Scholar] [CrossRef]
- Macías-Sánchez, M.D.; Fernandez-Sevilla, J.M.; Fernández, F.G.A.; García, M.C.C.; Grima, E.M. Supercritical fluid extraction of carotenoids from Scenedesmus almeriensis. Food Chem. 2010, 123, 928–935. [Google Scholar] [CrossRef]
- Maddi, B.; Viamajala, S.; Varanasi, S. Comparative study of pyrolysis of algal biomass from natural lake blooms with lignocellulosic biomass. Bioresour. Technol. 2011, 102, 11018–11026. [Google Scholar] [CrossRef]
- Grierson, S.; Strezov, V.; Ellem, G.; Mcgregor, R.; Herbertson, J. Thermal characterisation of microalgae under slow pyrolysis conditions. J. Anal. Appl. Pyrolysis 2009, 85, 118–123. [Google Scholar] [CrossRef]
- Pettersen, R.C. The Chemical Compostition of Wood; American Chemical Society: Washington, DC, USA, 1984. [Google Scholar]
- Basu, P.; Basu, P. Chapter 5—Pyrolysis. In Biomass Gasification, Pyrolysis and Torrefaction; Academic Press: Cambridge, MA, USA, 2013; pp. 147–176. [Google Scholar]
- Dieguez-Alonso, A.; Anca-Couce, A.; Zobel, N.; Behrendt, F. Understanding the primary and secondary slow pyrolysis mechanisms of holocellulose, lignin and wood with laser-induced fluorescence. Fuel 2015, 153, 102–109. [Google Scholar] [CrossRef]
- Marcilla, A.; Gómez-Siurana, A.; Gomis, C.; Chápuli, E.; Catalá, M.C.; Valdés, F.J. Characterization of microalgal species through TGA/FTIR analysis: Application to nannochloropsis sp. Thermochim. Acta 2009, 484, 41–47. [Google Scholar] [CrossRef]
- Miao, X.; Wu, Q.; Yang, C. Fast pyrolysis of microalgae to produce renewable fuels. J. Anal. Appl. Pyrolysis 2004, 71, 855–863. [Google Scholar] [CrossRef]
- Gómez, N.; Banks, S.W.; Nowakowski, D.J.; Rosas, J.G.; Cara, J.; Sánchez, M.E.; Bridgwater, A.V. Effect of temperature on product performance of a high ash biomass during fast pyrolysis and its bio-oil storage evaluation. Fuel Process. Technol. 2018, 172, 97–105. [Google Scholar] [CrossRef]
- Atkinson, C.J.; Fitzgerald, J.D.; Hipps, N.A. Potential mechanisms for achieving agricultural benefits from biochar application to temperate soils: A review. Plant Soil 2010, 337, 1–18. [Google Scholar] [CrossRef]
- Zhu, Q.; Peng, X.; Huang, T. Contrasted effects of biochar on maize growth and N use efficiency depending on soil conditions. Int. Agrophysics 2015, 29, 257–266. [Google Scholar] [CrossRef]
- Downie, A.E.; van Zwieten, L.; Smernik, R.J.; Morris, S.; Munroe, P.R. Terra Preta Australis: Reassessing the carbon storage capacity of temperate soils. Agric. Ecosyst. Environ. 2011, 140, 137–147. [Google Scholar] [CrossRef]
- Singh, B.P.; Cowie, A.L. Long-term influence of biochar on native organic carbon mineralisation in a low-carbon clayey soil. Sci. Rep. 2014, 4, 3687. [Google Scholar] [CrossRef]
- Mizuta, K.; Matsumoto, T.; Hatate, Y.; Nishihara, K.; Nakanishi, T. Removal of nitrate-nitrogen from drinking water using bamboo powder charcoal. Bioresour. Technol. 2004, 95, 255–257. [Google Scholar] [CrossRef] [PubMed]
- Mukherjee, A.; Lal, R. Biochar Impacts on Soil Physical Properties and Greenhouse Gas Emissions. Agronomy 2013, 3, 313–339. [Google Scholar] [CrossRef]
- Zhang, F.; Chen, X.; Vitousek, P. Chinese agriculture: An experiment for the world. Nature 2013, 497, 33–35. [Google Scholar] [CrossRef] [PubMed]
- Dai, Z.; Zhang, X.; Tang, C.; Muhammad, N.; Wu, J.; Brookes, P.C.; Xu, J. Potential role of biochars in decreasing soil acidification—A critical review. Sci. Total Environ. 2017, 581–582, 601–611. [Google Scholar] [CrossRef]
- Steiner, C.; Harttung, T. Biochar as a growing media additive and peat substitute. Solid Earth 2014, 5, 995–999. [Google Scholar] [CrossRef]
- Prasad, M.; Chrysargyris, A.; McDaniel, N.; Kavanagh, A.; Gruda, N.S.; Tzortzakis, N. Plant Nutrient Availability and pH of Biochars and Their Fractions, with the Possible Use as a Component in a Growing Media. Agronomy 2019, 10, 10. [Google Scholar] [CrossRef]
- Wakelin, S.A.; Macdonald, L.M.; Rogers, S.L.; Gregg, A.L.; Bolger, T.P.; Baldock, J.A. Habitat selective factors influencing the structural composition and functional capacity of microbial communities in agricultural soils. Soil Biol. Biochem. 2008, 40, 803–813. [Google Scholar] [CrossRef]
- Benton, J. Plant Nutrition and Soil Fertility Manual; CRC Press: Boca Raton, FL, USA, 2012. [Google Scholar]
- Mohanty, M.; Sinha, N.K.; Reddy, K.S.; Chaudhary, R.S.; Rao, A.S.; Dalal, R.C.; Menzies, N.W. How Important is the Quality of Organic Amendments in Relation to Mineral N Availability in Soils? Agric. Res. 2013, 2, 99–110. [Google Scholar] [CrossRef]
- Logan, T.J. Agricultural best management practices and groundwater protection. J. Soil Water Conserv. 1990, 45, 201–206. [Google Scholar]
- Najafi-Ghiri, M.; Ghasemi-Fasaei, R.; Farrokhnejad, E. Factors Affecting Micronutrient Availability in Calcareous Soils of Southern Iran. Arid L. Res. Manag. 2013, 27, 203–215. [Google Scholar] [CrossRef]
- Lardon, L.; Hélias, A.; Sialve, B.; Steyer, J.P.; Bernard, O. Life-cycle assessment of biodiesel production from microalgae. Environ. Sci. Technol. 2009, 43, 6475–6481. [Google Scholar] [CrossRef] [PubMed]
- Hassebrauck, M.; Ermel, G. Two examples of thermal drying of sewage sludge. Water Sci. Technol. 1996, 33, 235–242. [Google Scholar] [CrossRef]


Publisher’s Note: MDPI stays neutral with regard to jurisdictional claims in published maps and institutional affiliations. |
© 2020 by the authors. Licensee MDPI, Basel, Switzerland. This article is an open access article distributed under the terms and conditions of the Creative Commons Attribution (CC BY) license (http://creativecommons.org/licenses/by/4.0/).