Article

What Does Gender Yield Gap Tell Us about Smallholder Farming in Developing Countries?

1
International Center for Tropical Agriculture, Nairobi 00621, Kenya
2
Agricultural Research Institute Uyole, Mbeya 38850, Tanzania
3
International Crops Research Institute for the Semi-Arid Tropics, Nairobi 00623, Kenya
*
Author to whom correspondence should be addressed.
Sustainability 2021, 13(1), 77; https://doi.org/10.3390/su13010077
Submission received: 6 December 2020 / Revised: 17 December 2020 / Accepted: 21 December 2020 / Published: 23 December 2020

Abstract

:
This study examines the extent of the productivity gap between male and female bean producers, its discriminatory nature and implications for the policymakers in agriculture in Tanzania. Generally, women are distinctively “invisible” in agriculture, due to social norms and even from the national agricultural policy perspective. Their discrimination arises from uncounted and unaccounted for farm work, and their productivity is reduced by triple roles, limited access to education, having triple effects on access to technology, training and land rights. In research, issues of concern to them such as nutritious food crops, varietal selection on important attributes, household food security, convenient home storage and small-scale processing are widely ignored through unfavourable policy design. Given the above discriminatory issues surrounding women in agriculture, they are hypothesised to be less productive and often lag behind male counterparts in crop production. To test the above hypothesis, a three-stage stratified sampling method was used to collect cross-sectional data in 2016 across four regions of Tanzania. Then, an Oaxaca-Blinder decomposition method (at means) was used to apportion the sources of the difference between men and women into explained and unexplained variations. Further improvements through the newly developed Re-Centered Influence Functions (RIFs) remarkably improved outcomes as the differences were analysed through unconditional partial effects on quantiles. Using a counterfactual approach and correcting for selection bias, the model provided consistent estimates for easy comparison of the two groups. Besides this, it emerged that interventions such as providing improved bean seed varieties and training farmers on good agricultural practices reduced the gender yield gap and provided a potential avenue for addressing the discrimination observed in productivity among males and females. Controlling for selection bias also improved the model, but the real discrimination was observed at the 50th percentile, where the majority of the respondents lay within. However, if a female’s age, family size, additional years of schooling and discretion to spend income from beans were taken away, they would be worse off. Our study finds that females comprised 25 percent of the sample, had 6 percent lower productivity, provided 64.70 percent on-farm labour and had 0.32 hectares less land compared to males, ceteris paribus. Access to improved varieties contributed to a 35.4 percent improved productivity compared to growing indigenous/local varieties. The implication is that the gender yield gap can be reduced significantly if efforts are focused on preventing or correcting factors causing discrimination against women.

1. Introduction

Decomposing wage and income dissimilarity among men and women is a phenomenon more nuanced in labour economics [1,2,3,4,5], cumulatively pointing towards women’s contributions in labour and income in agriculture. The gender pay gap is high in agricultural and non-agricultural activities [6]. Even with equal-pay policies geared towards helping women come at par with men at work, gender gaps persist in agriculture where women get paid less for farm labour compared to men [6,7,8]. World Economic Forum posits that gender gaps are manifestations of poor economic participation and opportunities, low educational attainment, poor health and survival and minimal political empowerment among different sexes [9]. In Sub-Saharan Africa, the efforts to close gender gaps have focused more on dealing with social norms and cultural settings that limit engagement of women in economic activities to earn wages, especially in agriculture [3,10,11,12].
In developing these discourses, we need more information from the productive side of agriculture, especially the yield differences among men and women farmers where such gaps may be severe. Sex-disaggregated studies have often focused on productivity and technology adoption pathways in Sub-Saharan Africa as the main missing link in efforts to address low yields among women to reduce this gap [10,13]. With more focus on access to land and inputs (production factors), the gaps observed in productivity among men and women while accessing these production factors is still large. For example, where women were married, more men than women owned land and dictated its use [10]; women are often not positioned to make decisions over this important asset including decisions on its sale and investments to increase its productivity. This may be attributed to the traditional customary land ownership system that dictates land inheritance and its sale. Evidence from Tanzania showed that despite the fact that men and women jointly own 68 percent of land, only 1 percent of such land could be sold by female owners, and men could sell without their wife’s approval [14]. Access to land, inputs and poor education among women, among other indicators, have been reported as some of the pain points in addressing these pay gaps [15]. Such differences in resource endowments and decision on the use of assets may be potential indicators of why women still receive such low wages, underpinned, for example, by customary laws guarding inheritance of land assets [16].
Even though access to production assets potentially provide an avenue for productivity gaps, works of Mugisha et al. [3] and Van Tran et al. [13] provide other socioeconomic indicators such as one being a household head, ownership of other assets in the household and plot ownership as other indicators of productivity gaps. Lower productivity, therefore, is problematic as identified by Ali et al. [17] but addressing it has been slow. For example, they reported that plots for both subsistence and cash crops managed by women registered lower average yields, ranging between 20 and 30 percent less compared to men.
Recent work in Uganda by Mugisha et al. [3] using groundnut as a “woman’s crop” reveals how this gap is shaped. They found that labour use differences at plot level and variety types are main exponents of the yield gap. On the other hand, a study conducted in Vietnam attributed the yield gap between male- and female-headed households to be manifestations of endowment variations and their returns fluctuations [13]. Burke et al. [10] concluded that the observed gender yield gap was contributed by disparate access to productive inputs and dissociated such gaps from systemic differences in unobservable characteristics among men and women. A common bean study in Uganda revealed that there was no significant difference in bean yield from plots owned by men and women solely and jointly; that is, the average bean yield for women-owned plots was 1239.18 kg/ha while it was 1315.65 kg/ha for men-owned plots, and yield from plots owned by men and women jointly was estimated at 1285.02 kg/ha [18]. A gender breakdown of access to productive resources (training, credit, land, varieties, etc.) did not reveal any significant differences between men and women. The lack of gender disparities in yields and bean management systems mentioned above was attributed to PABRA and Community Enterprises Development Organisation (an NGO operating in the Central region) efforts in providing seed loan to farmers at planting time, linking them to other inputs providers in addition to intensive training in bean production. The gender breakdown study identified weather patterns and management systems as contributors to narrowing this gap. Peterman, Behrman and Quisumbing [19] found lower productivity on female-managed plots but pointed that these differences were crop-dependent as most men preferred cash lucrative crops compared to women who seemed to prefer crops consumed within households. Again, a paper from Malawi on legumes by Joe-Nkamuke et al. [20] revealed that groundnut cultivated on women-owned plots saw 28 percent less productivity compared to men’s.
Evidence from OECD’s index of Social Institutions and Gender Inequality (SIGI) shows that discriminatory social institutions perpetuate gender gaps in development areas and hinders social transformation that benefits both women and men. One of the five dimensions of discriminatory social institutions related to this study is restricted resources and assets. In Tanzania, the gender gap in secure access to land is 0.5, land title is 0.2, secure access to non-land assets is 0.5 and access to financial services of 0.5 (with 0 meaning there is no discrimination against women and 1 meaning there is a very high level of discrimination against women) [21]. Thus, gender gap in development and yield gaps are positively correlated [22]. However, this problem seems to affect some specific crops where women are seen to do much work or where social norms dictate the terms of their engagement to the activity. One such crop identified is the common bean (Phaseolus vulgaris). It is the smallholder’s favourite in terms of nutrition and income in Sub-Saharan Africa, with women dominating most of the activities [23]. For example, in Malawi, about 90 percent of the labour in beans, decision and crop knowledge is reserved to women [12]. However, in some other countries, men’s participation has increased considerably, as beans have become commercialised [24]. This study postulates that if the assumption of beans being a women’s crop holds, then there should exist observable gender yield gaps, and interventions such as providing improved seeds, promotion of innovation platforms and training of farmers on bean farming technologies should reduce the observed gaps significantly. Such revelations are possible with decomposition analysis of the sexes at the household level.
In this study, a detailed decomposition of the yield gap by sex is pursued using data from Tanzanian bean growing households, where the International Center for Tropical Africa-Africa intervened by providing improved varieties, providing training on gender issues and forming innovation platforms to bring farmers together. In Tanzania, beans are grown in 7 percent of the land under production, mainly by women, and 60 percent of the produced volumes are being sold in local markets [25]. Most of the women selling beans are retailers in local markets while men sell mostly in regional and international markets. Most studies have decomposed these gaps at means, but here, additional functional form restrictions are used at quantiles to reveal the nature and trajectory of the gap as proposed by Firpo et al. [26]. For example, we ask whether the bottom 10 percent or top 90 percent of producers are the most dissimilar. An attempt of decomposition in Tanzania by Akram-Lodhi, A. Haroon, Komba [1] proposed the Oaxaca-Blinder model but seemed to have used more descriptive statistics than empirical estimations.
Perhaps one fundamental shortcoming of earlier studies on productivity [1,3,20] was the estimation of outcomes at means. The proposal that the only source for observed yield differences between groups should be differences in inputs or characteristics at their means—an outlier problem—is not plausible. Additionally, most of these studies use time series methods, which, despite being the best approach, seldom work in time series data-deficient developing nations, at worse household level. However, a novel approach would be to look at these differentials along the Laplace-Gauss distribution as farmers fall in both tails. This is implemented in this study at quantiles level. This study also implements the latest developed re-centered influence functions for the Oaxaca-Blinder decomposition at 10, 50 and 90 percent quantiles as in Rios-Avila [27].
With such focus and revelation, the study intends to inform policy makers and program leaders on the causes of gender disparities in bean production. Thus, interventions can be customised to address gender-grey areas, and gender-blind policies can be enhanced. Another contribution to literature is the approximation of impacts of interventions to bridge the gender yield gaps. This is a huge contribution to influencing national policies and informing development projects on how to reduce these yield gaps.

2. Materials and Methods

2.1. Empirical Estimation

Counterfactual decomposition methods are the standard when it comes to partitioning the observed differences in mean outcomes between two groups. The Oaxaca-Blinder model has previously been used to decompose wages [28,29] and, in recent cases, to decompose the agricultural output or yield by sex of the individual [3]. From the unfavourable occupational distribution of wages decomposition studies by Oaxaca and Blinder [30] to recent re-centered influence functions using Oaxaca-Blinder models by Rios-Avila [27], estimating yield gap has improved significantly. In fact, Firpo et al. [26] exploit a two-stage procedure whereby wage is decomposed into one caused by structure effect and the other composition effect using a reweighting method. So far, these are high level studies that use wage differentials as the discriminating factor between men and women.
Interestingly, these econometric estimations have been extended to yield gap decomposition. In the absence of an advantage to any particular group, the expected values for the coefficients for each group must be the same. For example, Oseni et al. [5] used the Oaxaca-Blinder approach and found women to produce 28 percent less compared to men controlling for observed factors.
The propelling assumption behind this is that the differences in mean outcomes are the effects of covariates (differing endowments of yield) and coefficients (differing strengths of relationships between response variables and yield). It is the estimation of how large the gender yield gap is attributable to sex differences in characteristics associated with bean yield (such as age or education) denoted by Δ X v . The second part of the gap, Δ S v , is attributable to differences in the yield structure D ( ) , that is, differences in how these characteristics are rewarded in agriculture between men and women. This part refers to the “discrimination”. Yield distributions of the two groups, male (1) and female (0), for a farmer i can be represented as y i . The yield for males would be y i m and for females y i f ; where m is male and f is female.
y i s = D s ( Χ i , ε i ) = α 0 s + β 0 s Χ 1 i + + β k s Χ k i + ε i , for s = 0 , 1
where y i s is the log form of the yield, β i is a vector of regression coefficients, X i ’s are the covariates and ε i the error term. In this case, the underlying structural model to reflect the differences can be written as:
y i m = X i m β m + ε i
y i f = X i f β f + ε i
Algebraic shuffling may allow estimating mean bean yields between men and women as shown:
y ¯ i m y ¯ i f = X ¯ i m ( β ^ i m β ^ i f ) + ( X ¯ i m X ¯ i f ) β i f
Equation (4) decomposes the above discussed parts of the mean difference in bean yield y ¯ i m - y ¯ i f to consist of X ¯ i m ( β ^ i m - β ^ i f ) , that is, (coefficient effects) and ( X ¯ i m - X ¯ i f ) β i f being endowments of yield covariates among men and women (the “covariate effect”). A positive (negative) covariate effect would indicate the difference arising from male favourable (unfavourable) endowment of that covariate relative to the females. Two main assumptions are made in these calculations. The first one is additive linearity, that is, D ( X i , ε i ) = X i β i + ε i referring to additive separability of effects of observed and unobserved characteristics in D ( ) .The second is zero conditional mean E ( ε i | X i , S = 0 , 1 ) = 0 . With such sequential decomposition, it is difficult to separate the composition effect by estimating the role of each covariate but still making it independent of the order of the decomposition. For example, it would be important to determine to what extent changes in the distribution of age or education have contributed to growth in gender yield gap and inequality. This particular question is weakly addressed in the literature especially that of crop yield gaps.
While Oaxaca-Blinder decomposition is based on mean estimates of the outcome, the distributional statistics are often ignored [26]. The recently developed Reentered Influence Functions (RIFs) popularised by Rios-Avila [27] offers a more robust way of analysing unconditional partial effects on quantiles (unconditional quantile regressions). This is because, in the sample, the relative position of a given farmer’s yield compared to others (cumulative distribution function) is known.
Using the function F y ( ) to refer to the cdf, the vector of information to analyse these distributions is a set of ordered pairs:
F y = [ ( y , F y ( y ) ) | y ]
where y represents any positive number.
This can be extended to Oaxaca_RIFs where one assumes a joint distribution function describing relationships between outcome variable Y, the exogenous characteristics X, and the binary target T expressed as: f X , Y , T ( y i , x i , t i ) . Based on the two groups (males and females) represented by T, the joint probability distribution function on T can be written as:
f Y , X k ( y , x ) = f Y | X k ( Y | X ) f X k ( X )
where the k indicates that the estimated density is conditional on the expression T = k with k [ 0 , 1 ] . To decompose bean yield by sex for a given distributional statistic v, the cumulative conditional distribution of Y is important in calculating the yield. Thus,
Δ v = v 1 v 0 = v ( F Y m ) v ( F Y f ) Δ v = v ( F Y | X m ( Y | X ) d F X m ( X ) ) v ( F Y | X f ( Y | X ) d F X f ( X ) )
From Equation (7), the differences in distributional statistics Δ v arise due to the distributions of X (average characteristics) because d F X m ( X ) d F X f ( X ) . It can also arise due to differences in coefficients, that is, F Y | X m ( Y | X ) F Y | X f ( Y | X ) .
This main advantages of this methodology compared to other strategies existing in gender yield gap literature is the simplicity implementing it, ease of obtaining detailed contributions of each covariate on the aggregate decomposition and possibility of expanding the analysis RIF-based statistics [27].

2.2. Data Sources and Sampling Methods

2.2.1. Bean Variety Release and Adoption
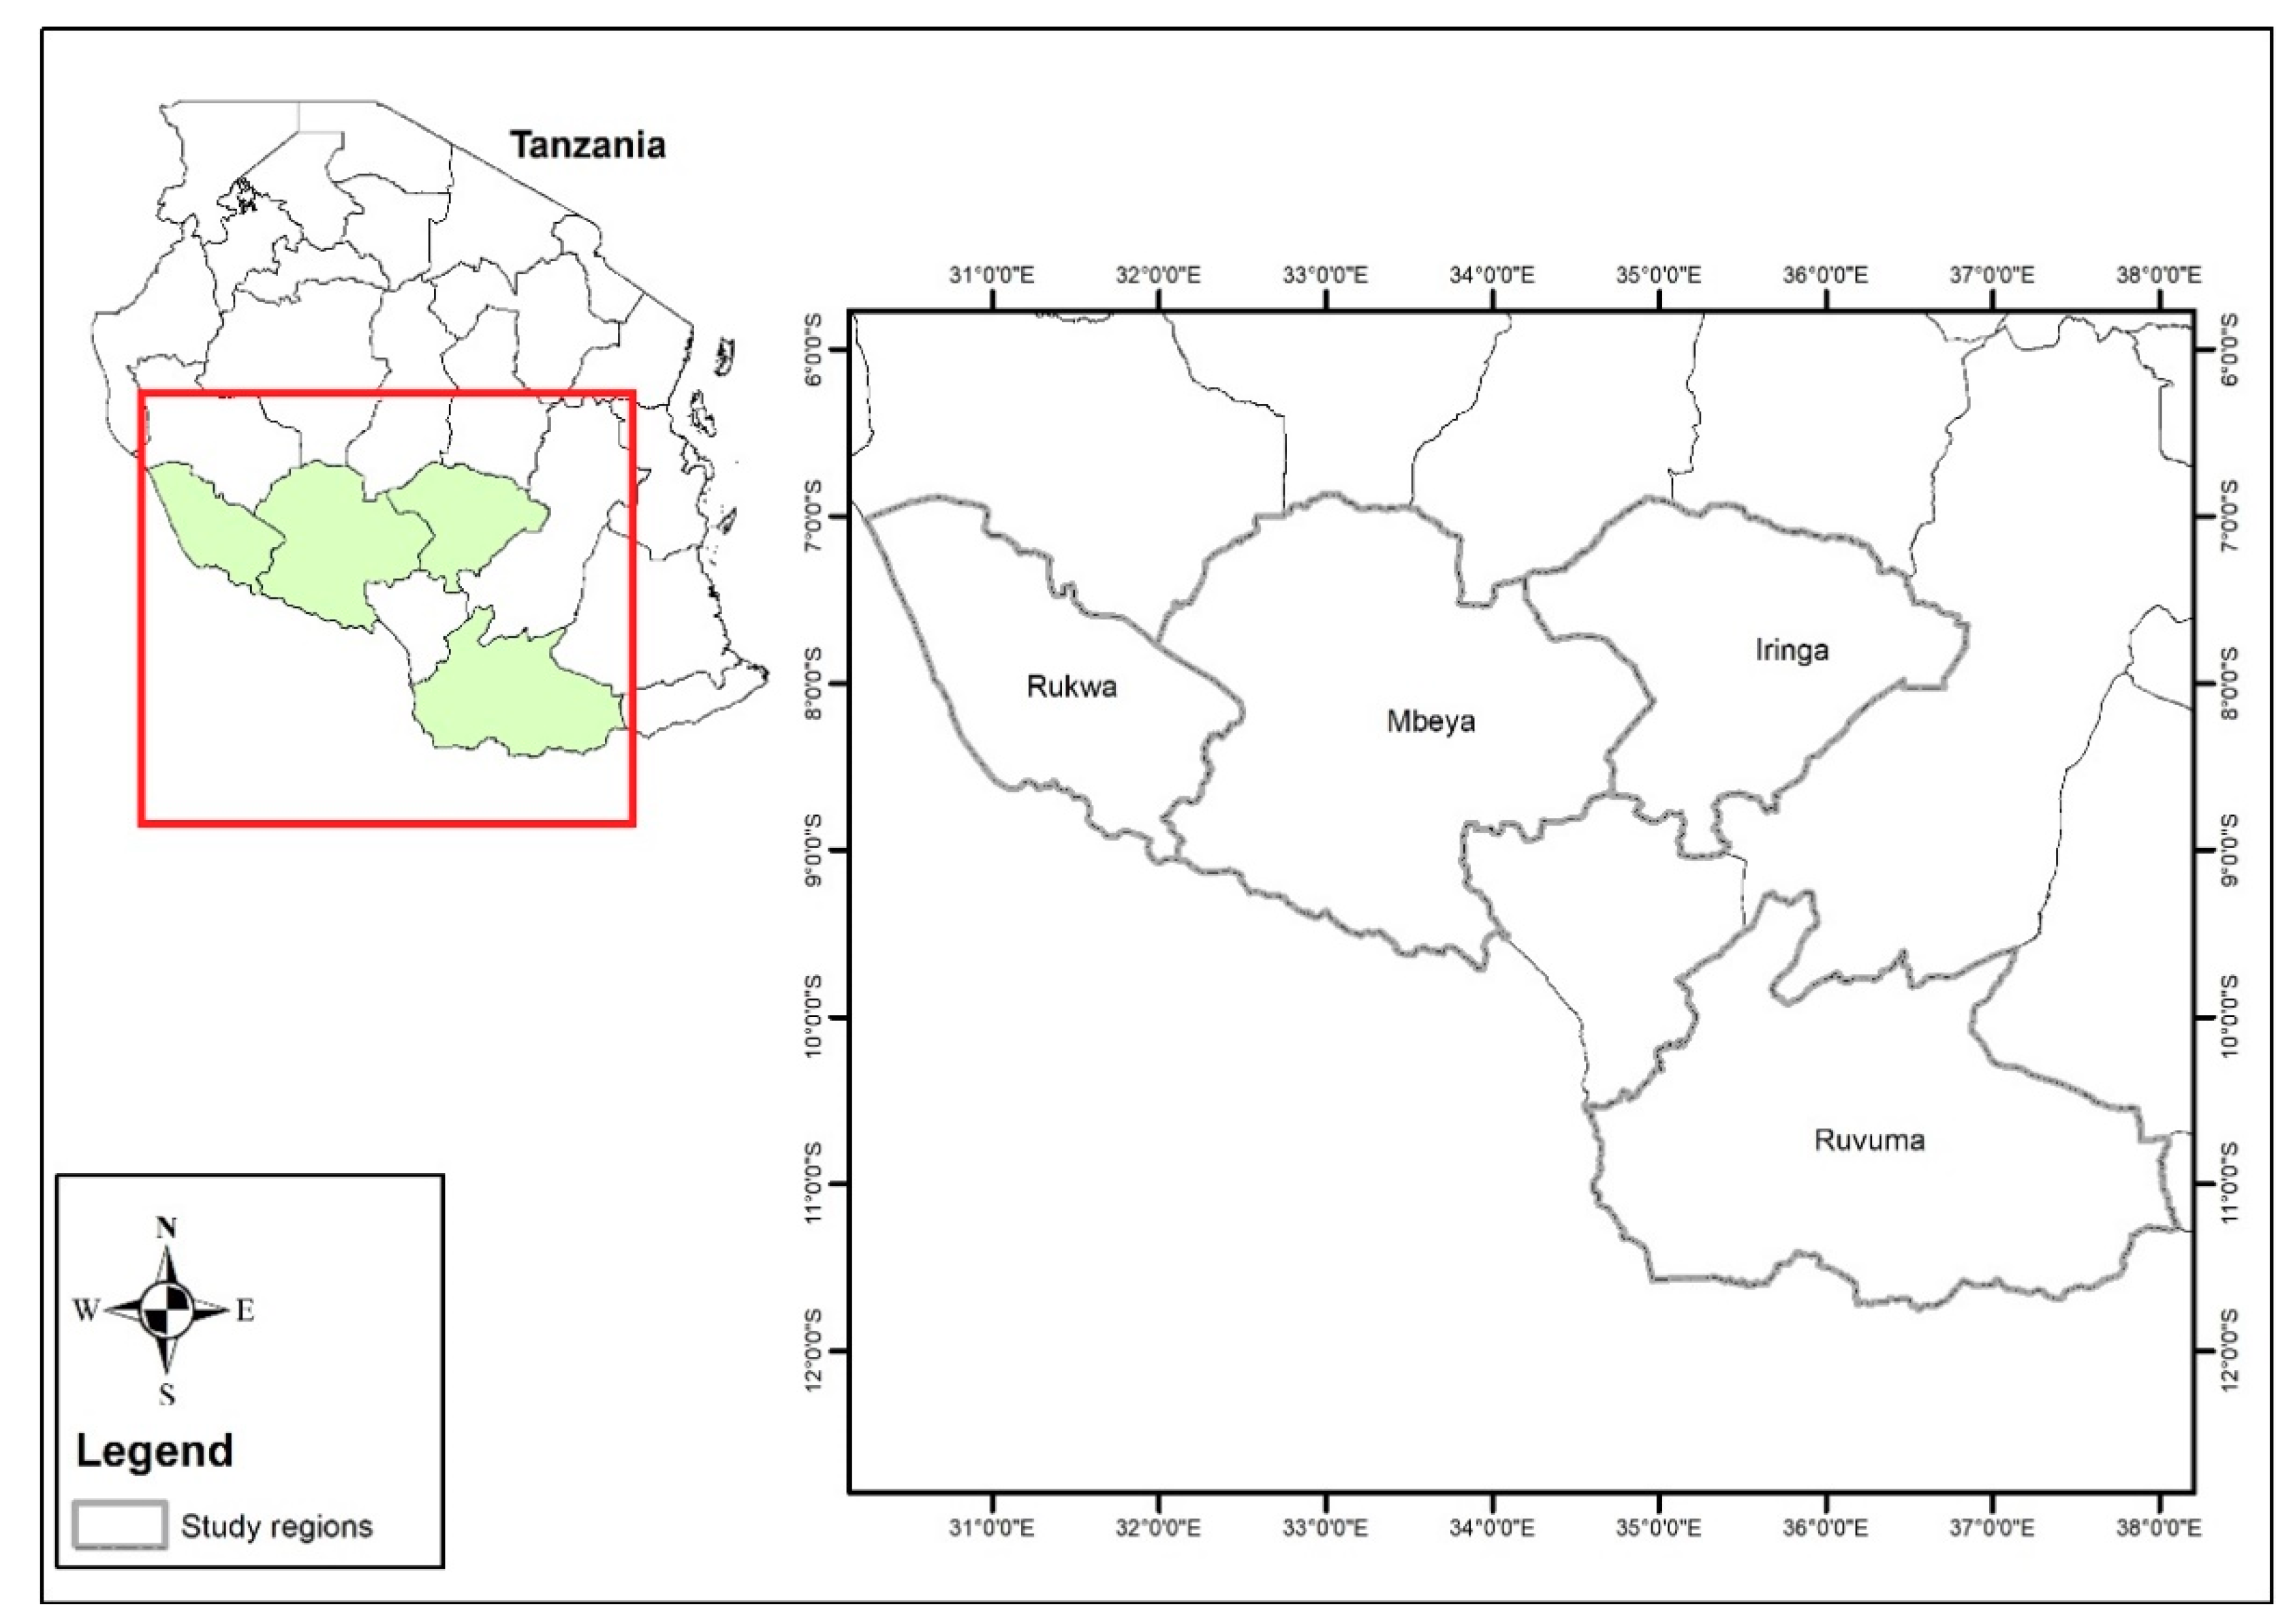
The International Centre for Tropical Agriculture (CIAT) collaborated with the national bean research teams at different research institutes in Tanzania (that is, Selian Agricultural Research Institute (SARI), Uyole Agricultural Research Center and TARI-Maruku Agricultural Research Institute) through the Tropical Legumes III project to release new bean varieties in Tanzania. Under the PABRA programme, the bean improvement research has seen 43 varieties released since 1979, averaging 1.1 variety releases annually. In the last four decades, the direct introductions from CIAT have accounted for about 28% of the varieties released. Beans in Tanzania act as a food security crop as reported by Musimu [31], ranking third after maize and cassava in terms of area cultivated. It is estimated that nearly 1,210,359 hectares of beans are cultivated per year in Tanzania by smallholder farmers [32]. Per capita, bean consumption is about 19.3 kg, and the crop contributes 16.9 percent protein and 7.3 percent calorie in human nutrition [33].

2.2.2. Study Area

The Southern Highlands, a high-altitude area, ranging from 1200–1500 m for Southern agro ecological zone and 1400–2300 m for Western agro-ecological zones of Tanzania was chosen for the study shown in Figure 1. The zones have fertile soils and a unimodal type of rainfall ranging between 100–200 mm per month and October to April annually [34]. The Southern Highlands has four administrative regions: Mbeya, Rukwa, Iringa and Ruvuma, where respondents were chosen. The Southern Highland accounts for more than 24.3 percent of the total national bean area, approximately 194,021 ha of beans.

2.2.3. Sampling and Data Collection

This study uses data that was collected in 2016 by CIAT and TARI Uyole under the auspices of the Tropical legumes project for assessing the impact assessment of the project [35]. The survey conducted in 2016 interviewed households that were surveyed at baseline in 2013 and were selected through a three-stage stratified sampling method. The details of the sampling procedure are documented in Letaa, Katungi, Kabungo and Ndunguru [36] while this paper provides an overview of the sampling methods and data collection. The first stage involved listing 28 bean producing districts in the southern zone in accordance with the National Agricultural Census of Tanzania in 2012. These districts fall under the four regions discussed above: Mbeya—201 households (33 percent), Iringa—182 households (30 percent), Rukwa—120 households (20 percent) and Ruvuma—100 households (17 percent). Urban districts were removed, thus only 20 districts in rural areas where bean is grown remained.
The second stage involved selecting, at random, 75 villages from each district based on their weighted probabilities, using a list obtained from the district extension officers then individual households were systematically randomly selected for the interviews. For households and individuals, a village register was obtained from the local leaders. The households on the list were numbered sequentially, and household for the study selected randomly using a random start. At baseline, a total of 750 households were sampled for the first survey in 2013. However, after investigating for households with missing information, outliers, repeated and those that did not grow beans, the total sample reduced to 447. The data were collected using two pre-tested structured questionnaires on a tablet.

3. Results and Discussion

3.1. Descriptive Statistics

Table 1 below shows tests of difference in means and groups in the sample. Additional statistics with means and standard deviations for selected demographic variables are as indicated on Appendix A. Productivity is significantly different at 1 percent between males and females. The geometric means of 4.9713 against 5.2708 indicates that women have 6 percent lower productivity compared to men, ceteris paribus. Women were more aged compared to males, have less dependents, were more experienced in farming but have very low education.
In terms of on-farm labour supply, there was a significant difference at 1 percent between females and males. On average and excluding hired labour, female respondents indicated that they provided 64.70 percent more on-farm labour compared to males. Male respondents, however, indicated that the difference was only 8 percent in terms of women’s provision of on-farm labour—an over- or underestimation issue in self-reported statistics. Also, females provided more off-farm labour in bean fields compared to men when they were the respondents. On the contrary, male respondents indicated that they provided 14 percent more off-farm labour compared to females. Labour estimation is self-reported and very subject to recall bias [37]. However, if labour is not disaggregated by sex, we see a mean of 13 man-days for females against 10 man-days for males. The consistent story is that females provide more on-farm labour than men. The findings of AGRA [38] indicated that in Tanzania, agriculture is female-intensive and 54 percent of the labour force is comprised of women.
On average, 61.97 percent of the respondents did not use fertiliser, of which 77.25 percent were males compared to 29.44 percent females. However, for those who used fertiliser, females used an average of 24.64 kg per acre while males used 44.29 kg per acre of the Di-Ammonium Phosphates (DAP). Use of Urea was high, with females using an average of 45.75 kg per acre compared to 57.16 kg per acre by males. The rate of use of nitrogenous fertiliser was high on leguminous crops, perhaps due to factors attributed to recall bias by respondents as they could not accurately recall a standardised measurement or maybe lack of proper training by extension officers. Regardless of the type of fertiliser, females used 40.21 kg per acre and males used 52.83 kg per acre. The mode (most occurring) for fertiliser use was 50 kg per acre reported by both sexes and for the sub-sample that applied fertiliser. This represents higher average fertiliser use compared to 6.88 kg per acre or 17 kg/ha reported for maize farmers in Tanzania [39]. We attribute this to biases of self-reported figures that may need frequent physical measurements during the planting seasons. However, the recommended rate of DAP is 25 kg/acre during planting, according to Kenya Agricultural Research Institute brochure [40]. This means that fertiliser application rates for DAP amongst women are slightly low compare to men who met the recommended dose. Chemicals such as pesticides and herbicides use were also low among females.
A t-test revealed a significant difference at 5 percent in terms of total land size as men held a mean land size of 4.9 acres (1.98 Ha) compared to a mean of 4.1 acres (1.66 Ha) for females. The study did not look at intra-household co-owned plots that would have, perhaps, painted a different picture of men and women in the same households than in different households. Land under beans was not significantly different among the sexes. Access to amenities, especially roads, was also low among women respondents as they took an average of 40 min to reach a tarmac road compared to 27 min for males when walking. This does not imply that males lived along the roads but perhaps because of the oversampling of males who may be lived near tarmac roads at the time of sampling. It should be noted that these are self-reported time averages that may be prone to biases.

3.2. Explaining the Gender Yield Gap

Figure 2 shows that the densities change with the sex of the respondent, even though different positioning exist at some local peaks and different quantiles due to heaping. The typical issue here is the cliffs associated with minimum yield per acre when other factors of production are held constant. The gap between males and females tend to be higher around the mid-percentiles, indicating that the productivity distribution is more favourable to the bean producers at the upper quantiles. Again, as confirmed by Figure 2, the gap tends to be large as one moves on to the upper quantiles. It is demonstrated that if women had the same endowments and characteristics as men, the productivity would shift to the right and peak at higher densities. While Nakazi et al. [24] found that higher quantile was associated with a disincentive to participate in bean related activities, our results show the contrary. Perhaps this may be associated with the general endowments in terms of land, capital and the general economies of scale as one moves along the quantile.
Table 2 below shows the decomposed productivity using different methods. Surprisingly, in aggregate, coefficient effects are dominant, causing a 30 percent difference in the yield gap between male and female farmers. The geometric mean yields of beans are 5.27 for males and 4.97 for females. These translate to 194.57 kg per acre for males and 144.22 kg per acre for females. The results suggest that of the 0.30 mean productivity log difference, approximately 0.08 productivity mean log can be attributed to differences in endowments (i.e., income, experience, education) and 0.17 to differences in coefficients (ex-hypothesi worse β’s for men), with the remaining part being accounted for by the interaction. The high proportion of unexplained gender differences in terms of yield, maybe purely attributed to heterogeneity in the data and the fact that sampling was more on males. The findings are consistent with Mugisha, Sebatta and Mausch [41], who found lower yield among women but also attributed such difference to preferences of commercial aspects of production among females. Adjusting for selection bias doubles the productive capacity of women. However, these are a bit higher and need a test for specification error, discussed later when estimations are done at quantiles. This is indicated on the right panel of Table 2.
It reveals that as one moves along the distribution curve, their yield more than doubles with males at 75th quantile having 9 percent higher yield than females. These are attributable to endowment effect but are, again, unexplained due to heterogeneity in terms of unobservable characteristics between male and female farmers. The counterfactual indicates that if women had the same characteristics and endowments as men, their productivity would change by 0.14 logs at the 25th percentile, 0.20 logs at the 50th percentile and remain the same at the 75th percentile.
Table 3 shows how differences due to different productivity, the advantage of the high group—men (that is, a group with advantages in terms of assets) and the disadvantage of the low group—women (that is, a group disadvantaged in terms of assets contribute to the productivity gap. For example, for males, the difference in characteristics is negative for Omega (males), indicating that observable characteristics among males contribute significantly to reducing the yield gap. If women had similar endowments and advantages in characteristics as men, they would contribute up to 42 percent in reducing the yield observed.

3.3. Gender Yield Gap by Variety Selection

Table 4 below shows that growing improved varieties had an upward effect on the yield for both male and female farmers. In fact, the average yield for males changed by 5 percent upwards, while females changed by 24 percent. Consistently, females, despite the situation, have a comparative disadvantage in yield. Even when they grow local varieties, males dominate. However, these are associated with coefficient effects and not endowments. The interaction term indicates the simultaneous effect between endowments and coefficients for the males and females. Again, this is consistent with the findings of Mugisha et al. [3] that if females had the same characteristics or endowments of men, their yield of improved varieties would increase by up to 49.5 percent.

3.4. Drivers of Gender Yield Gap

Results from Table 5 show covariates that drive the yield gap using different approaches. From OLS, it is evident that productivity is positively and significantly influenced by age, sex, attending training on beans, selling of beans, renting land and profit from the sale of beans. It is negatively and significantly affected by region, use of revenue from beans, plot size under beans, distance to the tarmac road and whether one planted an improved variety. When classical Oaxaca-Blinder is applied for decomposition, only age coefficients explain the difference. This means that the share of proportion age contributes 0.045 to the difference. Age and productivity are positively correlated, as Adesoji and Farinde [42] found out. Perhaps this is because age is associated with farming experience translating to more productivity. From these results, it is possible to see that decomposition without looking at the Gaussian curve is misleading. Thus, from the unconditional distributions, it is evident that these covariates begin to show better estimates for the productivity gap. The right panel of the table shows that age is also a factor for those below the 25th percentile. The real decomposition is at the 50th percentile, confirming findings indicated in Figure 1. At this percentile, if age, family size, additional years of schooling and revenue expenditure coefficients were taken from women, they would be worse off. Family size may be associated with household labour supply in fields. Family size is very important in labour provision in the African context and provides family social capital. In fact, labour provided by family promotes strategic commitment to improving productivity and competitiveness, just as posited by Damiani et al. [43]. Education is associated with better agronomic practices of revenue from beans. The findings of Oduro-ofori, Aboagye Anokye and Acquaye [44] confirmed that education indeed attributes to higher productivity. Most farmers in the sample (84.34 percent) had primary education.
When decomposed by our treatment, that is, if farmer used improved variety or not, the picture does not change much. The driver is income from the sale of beans which is significant at 1 percent. This can be attributed to the motivation on or rewards that farmers get from such sales that may boost their productivity. In such cases, it is expected that farmers with better rewards from bean activities may likely reinvest part of the capital to the farm and purchase inputs. Also, gross farm income is the primary drivers of adoption, as Brookes and Barfoot [45] found out. The authors argued that income could also be used to quantify the (net) production impact of a given technology amongst farmers. While the case is the same for the ones who used local or indigenous varieties, the study finds no other covariates that can explain the observed gap in productivity between males and females and attributed such to heterogeneity and factors associated with endogenous regressors.

4. Conclusions and Policy Implications

Using Oaxaca methods have revealed the factors that need addressing might be related to the heterogeneity of the populations and confounding latent factors. The specification error and re-weighted error for the RIF were not significantly different from zero at the 25th, 50th and 75th percentiles. This means that the RIF-regressions provide highly accurate estimates and very efficient in revealing the true nature of gender yield gaps in agriculture. At the 50th percentile, the gap is wide, and at the edges of the continuum, the drivers are more or less the same. It is interesting that re-centered influence functions (RIFs) provide robustness of statistics to outliers, showing a continuum of outcomes at different levels and enable obtaining of asymptotic standard errors in complex distributional statistics.
While physical assets and ownership of production factors such as land have been argued as the main cause of discrimination across gender [4], this study finds no significant difference between men and women. Of course, males own more land, but land under beans have a difference of only 0.01 acres. In Tanzania, married women have usufruct rights on land and are often apportioned spaces strictly for crop cultivation [46]. Thus, women, in this case, have very little discrimination in accessing land to produce food for the family even if ownership is by men. Management and related confounders that are often difficult to measure may be the driving force behind productivity. Even after controlling for factors that would bias the selection for women (see Heckman model results in Figure 2), the model improved but not the endowment parameters. In the first stage of Heckman procedure, marital status formed part of assumption of exclusion restrictions, and was assumed to influence the probability of women being sampled. It should be noted that in the final analysis, it had no influence on the ultimate dependent variable (yield). Productivity gap may also be a utility maximisation problem that depends on a collective decision process in households, as Nazli and Hamid [47] argued. As found out, women who engaged their families in decisions for varieties to plant often had better yields. Providing improved varieties, input, and related enablers of productivity, such as training, have a significant effect on productivity as revealed in OLS, but they seldom point to the observed productivity gap. This confirms that the underlying heterogeneity factors need to be included in gender yield gap analyses.
The study reveals that there are some factors that if taken away from females, they would even be worse off in terms of productivity compared to males. For example, female’s age, family size, additional years of schooling and how they spend income from beans clearly show areas that make women better off in bridging the productivity gap. Perhaps, programs and projects need to start designing far-reaching objectives that touch on these factors. Policy makers already know that females’ education is very key in boosting the farm families’ incomes and catapult them out of poverty. Now, however, issues of intra-household decision making and consultations with partners seem to be playing a critical role in influencing productivity. The implication is that pooled decisions tend to affect productivity in the household positively, and awareness creation and gender campaign tools should be designed to build farmers capacity on such aspects.
Future discourses on productivity gaps need to include the confounding factors that potentially drive the gap between males and females. Albeit structural equations modelling can help provide pathways to achieving that, the nature of data needs to be taken into consideration, too. For example, panel datasets may be rich in information that can be used to draw large-scale policy agenda for the farmers in developing nations. The re-centered influence functions provide precise measurements at the unconditional quantile distribution that can be combined with confounder to reveal the direction and magnitude of the productivity gap.
The paper recommends gender-specific support/interventions to close the yield gap, which will ensure equal income distribution and, hence, reduce poverty, especially in female farmers. These may include deliberate women empowerment through trainings and free improved seed provision, participatory plant breeding that considers variety attributes that appeal to women, national policy on gender issues in agriculture and general public support to finance women’s agriculture.

Author Contributions

E.B.N.: Conceptualization, visualization, writing—original draft preparation, reviewing and editing. O.A.C.: Methodology, formal analysis, data curation, writing—original draft preparation, reviewing and editing. E.K.: Methodology, conceptualization, writing—reviewing and editing. A.N. and C.K.: Project administration, investigation, writing—reviewing and editing. E.M.N. and C.O.O.: Writing—reviewing, and editing. All authors have read and agreed to the published version of the manuscript.

Funding

Bill and Melinda Gates Foundation funded this work under the Tropical Legume III (TLIII) and Accelerated varietal improvement and seed delivery of legumes and cereals in Africa (AVISA) projects under the auspices of the CGIAR-Research Program on Grain Legumes and Dryland Cereals (CRP-GLDC), coordinated by the International Crops Research Institute for the Semi-Arid Tropics.

Institutional Review Board Statement

Ethical review and approval were waived for this study, due to REASON (please provide a detailed justification).

Informed Consent Statement

Informed consent was obtained from all subjects involved in the study.

Acknowledgments

We would also like to thank the farmers who willingly answered all our questions and trusted that the data would be anonymised. We are also grateful to all the data collection agents and partners in Tanzania who, in one way or the other, contributed to this work.

Conflicts of Interest

The authors declare no conflict of interest. The funders had no role in the design of the study; in the collection, analyses, or interpretation of data; in the writing of the manuscript, or in the decision to publish the results.

Appendix A. Descriptive Statistics of the Sampled Households (Demographics Only)

VariableObsMeanStd. Dev.
Age (Years)44741.8910.45
Sex (1 = male; 0 = female)4470.750.44
Marital status (1 = married; 0 = otherwise)4470.210.82
Relationship to head (1 = head; 0 = otherwise)4471.000.49
Household type (1 = dual; 0 = otherwise)4471.080.49
Number of dependants4472.351.56
Education (1 = primary; 0 = otherwise)4471.531.46
Actual years of schooling4476.322.42
Experience in years44716.1611.03
Occupation (1 = farming; 0 = otherwise)4471.030.22
Belongs to farmers organization (1 = yes; 0 = otherwise)4470.450.50

References

  1. Akram-Lodhi, A.H.; Komba, I. What are the Factors Driving the Gender Gap in Agricultural Productivity in Tanzania? UN Environment Poverty-Environment Initiative: Rome, Italy, 2018. [Google Scholar]
  2. Chen, J.J.; Crown, D. The gender pay gap in academia: Evidence from the Ohio State University. Am. J. Agric. Econ. 2019, 101, 1337–1352. [Google Scholar] [CrossRef]
  3. Mugisha, J.; Sebatta, C.; Mausch, K.; Ahikiriza, E.; Kalule Okello, D.; Njuguna, E.M. Bridging the gap: Decomposing sources of gender yield gaps in Uganda groundnut production. Gend. Technol. Dev. 2019, 23, 19–35. [Google Scholar] [CrossRef] [PubMed] [Green Version]
  4. Njieassam, E.E. Gender inequality and land rights: The situation of indigenous women in Cameroon. Potchefstroom Electron. Law J. 2019, 22. [Google Scholar] [CrossRef] [Green Version]
  5. Oseni, G.; Corral, P.; Goldstein, M.; Winters, P. Explaining gender differentials in agricultural production in Nigeria. In Agricultural Economics (United Kingdom) 2015; The World Bank: Washington, DC, USA, 2014; Volume 46. [Google Scholar] [CrossRef] [Green Version]
  6. Bigler, C.; Amacker, M.; Ingabire, C.; Birachi, E. Rwanda’s gendered agricultural transformation: A mixed-method study on the rural labour market, wage gap and care penalty. In Women's Studies International Forum; Pergamon: Oxford, UK, 2017; Volume 64, pp. 17–27. [Google Scholar]
  7. Goldin, C. A grand gender convergence: Its last chapter. Am. Econ. Rev. 2014, 104, 1091–1119. [Google Scholar] [CrossRef] [Green Version]
  8. Kahn, L.M.; Blau, F.D. The gender wage gap: Extent, trends, and explanations. J. Econ. Lit. 2016, 55, 789–865. [Google Scholar]
  9. World Economic Forum. 2018 The global gender gap report. In World Economic Forum; World Economic Forum: Geneva, Switzerland, 2019. [Google Scholar] [CrossRef]
  10. Burke, W.J.; Li, S.; Banda, D. Female access to fertile land and other inputs in Zambia: Why women get lower yields. Agric. Hum. Values 2018, 35, 761–775. [Google Scholar] [CrossRef]
  11. David, S.; Kirkby, R.; Kasozi, S. Assessing the Impact of Bush Bean Varieties on Poverty Reduction in Sub-Saharan Africa: Evidence from Uganda; CIAT African Occasional Publications Series; International Centre for Tropical Agriculture: Palmira, Colombia, 2000; 21p. [Google Scholar]
  12. Njuki, J.; Kaaria, S.; Chamunorwa, A.; Chiuri, W. Linking smallholder farmers to markets, gender and intra-household dynamics: Does the choice of commodity matter? Eur. J. Dev. Res. 2011, 23, 426–443. [Google Scholar] [CrossRef] [Green Version]
  13. Van Tran, T.K.; Elahi, E.; Zhang, L.; Bui, V.H.; Pham, Q.T.; Tran, T.D.; Ta, T.L.; Hassan, M. Gender gap in rice productivity: Evidence from Vietnam. Int. J. Soc. Econ. 2019, 46, 241–251. [Google Scholar] [CrossRef]
  14. Gaddis, I.; Lahoti, R.; Li, W. Gender Gaps in Property Ownership in Sub-Saharan Africa; The World Bank: Washington, DC, USA, 2018. [Google Scholar]
  15. Aregu, L.; Choudhury, A.; Rajaratnam, S.; van der Burg, M.; McDougall, C. Implications of agricultural innovation on gender norms. In Gender, Agriculture and Agrarian Transformations; Routledge: Abingdon-on-Thames, UK, 2019. [Google Scholar] [CrossRef]
  16. Berger, T. Enhancing Women’s Role in Land Management Decisions. Legal Tools for Citizen Empowerment; IIED: London, UK, 2016. Available online: https://www.iied.org/enhancing-womens-role-land-management-decisions (accessed on 3 August 2020).
  17. Ali, D.; Bowen, D.; Deininger, K.; Duponchel, M. Investigating the gender gap in agricultural productivity: Evidence from Uganda. In World Development; The World Bank: Washington, DC, USA, 2016; Volume 87. [Google Scholar] [CrossRef] [Green Version]
  18. PABRA. PABRA Annual Technical Progress Report Period 2017–2018; 12 Months; CIAT: Palmira, Colombia, 2017; Volume 2017. [Google Scholar]
  19. Peterman, A.; Behrman, J.; Quisumbing, A. A Review of Empirical Evidence on Gender Differences in Non-Land Agricultural Inputs, Technology, and Services in Developing Countries; Springer: Berlin/Heidelberg, Germany, 2011; Available online: www.fao.org/economic/esa (accessed on 3 August 2020).
  20. Joe-Nkamuke, U.; Olagunju, K.O.; Njuguna-Mungai, E.; Mausch, K. Is there any gender gap in the production of legumes in Malawi? Evidence from the Oaxaca—Blinder decomposition model. Rev. Agric. Food Environ. Stud. 2019, 100, 69–92. [Google Scholar] [CrossRef] [Green Version]
  21. OECD Development Centre/OECD (2020). Gender, Institutions and Development (Edition 2014), OECD International Development Statistics (Database). Available online: https://doi.org/10.1787/data-00728-en (accessed on 3 August 2020).
  22. FAO. The state of food and agriculture: Women in agriculture, closing the gender gap for development. In Soil Science; Food and Agriculture Organization: Rome, Italy, 2011. [Google Scholar] [CrossRef]
  23. Katungi, E.; Kikulwe, E.; Emongor, R. Analysis of farmers valuation of common bean attributes and preference heterogeneity under environmental stresses of Kenya. Afr. J. Agric. Res. 2015, 10, 2889–2901. [Google Scholar]
  24. Nakazi, F.; Njuki, J.; Ugen, M.A.; Aseete, P.; Katungi, E.; Birachi, E.; Kabanyoro, R.; Mugagga, I.J.; Nanyonjo, G. Is bean really a women’s crop? Men and women’s participation in bean production in Uganda. Agric. Food Secur. 2017, 6, 22. [Google Scholar] [CrossRef]
  25. Demissie, T.; Groot, A.; Duku, C.; Budding-Polo, M.; Kabuka, G.; Nkenja, E.; Ninga, K.; Lyimo, R.; Recha, J.; Osumba, J.; et al. Common beans Tanzania: Climate change risks and opportunities. In The Climate Resilient Agribusiness For Tomorrow (Craft) Project; Wageningen Environmental Research: Wageningen, The Netherlands, 2019. [Google Scholar]
  26. Firpo, S.P.; Fortin, N.M.; Lemieux, T. Decomposing wage distributions using recentered influence function regressions. Econometrics 2018, 6, 28. [Google Scholar] [CrossRef] [Green Version]
  27. Rios-Avila, F. Recentered influence functions in Stata: Methods for analyzing the determinants of poverty and inequality. SSRN Electron. J. 2019. [Google Scholar] [CrossRef] [Green Version]
  28. Kwenda, P.; Ntuli, M. A detailed decomposition analysis of the public-private sector wage gap in South Africa. Dev. South. Afr. 2018, 35, 815–838. [Google Scholar] [CrossRef]
  29. Hotchkiss, J.L.; Rios-Avila, F. Identifying factors behind the decline in the U.S. labour force participation rate. Bus. Econ. Res. 2013, 3. [Google Scholar] [CrossRef] [Green Version]
  30. Oaxaca, R. Male-female wage differentials in urban labour markets. Int. Econ. Rev. 1973, 14, 693–709. [Google Scholar] [CrossRef]
  31. Musimu, J.J. Economics of Small Holder Common Beans Production in Mbeya, Tanzania. Master’s Thesis, Sokoine University, Morogoro, Tanzania, 2018. [Google Scholar]
  32. FAOSTATS. Bean production in Tanzania in 2018. FAO: Rome, Italy. Available online: http://www.fao.org/faostat/en/#data/QC (accessed on 3 August 2020).
  33. Rugambisa, J. Marketing of beans in SubSaharan Africa and impact of market on new cultivars. In Progress in Improvement of Common Bean in Eastern and Southern Africa, Proceedings of the Ninth SUA/CRSP and Second SADCC/CIAT Bean Research Workshop, Sokoine University of Agriculture, Morogoro, Tanzania, 17–22 September 1990; Smithson, J.B., Ed.; Africa Workshop Series No. 12. CIAT: Palmira, Colombia, 1990. [Google Scholar]
  34. Luhunga, P.M. Assessment of the impacts of climate change on maize production in the southern and western highlands sub-agro ecological Zones of Tanzania. Front. Environ. Sci. 2017, 5. [Google Scholar] [CrossRef] [Green Version]
  35. Katungi, E.; Letaa, E.; Kabungo, C.; Ndunguru, A.; Mukankusi, C.; Raatz, B.; Ssekamate, A.; Rubyogo, J.C. Assessing the Impact of the Tropical Legumes II&III Project on Common Bean Productivity, Profitability and Marketed Surplus in Southern Highlands of Tanzania; Technical report; PABRA: Nairobi, Kenya, 2019. [Google Scholar]
  36. Letaa, E.; Katungi, E.; Kabungo, C.; Ndunguru, A.A. Impact of improved common bean varieties on household food security on adopters in Tanzania. J. Dev. Eff. 2020, 12, 1–20. [Google Scholar] [CrossRef]
  37. Bell, A.; Ward, P.; Tamal, M.E.H.; Killilea, M. Assessing recall bias and measurement error in high-frequency social data collection for human-environment research. Popul. Environ. 2019, 40, 325–345. [Google Scholar] [CrossRef] [Green Version]
  38. Alliance for a Green Revolution in Africa. Tanzania Early Generation Seed Study; AGRA—SSTP for the United State Agency for International Development: Washington, DC, USA, 2016. [Google Scholar]
  39. Catherine, S.; George, L.; Atanasio, M.; Charles, W.; Muhamadi, M.; Msaky, J.; Rose, U.; Lyimo, S. Optimizing fertilizer use within the context of integrated soil fertility management in Zambia. In Fertilizer Use Optimization in Sub-Saharan Africa; CAB International: Nairobi, Kenya, 2017; pp. 210–219. [Google Scholar] [CrossRef]
  40. Kenya Agricultural Research Institute. 2008. KARI Information Brochure Series. Available online: http://www.kalro.org/fileadmin/publications/brochuresII/Grow_improved_beans.pdf (accessed on 3 August 2020).
  41. Mugisha, J.; Sebatta, C.; Mausch, K. Women’ s production capacities enhancement and gender yield gap reduction in groundnuts in Uganda. Poster Abstracts. In Proceedings of the InterDrought-V, Hyderabad, India, 21–25 February 2017; p. 171. [Google Scholar]
  42. Adesoji, S.A.; Farinde, A.J. Socio-economic factors influencing yield of arable crop in Osun State, Nigeria. Asian J. Plant Sci. 2006, 5, 630–634. [Google Scholar] [CrossRef]
  43. Damiani, M.; Fabrizio, P.; Ricci, A. Family firms and labour productivity: The role of enterprise-level bargaining in the Italian economy family firms and labour productivity: The role of enterprise-level bargaining in the Italian economy. Munich Personal RePEc Archive. J. Small Bus. Manag. 2018, 56, 573–600. [Google Scholar] [CrossRef]
  44. Oduro-ofori, E.; Aboagye Anokye, P.; Acquaye, N.E.A. Effects of education on the agricultural productivity of farmers in Offinso municipality. Int. J. Dev. Res. 2014, 4, 1951–1960. [Google Scholar]
  45. Brookes, G.; Barfoot, P. Farm income and production impacts of using GM crop technology 1996–2016. GM Crop. Food 2018, 9, 59–89. [Google Scholar] [CrossRef] [PubMed] [Green Version]
  46. Moyo, K.J. Women’s Access to Land in Tanzania: The Case of the Makete District. Ph.D. Thesis, KTH Royal Institute of Technology, Stockholm, Sweden, 2017. [Google Scholar]
  47. Nazli, H.; Hamid, S. Concerns of food security, role of gender, and intrahousehold dynamics in Pakistan. Pak. Dev. Rev. 1999, 3, 1–35. Available online: http://www.pide.org.pk/pdr/index.php/wp/article/view/2376/2349 (accessed on 3 August 2020).
Figure 1. Study area in the Southern Highlands, Tanzania.
Sustainability 13 00077 g001
Figure 2. Kernel density estimates of the gender yield gap among males and females producing beans in Tanzania.
Sustainability 13 00077 g002
Table 1. Household bean production characteristics.
Sex
VariableWomen (113)Men (334)
Mean (Std. Dev)/%Mean (Std. Dev)/%t-test/Chi
Log productivity (total bean output/land under beans)4.97 (1.05)5.27 (0.98)2.8512 ***
Socio-demographic characteristics:
Age (number)43.58 (9.39787)41.3304 (10.746)1.9965 **
Dependents (number)2.13 (1.6284)2.43 (1.5263)−1.748 **
Dual (husband and wife)24.65%75.35%
Female headed with another adult male decision-maker37.5%62.5%3.9133
Male headed with another adult female decision-maker60%40%
Farming experience (years)13.18 (15.71)11.13 (13.44)1.35
Region: Mbeya24.84%75.16%0.3231
Iringa25.78%74.22%
Rukwa27.06%72.94%
Ruvuma23.38%76.62%
Education: Primary25.4674.541.5686
Secondary- O’ level32.1467.86
No school19.0580.95
Labour and input use:
Female on-farm labour (man-days)14.60 (13.04)12.76 (11.27)−17.8825 ***
Male on-farm labour (man-days)7.96 (9.70)10.80 (8.79)
Female off-farm labour (man-days)2.33 (4.9418)1.32 (2.46)1.5393
Male off-farm labour (man-days)2.10 (4.01)1.75 (3.12)
Quantity of fertiliser used (kg): DAP24.64 (22.72)44.29 (45.81)0.7229
Urea45.75 (40.07)57.16 (51.09)
Quantity of pesticide used (liters)0.08 (0.21)0.17 (0.43)−2.372 **
Production cost (hired labour, fertiliser, pesticides, tractor, oxen etc.) -Tzsh56,282.70
(82,696.55)
54,262.57
(89,430.80)
0.4217
Total land size (acres)4.11 (2.66)4.92 (3.01)−2.5339 **
Plot size under beans (acres)1.20 (0.95)1.37 (1.39)−1.1995
Use improved variety: No25.63%74.37%0.0712
Yes24.43%75.57%
Access to services and amenities
Distance to tarmac road (minutes)39.65 (75.63)26.6586 (46.74)2.1522 *
Credit access: No25.13%74.87%0.0410
Yes26.42%73.58%
Market access: Farm gate/home25.75%74.25%0.3992
Village market25.81%74.19%
Main/district market21.57%78.43%
Note: Categorical variables are in percentages and tested using χ 2 while continuous are at means and tested using t-test legend: * p < 0.05; ** p < 0.01; *** p < 0.001. DAP is Di-Ammonium Phosphate.
Table 2. Oaxaca-Blinder, Oaxaca corrected for selection bias (Heckman) model and Oaxaca_RIF for gender yield gap in common bean production.
Oaxaca-BlinderSelection Bias Correction (Heckman)Oaxaca-Re-Centered Influence Functions
ParameterCoeff.Exp. Coeff.Coeff.Exp. Coeff.Coeff.Exp. Coeff.
Q25Q50Q75Q25Q50Q75
Males5.27 ***
(0.05)
194.575.27 ***
(0.05)
194.57Males4.68 ***
(0.07)
5.37 ***
(0.06)
5.82 ***
(0.06)
108.10214.48337.34
Counterfactual4.63 ***
(0.05)
5.22 ***
(0.06)
5.65 ***
(0.04)
102.27185.69284.01
Females4.97 ***
(0.10)
144.228.66 ***
(2.40)
5778.51Females4.49 ***
(0.11)
5.02 ***
(0.11)
5.65 ***
(0.11)
89.30151.56284.95
Difference0.30 **
(0.12)
1.35−3.39
(2.40)
0.03Difference0.19
(0.13)
0.35
(0.13)
0.17
(0.12)
1.211.421.18
Explained0.11
(0.07)
1.12−2.36
(5.37)
0.09Explained0.06
(0.07)
0.14
(0.07)
0.17
(0.07)
1.061.151.19
Unexplained0.19 *
(0.09)
1.21−0.07
(0.10)
0.93Unexplained0.14
(0.20)
0.20
(0.20)
−0.003
(0.20)
1.151.231.00
Endowments0.08
(0.11)
1.090.24
(3.21)
1.28
Coefficients0.17 *
(0.10)
1.19−3.32
(2.41)
0.04
Interaction0.04
(0.09)
1.04−0.31
(3.21)
0.73
Legend: * p < 0.05; ** p < 0.01; *** p < 0.001. Note: Exp. Coeff. Are exponentiated coefficients. Robust standard errors in brackets.
Table 3. Decomposition of the yield differential between men and women using the Neumark method.
ResultsCoefficientsPercentage
Omega = Males
Characteristics−0.0828
Coefficients−0.22672
Omega = Females
Characteristics−0.1342
Coefficients−0.1758
Omega = wgt (Neumark weight)
Productivity−0.1241
Advantage−0.13544
Disadvantage−0.0415
Raw−0.30100
Table 4. Oaxaca-Blinder decomposition based on variety selection.
ParameterImproved Variety (Exp)Local/Indigenous Variety (Exp)
Group_1_Males205.26 ***
(0.09)
190.24 ***
(0.07)
Group_2_Females179.26 ***
(0.30)
132.34 ***
(0.10)
Difference1.15
(0.27)
1.43 **
(0.11)
Explained1.01
(0.16)
1.15
(0.08)
Unexplained1.13
(0.20)
1.25 *
(0.11)
Endowments1.01
(0.39)
1.13
(0.101)
Coefficients1.10
(0.27)
1.23
(0.11)
Interaction1.03
(0.36)
1.03
(0.10)
Legend: * p < 0.05; ** p < 0.01; *** p < 0.001. Robust standard errors in brackets.
Table 5. Factors influencing bean productivity among smallholder farmers in Tanzania.
OLSOaxaca-BlinderOaxaca Re-Centered Influence Functions
Q25Q50Q75
VariableCoefficientsExplainedUnexplainedExplainedUnexplainedExplainedUnexplainedExplainedUnexplained
Age0.022 **
(0.007)
−0.045 *
(0.027)
−2 **
(0.781)
0.054 **
(0.031)
0.935
(1.914)
0.052 **
(0.028)
1.56
(1.326)
0.047 *
(0.026)
0.916
(1.275)
Age squared−0.001 *
(0.001)
−0.004
(0.017)
0.677 **
(0.335)
0.045
(0.047)
0.094
(0.842)
0.077
(0.05)
−0.134
(0.444)
0.098
(0.06)
−0.321
(0.511)
Sex (b = female): Male0.202 *
(0.091)
------
Married0.130
(0.083)
0.003
(0.006)
−0.003
(0.088)
0.011
(0.01)
−0.079
(0.254)
0.016
(0.012)
0.184
(0.24)
0.009
(0.01)
0.04
(0.255)
Family size0.051
(0.028)
0.016
(0.012)
−0.192
(0.14)
−0.008
(0.011)
−0.004
(0.464)
−0.033 **
(0.017)
0.2
(0.412)
−0.036 *
(0.019)
0.149
(0.418)
Region (b = Mbeya): Iringa−0.033
(0.110)
−0.001
(0.009)
0.078
(0.172)
−0.007
(0.008)
0.105
(0.569)
−0.003
(0.005)
−0.028
(0.521)
−0.006
(0.007)
0.02
(0.614)
Rukwa0.105
(0.142)
Ruvuma−0.331 **
(0.123)
Years spent schooling0.033
(0.018)
−0.006
(0.007)
−0.059
(0.242)
0.038
(0.023)
−0.309
(1.037)
0.047 **
(0.024)
0.731
(0.7)
0.032 *
(0.017)
0.206
(0.592)
Attended training on bean production (b = No): Yes0.459 **
(0.139)
−0.003
(0.015)
0.022
(0.03)
0.012
(0.008)
0.056
(0.048)
0.009
(0.007)
0.007
(0.073)
0.005
(0.006)
−0.035
(0.09)
Discussed variety to plant (b = No): Yes0.163
(0.106)
−0.001
(0.004)
−0.03
(0.065)
−0.002
(0.003)
0.145
(0.18)
−0.001
(0.006)
0.184
(0.142)
0.002
(0.016)
−0.105
(0.152)
Uses of revenue from beans (b = No defined use): Purchased cattle−0.292
(0.270)
0.007
(0.019)
0.174
(0.144)
−0.002
(0.009)
−0.007
(0.271)
−0.058 **
(0.029)
−0.212
(0.291)
−0.029
(0.019)
0.172
(0.384)
Purchased sheep/goat/pigs−0.475
(0.474)
Purchased chicken/rabbits−0.776
(0.812)
Purchased farm equipment−0.351
(0.214)
Purchased land0.079
(0.391)
Rented land1.145 *
(0.478)
Purchased food−0.496 **
(0.185)
Purchased household items (e.g., appliances, kitchenware, furniture, radios, etc.)−0.409 **
(0.152)
Spent on non-food items (clothing, school supplies)−0.423 ***
(0.121)
Spent on health/medical care−0.320
(0.219)
Spent on social obligations (burial, entertainment, group fee/church functions)−0.2057
(0.3018)
Were beans sold (b = No): Yes0.3984 **
(0.1264)
0.004
(0.02)
−0.164
(0.21)
0.026
(0.023)
0.151
(0.398)
−0.019
(0.02)
−0.161
(0.552)
0.046
(0.038)
0.383
(0.458)
Plot size under beans (acres)−0.290 ***
(0.0345)
−0.045
(0.03)
−0.002
(0.129)
−0.011
(0.023)
0.121
(0.337)
−0.0111
(0.023)
0.018
(0.528)
−0.013
(0.026)
−0.096
(0.33)
Belong to a farmer’s organization (b = No) > Yes0.1473
(0.0825)
0.004
(0.007)
−0.071
(0.075)
−0.001
(0.009)
0.042
(0.212)
−0.000
(0.001)
0.091
(0.256)
−0.001
(0.001)
0.083
(0.263)
Distance to tarmac road (Km)−0.0023 **
(0.0008)
0.022
(0.014)
−0.043
(0.038)
0.01
(0.009)
0.016
(0.121)
−0.013
(0.01)
0.05
(0.101)
−0.032
(0.013)
−0.049
(0.074)
Planted improved bean variety (b = No): Yes−0.0122
(0.0866)
0.001
(0.003)
−0.037
(0.061)
0.001
(0.007)
−0.178
(0.156)
−0.003
(0.008)
0.046
(0.156)
−0.025
(0.022)
−0.002
(0.166)
Income from sales of beans (Tzsh)0.0000 ***
(0.001)
0.111
(0.032)
−0.075
(0.088)
−0.028(
0.028)
−0.08
(0.306)
−0.091
(0.083)
0.206
(0.358)
−0.122
(0.11)
0.316
(0.357)
Natural log of income from sales of beans0.0558 ***
(0.0125)
0.044
(0.034)
0.101
(0.286)
0.047
(0.06)
0.26
(0.643)
0.051
(0.064)
0.269
(0.815)
−0.020
(0.027)
−0.871
(0.733)
Worried about getting enough food in last four weeks−0.2898
(0.1487)
0.004
(0.008)
−0.002
(0.0272)
−0.01
(0.011)
−0.087
(0.096)
−0.005
(0.006)
−0.042
(0.071)
−0.002
(0.004)
−0.016
(0.06)
_Cons3.6445 ***
(0.3113)
1.814
(0.75)
−0.179
(1.281)
−3.160 **
(1.562)
−0.756
(1.622)
R-squared0.3864
Number of observations447
Legend: * p < 0.05; ** p < 0.01; *** p < 0.001. Robust standard errors in brackets.
Publisher’s Note: MDPI stays neutral with regard to jurisdictional claims in published maps and institutional affiliations.

