Abstract
Comfort in public spaces is essential to their attractiveness and continued role in improving human quality of life. Acceptable thermal conditions are determinant to ensuring users’ comfort. This study undertakes an assessment of three urban sites in Arouca, in the north of Portugal, using ENVI-met software. Simulations test the influence of pavement and façade covering material, vegetation, and site morphology. The climate of the region is classified as Mediterranean Csb, with rainy winters and dry and mildly warm summers. A typical summer day is considered. The results reveal that a combination of factors might lead to thermal discomfort even in this mild climate on an average day, mainly due to heat exchange by radiation. In addition, the impact of alterations to surface properties depends on the morphological characteristics of the site, e.g., high albedo of the pavement may lead to a decrease or an increase in mean radiant temperature, depending on the space. This variability is present in the effects observed at the studied sites. A high façade albedo always contributes, in these cases, to thermal discomfort. The conclusions of the present study highlight the importance of performing a specific study for each urban site whenever an intervention is to be planned.
1. Introduction
With almost 70% of the global population projected to live in cities by 2050 [1,2,3], as well as the major role cities play as both energy consumers and carbon emitters, it is not surprising that the urban scale, from the block to the entire city, is subjected to increasing scrutiny in discussions of responsive design for future built environments [3,4].
With the growing frequency and intensity of heatwaves, strategies to improve the resilience of cities are becoming more vital [5,6]. Warmer urban scenarios can significantly affect livability, meaning that the adaptation of the built environment to the predicted warmer climates of the future is essential to urban public health agendas [7,8].
The impacts and consequences of climate change are numerous. Extreme temperatures elicit special concern; combined with the formation of “heat islands” in urban areas, these phenomena have a serious impact on the thermal conditions of affected environments, jeopardizing occupants’ thermal comfort [9]. Microclimate change affects the whole environment of cities and therefore their citizens’ well-being. Thus, when working within a framework dedicated to the challenges of urban resilience, it is important to guarantee thermally comfortable conditions to outdoor dwellers [5,6,7,10,11].
The thermal comfort of buildings has long been a subject of concern and study. However, public spaces are also places of permanence with an important role in human social life. Therefore, they must likewise be taken into account both when planning future public spaces and when restructuring existing ones, especially in compact urban areas, in order to avoid unplanned urban growth and mitigate the negative effects of climate change [12]. It is essential to guarantee the necessary microclimate conditions to ensure the well-being and thermal comfort of potential public space users, which in turn guarantees that these spaces can be occupied and avoid becoming unusable.
Based on the assumption that “the materials, geometry and surface properties of structures around a given place modify the climate and the local environment” [13,14,15,16,17,18,19], understanding the extent to which these factors are determinant becomes an important goal. Since the 1970s, the physical characteristics of urban space, the urban form and its geometry—specifically the design and layout of buildings and places—have been discussed as impactful agents towards populations and their daily lives [20,21,22,23,24,25,26]. The microclimate of a given outdoor space is also determined by other morphological characteristics, such as orientation; height/width ratio; the presence or absence of water elements, shading elements, or vegetation; and by other factors that influence climate, such as latitude, altitude, topography, solar radiation, or dominant winds [27,28,29,30]. It should be kept in mind that these morphological characteristics and factors work in tandem [31]. Ideally, their complex combinations should not result in adverse conditions that compromise permanence or visits to certain spaces in urban areas.
The adaptation of the built environment constitutes a challenge, especially in compact urban areas, seeing that their environment is already defined and there are fewer opportunities for intervention. Adaptation to increasing heat stress due to climate change is an emerging agenda that should be encouraged and driven by policymakers [6,32]. However, for this agenda to be adopted, it is of utmost importance to characterize the existing conditions, to identify all the intervening factors, and to study in depth how they influence the urban climate and how they interact with each other.
2. The Urban Climate
The climate of a town is closely associated with the characteristics of its urban space [5,7,20,33]. The roughness of the urban fabric, its occupation levels, and the thermal characteristics of the constituent materials are some of the parameters that influence and characterize the climate of a given location. Thus, it is expected that the climatic conditions of an urban area will be different from the climatic conditions of adjacent rural areas. The approach to climatology in urban areas depends on the scale of the physical space to which it refers [5,7].
The different urban scales represented in Figure 1 can be differentiated through the magnitude of their extent. Extents of tens of kilometers are associated with the concept of mesoclimate (scales “a” and “b” represented in Figure 1), whereas the concept of microclimate is applied to extents of a few hundred meters (scales “c,” “d,” and “e”) [33].
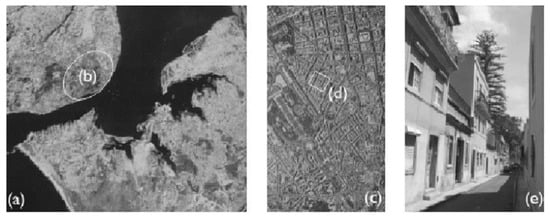
Figure 1.
Urban scales: (a) metropolitan area, (b) city, (c) neighborhood, (d) block, and (e) street. Source: [33].
The climate of a single outdoor public space is part of the microclimate concept, which can be defined as the climate of the air layer adjacent to the Earth’s surface in small places and well-defined areas of potentially intense confinement, such as streets, squares, or gardens [34].
Impervious surfaces, together with buildings that retain thermal heat, significantly affect the local microclimate and existing natural features. The urban design process ought to focus on new building design strategies and construction methods that minimize the deleterious environmental effects of urban infrastructures while improving the inhabitants’ social, health, and well-being status [22,35,36].
The urban heat island, an increase in temperature compared to the rural surrounding areas, is an anthropogenic phenomenon that affects urban outdoor thermal comfort conditions. It is more pronounced in urban canyons, characterized by a low sky view factor, with short-wave and long-wave solar radiation affecting construction surfaces to the point of producing massive outdoor local overheating [37].
In a study of the outdoor thermal comfort of a university campus in Rome, it is stated that, for what concerns pedestrians, an increase in mean radiant temperature is also important, as it sometimes reaches 40 °C [38], even when air temperature is considerably lower. This shows that outdoor comfort is complex and depends on numerous factors that need to be addressed.
3. Thermal Comfort in Outdoor Public Spaces
Since the early 2000s, urban outdoor thermal conditions for city inhabitants have received increased attention as a new field of research. The effects of changes in ecosystems challenge urban planners who aim to create successful and usable outdoor spaces. Among the determining factors of outdoor environment quality, higher priority is given to the thermal environment [5,7,39]. Public spaces play a very important role in current society: These spaces allow for coexistence, diverse physical and entertainment activities, and support for all other activities. The quality of public spaces and their use by citizens is strongly related to the conditions that the space offers, both at visual, functional, and comfort levels. Gehl stated that people choose to remain in a place that is beautiful and considerably pleasant [40]. Consequences of urban warming include health threats to the physical and mental well-being of humans [11]. The management of urban energy flows (supply, demand, and the balance between them) is no longer sufficient; nowadays, it must be supplemented and measured against new criteria for urban environmental quality, health, and well-being (e.g., thermal and visual comfort, or contact with nature) [4].
In what concerns outdoor thermal comfort, it must be emphasized that it is quite different from indoor thermal comfort. People tend to accept a wider range of thermal conditions when outdoors, as they cannot control the factors that determine the thermal qualities of the outdoor space. Furthermore, people have different perceptions and requirements depending on the climate conditions that they are used to. An additional difference between indoor and outdoor environments concerns the period of exposure: We tend to spend most of our time inside buildings and fewer hours in open spaces, especially during certain seasons [41]. A study [42] demonstrated that in the United States and Canada, people spend an average of 2 to 4% of their time in outdoor spaces during the winter, as opposed to 10% in summertime. Even climates such as the Mediterranean, where it can be assumed that exposure times are higher, do not allow the human body to reach a balance with the outdoor environment [41,43,44,45,46].
The comfort of outdoor public spaces is essential for them to be visited and used, which is only possible when materials—urban furniture included—meet the different needs of the citizens who pass through or stay there. These places must contribute to the improvement of quality of life, seeing that many of them ought to be places of rest and leisure. As mentioned by Gaitani, the degree and intensity of activities carried out in public spaces depend strongly on users’ levels of satisfaction or dissatisfaction about prevailing climatic conditions [47]. Regarding thermal comfort, the very configuration of urban spaces is known to directly influence it. The effect of multiple reflections between buildings increases the ability of a surface to absorb radiation, whereas the shading between buildings significantly reduces the solar radiation affecting façades [21,29,33,48,49,50]. In addition to ensuring comfort, it is important that public spaces be up to par regarding their visual and functional aspects.
Preparing a preliminary study in the context of thermal comfort for outdoor spaces is essential in order to lay the foundation for a better understanding of the use of space and outdoor activities. A space can only be comfortable if it takes thermal comfort parameters into account [5,7,51].
For an adequate conception of urban spaces, it is necessary to identify factors upon which the designer can intervene, in order to create more pleasant spaces and obtain better conditions for a sustainable environment [52]. The basic morphological elements that determine the microclimate of a given space are its orientation, height/width ratio, dominant colors, typology of the public space, water elements, shading devices, covering materials, and vegetation. Spatial distribution of temperature is strictly influenced by the urban morphology patterns. In fact, the highest values are observed in spaces where the sky-view factor and incoming global solar radiation assume higher values [11]. In [12], the influence of morphology on the patterns and speed of wind was highlighted. Orientation is also relevant. Singular east-west and north-south and linear east-west and north-south urban forms were analyzed for the hottest day ever in the temperate climate of the Netherlands (with a maximum air temperature of 33 °C) and it was found that the north-south orientation provided a cooler climate than the east-west orientation for the same sky-view factor [25]. However, the selection of preferable orientation is difficult, particularly in temperate climates, where a trade-off between hot and cold season performance is required [24].
A study carried out in a historical district of Rome, where urban canyon represents the most common urban morphology, stated that thermal comfort conditions for pedestrians can be compromised due to multiple reflections and short-wave radiation [37].
The use of reflective materials (high albedo) in outdoor public spaces has been considered in numerous recent studies and their heat mitigation potential evaluated. However, some care must be taken in their use, since this effect also depends on other morphological characteristics and may turn out to be inefficient or even harmful.
For open spaces such as parks, the use of cool materials proved to be beneficial. In a study undertaken in a park in Athens, Greece [53], the use of cool paving materials was evaluated. The global solar reflectance of the selected material was determined to be close to 60%, whereas the corresponding reflectivity values in the visible and infrared parts of the spectrum were 47% and 71%, respectively. The measured emissivity was approximately 0.9. It was estimated that the use of cool paving materials contributed to the reduction in peak ambient temperature during a typical summer day by up to 1.9 K. Furthermore, the surface temperature of the park decreased by 12 K, and comfort conditions improved considerably [53].
When uneven building heights are present, some care must be taken with reflective roofing materials due to their interaction with the surrounding buildings [54,55].
Yang stated that “thermal interactions between pavements and nearby objects needs special attention if reflective materials are to be used” [56]. The interaction may not present a large risk in open areas, but it becomes more serious in high-density urban centers, where walls are close to pavements and thus subjected to more heating by the solar radiation reflected by adjacent pavements. It is expected that thermal interactions depend on various factors, such as pavement area, distance between walls and pavements, and thermal properties of walls and pavements [56]. There is a lack of studies on building–pavement–atmosphere interactions at fine scales (building to neighborhood), which calls for future research along this line [17,56]. With high albedo, reflective materials redirect more radiation and reduce surface temperatures, which in turn leads to lower air temperatures. However, reflected solar radiation can increase the temperature of the surrounding built environment. Caution needs to be exercised by city planners and policymakers regarding the large-scale deployment of reflective materials [12,56].
Although reflective materials applied to pavements, depending on morphology, can lead sometimes to favorable effects, their application on the vertical surfaces of narrow canyons leads mostly to deleterious effects [17,18,37].
A common way to assess outdoor comfort is the estimation of comfort indices. Several indices have been proposed and used for the assessment of outdoor thermal comfort, such as PET (physiological equivalent temperature), OUT-SET (outdoor standard effective temperature), TEP (temperature of equivalent perception), and UTCI (universal thermal climate index) [57,58,59,60,61,62,63,64,65]. Various studies related to outdoor thermal indices in urban Mediterranean environments have been developed [66,67,68,69]. Among them, Pantavou et al. [69] performed an empirical calibration of outdoor thermal indices in an urban outdoor environment in a Mediterranean climate in order to provide better simulations of thermal sensation votes.
As mentioned before, people have different perceptions and requirements depending on the climate conditions they are used to. Therefore, comfort indices should be adapted to the climate of the region where they are meant to be applied. In [41], a new comfort index was proposed, the MOCI (Mediterranean outdoor comfort index), which is based on the ASHRAE 7-point scale; it predicts the mean value of the votes likely to be given by Mediterranean people regarding the thermal qualities of an outdoor environment. The MOCI is estimated as follows:
where WS is the wind speed, RH is relative humidity, MRT is mean radiant temperature, TA is the air temperature, and ICL is the thermal insulation of clothing. The MOCI comfort values range from −0.5 to +0.5.
To conduct studies on outdoor thermal comfort, a reliable software is needed. The use of numerical simulation tools to evaluate local microclimate has highly increased [37]. ENVI-met is by far the most commonly used software to assess local thermal comfort conditions. Many researchers have used ENVI-met [5,11,12,19,25,26,37,38,62], a validated microclimatic simulation software that calculates the variables needed for different outdoor thermal comfort indices.
This software is a state-of-the-art, three-dimensional microclimate modeling program that facilitates the understanding and quantifying of existing interactions between the local built environment and its microclimate. This tool establishes a link between the theory of bioclimatic urban design and its practical application, with credible results, as its validity has been confirmed by its application in controlled areas. For this reason, the software is widely used in this research field.
Some drawbacks to ENVI-met can be pointed out, though. Due to their complexity, the considerable time needed for running simulations using Envi-met usually requires focusing only on a certain typical day of the year. An overestimation of the mean radiant temperature in some situations is also reported in the literature. However, this last issue does not hinder comparative studies.
4. Goals and Scope
From the literature review, it becomes clear that the evaluation of the microclimate of an outdoor public urban space is a complex task involving many factors that have an important influence on thermal conditions and that interact with each other in such a way that they often lead to results that are somewhat surprising and opposite to what was expected. Case studies are useful to deepen the understanding of the phenomena.
This study aims to analyze the influence of certain factors of the urban fabric, such as the albedo and the emissivity of surface materials, the presence or absence of vegetation, and the morphology of urban sites. For this purpose, it identifies tendencies and compares the thermal conditions of three different sites in the same urban area on a typical summer day at 12:00 (noon). The main goal was to test several changes to the current conditions of the sites and determine how their morphological characteristics influence the effect of those changes according to the following questions: (1) How do the selected factors influence outdoor thermal conditions? (2) How do the thermal conditions of the three sites compare? (3) Are there uncomfortable situations due to overheating, in spite of the mild weather conditions of that typical day? (4) What is (are) the main cause(s) of discomfort?
The selected sites present different morphological features. They are located in the same urban area and very close to each other, and thus subjected to the same global climatic conditions. Therefore, any differences in their thermal conditions are due to microclimate effects.
The location of the urban area has a mild climate. A typical summer day was selected for the assessment of thermal conditions. Therefore, if thermal discomfort is found one may conclude that, in a heat wave, discomfort will be even greater. In the face of climate change predictions for the Iberian Peninsula, where heat waves are predicted to become more frequent and intense, the present assessment may be used as a reference. An assessment of a future scenario with changed climatic conditions is not presented in this paper. The work went through the following steps:
- ▪
- Selection of three sites in the same urban area, in a location with a mild Mediterranean climate;
- ▪
- Characterization of the relevant characteristics of the selected sites;
- ▪
- Modeling of the sites using ENVI-met;
- ▪
- Simulation of five different scenarios for each site;
- ▪
- Analysis and discussion of results, identifying the influence of the following factors: emissivity and albedo of the pavement, albedo of the façades, presence or absence of vegetation, and site morphology;
- ▪
- Estimation of the MOCI index, proposed for the Mediterranean climate in [41]; and
- ▪
- Conclusions.
5. Materials and Methods
5.1. The Location and Its Climate
The studied sites are located in the village of Arouca (latitude = 40.92, longitude = −8.26, altitude = 270 m), which is part of the Porto Metropolitan Area and located in the north of mainland Portugal. According to the Koppen classification, the region possesses a Mediterranean Csb climate, with rainy winters and dry and mildly warm summers. Figure 2 shows the normal climate values for air temperature for the Porto Metropolitan Area, and Figure 3 presents the Wind Rose of Arouca.
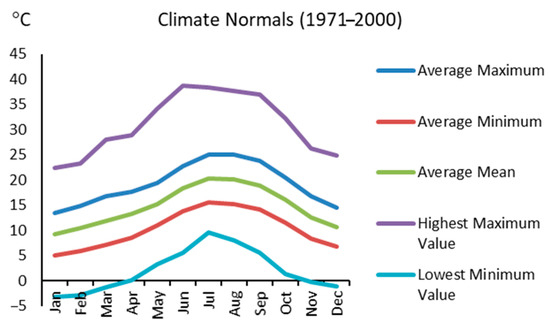
Figure 2.
Air temperature values for the Porto Metropolitan Area. Source of data: IPMA [70].
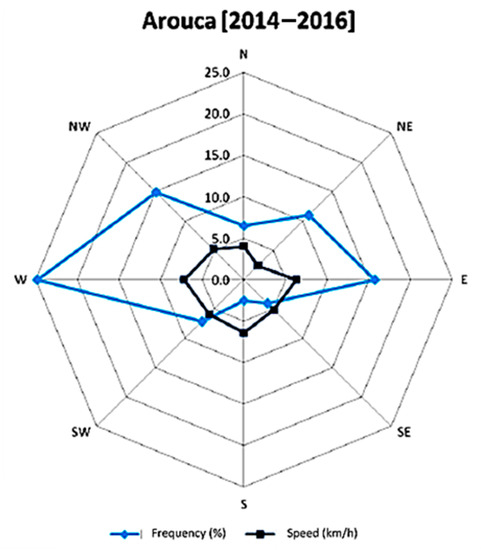
Figure 3.
Wind Rose of Arouca. Source of data: IPMA [70].
5.2. Selected Sites
Three different sites were selected. Their aerial view is shown in Figure 4.
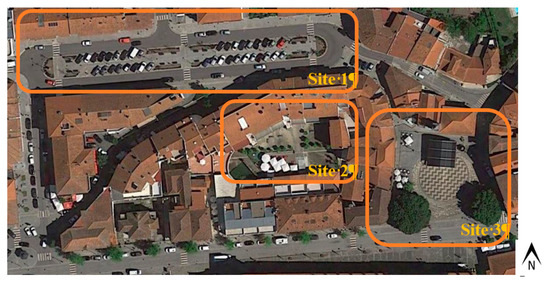
Figure 4.
Aerial view of the selected study sites, in the village of Arouca. Source: Google Earth.
Site 1 (3625 m2 of area) is D. Domingos de Pinho Brandão Avenue, which will be referred to as “Alameda” (Figure 5). It is characterized by its high affluence, due to the diversity of shops and services, and constitutes a place of transition to other places of higher attractiveness. It has a west-east canyon configuration. It sports pedestrian sidewalks built of cement mortar and an asphalt paved road along its entire length, a central area for car parking paved with granite cubes, as well as small green leisure areas that include urban furniture (benches) and some medium-sized deciduous trees. The buildings along both sides of Alameda have a ground floor plus two stories (total height of approximately 9.0 m). Façades are mainly rendered and painted. The percentage of glazing is 55% on average. The ratio H/W (height of the buildings/width between façades) is 0.36.
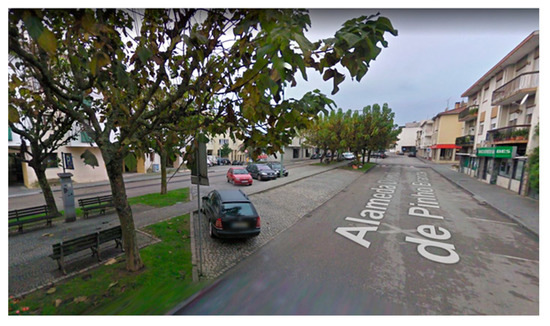
Figure 5.
D. Domingos de Pinho Brandão Avenue, known as “Alameda.” Source: Google Earth.
It is important to mention that there is constant car circulation, although at reduced speeds, a factor that increases the concentration of pollutants and impacts thermal conditions.
Site 2 (905 m2 of area) is Laranjeiras Square, a public space reserved for pedestrian access only (Figure 6) and configured like a courtyard. It is surrounded by three-story buildings (ground floor plus two), paved with light-tone granite, and possesses some urban furniture (benches) and small orange trees. The façades are rendered and painted and their percentage of glazed area is 55% on average. Since this site has an irregular shape, its H/W ratio varies from 0.4 to 0.6.
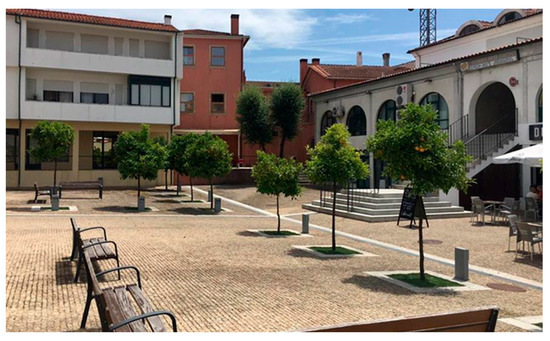
Figure 6.
Laranjeiras Square.
Site 3 (circa 1800 m2 of area) is Brandão de Vasconcelos Square, the central square of the village (Figure 7), where the main events and shows of the municipality take place. Adjacent to the convent, this square includes several cafés and terraces. It is also characterized as a place for both pedestrian and car traffic, and considered one of the main tourist spots and living spaces of Arouca. This square is paved mainly with granite. The buildings around the square have an average height of 9 m, their façades are mostly rendered and painted, and the percentage of glazed area is 55% on average. The H/W ratio varies from 0.18 to 0.23. There are two large trees on each side of the widest part of the square and three others of much smaller size.
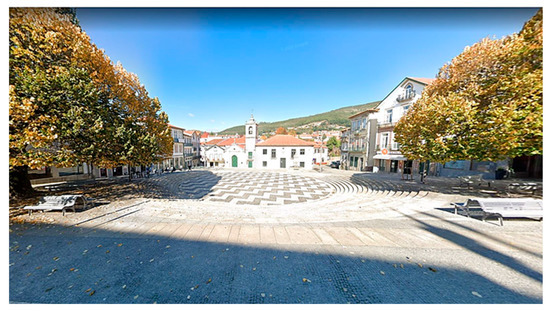
Figure 7.
Brandão de Vasconcelos Square. Source: Google Earth.
5.3. Microclimate Simulations
The sites were modeled using ENVI-met, as shown in Figure 8.
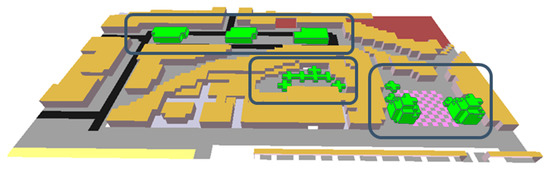
Figure 8.
3D model of the urban area, including the three studied sites.
The microclimate variables chosen for analysis were those that directly affect and influence how human beings feel and perceive thermal comfort:
- -
- Air temperature;
- -
- Mean radiant temperature;
- -
- Direct solar irradiance;
- -
- Wind speed; and
- -
- Relative humidity.
Since thermal comfort is the focus of the analysis, the simulations correspond to a typical summer day, as it is in this season that public spaces assume greater importance, with a greater number of people preferring to stay outdoors. Their importance naturally decreases in winter due to adverse climate conditions, with people spending less time in public spaces, using them mainly to circulate from one building to another. However, it should be kept in mind that the most efficient strategies for improving urban microclimates in the summer season should not become inconveniences in winter.
The results of this research are mainly comparative between the different conditions obtained with the variations of the chosen parameters, thus highlighting trends and possible orders of magnitude.
Initially, as previously mentioned, a day considered representative of the summer season was chosen and repeated for all simulations. The choice of a time period for the analysis of results also reinforces the idea of a comparative analysis between obtained results, since, for different hours of the day, the quantitative analysis may not always be linear.
Thus, the results presented all correspond to noon of 23 June 2017, characterizing a summer day at a time when the sun is high and solar irradiance is intense. Since the west wind is the most prevalent in the area, this was the wind direction considered in the simulations. The software used provides hourly results. In this way, the behavior of the variables under analysis throughout the day could better be understood, as it was possible to directly connect the results to the solar trajectory.
For the three studied sites, the following three characteristics were chosen as the variables with the most influence on outdoor space comfort:
- -
- Properties of pavement-covering materials;
- -
- Properties of façade-covering materials; and
- -
- Presence of vegetation.
Combining these characteristics, a number of scenarios was determined. Table 1 presents the main assumptions for each of these scenarios. Scenario 1 corresponds to the current situation, in other words, the characteristics of the study areas exactly as they are. The values of the physical properties used for the pavement and for the façades were extended to the total area of these elements, i.e., a weighted average was estimated in function of the heterogeneity of each surface and applied to the whole pavement and to all the façades. The remaining scenarios were simulated, with Table 1 showing the changes imposed on the current situation—this means that changes from scenario 2 to scenario 5 were not cumulative. In scenario 2, an increase in pavement emissivity, or pavement albedo, was tested. In scenarios 3 and 4, the surface properties of the surrounding façades were altered to high albedo and transparency, respectively. Scenario 4 was tested as an extreme theoretical situation, in which solar radiation is transmitted almost totally to the inside of the buildings, something which is obviously not recommended if indoor thermal comfort is to be retained. Finally, in scenario 5, the physical properties of surfaces were kept as they currently are and the removal of vegetation was simulated instead.

Table 1.
Scenarios considered in the simulations.
In the following section, the results of these simulations are presented graphically, using a scale of colors. It should be noted that this scale does not correspond always to the same ranges of values, so the reader must pay attention to the corresponding values when comparing graphs.
6. Presentation and Discussion of Results
6.1. Influence of the Emissivity and Albedo of Pavements—Scenario 2 Versus Scenario 1
Figure 9 and Figure 10 show the results (scenarios 1 and 2) pertaining to air temperature and mean radiant temperature for the Alameda site, obtained with the use of ENVI-met. In scenario 2, as shown in Table 1, the albedo of the pavement was the same as scenario 1, although its emissivity was higher.
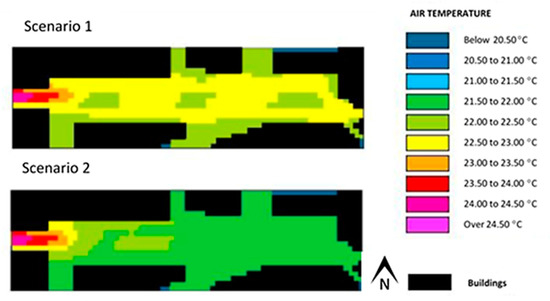
Figure 9.
Air temperature for scenarios 1 and 2, at the Alameda site.
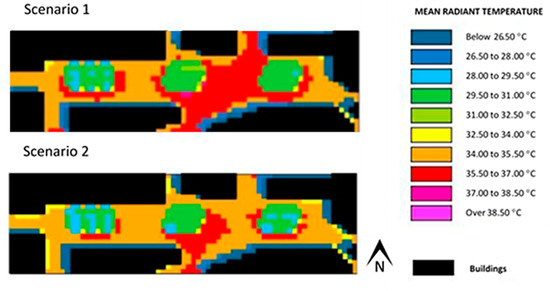
Figure 10.
Mean radiant temperature for scenarios 1 and 2, at the Alameda site.
Figure 11 and Figure 12 provide results pertaining to air temperature and mean radiant temperature for the Laranjeiras site, also according to scenarios 1 and 2. In scenario 2, the albedo of the pavement increased from 0.40 to 0.80.
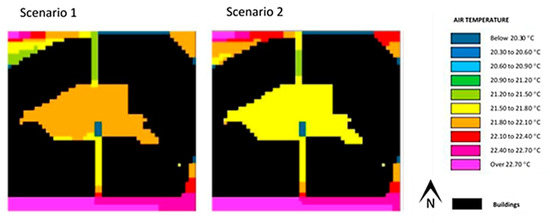
Figure 11.
Air temperature for scenarios 1 and 2, at the Laranjeiras site.
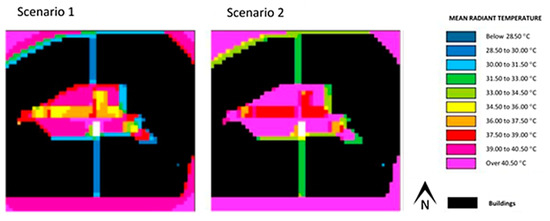
Figure 12.
Mean radiant temperature for scenarios 1 and 2, at the Laranjeiras site.
Figure 13 and Figure 14 present the results of air temperature and mean radiant temperature at the Brandão de Vasconcelos site, according to scenarios 1 and 2. In scenario 2, the albedo of the pavement increased from 0.30 to 0.80, and its emissivity from 0.90 to 0.95.
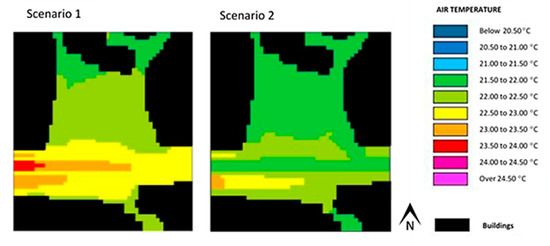
Figure 13.
Air temperature for scenarios 1 and 2, at the Brandão de Vasconcelos site.
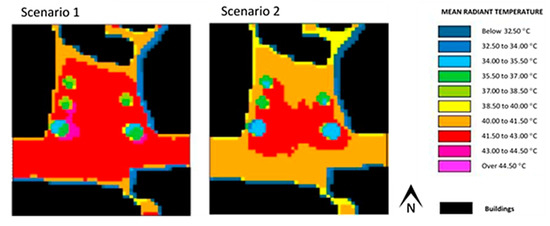
Figure 14.
Mean radiant temperature for scenarios 1 and 2, at the Brandão de Vasconcelos site.
Comparing the results of the three sites, in scenario 1 (real conditions) air temperature was slightly lower at Laranjeiras than at other sites. Mean radiant temperature reached its highest peak at Brandão de Vasconcelos, followed by Laranjeiras.
At the Alameda site, in scenario 2, the increase in pavement emissivity led to a reduction in both air temperature and mean radiant temperature.
At the Laranjeiras site, in scenario 2, an increase in pavement albedo caused a slight reduction in air temperature, but also a significant increase in mean radiant temperature. The solar radiation reflected by the pavement would strike the surrounding façades, which would partly reflect and partly absorb it. These exchanges, in a smaller and more confined space, may contribute to an uncomfortable mean radiant temperature.
At the Brandão de Vasconcelos site, in scenario 2, the simultaneous increase in pavement emissivity and albedo gave rise to a significant reduction in air temperature (2 °C less in certain zones of the square). Mean radiant temperature also decreased in most of the space, remaining nevertheless quite high, in particular at the center of the square.
The presented results were expected. However, since a high variability of the effects of the implemented changes was found in the related literature, depending on the area, shape, and H/W ratio of each site, some variation could have occurred.
6.2. Influence of the Albedo of the Façades—Scenarios 3 and 4 Versus Scenario 1
Figure 15 and Figure 16 show the results for air temperature and mean radiant temperature at the Alameda site in scenarios 3 and 4 compared to scenario 1. As shown in Table 1, in scenario 3 the albedo of the surrounding façades increased from 0.30 to 0.70; in scenario 4, the façades were transparent, transmitting a great part of solar radiation directly indoors, with their albedo equal to 0.05.
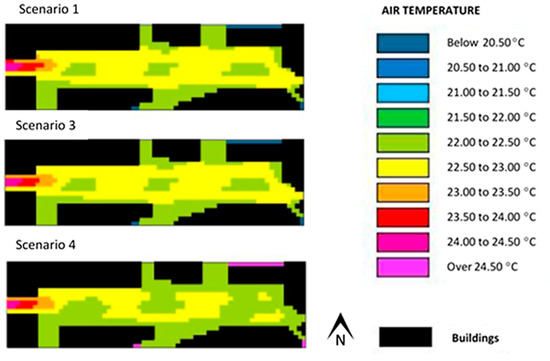
Figure 15.
Air temperature for scenarios 1, 3 and 4, at the Alameda site.
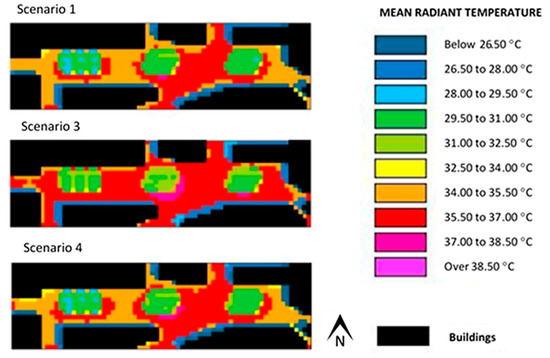
Figure 16.
Mean radiant temperature for scenarios 1, 3 and 4, at the Alameda site.
Figure 17 and Figure 18 present the results for air temperature and mean radiant temperature at the Laranjeiras site for scenarios 3 and 4 compared to scenario 1.
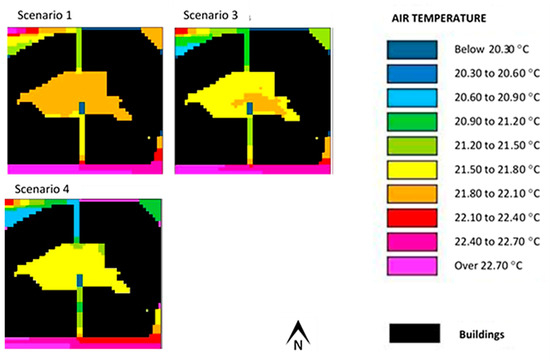
Figure 17.
Air temperature for scenarios 1, 3 and 4, at the Laranjeiras site.
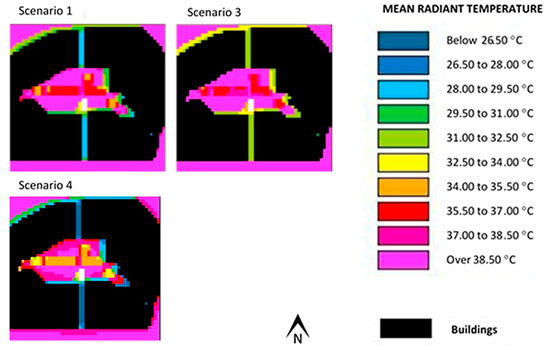
Figure 18.
Mean radiant temperature for scenarios 1, 3 and 4, at the Laranjeiras site.
Figure 19 and Figure 20 provide the results for air temperature and mean radiant temperature pertaining to the Brandão de Vasconcelos site for scenarios 3 and 4 compared to scenario 1.
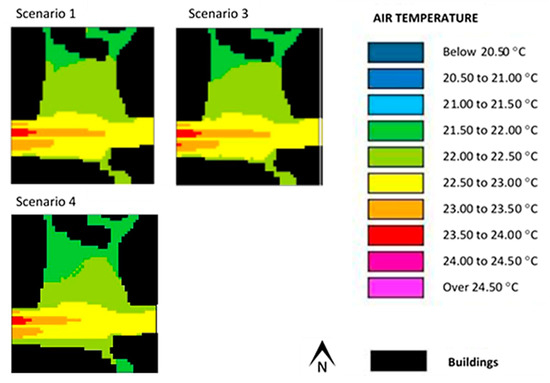
Figure 19.
Air temperature for scenarios 1, 3 and 4, at the Brandão de Vasconcelos site.
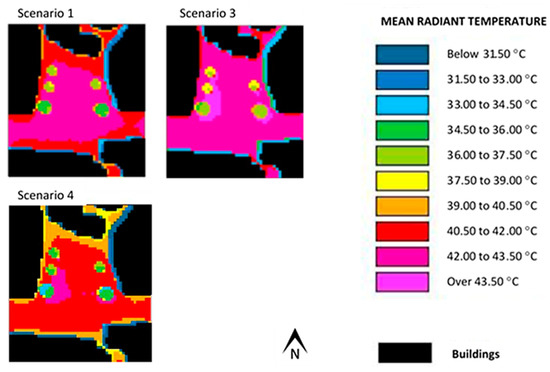
Figure 20.
Mean radiant temperature for scenarios 1, 3 and 4, at the Brandão de Vasconcelos site.
At the Alameda site in scenario 3, the albedo of the surrounding façades changed from 0.30 to 0.70, leading to a very small reduction in air temperature in zones close to building façades. On the contrary, mean radiant temperature increased significantly. The fact that solar radiation was reflected to a greater extend by façades increased the amount of solar radiation reaching the pavement, which in turn stored it and became hotter. Another tested simulation of the same scenario, with a non-absorbent road covering, led to a reduction in the mean radiant temperature.
In scenario 4, air temperature was slightly reduced in certain zones of the Alameda site compared to current conditions, but the mean radiant temperature remained very similar to the original one.
At the Laranjeiras site, scenario 3 caused a slight reduction in air temperature. The mean radiant temperature became higher, but this effect was less expressive than at the Alameda site. It must be noted that the pavement albedo of Laranjeiras Square was higher than Alameda’s, and thus incapable of storing as much reflected radiation. In scenario 4, both the air temperature and the mean radiant temperature decreased at Laranjeiras Square.
At the Brandão de Vasconcelos site in scenario 3, the air temperature was just very slightly reduced in a small zone near the buildings façades, whereas the mean radiant temperature increased. For this site in scenario 4, there was a slight reduction in air temperature at the narrowest zone of the square, and also a small reduction in mean radiant temperature.
It must be highlighted that in a large square such as this one, with surrounding buildings that are not very high in relation to the square’s dimensions, the surface characteristics of the pavement are much more influential to the microclimate than the characteristics of façades coverings, especially at the center of the space.
It is important to call attention to the fact that scenario 4 is a theoretical scenario, used in order to evaluate the possibility of drastically reducing the effect of the façade-covering materials on the site’s microclimate. In fact, if 95% of solar radiation is lost to the inside of the buildings and only 5% is reflected back to the outdoor space, it means that these façades are the ones that contribute the least to the overheating of the outdoor space. The results for scenario 4 may be used as a theoretical threshold for comparison, but obviously its implementation in practice is not recommended.
6.3. Influence of the Presence of Vegetation—Scenario 5 Versus Scenario 1
Figure 21, Figure 22 and Figure 23 show the results of direct solar irradiance, wind speed, and air temperature, respectively, for the Alameda site, juxtaposing scenarios 1 and 5.
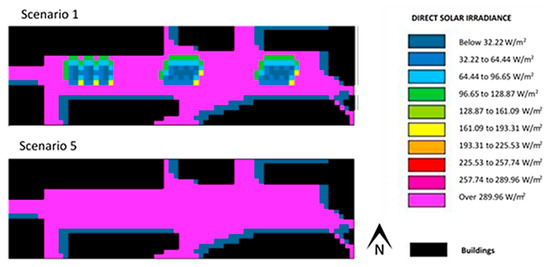
Figure 21.
Direct solar irradiance for scenarios 1 and 5, at the Alameda site.
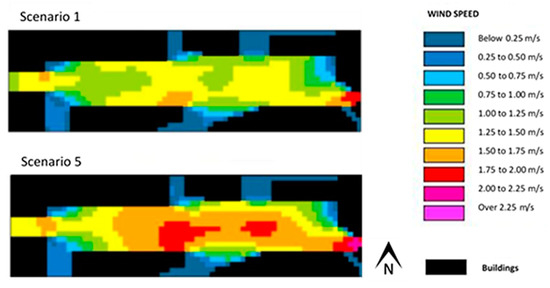
Figure 22.
Wind speed for scenarios 1 and 5, at the Alameda site.
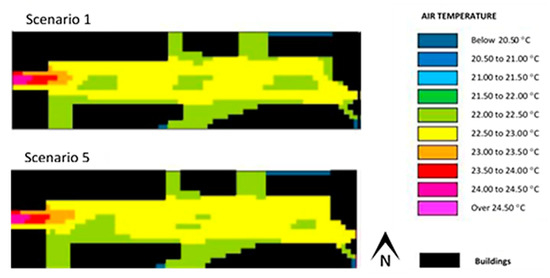
Figure 23.
Air temperature for scenarios 1 and 5, at the Alameda site.
Figure 24, Figure 25 and Figure 26 present the results for direct solar irradiance, wind speed, and air temperature, respectively, at the Laranjeiras site in scenarios 1 and 5.
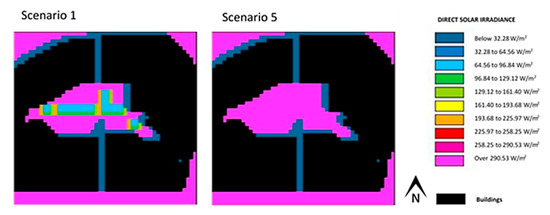
Figure 24.
Direct Solar Irradiance for scenarios 1 and 5, at the Laranjeiras site.
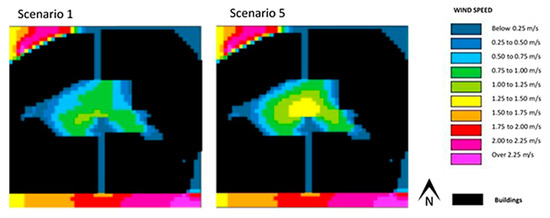
Figure 25.
Wind speed for scenarios 1 and 5, at the Laranjeiras site.
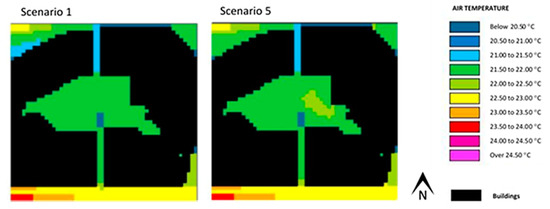
Figure 26.
Air temperature for scenarios 1 and 5, at the Laranjeiras site.
Figure 27, Figure 28 and Figure 29 provide the results for direct solar irradiance, wind speed, and air temperature, respectively, at the Brandão de Vasconcelos site in scenarios 1 and 5.
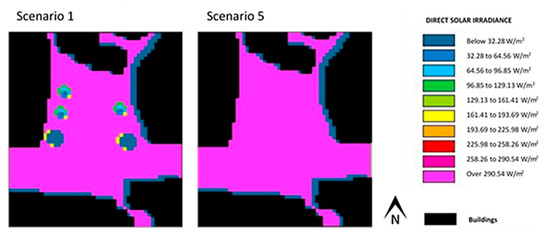
Figure 27.
Direct solar irradiance for scenarios 1 and 5, at the Brandão de Vasconcelos site.
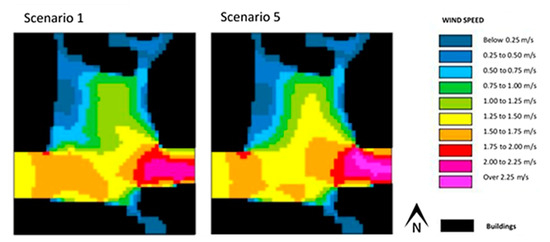
Figure 28.
Wind speed for scenarios 1 and 5, at the Brandão de Vasconcelos site.
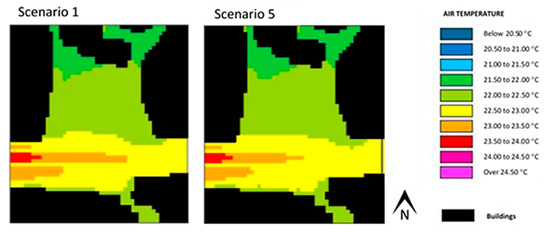
Figure 29.
Air temperature for scenarios 1 and 5, at the Brandão de Vasconcelos site.
As previously explained, the removal of existing vegetation was simulated in order to determine its original influence on the microclimate of the analyzed outdoor spaces. As expected, the removal of vegetation led to an increase in the amount of direct solar radiation reaching the pavement in every place where a tree existed before, at every site.
At the Alameda site, there was an increase in the mean radiant temperature when simulating scenario 5. However, there was also an increase in wind speed. For this reason, air temperature suffered only a very slight increase in areas that used to hold trees. Figure 30 also shows that relative humidity was lowered when trees were removed, as was expected. It must be also noted that this effect was extended to the whole area of the site; however, this did not show any influence on air temperature, which remained very much the same.
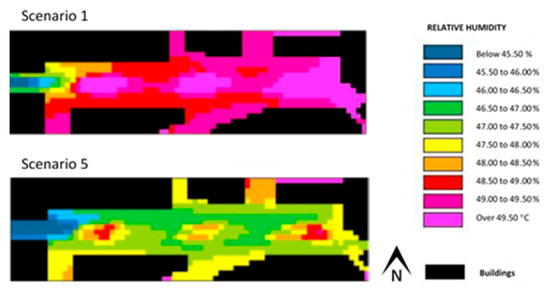
Figure 30.
Relative humidity for scenarios 1 and 5, at the Alameda site.
At the Laranjeiras site, besides the obvious increase in direct solar irradiance on the pavement caused by the removal of the trees, there was also an increase in wind speed, especially at the center of the square. Air temperature barely changed, with only a very slight increase in a small zone. However, it must be noted that existing trees are small in size, and as such their influence was not expected to be meaningful.
At the Brandão de Vasconcelos site, although two large trees and three smaller ones are currently present, the effect of their simulated removal was very similar to what occurred in other spaces. In fact, the green areas of any of the three studied sites are quite modest compared to the whole site area, and thus their influence was also modest.
6.4. Influence of the Site Morphology
As described in Section 5.2, the three studied sites differ in area, shape, and H/W ratio. The sky-view factor (SVF), which is defined as the ratio of the amount of sky that can be seen from a given point on a surface to that potentially available (i.e., the sky hemisphere subtended by a horizontal surface), depends on the height of the obstacles in the surroundings of the analyzed site and varies inversely to its H/W ratio. The mean values of albedo estimated for the current pavement of each site were also different. Table 2 summarizes these differences. The orientation of the studied sites can be seen in the figures previously presented, where the north is marked.
Table 2.
Morphological features.
The results for air temperature in scenario 1, representing the current situation, show some slight differences between the three sites. The values were very similar, with Laranjeiras having a slightly lower air temperature, matching its lower SVF. However, there was a higher spatial variation of air temperature at Brandão de Vasconcelos Square, which is more open and presents more variable and higher wind speed. At the Laranjeiras site air temperature distribution was quite homogeneous, which is compatible with its shape and lower wind speed.
Mean radiant temperature was lower at Alameda than at Laranjeiras for the current scenario, in spite of their corresponding values of H/W and SVF potentially making one expect the opposite. This may be explained by the higher value of pavement albedo at Laranjeiras, which, as already mentioned before, may result in reflected radiation reaching the surrounding vertical surfaces and the subsequent heating of the latter.
As an open space with a low H/W ratio and a high SVF, the Brandão de Vasconcelos site is the most exposed to direct solar radiation, and since its pavement has a low albedo, it reached high temperatures especially in the central area, resulting in the highest mean radiant temperature values among the three analyzed sites.
In scenario 2, an increase in the emissivity and/or the albedo of the pavement was tested. Within this scenario, direct comparisons between sites were not possible, since the changes considered for each space were different. However, the results can still be interpreted through the morphology of each site and information gathered in the literature review.
A higher pavement emissivity caused a reduction in both air temperature and mean radiant temperature at the Alameda site. The benefits of applying a material with high emissivity to open space pavements was reported in the literature for spaces such as parks [53]. In the case under study, the morphological features of Alameda did not compromise that benefit. A material with high emissivity transfers heat by radiation at a high rate and is capable of cooling rapidly, particularly during the night.
A higher pavement albedo led to uneven results, namely, to an increase in the mean radiant temperature at Laranjeiras and a reduction at the Brandão de Vasconcelos site, where it was combined with a higher emissivity. These findings confirm that caution must be taken when high-albedo materials are used in outdoor pavements, depending on the characteristics of the place, namely, the distance from the pavement to building walls and the distance between walls [17,56].
The deleterious effect of the increase in façade albedo in scenario 3 was higher at Alameda due to its canyon shape and the low albedo of its pavement, which makes it absorb the reflected radiation and heat up. At Laranjeiras, the effect was also significant but less intense, mainly due to the higher albedo of its pavement. At the Brandão de Vasconcelos site, this effect was only felt in the vicinity of the façades. Its low H/W ratio made it imperceptible in the central area.
In what concerns the presence of vegetation, as stated in 6.3, the green elements of any of the three studied sites occupy a reduced area when compared to the whole site area and thus their influence was very localized. This highlights the obvious fact that the quantity and size of vegetation must be defined according to each site’s morphology in order to exert a favorable impact on the thermal conditions of the whole site. However, in what concerns relative humidity, as shown in Figure 30, the removal of the trees had an effect on the whole area of the site.
The results for direct solar irradiance presented in sub-Section 6.3 did not allow a comparison between sites since the values were very similar, as expected for noon, when the sun is high and there is no shade.
In what concerns wind speed, comparing Figure 22, Figure 25 and Figure 28, it can be seen that the range of wind speed for scenario 1 went from 0.25 to 1.75 m/s at Alameda, from 0.25 to 1.25 m/s at Laranjeiras, and from 0.25 to 2.25 m/s at Brandão de Vasconcleos. Given their respective morphology, these were expected results.
6.5. Estimation of the MOCI Comfort Index
Given the results of the ENVI-met software for the chosen typical summer day at noon, according to five different scenarios, a rough estimation of the MOCI index was calculated using Equation (1) and the least and most favorable combinations of parameter values (WS, RH, MRT, TA) for each site (Table 3). ICL was considered equal to 0.35 clo.
Table 3.
Estimated MOCI range for each site and scenario.
As seen in Table 2, for every site and scenario there were zones outside of the optimal comfort zone, which ranges from −0.5 to +0.5. At the Alameda site, certain zones revealed a slight thermal discomfort, with some tending towards a cooler feel and others running warmer. At the Laranjeiras site, only in theoretical scenario 4 could a small discomfort on the cooler side be observed. At the opposite extreme, the Laranjeiras site presented a thermal discomfort on the warmer side that was more severe than Alameda’s.
At the Brandão de Vasconcelos site, there was no cool thermal discomfort, but the discomfort resulting from excessive warmth was the highest of the analyzed sites.
In every site, the highest degree of warmth-induced discomfort was present in scenario 3 due to the high albedo of the façades, and in scenario 5 due to the lack of trees.
7. Conclusions
The thermal conditions of outdoor spaces are complex and influenced by a great number of factors. Generalized conclusions or universal guidelines are difficult, if not impossible, to establish. This study highlights the need for a targeted analysis of each urban outdoor space whenever improvements in their thermal conditions are intended. In fact, the same interventions may have totally different results depending on the characteristics of the urban site where they are implemented. Some tendencies can be identified but it is very difficult to establish reliable rules due to the great number of influent factors and their complex interaction.
The location under analysis is not a particularly critical place in terms of summer comfort. However, climate change predictions point towards a considerable warming of the Iberian Peninsula, accompanied by heat waves of higher frequency and intensity. If adaptation to these phenomena is to be achieved, urban designers must include summer outdoor comfort in their practice, even for moderate locations such as the area studied in this work. Studies like the present one can be used as a future reference for comparisons.
How do the selected factors influence outdoor thermal conditions? In addition, how do the thermal conditions of the three sites compare?
A higher pavement emissivity proved to be efficient in reducing both air temperature and mean radiant temperature for the morphological features of the Alameda site. A higher pavement albedo led to different results, namely, a significant increase in the mean radiant temperature in smaller and more confined spaces (Laranjeiras); however, when combined with a higher emissivity, it also led to the reduction of the mean radiant temperature in a larger and more open space (Brandão de Vasconcelos).
An increase in the albedo of surrounding façades resulted in an increased mean radiant temperature at every analyzed site, so its deleterious effect was evident. On the contrary, a drastic reduction in façade albedo led to a reduction in air temperature and mean radiant temperature, although of little significance in some cases.
In what concerns the effect of vegetation, its removal did not generate large differences, seeing that the original vegetation was already sparse in the respective site area. Nevertheless, there was a consequent increase in the direct solar radiation reaching the pavement, and therefore a slight increase in the mean radiant temperature. The wind speed also rose in certain zones, which prevented air temperature from climbing. Relative humidity suffered a reduction that extended to the whole area in the scenario without trees, as expected, but the difference was not very significant in terms of comfort.
Are there uncomfortable situations due to overheating, in spite of the mild weather conditions of that typical day?
The present study showed that even in mild climates, on an average summer day at noon, a combination of factors might lead to thermal discomfort, mainly warmth-induced discomfort, but there is also a slight possibility of cool discomfort.
What is (are) the main cause(s) of discomfort?
It is mainly the result of heat exchange through radiation.
In all the studied scenarios, air temperature remained within comfortable values, from 20.30 °C to 24.5 °C. The mean radiant temperature, on the contrary, varied between 26.5 °C and 45 °C and constituted the main cause of warmth-induced discomfort. Wind speed was the main reason for a slightly cool discomfort in certain zones. Finally, relative humidity had residual influence on the comfort index of the simulated scenarios.
The conclusions of the present study highlight the importance of performing a specific study for each urban site whenever an intervention is to be planned.
Author Contributions
Conceptualization—H.C. and R.S.; methodology—H.C.; simulations—R.S.; validation—H.C.; formal analysis—H.C. and F.A.; research—all authors; resources—H.C. and F.A.; data curation—R.S.; writing and preparation of original draft—all authors; writing, reviewing, and editing of final draft—all authors. All authors have read and agreed to the published version of the manuscript.
Funding
This research was supported by the Base Funding UIDB/04708/2020 of CONSTRUCT—Instituto de I&D em Estruturas e Construções, funded by national funds through FCT/MCTES (PIDDAC).
Institutional Review Board Statement
Not applicable.
Informed Consent Statement
Not applicable.
Data Availability Statement
Not applicable.
Acknowledgments
The authors would like to thank the technical staff of the Municipality of Arouca for their valuable support.
Conflicts of Interest
The authors declare no conflict of interest.
References
- United Nations. World Urbanization Prospects. The 2018 Revision; ST/ESA/SER.A/420. Department of Economic and Social Affairs, Population Division (UN DESA): New York, NY, USA, 2019. Available online: https://esa.un.org/unpd/wup/ (accessed on 23 March 2021).
- Ritchie, H.; Roser, M. Urbanization. Published online at OurWorldInData.org. 2018. Available online: https://ourworldindata.org/urbanization (accessed on 2 March 2021).
- Janik, A.; Ryszko, A.; Szafraniec, M. Scientific Landscape of Smart and Sustainable Cities Literature: A Bibliometric Analysis. Sustainability 2020, 12, 779. [Google Scholar] [CrossRef]
- Natanian, J.; Kastner, P.; Dogan, T.; Auer, T. From energy performative to livable Mediterranean cities: An annual outdoor thermal comfort and energy balance cross-climatic typological study. Energy Build. 2020, 224, 110283. [Google Scholar] [CrossRef]
- Cortesão, J.; Alves, F.B.; Corvacho, H.; Rocha, C. Retrofitting public spaces for thermal comfort and sustainability. Indoor Built Environ. 2016, 25, 1085–1095. [Google Scholar] [CrossRef]
- Hatvani-Kovacs, G.; Bush, J.; Sharifi, E.; Boland, J. Policy Recomendations to Increase Urban Heat Stress Resilience. Urban Clim. 2018, 25, 51–63. [Google Scholar] [CrossRef]
- Marques, B.; Corvacho, H.; Alves, F. Assessment of solar access in urban environment: The case of the renewal of a city block in Espinho, Portugal. Indoor Built Environ. 2016, 25, 1075–1084. [Google Scholar] [CrossRef]
- Sharifi, E.; Boland, J. Heat resilience in public space and its applications in healthy and low carbon cities. Procedia Eng. 2017, 180, 944–954. [Google Scholar] [CrossRef]
- Hendel, M.; Gutierrez, P.; Colombert, M.; Diab, Y.; Royon, L. Measuring the effects of urban heat island mitigation techniques in the field: Application to the case of pavement-watering in Paris. Urban Clim. 2016, 16, 43–58. [Google Scholar] [CrossRef]
- Taslim, S.; Parapari, D.; Shafaghat, A. Urban Design Guidelines to Mitigate Urban Heat Island (UHI) Effects In Hot-Dry Cities, Special Issue on Advances in Sustainable Structure, Construction, Building and Urban Research. Sci. Eng. 2015, 74, 119–124. [Google Scholar] [CrossRef]
- Pioppi, B.; Pigliautile, I.; Piselli, C.; Pisello, A.L. Cultural heritage microclimate change: Human-Centric approach to experimentally investigate intra-urban overheating and numerically assess foreseen future scenarios impact. Sci. Total Environ. 2020, 703, 134448. [Google Scholar] [CrossRef]
- Gaspari, J.; Fabbri, H.; Lucchi, M. The use of outdoor microclimate analysis to support decision making process: Case study of Bufalini square in Cesena. Sustain. Cities Soc. 2018, 42, 206–215. [Google Scholar] [CrossRef]
- Givoni, B. Climate Considerations in Building and Urban Design; John Wiley & Sons, Inc.: New York, NY, USA, 1998. [Google Scholar]
- Santamouris, M. Using cool pavements as a mitigation strategy to fight urban heat island—A review of the actual developments. Renew. Sustain. Energy Rev. 2013, 26, 224–240. [Google Scholar] [CrossRef]
- Santamouris, M.; Synnefa, A.; Karlessi, T. Using advanced cool materials in the urban built environment to mitigate heat islands and improve thermal comfort conditions. Sol. Energy 2011, 85, 3085–3102. [Google Scholar] [CrossRef]
- Qin, Y. Urban canyon albedo and its implication on the use of reflective cool pavements. Energy Build. 2015, 96, 86–94. [Google Scholar] [CrossRef]
- Chen, J.; Wang, H.; Zhu, H. Analytical approach for evaluating temperature field of thermal modified asphalt pavement and urban heat island effect. Appl. Therm. Eng. 2017, 113, 739–748. [Google Scholar] [CrossRef]
- Yang, J.; Wang, Z.; Kalousha, K.; Dylla, H. Effect of pavement thermal properties on mitigating urban heat islands: A multi-scale modeling case study in Phoenix. Build. Environ. 2016, 108, 110–121. [Google Scholar] [CrossRef]
- Yang, X.; Zhao, L.; Bruse, M.; Meng, Q. Evaluation of a microclimate model for predicting the thermal behavior of different ground. Build. Environ. 2013, 60, 93–104. [Google Scholar] [CrossRef]
- Lawton, M. Social Ecology and the Health of Older People. Am. J. Public Health 1974, 64, 257–260. [Google Scholar] [CrossRef]
- Goldsmith, S. Designing for the Disabled: The New Paradigm; Architectural Press: Oxford, UK, 1997. [Google Scholar]
- Imrie, R. Disability and the City: International Perspectives; Paul Chapman Publishing: London, UK, 1996. [Google Scholar]
- Hanson, J. The Inclusive City: Delivering a more accessible urban environment through inclusive design. In Proceedings of the RICS Cobra 2004 International Construction Conference: Responding to Change, York, UK, 7–8 September 2004. [Google Scholar]
- Jamei, E.; Rajagopalan, P.; Seyedmahmoudian, M.; Jamei, Y. Review on the impact of urban geometry and pedestrian level greening on outdoor thermal comfort. Renew. Sustain. Energy Rev. 2016, 54, 1002–1017. [Google Scholar] [CrossRef]
- Taleghani, M.; Kleerekper, L.; Tenpierik, M.; van den Dobbelsteen, A. Outdoor thermal comfort within five different urban forms in the Netherlands. Build. Environ. 2015, 83, 65–78. [Google Scholar] [CrossRef]
- Forouzandeh, A. Numerical modeling validation for the microclimate thermal condition of semi-closed courtyard spaces between buildings. Sustain. Cities Soc. 2018, 36, 327–345. [Google Scholar] [CrossRef]
- Ketterer, C.; Matzarakis, A. Human-Biometeorological assessment of the urban heat island in a city with complex topography —The case of Stuttgart, Germany. Urban Clim. 2014, 10, 573–584. [Google Scholar] [CrossRef]
- Shashua-Bar, L.; Pearlmutter, D.; Erell, E. The influence of trees and grass on outdoor thermal comfort in a hot-arid environment. Int. J. Clim. 2010, 31, 1498–1506. [Google Scholar] [CrossRef]
- Wang, Z.; Zhao, X.; Yang, J.; Song, J. Cooling and energy saving potentials of shade trees and urban lawns in a desert city. Appl. Energy 2016, 161, 437–444. [Google Scholar] [CrossRef]
- Nagato, K.; Tetsumi, H. Development of outdoor thermal index indicating universal and separate effects on human thermal comfort. Int. J. Biometeorol. 2010, 55, 219–227. [Google Scholar] [CrossRef]
- Romero, M. Princípios Bioclimáticos Para o Desenho Urbano (Only in Portuguese); CopyMarket: São Paulo, Brazil, 2013. [Google Scholar]
- Matzarakis, A.; Mayer, H. Another Kind of Environmental Stress: Thermal Stress. Who Newsl. 1996, 18, 7–10. Available online: https://www.academia.edu/22149629/Another_kind_of_environmental_stress_thermal_stress (accessed on 2 March 2021).
- Panão, M.O.; Gonçalves, H.; Ferrão, P. Indicadores do Desempenho Térmico de Edificações Urbanas (only in Portuguese). In Proceedings of the HB2006 Healthy Buildings Proceedings, Lisboa, Portugal, 4–8 June 2006. [Google Scholar]
- Cuadrat, J.; Pita, M. Climatología; Ediciones Cátedra: Madrid, Spain, 2009. (In Spanish) [Google Scholar]
- Alves, F.B.; Cruz, S.; Ribeiro, A.; Silva, A.M.C.B.; Cunha, I.; Martins, J. Walkability Index for Elderly Health: A Proposal. Sustainability 2020, 12, 7360. [Google Scholar] [CrossRef]
- Ling, T.-Y.; Chiang, Y.-C. Well-Being, health and urban coherence-advancing vertical greening approach toward resilience: A design practice consideration. J. Clean. Prod. 2018, 182, 187–197. [Google Scholar] [CrossRef]
- Rosso, F.; Golasi, I.; Castaldo, V.L.; Piselli, C.; Pisello, A.L.; Salata, F.; Ferrero, M.; Cotana, F.; Vollaro, A.D.L. On the impact of innovative materials on outdoor thermal comfort of pedestrians in historical urban canyons. Renew. Energy 2018, 118, 825–839. [Google Scholar] [CrossRef]
- Salata, F.; Golasi, I.; Petitti, D.; Vollaro, E.D.L.; Coppi, M.; Vollaro, A.D.L. Relating microclimate, human thermal comfort and health during heat waves: An analysis of heat island mitigation strategies through a case study in an urban outdoor environment. Sustain. Cities Soc. 2017, 30, 79–96. [Google Scholar] [CrossRef]
- Shooshtarian, S.; Lam, C.K.C.; Kenawy, I. Outdoor thermal comfort assessment: A review on thermal comfort research in Australia. Build. Environ. 2020, 177, 106917. [Google Scholar] [CrossRef]
- Gehl, J. Cities for People; Island Press: Washington, DC, USA, 2010. [Google Scholar]
- Salata, F.; Golasi, I.; de Lieto Vollaro, R.; de Lieto Vollaro, A. Outdoor thermal comfort in the Mediterranean area. A transversal study in Rome, Italy. Build. Environ. 2016, 96, 46–61. [Google Scholar] [CrossRef]
- Leech, J.A.; Burnett, R.; Nelson, W.; Aaron, S.D.; Raizenne, M. Outdoor air pollution epidemiologic studies. Am. J. Respir.Crit. Care Med. 2000, 161, A308. [Google Scholar]
- Cohen, P.; Potchter, O.; Matzarakis, A. Human thermal perception of Coastal Mediterranean outdoor urban environments. Appl. Geogr. 2013, 37, 1–10. [Google Scholar] [CrossRef]
- Schweiker, M.; Huebner, G.; Kingma, B.; Kramer, R.; Pallubinsky, H. Drivers of diversity in human thermal perception—A review for holistic comfort models. Temperature 2018, 5, 308–342. [Google Scholar] [CrossRef]
- Andrade, H.; Alcoforado, M.; Oliveira, S. Perception of temperature and wind by users of public outdoor spaces: Relationships with weather parameters and personal characteristics. Int. J. Biometeorol. 2010, 55, 665–680. [Google Scholar] [CrossRef] [PubMed]
- Johansson, E.; Thorsson, S.; Emmanuel, R.; Krüger, E. Instruments and methods in outdoor thermal comfort studies—The need for standardization. Urban Clim. 2014, 10, 346–366. [Google Scholar] [CrossRef]
- Gaitani, N.; Mihalakakou, G.; Santamouris, M. On the use of bioclimatic architecture principles in order to improve thermal comfort conditions in outdoor spaces. Build. Environ. 2007, 42, 317–324. [Google Scholar] [CrossRef]
- Lin, T.; Matzarakis, A.; Hwang, R. Shading effect on long-term outdoor thermal comfort. Build. Environ. 2010, 45, 213–221. [Google Scholar] [CrossRef]
- Stavrakakis, G.; Tzanakic, E.; Genetzaki, V.; Anagnostakis, G.; Galetakis, G.; Grigorakis, E. A computational methodology for effective bioclimatic-design applications in the urban environment. Sustain. Cities Soc. 2012, 4, 41–57. [Google Scholar] [CrossRef]
- Givoni, B.; Noguchi, M.; Saaroni, H.; Potchter, O.; Yaacov, Y.; Feller, N.; Becker, S. Outdoor comfort research issues. Energy Build. 2003, 35, 77–86. [Google Scholar] [CrossRef]
- Mendes, B. Análise e Conforto Térmico em Praças (Only in Portuguese). Master’s Thesis, University of Minho, School of Engineering, Guimarães, Portugal, 2013. [Google Scholar]
- Marincic, J.; Villa, O. Designing Outdoor Spaces with Comfort. In Proceedings of the International Workshop on Energy Performance and Environmental Quality of Buildings, Milos Island, Greece, 6–7 July 2006. [Google Scholar]
- Santamouris, M.; Gaitani, N.; Spanou, A.; Saliari, M.; Giannopoulou, K.; Vasilakopoulou, K. Using cool paving materials to improve microclimate of urban areas—Design realization and results of the flisvos project. Build. Environ. 2012, 53, 128–136. [Google Scholar] [CrossRef]
- Berdahl, P.; Bretx, S. Preliminary survey of the solar reflectance of cool roofing materials. Energy Build. 1997, 25, 149–158. [Google Scholar] [CrossRef]
- Levinson, R.; Chen, S.; Berdahl, P.; Rosado, P.; Medina, L. Reflectometer measurement of roofing aggregate albedo. Sol. Energy 2014, 100, 159–171. [Google Scholar] [CrossRef]
- Yang, J.; Wang, Z.-H.; Kaloush, K.E. Environmental impacts of reflective materials: Is high albedo a ‘silver bullet’ for mitigating urban heat island? Renew. Sustain. Energy Rev. 2015, 47, 830–843. [Google Scholar] [CrossRef]
- Fabbri, K.; Di Nunzio, A.; Gaspari, J.; Antonini, E.; Boeri, A. Outdoor Comfort: The ENVI-BUG tool to evaluate PMV values Output Comfort point by point. Energy Procedia 2017, 111, 510–519. [Google Scholar] [CrossRef]
- Höppe, P. The physiological equivalent temperature—A universal index for the biometeorological assessment of the thermal environment. Int. J. Biometeorol. 1999, 43, 71–75. [Google Scholar] [CrossRef]
- Deb, C.; Alur, R. The significance of Physiological Equivalent Temperature (PET) in outdoor thermal comfort studies. Int. J. Eng. Sci. Technol. 2010, 2, 2825–2828. [Google Scholar]
- Matzarakis, A.; Amelung, B. Physiological Equivalent Temperature as Indicator for Impacts of Climate Change on Thermal Comfort of Humans. In Seasonal Forecasts, Climatic Change and Human Health. Advances in Global Change Research; Thomson, M.C., Garcia-Herrera, R., Beniston, M., Eds.; Springer: Dordrecht, The Netherlands, 2008; Volume 30. [Google Scholar] [CrossRef]
- Matzarakis, A.; Mayer; Iziomon, M. Applications of a universal thermal index: Physiological equivalent temperature. Int. J. Biometeorol. 1999, 43, 76–84. [Google Scholar] [CrossRef]
- Ketterer, C.; Matzarakis, A. Human-Biometeorological assessment of heat stress reduction by re-planning measures in Stuttgart, Germany. Landsc. Urban Plan. 2014, 122, 78–88. [Google Scholar] [CrossRef]
- Gagge, A.; Stolwijk, J.; Nishi, Y. An effective temperature scale based on a simple model of human physiological regulatory response. ASHRAE Trans. 1971, 77, 247–262. Available online: http://hdl.handle.net/2115/37901 (accessed on 18 April 2021).
- Gagge, A.; Fobelets, A.; Berglund, L. A standard predictive index of human response to the thermal environment. ASHRAE Trans. 1986, 92, 709–731. Available online: http://www.osti.gov/energycitations/product.biblio.jsp?osti_id=6494216 (accessed on 18 April 2021).
- Bröde, P.; Fiala, D.; Błażejczyk, K.; Holmér, I.; Jendritzky, G.; Kampmann, B.; Tinz, B.; Havenith, G. Deriving the operational procedure for the Universal Thermal Climate Index (UTCI). Int. J. Biometeorol. 2011, 56, 481–494. [Google Scholar] [CrossRef] [PubMed]
- Nikolopoulou, M.; Lykoudis, S. Use of outdoor spaces and microclimate in a Mediterranean urban area. Build. Environ. 2007, 42, 3691–3707. [Google Scholar] [CrossRef]
- Pantavou, K.; Lykoudis, S.; Michael, N.; Stylianou, E.; Christou, R.; Giallouros, G.; Kouis, P.; Tymvios, F.; Nicolaides, K.; Cartalis, C.; et al. Thermal sensation and indices in the urban outdoor hot Mediterranean environment of Cyprus. Theor. Appl. Clim. 2020, 140, 1315–1329. [Google Scholar] [CrossRef]
- Tseliou, A.; Tsiros, I.; Nikolopoulou, M.; Papadopoulos, G. Outdoor thermal sensation in a Mediterranean climate (Athens): The effect of selected microclimatic parameters. Arch. Sci. Rev. 2016, 59, 190–202. [Google Scholar] [CrossRef]
- Pantavou, K.; Santamouris, M.; Asimakopoulos, D. Empirical calibration of thermal indices in an urban outdoor Mediterranean environment. Build. Environ. 2014, 80, 283–292. [Google Scholar] [CrossRef]
- IPMA—Instituto Português do Mar e da Atmosfera (English Transl.: Portuguese Institute of Sea and Atmosfere). Available online: https://www.ipma.pt/pt/index.html/ (accessed on 16 May 2017).


Publisher’s Note: MDPI stays neutral with regard to jurisdictional claims in published maps and institutional affiliations. |
© 2021 by the authors. Licensee MDPI, Basel, Switzerland. This article is an open access article distributed under the terms and conditions of the Creative Commons Attribution (CC BY) license (https://creativecommons.org/licenses/by/4.0/).