Abstract
Studies on human mobility have a long history with increasingly strong interdisciplinary connections across social science, environmental science, information and technology, computer science, engineering, and health science. However, what is lacking in the current research is a synthesis of the studies to identify the evolutional pathways and future research directions. To address this gap, we conduct a systematic review of human mobility-related studies published from 1990 to 2020. Drawing on the selected publications retrieved from the Web of Science, we provide a bibliometric analysis and network visualisation using CiteSpace and VOSviewer on the number of publications and year published, authors and their countries and afflictions, citations, topics, abstracts, keywords, and journals. Our findings show that human mobility-related studies have become increasingly interdisciplinary and multi-dimensional, which have been strengthened by the use of the so-called ‘big data’ from multiple sources, the development of computer technologies, the innovation of modelling approaches, and the novel applications in various areas. Based on our synthesis of the work by top cited authors we identify four directions for future research relating to data sources, modelling methods, applications, and technologies. We advocate for more in-depth research on human mobility using multi-source big data, improving modelling methods and integrating advanced technologies including artificial intelligence, and machine and deep learning to address real-world problems and contribute to social good.
1. Introduction
Human mobility is one of the typical human behaviours in daily life. With the prevalence of diverse transport modes, human populations have become highly mobile in this modern world [1]. Understanding the pattern of human mobility serves as the foundation to reveal how people respond to and interact with the urban and natural environment, and to develop valuable applications in transportation, urban planning, epidemic disease controlling, and natural disaster evaluation [2,3]. As such, human mobility-related (HMR) studies have gained increasing attention from scholars in multiple disciplines and have become highly diverse in terms of their theoretical foundation, modelling techniques, empirical studies, and practical applications [4]. However, a systematic literature review of HMR studies is lacking to offer a holistic understanding of the emerging trends and research frontiers that can guide future research.
HMR studies have been highly multi-disciplinary and are currently facing a period of intensive reorientation [4]. Information and computer science, engineering, mathematical science, and physical science have more interests in modelling the pattern of human mobility [5]; while social, environmental, biological, geographic, medical and health sciences more emphasise the relationship between human mobility and environmental factors, offering a wide range of applications in urban planning, infrastructure configuration, disaster prevention, and transport forecasting [6]. With the development of information and communication technologies in the past one decade, human mobility patterns have changed significantly as the use of the Internet and mobile devices have made interpersonal communications much easier than before [7]. The increase of transport networks and transport modes (e.g., low-cost air flights, high-speed trains, and sharing vehicles) makes travel more convenient [8]. Such technologies, in turn, largely enrich HMR studies given the availability of the emerging sources of big data collected from the widely applied location-aware devices, and the multi-scale modelling techniques [9]. As such, there is a pressing need to examine the emerging trends of HMR studies to identify the knowledge gaps where further studies are most needed and to propose future research initiatives and agenda.
This study aims to address the above need by (1) conducting a bibliometric analysis of HMR publications from 1990 to 2020; (2) visualising the network of HMR publications; (3) revealing popular domains and research frontiers; and (4) charting a future research agenda. Methodologically, we collect HMR literature in the Web of Science from 1990 to 2020 as the research object and use the information visualisation software CiteSpace and VOSviewer to identify popular domains, evolving trends, research frontiers, and the connections to other disciplines. Our study not only provides a holistic picture of the authors, institutions, countries, keywords, and disciplinary categories of the current scholarship, but also depicts the connections of co-citation references, co-authorship and co-occurring keywords to guide those who have the interest to be engaged in this field. By synthesizing the work recommended by the top cited authors in the current literature, we propose future directions towards which we can orientate our collective effort in human mobility research.
The rest of this paper is organised as below. The next section describes the data and methods used in this study. Then, the analytical results are presented to describe the HMR literature from 1990 to 2020, and to visualise the inter-connections of the literature in terms of co-authorships, co-citations, and co-occurring keywords in order to reveal the emerging trends, popular domains and research frontiers. The future directions in terms of data sources, modelling approaches, applications and technologies are discussed thereafter, followed by a conclusive remark at the end.
2. Background
2.1. Human Mobility-Related Studies
HMR studies have a long history dating back to the featured work about population mobility in the U.S. by Hugher, and the measures of intra-urban mobility by Corbally, both in 1930 [10,11]. The information of human mobility can directly indicate the patterns of people’s travel behaviour and moving trajectory, which could also indirectly reflect their travel preferences, living styles and habits, residential decisions, and psychological responses to the surrounding environment [12]. Due to the essential nature of human mobility, studies on human mobility have been multi-disciplinary and conducted in a wide range of research paradigms, including social science, environmental science, information and computer science, engineering, mathematical science, and physical science, biological science, and medical and health science. As human populations become highly mobile in the modern world with the prevalence of diverse transport modes, measuring human mobility serves as the essential method to study how human beings respond to and interact with the urban and natural environments [13]. Human mobility is normally quantified in both spatial and temporary dimensions based on an individual’s trajectory of movement or the mobility flow between locations at the aggregated population level, the latter of which can be further calculated as location-based mobility index [14]. HMR studies have different emphasis on different disciplines. HMR studies integrating into the field of information and computer science, engineering, mathematical science, and physical science have contributed a wide range of measuring and modelling approaches to capture human mobility patterns at both the individual and aggregated population levels [5]. Whereas, HMR studies in the field of social, environmental, biological, geographic, medical, and health sciences focus on exploring the relationship between human mobility and the urban and natural environment, providing policy implications in urban planning, infrastructure configuration, disaster prevention, and transport forecasting [6]. Understanding the inter- and intra-disciplinary connections in HMR studies is important to explore future research paradigm, which, however, has been rarely addressed in the current scholarship—the knowledge gap this study aims to fulfil.
With the development of information and communication technologies in recent decades, human mobility patterns have significantly changed as the use of the Internet and mobile devices have made interpersonal communications much easier than before [7] and the increase of transport networks and modes (e.g., low-cost air flights, high-speed trains, and sharing vehicles) makes travel more convenient [8]. Such technologies, in turn, largely enrich human mobility-related studies by widely-applied location-aware devices (e.g., smartphones and GPS receivers), the emerging sources of big data (e.g., from social media and transport smart-card), and multi-scale modelling techniques (e.g., from a population to individual level). As such, a systematic review of the HMR literature is needed to reveal the emerging trends of HMR studies and to propose future research initiatives and directions to extend the current research scope.
2.2. Bibliometric Analyses and Network Visualisation of the Literature
Methodologically, a bibliometric analysis based on citations is widely used for systematic literature review to assess the importance and impact of publications and their connections with other disciplines [15]. Scholarly citations are generally treated as an indication of the knowledge flow from the cited entity to the citing one in terms of how, why, and at what rate new ideas and technologies spread through a certain research domain knowledge [16]. Specifically, the cited and citing entities are usually considered as the source and target of diffusion. As such, a variety of quantitative diffusion indicators has been used to describe the diffusion characteristics of knowledge production and to evaluate the impact of research, including citation counts, journal impact factors, field diffusion intensity, and the countries and institutions of researchers [17].
A wide range of software tools has been developed to assist scientists to visualise the diffusion of knowledge and reveal the network pattern of citations, including CiteSpace developed by Chaomei Chen [18] and VOSviewer developed by Nees Jan van Eck and Ludo Waltman [19]. Both CiteSpace and VOSviewer are open-source software tools for analysing, detecting and visualizing the trends and patterns in scientific literature. CiteSpace is available to analyse both English and non-English literature based on multiple databases of scholarly publications, while VOSviewer is only available for English literature but with additional functions that CiteSpace does not have (e.g., density mapping). Therefore, our study uses both tools to conduct the bibliometric analysis.
3. Materials and Methods
3.1. Review Materials
The data used in this study is collected from the Web of Science (WOS) Core Collection including science citation index expanded (SCI-Expanded) and social science citation index (SSCI). The timespan for our search is set from 1990 to 2020 given that the number of publications per annual before 1990 is relatively small. We set up the selection criteria by referencing the definition of human mobility by Hannam et al. [3]. This definition of human mobility encompasses both the large-scale movements of people across the world, as well as the more local processes and patterns of daily transportation, travel behaviours, movements through the urban and regional spaces and within everyday life [3]. Accordingly, the search terms we use are defined as human mobility, mobility pattern, human trajectory, human migration, human immigration, population migration, population immigration, population mobility, rural mobility, urban mobility, migration flow, immigration flow, mobility network, migration network, and immigration network. We use double quotation marks to enclose these terms in the search to ensure the search results contain those terms either in the title, abstract, or keywords; this also excludes potential search biases that may contain a term in different sequences, such as ‘human reaction to high mobility group proteins…’, which is beyond the scope of this literature review. Publication types are set to include all types (Table 1). With these search criteria, we obtain 5728 publications in all forms which are then exported with full citation records and cited references in a plain text format for further analysis.

Table 1.
Research protocol.
3.2. Methods
We commence with a descriptive summary of the bibliographic records in terms of the publication year, publication type, disciplinary categories, institutions (author affiliations), and the most productive authors. Then, we use CiteSpace and VOSviewer to visualise the emerging trends of the HMR literature, popular domains, and research frontiers. CiteSpace as a Java visualisation application relies on three central concepts: burst detection, betweenness degree (or centrality), and heterogeneity. The technical details and measures of these three concepts can be found in the user guide by Chen [18]. In general, burst detection is used to identify the nature of popular domains and to detect sharp increases and changes of research interests in a speciality; betweenness degree reflects the popularity or importance of nodes in a network; heterogeneity is used to identify the tipping points of research fields, and detect emerging trends and abrupt changes [18]. The analytical procedure in CiteSpace consists of time slicing, burst and node defining, modelling, thresholding, and mapping. In our study, we define time-slicing as one-year interval, meaning all statistics are calculated by every year. Burst terms are defined as the keywords, abstracts, titles, author affiliations, countries, and disciplinary categories of the bibliographic records, respectively. Nodes are defined to represent the betweenness degree (or centrality) of these burst terms. The visualisation is conducted based on these settings with a threshold of presentation set to be minimum, only showing the top 10% burst terms. Mapping layout is set as a network mode for authors, institutions (author affiliations), countries, abstracts, and a timeline mode for keywords to better illustrate its change over time. Furthermore, VOSviewer obsesses similar functions as CiteSpace but has one additional function of density mapping based on the frequency of a certain attribute such as the keywords or authors [19]. We use both CiteSpace and VOSviewer to present the outcomes of the bibliometric analyses, considering their complementary advantages.
The analytic workflow consists of four sets of bibliometric analyses, including the features of HMR publications, co-citation references, co-authorship, and co-occurring (Figure 1). First, a descriptive analysis of the selected 5728 HMR publications is conducted based on the year, type, author, disciplinary category, and institution of publications. Second, co-citation references refer to two papers both being cited in the third paper. Accordingly, two articles are defined as having a co-citation relationship if they are cited by one or more articles. A co-citation reference analysis serves as an important indicator to detect the structure and characteristics of a specific domain. In this review, all publications are detected in several clusters (as the top 10% visibility setting) based on the disciplinary category with the most popular abstract and title terms shown on the map simultaneously. In addition, the top journals of co-citations and the top 10 most cited publications are analysed. Third, a co-authorship analysis is conducted based on the name of co-authors appearing in co-citation references, reflecting the extent of influence of the authors and the strength of research collaborations across countries and institutions. The nodes in the network are set to betweenness centrality to represent the importance of countries or author affiliations in the co-authorship network. Fourth, a co-occurring keyword analysis indicates the emerging trends, popular domains and research frontiers based on all selected publications or a particular disciplinary category of the publications. Herein, we utilise a keyword density map to examine the evolving trend of HMR studies and display the results based on a timeline at ten-year interval from 1990 to 2019 (i.e., 1990–1999, 2000–2009, 2010–2019) and consider 2020 as a special year given a large influx of COVID-19 related papers rather than based on the quantity of publications. The classification based on ten-year intervals may distort the retrieval of main topics over time and mislead the horizontal comparison in each category; however, the vertical comparison of the main topics in each interval are comparable across disciplinary categories. Finally, we propose future research directions in four aspects: involving multi-source mobility data, improving modelling approaches, integrating advanced techniques, and contributing to social good.
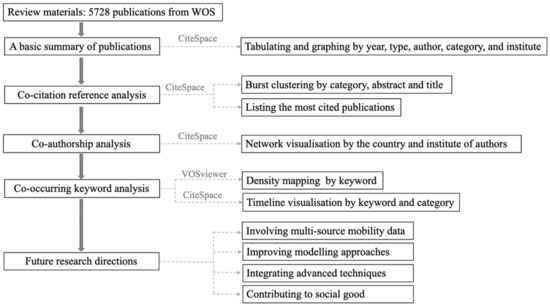
Figure 1.
Analytical flowchart.
4. Results
In this section, we first provide a summary of publications based on the number of publications, publication types, authors, disciplinary categories, and author affiliations. We then present the analytical results using CiteSpace and VOSviewer based on co-citation references, co-authorship, and co-occurring keywords to depict the evolutional and emerging trends in the field of human mobility research.
4.1. A Summary of Publications
Figure 2 plots the annual trends of human mobility-related publications. Prior to 2006, HMR publications obtain a very slow increase with the annual publication number less than 100. The publication number decreases from 113 in 2006 to 84 in 2007 but increases again after 2007 to 381 in 2015. It is followed by a sharp increase after 2015, up to 707 in 2019. Table 2 shows the number and proportion of various publication types. The most frequent document type is articles, accounting for 87.67% of total publications, followed by 6.6% as review papers and editorial, and 2.89% as conference proceeding papers. Table 3 shows that the most productive author in HMR studies is Liu Y, whose research focuses on urban studies, travel patterns, and transportation. The other top nine authors have diverse research focuses mainly in the field of epidemic, disease transmission, urban mobility, and mobility modelling by using mobile phone and big data.
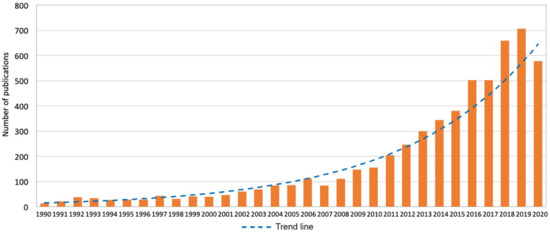
Figure 2.
Number of human mobility-related publications from 1990 to 2020.
Table 2.
Types of human mobility-related publications.
Table 3.
The top 10 most productive authors.
HMR publications are classified to the total 99 default disciplinary categories by WOS. According to academic discipline classifications [20], we further aggregate 99 categories into 13 broad categories (Table 4). The largest proportion of HMR publications (25.08%) are in social sciences, including demography, sociology, urban studies, regional urban planning, ethnic studies, business, management, public administration, and international relationship. The second broad category (12.94%) is environmental sciences, followed by medical and health sciences (12.28%), information and computing sciences (10.75%), technology (9.90%), and multi-disciplinary (8.47%).
Table 4.
HMR publications in broad categories and default categories.
Figure 3 shows the top 10 institutions (author’s affiliations) with the most HMR publications. Chinese Academy of Sciences ranks the first (180), accounting for 3.14% of the publications in this field. The top 10 institutions include four American institutions, three British institutions, two Chinese institutions, and one French institution. A total of 1172 publications are contributed by these institutions, accounting for 20.46% of the selected publications.
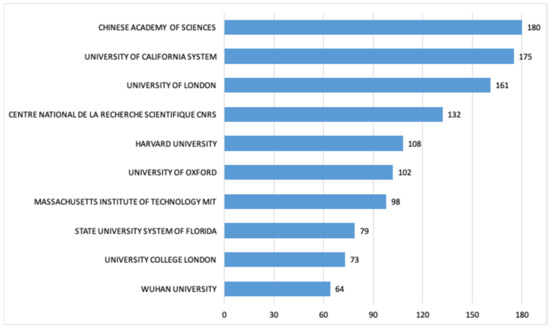
Figure 3.
Top 10 institutions with the largest number of HMR publications.
In summary, the amount of HMR publications increases rapidly since 2008, mainly published as academic articles in the field of social sciences, environmental sciences, and medical and health sciences. Research areas of the three most productive authors are mobility studies in urban, travel patterns, and transportation. The most productive institutions are mainly based in the U.S., UK, and China.
4.2. Co-Citation Reference Analysis
Figure 4 indicates the bursts of co-citation references in the top six disciplinary categories by different colours and the node labels show the most popular abstract term (purple) and title term (blue) in that category. We set up the uniformed size of nodes for better visualisation and label the rank of the top six categories in front of their names. The largest burst of co-citation references (labelled as 1) falls in multi-disciplinary sciences with the most popular abstract term as mobile phone and the most popular title term as mobile phone data. The second-largest burst is about green and sustainable science and technology, followed by transportation, demography, applied mathematical sciences, and urban studies. In addition, multi-disciplinary sciences and urban studies are intertwined in the same burst (red colour) indicating the close connection between these two research categories, but the other four categories are relatively independent as being detected in different bursts (shown as different colours).
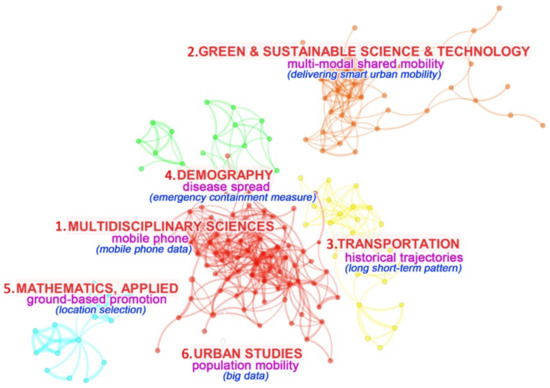
Figure 4.
Bursts of co-citation references in the top six disciplinary categories (red label) with abstract terms (purple label) and title terms (blue label).
Figure 5 shows the top journals of co-citation references. The top four journals with the largest number of co-citations are Nature (1827 as the number/90 as the centrality), followed by Science (1711/75), the National Academy of Sciences of the U.S. (1614/88), and PLOS One (1364/39). Other highly cited journals include Scientific Reports (a Nature research journal), Lecture Notes in Computer Science, The Lancet, Journal of Transport Geography, and Physical Review E, Transport Research Record and Transportation Research Part C Emerging Technologies. Most of these highly cited journals are multi-disciplinary, and almost half of them are related to transport, physical, and computer sciences.
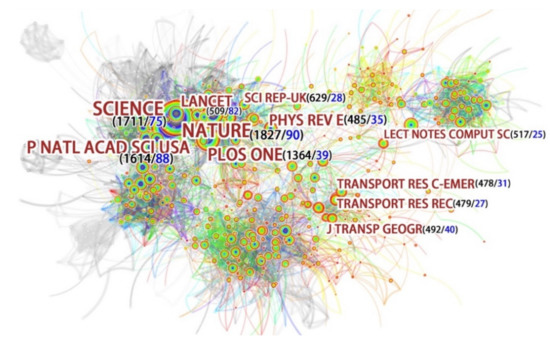
Figure 5.
The most cited journals in co-citation references.
Table 5 shows the top 10 most cited HMR publications. The top two cited papers are in multi-disciplinary sciences in computer science and technology, published in Nature in 2008 by Gonzalez et al. and in Science in 2010 by Song CM et al. [2,21]. Both papers model large-scale human mobility by using big data to reveal that humans follow simple and reproducible patterns despite the diversity of their travel history. The finding of inherent similarity in travel patterns has extended impacts on all phenomena driven by human mobility, from epidemic prevention to emergency response, urban planning, and agent-based modelling. Among these 10 publications, five publications are multi-disciplinary, across the category of computer science, physics, engineering, and telecommunications, providing methods to compute and model human mobility [2,22,23,24,25,26]. Two publications are in medical and health science, quantifying the impact of human mobility on disease transmission [27,28]. Two publications are in social science, related to urban studies and geography [29,30]. One publication is in transportation science and technology by using mobile phone big data [31]. In sum, the most cited publications are highly multi-disciplinary, computation-based, and method-oriented with diverse applications in social, medical, urban, and geographic studies.
Table 5.
The top 10 most cited HMR publications.
4.3. Co-Authorship Analysis
The co-authorship analysis by country and institution reflects the countries or institutions where co-authors are highly concentrated and the degree of connections among countries or institutions in the field of human mobility. The different colours in Figure 6 indicate the diversification of research directions. Figure 6A shows that the U.S. has the largest research burst with 1017 publications and 65 as the degree of co-authorship connections to other countries, followed by England, Spain, Germany, France, Italy, and Canada. It indicates the diversity of international collaborations across geographic contexts. Figure 6B shows that the top institutions of co-authorship. The institutions with the largest number of cited publications is the Chinese Academy of Sciences (centrality as 47), followed by University Oxford, University of Melbourne, Wuhan University, Harvard University, University of Washington, Nanjing University, Peking University, University College of London, Stanford University, and Massachusetts Institute of Technology. Among these institutions, six are from China, four from the U.S., two from the U.K., and one from Australia.
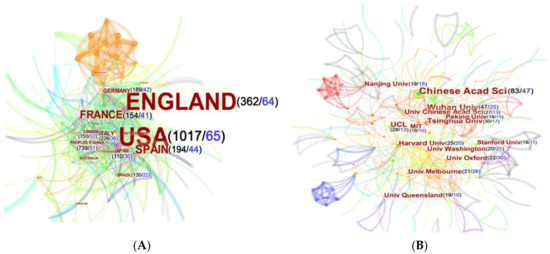
Figure 6.
(A) Co-authorship analysis by country. (B) Co-authorship analysis by institution. Note: The number of publications is labelled in black and the betweenness degree (centrality) is labelled in blue.
4.4. Co-Occurring Keywords Analysis
The keyword density map (Figure 7) produced by VOSviewer uses colours and font sizes to represent the frequency of the keywords in HMR publications. The larger font size and lighter colour (yellow) indicate the higher frequency of keywords. It can be observed that there are two dense clusters in Figure 6. The cluster on the left has -frequently used keywords including population, migration, and human migration. They are closely surrounded by keywords including disease, transmission, species, infection, sequence, and climate change. As such, the left cluster is relevant to research in the domain of urban and social studies, epidemic and infectious diseases, public health, climate, and environmental sciences. In the cluster on the right side, the most frequently used keyword is network, followed by service, urban mobility, algorithm, accuracy, infrastructure, experiment, efficiency, and vehicle. Such keywords tend to be relevant to research in the domain of telecommunications, physics, technology, and transportation.
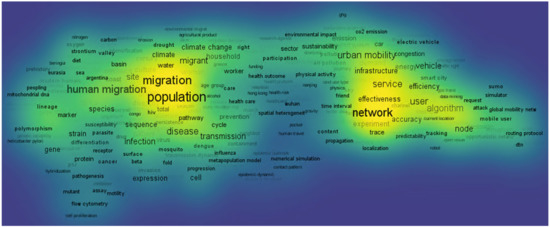
Figure 7.
Keyword density visualisation.
We further examine the emerging trends of HMR publications by category with the timeline view of co-occurring keywords (Figure 8) and the change of co-occurring keywords is indicated in Table 6 (bold showing that keywords appear more than one decade). The most popular category is transportation, followed by genetics and heredity, infectious diseases, demography, telecommunications, physics and multi-disciplinary, archaeology, business, and microbiology. Along with the horizon of each category, arch lines reflect the connection of two co-citations with the same co-occurring keywords. The colours of arch lines indicate the year of citations. The vertical grey lines separate the whole timeline into four intervals (1990–1999, 2000–2009, 2010–2019, and 2020). In the top category of transportation, the keywords are cost, city and transport in 1990–1999, then changed to policy inequality, accessibility, and travel in 2000–2009, further changed to built environment, CO2 emission, and public transport in 2010–2019, and evolved to automated vehicle and vehicle usage in 2020. In the category of genetics and heredity, the keywords are evolved from population sequence and distance in 1990–1999 to mixture-ethnic group and expansion in 2010–2019. In infectious diseases, keywords have been evolving from mortality and risk transmission in the 1990s to tuberculosis trend in developing countries, influenza, weather, and COVID-19 in 2020. The keywords in demography are relatively consistent with climate change, weather, resettlement disasters, displacement, vulnerability, and adaptation frequently appearing from 1990 to 2019, and with artefact synchrony mitigation as the research frontier in 2020. In telecommunications, keywords rarely appear before 2000 and become relatively more frequent in global mobility network, mobility model, travel time, and internet from 2001 to 2019, and change to wireless communication and smart mobility in 2020. In physics and multi-disciplinary fields, keywords are changed from network pattern, urban mobility, travel pattern, global position system, to more recently smart card data and deep learning. Keywords in archaeology evolve from age, residential mobility to carbon, bone collagen, and stable isotope more recently. Keywords in business change from deforestation, exposure intervention, decision making, and living quality before 2010, to more recently air pollution and population exposure. Finally, keywords in micro-biology change from gene culture, protein, negative bacteria before 2010 to urbanisation, proliferation, and apoptosis in 2010–2019 and become very few in 2020.
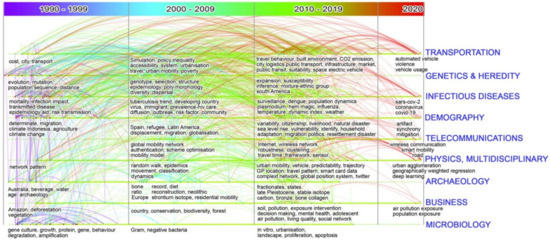
Figure 8.
Timeline of co-occurring keywords in the top disciplinary categories.
Table 6.
Change of co-occurring keywords over three decades.
In summary, HMR research has become increasingly popular across various disciplines with enhanced collaborations across countries and institutions. Most of the top citied publications are multi-disciplinary studies which provide frameworks, approaches, and applications to model human mobility, and integrate big data into the modelling process. The evolutional pathways of HMR studies show that the emerging sources of big data have been used to better track people’s movement patterns and such big data were provided by mobile devices, social media applications, and transport systems. The development of computer science, information technology, and the Internet-of-things (IoTs) innovates the modelling techniques to better analyse and present the spatiotemporal patterns of human mobility and to improve the simulation and prediction of human mobility. Cutting-edge technologies such as deep learning, machine learning, and artificial intelligence have been used to build novel applications of human mobility in multi-disciplinary areas.
5. Future Research Directions
Based on our bibliometric analyses and future work recommended by top cited studies in each disciplinary category, we identify four directions for future research, which are: involving multi-source mobility data, improving modelling approaches, integrating advanced techniques, and contributing to social good through real-world applications.
5.1. The Involvement of Multi-Source Mobility Data
The nature of empirical data used in HMR studies is multi-dimensional and from multi-source based on the spatial and temporal information of individuals’ travel trajectory as well as the mobility flow at the aggregated level. First, transport systems are the common source that provide mobility data, for example, the timetable of buses, trains, and flights [32]. However, these data only represent the scheduled mobility flows rather than the actual mobility occurring across places. More recently, smart-card-based big data provided by smart transport systems become the emerging data source to model human mobility based on the location and time of boarding and alighting of travellers [33]. Second, another emerging mainstream data source is individual-based tracking data provided by mobile phones or other telecommunication devices with the function of global positioning system (GPS) to record the spatial and temporal information of mobile phone users [34,35,36]. The rapid development of smartphones in the past decade has extended the GPS-derived data source to large IT companies (e.g., Google and Apple), who can collect the location and time of mobile phone users via the provision of mapping services. Individual-based tracking data has become a top-rated source in HMR studies because of its high accuracy, wide usage, and real-time collection. These data can be further aggregated at different spatial and temporal scales, generating a variety of index-based mobility data. For example, the Google Community Mobility Reports [25] measures the impact of the COVID-19 pandemic on human mobility by comparing human mobility during the pandemic to the pre-pandemic period; it measures human mobility by tracking people’s visits to six types of places extracted from Google Map (e.g., workspace, parks, transit stations, and grocery stores). Similarly, other IT companies, including Baidu, Apple, Foursquare, and Safegraph, also publish a variety of mobility indices, social distancing indices, and mobility reports, which have been widely used in COVID-19 related research. Third, a more recent data source is the data retrieved from the increasingly popular social media applications (e.g., Facebook and Twitter). Such social media data contain spatial and temporal information obtained from users when they choose to post contents with locations, generating diverse index-based mobility data at the aggregated levels, such as the mobility-based responsive index [7,37]. It would be useful in future research to compare the quality of these multi-source mobility data and explore the possible replacement of data to improve data availability to researchers and the general public.
The enrichment of these multi-source mobility data inevitably brings in limitations in terms of data quality, coverage, and processing, as well as concerns on privacy and data security issues [38]. Individual-based mobility tracking data retrieved from mobile phone signals, GPS devices, or social media apps could be biased due to the limited group of phone users (e.g., young and middle-aged adults) or application users who post content with locational information [7]. Such a bias in data representativeness will further introduce inaccuracy when individual-based mobility tracking data are aggregated to index-based or flow-based mobility data at a certain spatial or temporal scale. It is therefore critical to construct universal standards to ensure data quality, unify data processing procedures, and facilitate data sharing. These standards should also ensure high standards in the deposit, storage, processing, and distribution of mobility data to ensure data security and protect user privacy. This can only be achieved by the collective effort of multiple parties, including government, private companies who collect and dispatch the data, and data users. While the government can make effort to establish relevant regulations on data collection and usage, there is a general consensus that data providers should make mobility data anonymous and unidentifiable to ensure fully transparent and accountable privacy-preserving solutions. The storage of mobility data must be secure and do not allow any unauthenticated and unauthorized access. Data security in transit is also critical as this ensures that data is protected while being transferred in-between networks during the process of data upload, download, transfer, and backup. On the other hand, data users such as researchers also need to ensure any identifiers from the datasets to be removed before depositing the data in public repositories. Due to the complexity of technologies in data protection and the need for long-term preservation, it is often recommended for researchers to host the sensitive data on their institutional server or network rather than on their personal device. Researchers should also choose to deposit the data they processed to a trusted data repository after use [39].
5.2. The Improvement of the Modelling of Individual and Collective Mobility Patterns
The use of multi-source mobility data will enrich the modelling work in future HMR studies. Integration of multi-source mobility data into other research objects in multi-disciplines enables researchers to analyse the spatiotemporal metrics of mobility, the association of mobility and other phenomena, and the simulation and prediction of mobility [40]. The great challenge of modelling mobility patterns lies in the improvement of three types of fundamental metrics commonly used in the current scholarship [5]—trajectory-based, network-based, and social-based metrics—each type of metric has its specialities and characteristics that can be improved in future studies. Trajectory-based metrics are based on the trajectory of individuals’ mobility and are usually quantified as jump lengths, mean square displacement, time duration, speed, interval, the radius of gyration, entropy index, or the most frequented locations [5,41]. Network-based metrics use graphic visualisation to characterise human mobility. In network visualisation, nodes can represent a group of locations visited by people, and edges can represent related pairs of locations in the historical trajectories. Network-based metrics are usually quantified as the degree of centrality, betweenness centrality, closeness centrality, or eigenvector centrality [41] as well as motifs and origin-destination matrices [24]. Social-based metrics are based on the co-occurrence between two or more people and are usually quantified as frequency of co-occurrences, closeness of important locations, probability of co-occurrences, and/or similarity of historical trajectories [41]. Future work can contribute to comparing different metrics to explore the potential replacement of measures to address data unavailability by comprehensively using multiple mobility metrics.
Another challenge of modelling mobility patterns lies in the involvement of multimodality (or multiple-scale models) at both the individual level and the aggregate population level. On the one hand, individual mobility is subject to a certain level of uncertainty associated with individuals’ free will and arbitrariness in their actions, leading to a degree of stochasticity in mobility patterns. Consequently, individual-level models borrow concepts and methods from the classic Brownian-motion models [42] and continuous-time random-walk models [43] and have been developed to more recent Lévy flight, preferential return, recency, and social-based models [5]. However, many studies assert that individuals’ trajectories are not random but possessing a high degree of regularity and predictability [21]. Future efforts need to better capture and exploit such regularity and predictability of mobility to forecast an individual’s future whereabouts and to construct more realistic models of individuals’ mobility.
On the other hand, population-level models (e.g., gravity models and radiation models) describe the aggregated mobility of many individuals and aim to reproduce origin-destination matrices by estimating the average number of travellers between any two places during a certain period [22,44]. Most modelling approaches derive the mobility flows as a function of a range of relevant variables of the places considered, such as mutual distances, areal characteristics, and the demographic and socioeconomic level of population levels [5]. However, as discussed previously, mobility occurs over multiple spatiotemporal scales (termed as multimodal), and thus, future studies need to have a more comprehensive picture of human mobility by accounting for the effects of multimodality and creating hybrid models as the interpolation between the individual-level and population-level [45]. For example, a hybrid framework for carrying out human mobility analysis based on the multimodal structure of transport systems has been developed in recent years in the context of multilayer networks in British and French cities [46,47,48,49]. Within such networks, layers may correspond to different transportation modes (e.g., flights, buses, and trains) and connections between layers constitute the interchanges between these modes. Constructing multilayer networks is to associate locations to nodes and flows, and frequency of travel to links between different transportation modes. In this case, the optimal time for a person travelling between a given origin-destination pair can be calculated using optimal path algorithms across the multilayer structure [5]. Similarly, future studies can formulate such hybrid modelling frameworks in other applications, such as controlling mobility to prevent the transmission of multi-diseases by developing multi-layers to track the population’s contact with one disease, respectively.
5.3. The Integration of Artificial Intelligence Techniques in Human Mobility Studies
The rapid development and recent advances of artificial intelligence techniques, including high-performance computing, storage, and data modelling using machine learning and deep learning methods, bring new opportunities for human mobility studies [6]. The intersection of mobility data management and artificial intelligence is becoming a promising direction to build a new database (e.g., smart moving objects database developed by Xu et al. [50]), with the advantage of automatic approaches of recommending system settings for the provision of solutions. Such a smart moving objects database has the capability to establish a more complex data structure and provide intelligent data extraction. In this case, mining and analysing trajectory data are not limited to spatiotemporal data but also incorporate sentiment and descriptive attributes to find the relationship between human mobility and subjective matters (e.g., personality and emotion) [50]. In addition, the combination of unprecedented mobility data and machine learning approaches have brought on immense advancement in intelligent transportation systems. In particular, traffic forecasting as the core function has been developed to predict future traffic conditions based on historical data, including traffic flow and control, route planning, parking service, and vehicle dispatching [8]. Such intelligent transportation systems can be used to estimate not only regular mobility behaviours but also special events such as public gatherings.
Another future direction is the integration of deep learning into mobility modelling approaches. Deep learning can be defined as an artificial neural network based on which deep learning models with the support of intelligent systems can facilitate the understanding of the deep knowledge of human mobility [51] and provide solutions and prediction for complex nonlinear relationships between mobility and other objects. Several well-known deep learning models include deep neural networks (DNN), convolutional neural networks (CNN), recurrent neural networks (RNN), and deep belief network (DBN) which have been used to explore the relationship between human mobility and personality and to understand human mobility and transportation patterns (e.g., [8,51,52]). Applications combining mobility and deep learning have been developed in the field of disaster prevision, transport planning, and scenario prediction. For example, DeepMob, as an intelligent transport system with deep learning architecture has been constructed for simulating and predicting human’s future evacuation behaviours or evacuation routes under different conditions of natural disasters [53]. DeepTransport, another intelligent system, was used to understand human mobility and transportation patterns using GPS-based big data [8]. It can automatically simulate or predict the persons’ future movements and their transportation mode in the large-scale transportation network. DeepSpace, an online learning system based on CNN, can deal with the continuous mobile data stream and provide multi-scale prediction models to analyse the mobile big data to predict human trajectories [52]. Future studies can extend along this direction to create intelligent databases, platforms, models, and systems that can be used in the diverse field of disease control and prevention, smart city planning, environmental management, and ecological conservation where human mobility intertwines with the surrounding environment.
5.4. The Contribution of Human Mobility Studies to Social Good
Through involving multi-source mobility data and developing advanced mobility models, future HMR studies can contribute to several aspects of social good, including but not limited to promoting population health, designing sustainable smart cities, and providing humanitarian supports to conflicts, wars, and natural disasters.
The first aspect of social good is to improve population health. The development of human genomic technology strengthens our understanding of the relationship between human mobility and the development of genetic diseases [54]. In the context of worldwide migration, moving to a new environment causes genetic adaptation, which could further affect disease susceptibility. For example, the genetic risk of Type 2 diabetes decreased worldwide as people migrated from Africa to East Asia [55]. Additionally, human mobility is an important factor in the geographic spread of contagious diseases. Understanding human mobility helps to control the distribution of contagious diseases, including malaria [27], HIV [56], dengue fever [57] and COVID-19 pandemic [58,59]. The effectiveness of disease control can be estimated by measuring the association between disease distribution and human mobility histories before and after disease control. This application has been widely used to evaluate policies and interventions that restrict population movement during the COVID-19 pandemic [58,59]. For instance, since the outbreak of COVID-19 in early 2020, there have been numerous studies exploring the association between human mobility and COVID-19 transmission, and using mobility data to develop models for the simulation and prediction of virus spread [60]. Current studies indicate that the timing, effectiveness, and stringency of policy implementation are crucial for the success of COVID-19 control efforts in different countries [61]. The early implementation of social and mobility restrictions is especially effective in lowering the peak value of new infections and reducing the infection scale [62]. These studies have contributed in various ways to the COVID-19 control and intervention globally (e.g., China, US, and European countries) [63,64,65].
The second aspect of social good is to help build smart and more safe cities. Given the current immobility caused by COVID-19 in 2020, studies on the resilience, virtuality, and sustainability of smart cities are the most promising domains in urban science research. The construction of smart cities can integrate the simulation and prediction of human mobility to improve transport planning, service and infrastructure planning, human settlement, public security, and citizens’ quality of life [66,67,68]. In transport planning, mobility information can be used to monitor and predict traffic dynamics, including traffic flows, congestions, and accidents, by better understanding the supply and demand of the public transport system to improve its efficiency [69,70,71,72]. In service and infrastructure planning, human mobility to visit particular locations (e.g., shopping centres) indicates the demand for its location and services [73]. Measuring the mobility to certain infrastructures can guide urban planning to improve more equal distribution of public facilities and services in cities [69]. In human settlement and migration, mobility flows between suburbs can be used to locate residential concentrations where the development of real estate is most needed [74]. In public safety, tracking people’s daily routine routes that are usually repetitive travel between the home and workplace on weekdays can be used to detect individuals’ abnormal behaviours and atypical activities for the prevention of crimes [69].
The third aspect of social good is to provide humanitarian supports for people to cope with natural disasters and social conflicts. Simulating the historical settlement pathway of people forcibly displaced by the effects of climate change, conflicts, wars, and other catastrophic events can help to predict human displacement in future, and accordingly to promote humanitarian responses to protect their resettlement [75,76,77]. Such modelling work that needs to involve the measures of human mobility is particularly important for low-lying coastal regions where an extensive number of large cities are nested in face of natural disasters caused by sea-level rise, storm surges, tsunami, and flooding [78]. The measures of human mobility can be controlled as parameters in predictive models, reflecting different scenarios of human adaptation and response to natural disasters and social conflicts [79]. Such mobility-oriented applications are promising in future studies given the complexity of real-world issues and the uncertainty of human-environment interactions.
6. Conclusions
We present a systematic literature review of HMR studies published from 1990 to 2020 by a bibliometric analysis and network visualisation. In doing this, we analyse 5728 HMR related publications retrieved from WOS to identify the emerging trends, popular domains and research frontiers in the field of human mobility. Over the past three decades, HMR studies have become increasingly interdisciplinary, multi-dimensional, and edge leading by involving multi-source big data, innovative modelling approaches, cutting edge technologies, and novel applications in multi-disciplinary areas. Based on the evolutional pathway revealed in this study, we recommend future research directions in the areas concerning data sources, modelling methods, applications, and technologies. Considering the importance of human mobility in people’s daily life, we advocate for future research to address real-world problems and contribute to social good using multi-source big data and advanced modelling methods, including artificial intelligence, and machine and deep learning techniques. We call for multi-disciplinary contributions to enhance HMR studies and to explore human-environment relationship and interaction.
Author Contributions
Conceptualization, S.W., M.Z., T.H. and X.F.; methodology, S.W., M.Z., X.F. and T.H.; software, S.W.; formal analysis, S.W.; investigation, S.W., M.Z., T.H., X.F. and Z.G.; resources, Y.L.; data curation, S.W.; writing—original draft preparation, S.W., M.Z., T.H., X.F. and B.H.; writing—review and editing, Y.L., Z.G. and B.H.; visualization, S.W.; supervision, Y.L.; project administration, S.W. and Y.L.; funding acquisition, Y.L. and T.H. All authors have read and agreed to the published version of the manuscript.
Funding
This research was jointly funded by an Australian Research Council Discovery Grant [DP170104235] and two National Science Foundation of China grants [#1841403 and #2027540).
Institutional Review Board Statement
Not Applicable.
Informed Consent Statement
Not Applicable.
Data Availability Statement
The data presented in this study are openly available in Web of Science at https://login.webofknowledge.com/error/Error?Src=IP&Alias=WOK5&Error=IPError&Params=&PathInfo=%2F&RouterURL=https%3A%2F%2Fwww.webofknowledge.com%2F&Domain=.webofknowledge.com.
Conflicts of Interest
The authors declare no conflict of interest.
References
- Hasan, S.; Schneider, C.M.; Ukkusuri, S.V.; González, M.C. Spatiotemporal patterns of urban human mobility. J. Stat. Phys. 2013, 151, 304–318. [Google Scholar] [CrossRef]
- González, M.C.; Hidalgo, C.A.; Barabási, A.-L. Understanding individual human mobility patterns. Nature 2008, 453, 779–782. [Google Scholar] [CrossRef] [PubMed]
- Hannam, K.; Sheller, M.; Urry, J. Mobilities, immobilities and moorings. Mobilities 2006, 1, 1–22. [Google Scholar] [CrossRef]
- Sheller, M.; Urry, J. Mobilizing the new mobilities paradigm. Appl. Mobilities 2016, 1, 10–25. [Google Scholar] [CrossRef]
- Barbosa, H.; Barthelemy, M.; Ghoshal, G.; James, C.R.; Lenormand, M.; Louail, T.; Menezes, R.; Ramasco, J.J.; Simini, F.; Tomasini, M. Human mobility: Models and applications. Phys. Rep. 2018, 734, 1–74. [Google Scholar] [CrossRef]
- Pappalardo, L.; Barlacchi, G.; Pellungrini, R.; Simini, F. Human Mobility from theory to practice: Data, Models and Applications. In Proceedings of the 2019 World Wide Web Conference, San Francisco, CA, USA, 13–17 May 2019. [Google Scholar]
- Jurdak, R.; Zhao, K.; Liu, J.; Aboujaoude, M.; Cameron, M.; Newth, D. Understanding human mobility from Twitter. PLoS ONE 2015, 10, e0131469. [Google Scholar] [CrossRef]
- Song, X.; Kanasugi, H.; Shibasaki, R. Deeptransport: Prediction and simulation of human mobility and transportation mode at a citywide level. In Proceedings of the Twenty-Fifth International Joint Conference on Artificial Intelligence, New York, NY, USA, 9–15 July 2016; pp. 2618–2624. [Google Scholar]
- Faulconbridge, J.; Hui, A. Traces of a mobile field: Ten years of mobilities research. Mobilities 2016, 11, 1–14. [Google Scholar] [CrossRef]
- Hugher, C. Population mobility in the USA. Am. J. Sociol. 1930, 36, 145–146. [Google Scholar]
- Corbally, J. Measures of intra-urban mobility. Sociol. Soc. Res. 1930, 14, 547–552. [Google Scholar]
- Bañgate, J.; Dugdale, J.; Adam, C.; Beck, E. A Review on the influence of social attachment on human mobility during rises. In Proceedings of the 14th ISCRAM Conference, Albi, France, 21–24 May 2017; pp. 110–126. [Google Scholar]
- Wang, D.; Pedreschi, D.; Song, C.; Giannotti, F.; Barabasi, A.L. Human mobility, social ties, and link prediction. In Proceedings of the 17th ACM SIGKDD international conference on Knowledge discovery and data mining, San Diego, CA, USA, 21–24 August 2011; pp. 1100–1108. [Google Scholar]
- Zhao, K.; Tarkoma, S.; Liu, S.; Vo, H. Urban human mobility data mining: An overview. In Proceedings of the 2016 IEEE International Conference on Big Data (Big Data), Washington, DC, USA, 5–8 December 2016; pp. 1911–1920. [Google Scholar]
- Ellegaard, O.; Wallin, J.A. The bibliometric analysis of scholarly production: How great is the impact? Scientometrics 2015, 105, 1809–1831. [Google Scholar] [CrossRef]
- Jaffe, A.B.; Trajtenberg, M. International knowledge flows: Evidence from patent citations. Econ. Innov. New Technol. 1999, 8, 105–136. [Google Scholar] [CrossRef]
- Börner, K.; Penumarthy, S.; Meiss, M.; Ke, W. Mapping the diffusion of scholarly knowledge among major US research institutions. Scientometrics 2006, 68, 415–426. [Google Scholar] [CrossRef]
- Chen, C. CiteSpace II: Detecting and visualizing emerging trends and transient patterns in scientific literature. J. Am. Soc. Inf. Sci. Technol. 2006, 57, 359–377. [Google Scholar] [CrossRef]
- Van Eck, N.J.; Waltman, L. Software survey: VOSviewer, a computer program for bibliometric mapping. Scientometrics 2010, 84, 523–538. [Google Scholar] [CrossRef]
- Australian Bureau of Statistics. 1297.0—Australian Standard Research Classification (ASRC). Available online: https://www.abs.gov.au/AUSSTATS/abs@.nsf/second+level+view?ReadForm&prodno=1297.0&viewtitle=Australian%20Standard%20Research%20Classification%20(ASRC)~1998~Previous~28/08/1998&&tabname=Past%20Future%20Issues&prodno=1297.0&issue=1998&num=&view=& (accessed on 5 December 2020).
- Song, C.; Qu, Z.; Blumm, N.; Barabási, A.L. Limits of predictability in human mobility. Science 2010, 327, 1018–1021. [Google Scholar] [CrossRef] [PubMed]
- Simini, F.; González, M.C.; Maritan, A.; Barabási, A.-L. A universal model for mobility and migration patterns. Nature 2012, 484, 96–100. [Google Scholar] [CrossRef] [PubMed]
- Rhee, I.; Shin, M.; Hong, S.; Lee, K.; Kim, S.J.; Chong, S. On the levy-walk nature of human mobility. IEEE/ACM Trans. Netw. 2011, 19, 630–643. [Google Scholar] [CrossRef]
- Schneider, C.M.; Belik, V.; Couronné, T.; Smoreda, Z.; González, M.C. Unravelling daily human mobility motifs. J. R. Soc. Interface 2013, 10, 20130246. [Google Scholar] [CrossRef]
- Google Community Mobility Reports. Available online: https://www.google.com/covid19/mobility/ (accessed on 5 December 2020).
- Song, C.; Koren, T.; Wang, P.; Barabási, A.-L. Modelling the scaling properties of human mobility. Nat. Phys. 2010, 6, 818–823. [Google Scholar] [CrossRef]
- Wesolowski, A.; Eagle, N.; Tatem, A.J.; Smith, D.L.; Noor, A.M.; Snow, R.W.; Buckee, C.O. Quantifying the impact of human mobility on Malaria. Science 2012, 338, 267–270. [Google Scholar] [CrossRef]
- Balcan, D.; Colizza, V.; Goncalves, B.; Hu, H.; Ramasco, J.J.; Vespignani, A. Multiscale mobility networks and the spatial spreading of infectious diseases. Proc. Natl. Acad. Sci. USA 2009, 106, 21484–21489. [Google Scholar] [CrossRef]
- Hawelka, B.; Sitko, I.; Beinat, E.; Sobolevsky, S.; Kazakopoulos, P.; Ratti, C. Geo-located Twitter as proxy for global mobility patterns. Cartogr. Geogr. Inf. Sci. 2014, 41, 260–271. [Google Scholar] [CrossRef] [PubMed]
- Noulas, A.; Scellato, S.; Lambiotte, R.; Pontil, M.; Mascolo, C. A tale of many cities: Universal patterns in human urban mobility. PLoS ONE 2012, 7, e37027. [Google Scholar] [CrossRef]
- Alexander, L.; Jiang, S.; Murga, M.; González, M.C. Origin–destination trips by purpose and time of day inferred from mobile phone data. Transp. Res. Part C Emerg. Technol. 2015, 58, 240–250. [Google Scholar] [CrossRef]
- Okraszewska, R.; Romanowska, A.; Wołek, M.; Oskarbski, J.; Birr, K.; Jamroz, K. Integration of a multilevel transport system model into sustainable urban mobility planning. Sustainability 2018, 10, 479. [Google Scholar] [CrossRef]
- Liu, Y.; Wang, S.; Xie, B. Evaluating the effects of public transport fare policy change together with built and non-built environment features on ridership: The case in South East Queensland, Australia. Transp. Policy 2019, 76, 78–89. [Google Scholar] [CrossRef]
- Jiang, S.; Ferreira, J.; Gonzalez, M.C. Activity-based human mobility patterns inferred from mobile phone data: A case study of Singapore. IEEE Trans. Big Data 2017, 3, 208–219. [Google Scholar] [CrossRef]
- Huang, X.; Li, Z.; Jiang, Y.; Ye, X.; Deng, C.; Zhang, J.; Li, X. The characteristics of multi-source mobility datasets and how they reveal the luxury nature of social distancing in the U.S. during the COVID-19 pandemic. Int. J. Digit. Earth 2021, 14, 424–442. [Google Scholar] [CrossRef]
- Li, Z.; Huang, X.; Ye, X.; Li, X. ODT flow explorer: Extract, query, and visualize human mobility. arXiv 2020, arXiv:2011.12958. [Google Scholar]
- Huang, X.; Li, Z.; Jiang, Y.; Li, X.; Porter, D. Twitter reveals human mobility dynamics during the COVID-19 pandemic. PLoS ONE 2020, 15, e0241957. [Google Scholar] [CrossRef]
- De Montjoye, Y.-A.; Hidalgo, C.A.; Verleysen, M.; Blondel, V.D. Unique in the crowd: The privacy bounds of human mobility. Sci. Rep. 2013, 3, 1376. [Google Scholar] [CrossRef] [PubMed]
- Jain, P.; Gyanchandani, M.; Khare, N. Big data privacy: A technological perspective and review. J. Big Data 2016, 3, 25. [Google Scholar] [CrossRef]
- D’Andrea, A.; Ciolfi, L.; Gray, B. Methodological challenges and innovations in mobilities research. Mobilities 2011, 6, 149–160. [Google Scholar] [CrossRef]
- Wang, S.; Liu, Y.; Hu, T. Examining the change of human mobility adherent to social restriction policies and its effect on COVID-19 cases in Australia. Int. J. Environ. Res. Public Health 2020, 17, 7930. [Google Scholar] [CrossRef]
- Bian, X.; Kim, C.; Karniadakis, G.E. 111 years of Brownian motion. Soft Matter 2016, 12, 6331–6346. [Google Scholar] [CrossRef] [PubMed]
- Brockmann, D.; Hufnagel, L.; Geisel, T. The scaling laws of human travel. Nature 2006, 439, 462–465. [Google Scholar] [CrossRef]
- Sen, A.; Smith, T.E. Gravity Models of Spatial Interaction Behavior; Springer: Berlin/Heidelberg, Germany, 2012. [Google Scholar]
- Yan, X.-Y.; Wang, W.-X.; Gao, Z.-Y.; Lai, Y.-C. Universal model of individual and population mobility on diverse spatial scales. Nat. Commun. 2017, 8, 1639. [Google Scholar] [CrossRef] [PubMed]
- Boccaletti, S.; Bianconi, G.; Criado, R.; del Genio, C.I.; Gómez-Gardeñes, J.; Romance, M.; Sendiña-Nadal, I.; Wang, Z.; Zanin, M. The structure and dynamics of multilayer networks. Phys. Rep. 2014, 544, 1–122. [Google Scholar] [CrossRef]
- Kivelä, M.; Arenas, A.; Barthelemy, M.; Gleeson, J.P.; Moreno, Y.; Porter, M.A. Multilayer networks. J. Complex Netw. 2014, 2, 203–271. [Google Scholar] [CrossRef]
- Gallotti, R.; Barthelemy, M. Anatomy and efficiency of urban multimodal mobility. Sci. Rep. 2015, 4, 6911. [Google Scholar] [CrossRef] [PubMed]
- Alessandretti, L.; Karsai, M.; Gauvin, L. User-based representation of time-resolved multimodal public transportation networks. R. Soc. Open Sci. 2016, 3, 160156. [Google Scholar] [CrossRef]
- Xu, J.; Lu, H.; Güting, R.H. Understanding human mobility: A multi-modal and intelligent moving objects database. In Proceedings of the 16th International Symposium on Spatial and Temporal Databases, Vienna, Austria, 19–21 August 2019; pp. 222–225. [Google Scholar]
- Kim, D.Y.; Song, H.Y. Method of predicting human mobility patterns using deep learning. Neurocomputing 2018, 280, 56–64. [Google Scholar] [CrossRef]
- Ouyang, X.; Zhang, C.; Zhou, P.; Jiang, H.; Gong, S. DeepSpace: An online deep learning framework for mobile big data to understand human mobility patterns. arXiv 2018, arXiv:1610.07009. [Google Scholar]
- Song, X.; Shibasaki, R.; Yuan, N.J.; Xie, X.; Li, T.; Adachi, R. DeepMob: Learning deep knowledge of human emergency behavior and mobility from big and heterogeneous data. ACM Trans. Inf. Syst. 2017, 35, 41. [Google Scholar] [CrossRef]
- Huang, X.; Lu, J.; Gao, S.; Wang, S.; Liu, Z.; Wei, H. Staying at home is a privilege: Evidence from fine-grained mobile phone location data in the U.S. during the COVID-19 pandemic. Ann. Am. Assoc. Geogr. 2021. [Google Scholar] [CrossRef]
- Corona, E.; Chen, R.; Sikora, M.; Morgan, A.A.; Patel, C.J.; Ramesh, A.; Bustamante, C.D.; Butte, A.J. Analysis of the genetic basis of disease in the context of worldwide human relationships and migration. PLoS Genet. 2013, 9, e1003447. [Google Scholar] [CrossRef]
- Isdory, A.; Mureithi, E.W.; Sumpter, D.J. The impact of human mobility on HIV transmission in Kenya. PLoS ONE 2015, 10, e0142805. [Google Scholar] [CrossRef]
- Wesolowski, A.; Qureshi, T.; Boni, M.F.; Sundsøy, P.R.; Johansson, M.A.; Rasheed, S.B.; Engø-Monsen, K.; Buckee, C.O. Impact of human mobility on the emergence of dengue epidemics in Pakistan. Proc. Natl. Acad. Sci. USA 2015, 112, 11887–11892. [Google Scholar] [CrossRef]
- Kraemer, M.U.; Yang, C.-H.; Gutierrez, B.; Wu, C.-H.; Klein, B.; Pigott, D.M.; Du Plessis, L.; Faria, N.R.; Li, R.; Hanage, W.P. The effect of human mobility and control measures on the COVID-19 epidemic in China. Science 2020, 368, 493–497. [Google Scholar] [CrossRef]
- Hadjidemetriou, G.M.; Sasidharan, M.; Kouyialis, G.; Parlikad, A.K. The impact of government measures and human mobility trend on COVID-19 related deaths in the UK. Transp. Res. Interdiscip. Perspect. 2020, 6, 100167. [Google Scholar] [CrossRef]
- Zhang, M.; Wang, S.; Hu, T.; Fu, X.; Wang, X.; Hu, Y.; Bao, S. Human mobility and COVID-19 transmission: A systematic review and future directions. medRxiv 2021. [Google Scholar] [CrossRef]
- Kaur, S.; Bherwani, H.; Gulia, S.; Vijay, R.; Kumar, R. Understanding COVID-19 transmission, health impacts and mitigation: Timely social distancing is the key. Environ. Dev. Sustain. 2020, 23, 6681–6697. [Google Scholar] [CrossRef] [PubMed]
- Adey, P.; Hannam, K.; Sheller, M.; Tyfield, D. Pandemic (Im)mobilities. Mobilities 2021, 16, 1–19. [Google Scholar] [CrossRef]
- Alfano, V.; Ercolano, S. The efficacy of lockdown against COVID-19: A cross-country panel analysis. Appl. Health Econ. Health Policy 2020, 18, 509–517. [Google Scholar] [CrossRef]
- O’Sullivan, D.; Gahegan, M.; Exeter, D.J.; Adams, B. Spatially explicit models for exploring COVID-19 lockdown strategies. Trans. GIS 2020, 24, 967–1000. [Google Scholar] [CrossRef]
- Cresswell, T. Valuing mobility in a post COVID-19 world. Mobilities 2021, 16, 51–65. [Google Scholar] [CrossRef]
- Nam, T.; Pardo, T.A. Conceptualizing smart city with dimensions of technology, people, and institutions. In Proceedings of the 12th Annual International Digital Government Research Conference: Digital Government Innovation in Challenging Times, College Park, ML, USA, 12–15 June 2011; pp. 282–291. [Google Scholar]
- Urry, J. Mobilities: New Perspectives on Transport and Society; Routledge: Milton, UK, 2016. [Google Scholar]
- Hillier, B.; Turner, A.; Yang, T.; Park, H.T. Metric and topo-geometric properties of urban street networks: Some convergences, divergences and new results. J. Space Syntax Stud. 2009. Available online: https://discovery.ucl.ac.uk/id/eprint/18583/1/18583.pdf (accessed on 5 December 2020).
- Pan, G.; Qi, G.; Zhang, W.; Li, S.; Wu, Z.; Yang, L.T. Trace analysis and mining for smart cities: Issues, methods, and applications. IEEE Commun. Mag. 2013, 51, 120–126. [Google Scholar] [CrossRef]
- Bienzeisler, L.; Lelke, T.; Wage, O.; Thiel, F.; Friedrich, B. Development of an agent-based transport model for the city of hanover using empirical mobility data and data fusion. Transp. Res. Procedia 2020, 47, 99–106. [Google Scholar] [CrossRef]
- Canzler, W.; Knie, A. Mobility in the age of digital modernity: Why the private car is losing its significance, intermodal transport is winning and why digitalisation is the key. Appl. Mobilities 2016, 1, 56–67. [Google Scholar] [CrossRef]
- Liu, G.; Krishnamurthy, S.; Wesemael, P.J.V. Conceptualizing cycling experience in urban design research: A systematic literature review. Appl. Mobilities 2018, 6, 1–17. [Google Scholar] [CrossRef]
- Kitamura, R.; Chen, C.; Pendyala, R.M.; Narayanan, R. Micro-simulation of daily activity-travel patterns for travel demand forecasting. Transportation 2000, 27, 25–51. [Google Scholar] [CrossRef]
- Sirkeci, I.; Cohen, J.H. Cultures of migration and conflict in contemporary human mobility in Turkey. Eur. Rev. 2016, 24, 381–396. [Google Scholar] [CrossRef]
- Afifi, T.; Milan, A.; Etzold, B.; Schraven, B.; Rademacher-Schulz, C.; Sakdapolrak, P.; Reif, A.; Van Der Geest, K.; Warner, K. Human mobility in response to rainfall variability: Opportunities for migration as a successful adaptation strategy in eight case studies. Migr. Dev. 2016, 5, 254–274. [Google Scholar] [CrossRef]
- Bengtsson, L.; Lu, X.; Thorson, A.; Garfield, R.; Von Schreeb, J. Improved response to disasters and outbreaks by tracking population movements with mobile phone network data: A post-earthquake geospatial study in Haiti. PLoS Med. 2011, 8, e1001083. [Google Scholar] [CrossRef]
- Bank, A.; Fröhlich, C.; Schneiker, A. The political dynamics of human mobility: Migration out of, as and into violence. Glob. Policy 2017, 8, 12–18. [Google Scholar] [CrossRef]
- Adey, P. Emergency mobilities. Mobilities 2016, 11, 32–48. [Google Scholar] [CrossRef]
- Liu, Y.; Batty, M.; Wang, S.; Corcoran, J. Modelling urban change with cellular automata: Contemporary issues and future research directions. Prog. Hum. Geogr. 2019, 45, 3–24. [Google Scholar] [CrossRef]


Publisher’s Note: MDPI stays neutral with regard to jurisdictional claims in published maps and institutional affiliations. |
© 2021 by the authors. Licensee MDPI, Basel, Switzerland. This article is an open access article distributed under the terms and conditions of the Creative Commons Attribution (CC BY) license (https://creativecommons.org/licenses/by/4.0/).