Article

Impacts of Olive Waste-Derived Biochar on Hydro-Physical Properties of Sandy Soil

by
Abdulaziz G. Alghamdi
1,*,
Bandar H. Aljohani
1 and
Anwar A. Aly
1,2
1
Soil Sciences Department, College of Food and Agricultural Sciences, King Saud University, P.O. Box 2460, Riyadh 11451, Saudi Arabia
2
Soil and Water Science Department, Faculty of Agriculture, Alexandria University, Alexandria 12311, Egypt
*
Author to whom correspondence should be addressed.
Sustainability 2021, 13(10), 5493; https://doi.org/10.3390/su13105493
Submission received: 15 April 2021 / Revised: 3 May 2021 / Accepted: 10 May 2021 / Published: 14 May 2021

Abstract

:
In this study, waste olive leaves and branches were pyrolyzed to produced biochar, and their impacts on physical and chemical properties of a sandy soil were evaluated. Pyrolytic temperatures of 300 °C, 400 °C, and 500 °C were used for biochar production. After evaluating the physio-chemical properties, the produced biochars were added to the top 10 cm layer of the soil at rates of 0%, 1%, 3%, and 5% in a column experiment at 25 °C. Biochar was mixed with a sandy soil into the top 10 cm of the columns. For all treatments, cumulative evaporation was reduced; however, treatments with 5% biochar prepared at the highest temperatures showed the highest impact. The available water contents were increased by 153.33% and 151.11% when olive branch-derived biochar and olive leaves-derived biochars produced at 500 °C were applied at 5% rate, respectively. No impact of available water was observed for 1% biochar contribution. Biochar application decreased both cumulative infiltration and infiltration rate. Biochar pyrolyzed at 500 °C most intensely improved hydro-physical properties of a sandy soil. However, its application as a soil supplement in arid environments should be adopted with constraints due to its high pH (9.69 and 9.29 for biochar pyrolyzed at the highest temperatures) and salinity (up to electrical conductivity = 5.07 dS m−1). However, the salinity of biochar prepared from olive branches (5%, pyrolyzed at 500 °C) was low (0.79 dS m−1); therefore, it can be used safely as a supplement in saline and acidic soils, but with restriction in alkaline soils.

1. Introduction

During the past three decades, a concern of climate change, soil crop production, and protection of environment has increased overdramatically [1,2,3]. More integrated research and investigation of sustainable technology concepts have been conducted. Biochar, a soil amendment, is defined as a rich carbon product produced by pyrolysis of organic residues under limited oxygen conditions [4,5]. The biochar is resistant to soil microorganism’s decomposition; consequently, has two environmental benefits; enhancing soil quality and productivity, and acting as a sink of carbon, leading to a decrease in the emissions of greenhouse gas into the environment and an increase in crops production [6,7,8]. In this regard, Ibrahim et al. [8] said that the biochar application to the soils enhance their physio-chemical properties and help to mitigate the undesirable effect of global warming. The biochar is characterized by high negative surface charge and cation exchange capacity, large surface area, high porous structure, and high water and nutrient retention [7,8]. Consequently, adding biochar improves soil physical and chemical properties by increasing the ability of the soil to adsorb water and nutrients [9,10,11]. Furthermore, the biochar high porosity increases the capacity of soil to hold water at field capacity (FC) and decrease soil bulk density [12,13,14]. The Kingdom of Saudi Arabia (KSA) has a climate that ranges from arid to semi-arid and most of the soils are sandy, containing high amounts of calcium carbonate due to both high temperatures and lack of precipitation [1]. The KSA soils are also characterized by low organic matter content, low fertility, and low amounts of available water (AW) [2]. The KSA has limited freshwater resources and depends on groundwater as its main source of irrigation water [3]. Water-use efficiency is low due to high rates of soil infiltration. Therefore, it is important to add soil conditioners to increase water consumption for agricultural use [4]. Commonly used soil conditioners include natural, industrial, and organic types. They can improve soil physical and chemical properties, such as texture, structure, bulk density, and cation exchange capacity, thus increasing the soil’s ability to conserve both nutrients and water that further increase crop productivity [5].
Adding biochar to soil as a conditioner has positive effects on both crop yield and soil properties [4]. However, its impacts depend upon the feedstock source, pyrolytic temperature, and application rate. Addition of biochar to soil results in favorable changes in its properties, such as porosity, pore size distribution, aeration, bulk density, specific surface area, and fertility [4,6]. Alkhasha et al. [6] found that the addition of date palm biochar at a 2% application rate enhanced the ability of soil to conserve water by 68% and decreased both hydraulic conductivity and infiltration rate, which improved crop productivity in sandy soils. Ibrahim et al. [7,8] showed that the addition of biochar obtained from Conocarpus sp. to a sandy loam soil resulted in a decrease of cumulative evaporation rate and in an increased ability of the soil to hold water. Al-Omran et al. [9] researched the effect of the application of either date palm biochar, compost or their mixture on the hydro-physical properties of a sandy loam soil and found that, in all treatments, both daily and cumulative evaporation decreased by increasing the addition rates. They also showed that the addition of both biochar and compost had an impact on infiltration rate, cumulative infiltration, saturated hydraulic conductivity, and the ability of soil to retain water. Igalavithana et al. [10] found that the biochar made from corn (Zea mays) residues improved the hydraulic properties of a sandy loam soil. Additionally, Randolph et al. [11] found that the biochar made from municipal organic waste (newsprint, cardboard, wood pieces, and garden waste) generally increased the ability of the soil to hold water. Biochar made from cardboard and newsprint needed higher pyrolytic temperatures to improve soil hydro-physical properties.
Ulyett et al. [12] used a mixture of wood from fig, oak, beech, and peach as a source of biochar and added it to a loamy sandy soil. The addition of the biochar to the soil led to a decrease in bulk density and increased soil water retention, which was explained by the ability of pores present in biochar to hold water. Glab et al. [13], Mangrich et al. [14], and Alghamdi [5] concluded that pyrolytic temperature has a significant effect on the ability of biochar to improve soil hydro-physical properties.
Olive cultivation has increased dramatically in the KSA in many regions, such as Al-Jawf, Tabuk, and Hail. According to the statistical yearbook (for the year 2018) issued by the Olive Research Unit in Al-Jouf, Ministry of Environment, Water and Agriculture, the number of olive trees in the KSA reached 18 million, with olive oil production reaching 12 thousand tons. Remnants from olive cultivation are commonly used, such as products of pruning olive trees that are used for firewood. However, considerable quantities of waste from pruning and cutting olive trees throughout the season are not used. Therefore, this study focuses on the use of raw residues such as leaves and branches of olive trees to produce biochar, as well as on the investigation of its impact to improve physical properties of sandy soils.
While studies have been done to investigate the use of olive trees-derived biochar as a fertilizer [15,16], apparently no work has been done to determine the effect of olive biochar on soil physical properties. Therefore, in this study, olive biochar was added to a sandy soil and AW, hydraulic conductivity, and infiltration were measured. The research was done with the assumption that adding olive biochar to a sandy soil will improve its hydro-physical properties. Because the effects of biochar as a soil supplement vary according to the source of the raw material, the degree of pyrolysis, as well as the addition rate, the general objective of this study was to evaluate the effect of different application rates of olive biochar made either from leaves or branches, prepared at different pyrolytic temperatures, on hydro-physical properties of a sandy soil. In addition, cumulative evaporation, bulk density, infiltration rate, and water retention of the soil were measured.

2. Materials and Methods

2.1. Collecting and Preparing the Soil Sample

Samples of a sandy soil were collected from the surface (0–30 cm) at the Agricultural Research and Experiment Station of King Saud University in Dirab. The station is located about 35 km away from the City of Riyadh of 46°44′ E longitude and 24°39′ N latitude. The soil samples were prepared for laboratory analyses using a 2 mm-diameter sieve.

2.2. Collecting Olive Waste and Producing Biochar

Olive waste (leaves and olive branches) was collected from olive farms of National Agricultural Development Company (Nadec) in Al-Jawf region in the north of the KSA. The waste was air-dried and then transferred to the laboratory for further drying at 70 °C for 48 h. Subsequently, pyrolysis of the waste was carried out for 3 h in an oven without oxygen supply and at temperatures of either 300 °C, 400 °C or 500 °C. After pyrolysis, the resulting biochars were ground and sifted through a 2 mm sieve.

2.3. Soil and Biochar Analyses

Both soil electrical conductivity (ECe) and pH were determined using a saturated soil paste extract with a ratio of 1:10 biochar: water extract (w/w), and then a multi-parameter meter (Hanna, HI 9811-5, Bedfordshire, UK) was used to measure EC and pH. The organic matter content was estimated using an oxidation method that included potassium dichromate [17], while soil texture was determined by the hydrometer method after the removal of both organic matter and lime [18,19]. Sand, silt, and clay proportions were 91.3%, 0.02%, and 8.6%, respectively. Calcium carbonate was determined using a calcimeter method, as described by Sparks [20].

2.4. Carbon, Hydrogen, and Nitrogen (CHN) and Surface Area Analyses of Biochar

A proximate analysis of biochar samples (moisture, ash, volatile matter, and stable carbon) was performed according to the ASTM D1762-84 standard method [21]. The total contents of carbon, hydrogen, and nitrogen in the biochar samples were determined using a CHN analyzer (EuroEA Elemental Analyzer, Wegberg, Germany). A specific surface area was measured using an ASAP 2020 adsorption analyzer (Micromeritics, Norcross, GA, USA).

2.5. Column Experiment Setup

We used columns of acrylic material, 5 cm in diameter and 40 cm long (Figure 1A), which were sealed at the bottom using filter paper. The columns were filled with a sandy soil to a height of 30 cm. Biochar samples were subsequently added and mixed with the soil in the top 10 cm of each column. The biochar addition rates were 0%, 1%, 3% or 5% (0 g, 10 g, 30 g or 50 g biochar per kg of soil), which were combined with three different pyrolytic temperatures and two biochar types. There were four replicates for each treatment, including the control treatment, for a total of 76 columns (Table 1).

2.6. Cumulative Evaporation

Cumulative evaporation was recorded daily during five weeks of the experimental period by weighing the soil columns. In addition, wetting fronts were recorded daily for all samples.

2.7. Wetting and Evaporation Cycles

The water amount, provided to the soil columns throughout the five wetting/evaporation cycles, was 56.1 mm. At the end of the trial, the recovered water (evaporation + maintained) ranged between 95.2% and 100%.

2.8. Soil Moisture Distribution

Immediately at the end of the experiment, the soil columns were cut into sections from the top to the bottom. The sections were 2.5 cm thick to the depth of 10 cm; then each section was 5 cm thick to the depth of 25 cm; and, finally, there was a 10-cm depth section at the bottom of a column (Figure 1B). The moisture content in each section was estimated by drying the soil in an oven at 105 °C for 24 h. The amount of water in each column was calculated.

2.9. Soil Water Retention

Water retention of the soil was estimated for the treatments using the pressure plate method [22]. Samples were placed into rubber rings with a diameter of 5 cm and a height of 1 cm. Three replications of each treatment were saturated for 24 h. The retained soil water was measured at the following matric potentials: −0.1, −0.3, −0.5, −1, −2, −3, −5, −10, and −15 bars. Field capacity was considered to have matric potential of −0.3 bar. Permanent wilting point was considered to have matric potential of −15 bars. Field capacity (FC), permanent wilting point (PWP), and available water (AW) content were then obtained as follows:
AW = FC − PWP

2.10. Hydraulic Conductivity

The hydraulic conductivity was acquired using constant head test and the Darcy’s Equation (1)
Q At = K s h + L L
where Q is the volume of water collected from the soil (cm3), A is the cross-section of the soil (cm2), t denotes time (min), Ks is the saturated hydraulic conductivity (cm/min), h is the head of water above the saturated soil (cm), and L is the length of a soil sample (cm).

2.11. Infiltration Measurements

Infiltration rate was determined using a mini-disk infiltrometer (Model Ml1, 0.5 cm suction; Decagon Devices, Inc., Pullman, WA, USA) in 3 cm-diameter disks holding 100 cm3 of distilled water. The mini-disk infiltrometer was placed on the soil surface of each column. Three determinations of infiltration rate were carried out for each treatment. Starting at zero time, both the amount of infiltrated water and wetting front were monitored every minute [23]. Cumulative infiltration was calculated according to Philip [24] as:
I =   S   t 0.5 +   A 1 t  
where I is the cumulative infiltration (cm), S is the sorptivity (cm min−0.5), A1 is a constant related to the hydraulic conductivity (cm min−1), and t is time (min).

2.12. Experimental Design

The study was conducted in a laboratory (average temperature 25 °C) using acrylic columns and two different types of biochar, derived from either olive leaves or branches (Figure 2).

2.13. Statistical Analyses

The mean values of the analyzed parameters and their standard errors were calculated to determine their range (X ± S.E). Data were also statistically subjected to the analysis of variance. The least significance difference and Duncan’s multiple range test (DMRT) were performed [25] using SAS software (Cary, NC, USA).

3. Results and Discussion

3.1. Biochar Chemical Properties

For both olive leaves and branches, an increase of pyrolytic temperature led to an increase of the biochar pH (Table 2). These values increased from 7.87 to 9.69 and 8.37 to 9.29 for the biochar made of leaves and branches, respectively, when the pyrolytic temperature increased from 300 °C to 500 ° C. It is known that an increase in pyrolytic temperature leads to an increase in pH of feedstock [26,27]. Likewise, the increase of pyrolytic temperature led to a large increase in salinity of the biochar made from leaves. The EC of the biochar prepared from leaves increased from 0.62 to 5.07 dS m−1 when the pyrolytic temperature increased from 300 °C to 500 °C. Biochar characterized by a high salinity such as that used in the L500 treatment, can cause a large increase in soil salinity, especially when used in arid environments. Consequently, these types of biochar should be avoided under saline conditions [4,6]. However, biochar prepared from olive branches, using all the three experimental pyrolytic temperatures, had a low salinity, which reveals this biochar type to be safely employed under saline soil conditions.
An increase of pyrolytic temperature led to a decrease in cation exchange capacity (CEC), organic carbon, total organic carbon, and the organic matter of biochar (Table 2). These results are in agreement with previous findings by Tomczyk et al. [26].
Surface area, ash, and stable carbon increased as the pyrolytic temperatures increased; however, the concentration of hydrogen, nitrogen, and volatile matter decreased with the increase of the pyrolytic temperatures (Table 3). Tomczyk et al. [26] reported similar findings. As compared to the biochar made of leaves, the surface area of the biochar made of olive branches increased by a large amount when the pyrolytic temperature increased from 300 °C to 500 °C. The surface area of B500 was 154.8920 ± 3.9804 m2/g and it was 5.0949 ± 0.1676 m2/g for B300.
Rafiq et al. [28] reported that an increase in pyrolytic temperature led to increases in both surface area and biochar porosity. This is probably due to the degradation of organic matter and development of micropores [29]. Moreover, the decomposition of aliphatic alkyls and ester groups, and the contact of the aromatic lignin core under high pyrolytic temperatures, cause an increase in surface area [30]. At temperatures lower than 500 °C, lignin is not converted into a hydrophobic polycyclic aromatic hydrocarbon and biochar becomes more hydrophilic; however, at temperatures higher than 650 °C, biochar is thermally stable and becomes more hydrophobic [31].

3.2. Effect of Soil Supplements on Soil Physical Properties

3.2.1. Wetting, Evaporation Cycles, and Cumulative Evaporation

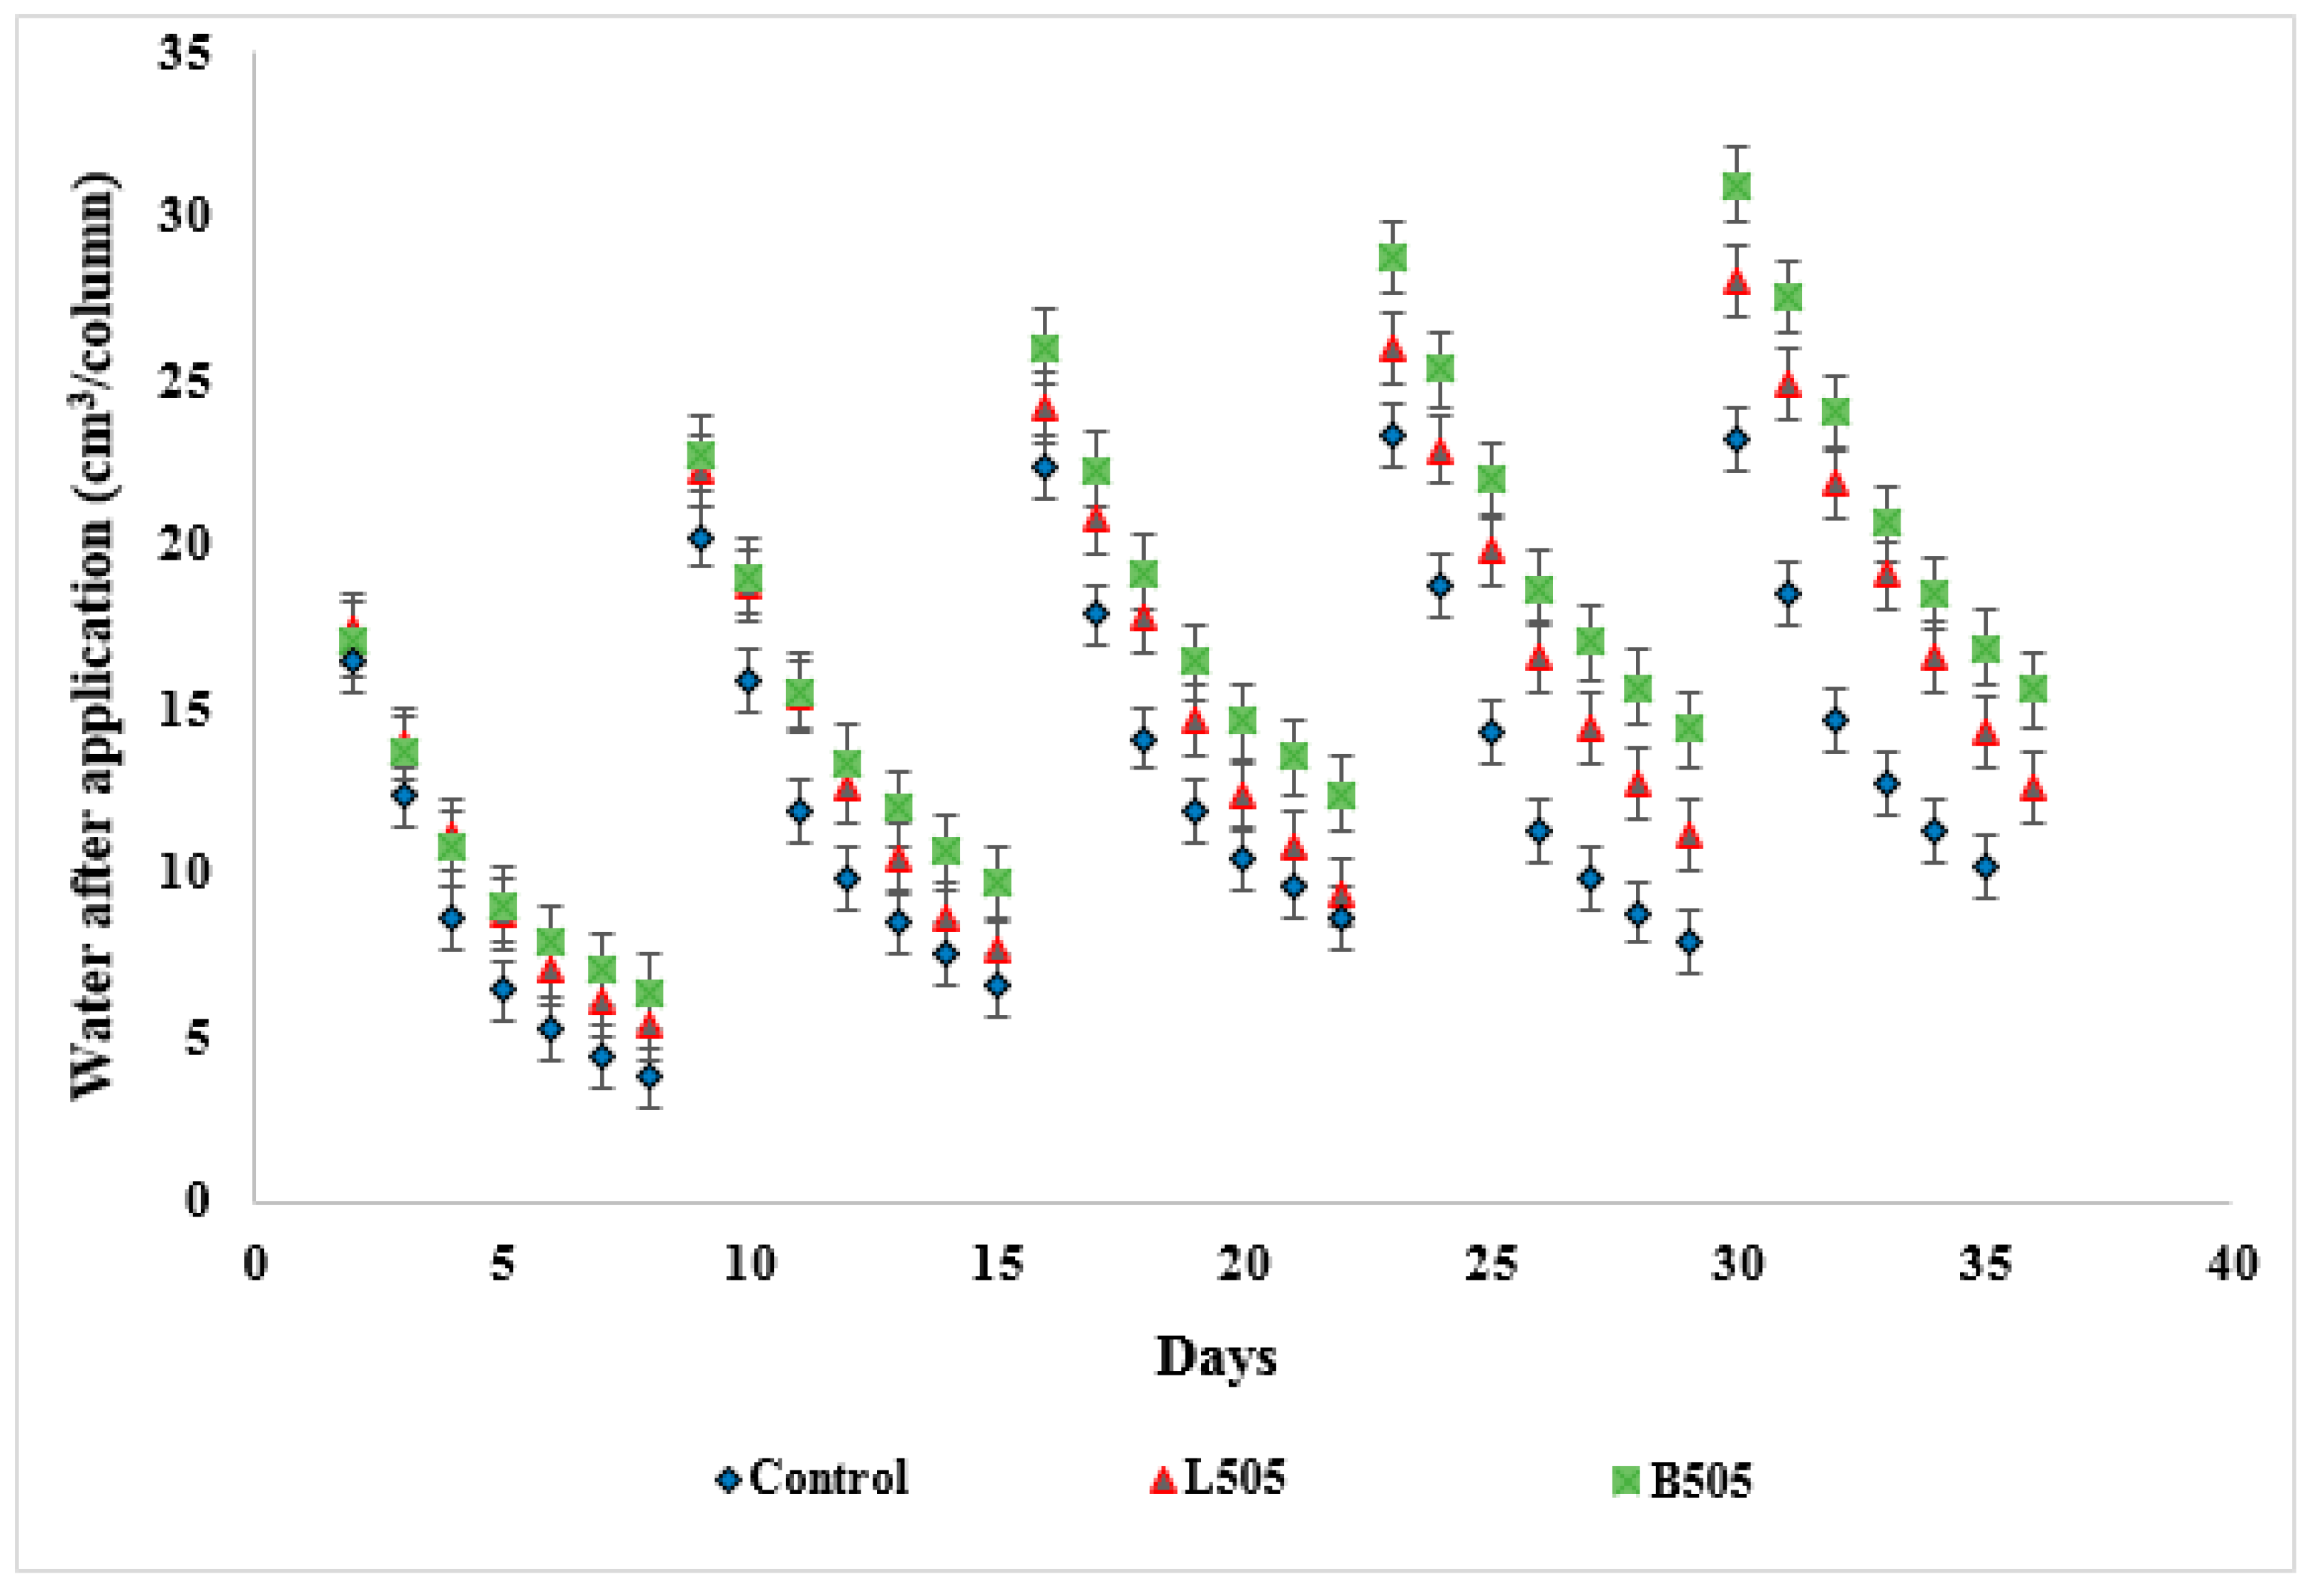
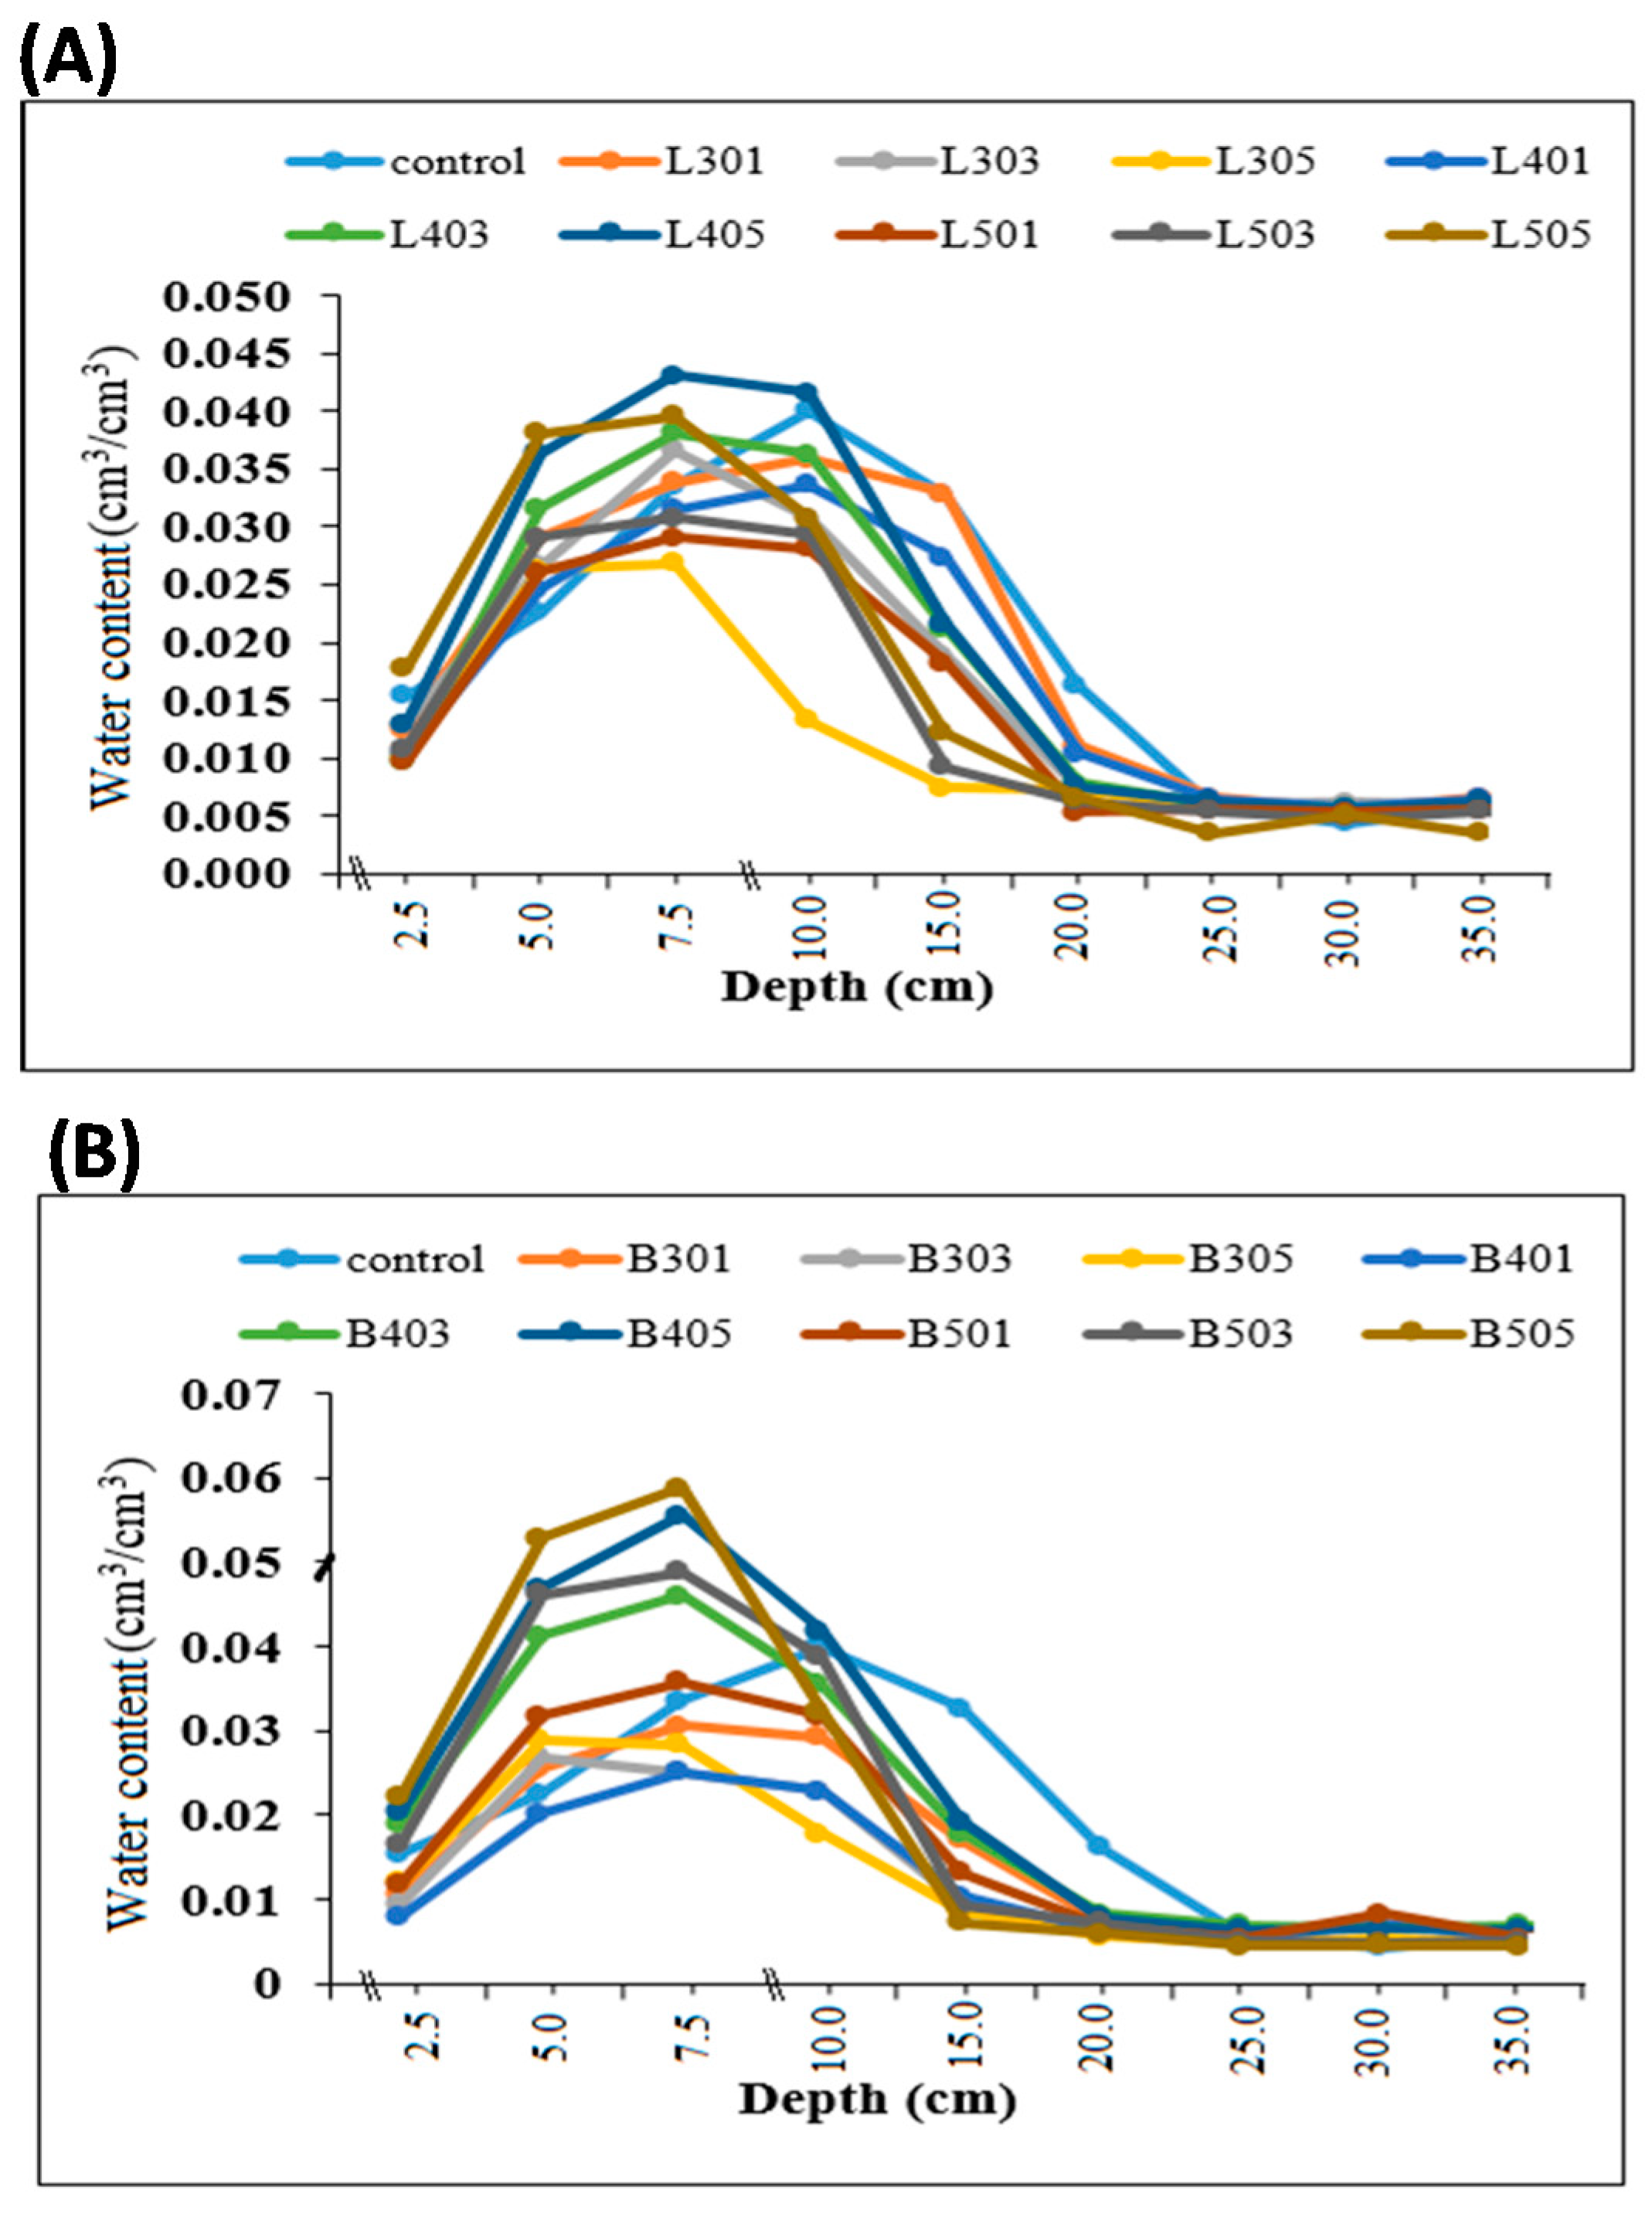
The water amount provided to the soil columns throughout five wetting and evaporation cycles was 56.1 mm. At the end of the experiment, the recovered water (evaporation + maintained) ranged between 95.2% and 100% (Table 4). In comparison to the control, cumulative evaporation decreased for all biochar treatments, while the retained water amounts increased. The highest decrease of retained water, after 35 days, was observed for the B505 and L505 treatments, scoring 37.3 and 37.4 mm, respectively, while the highest increase was recorded for the B405, B505, and L505 treatments, reaching 18.8, 18.7, and 18.7 mm, respectively [4,6] (Table 4 and Figure 3). All types of biochar increased the ability of the soil to hold water, with exceptions of B401, B305, and B405 (Figure 3), and the highest increase was observed for B505 and L505, followed by L501. Furthermore, biochar application increased the ability of the soil to hold water in the top 10 cm (Figure 4). In comparison to the control, the highest increases in this parameter were recorded for the B405, B505, L405, and L505 treatments, applied by 5% biochar application rate and 400 °C and 500 °C pyrolysis temperature from branches (B) or leaves (L) [13,14].
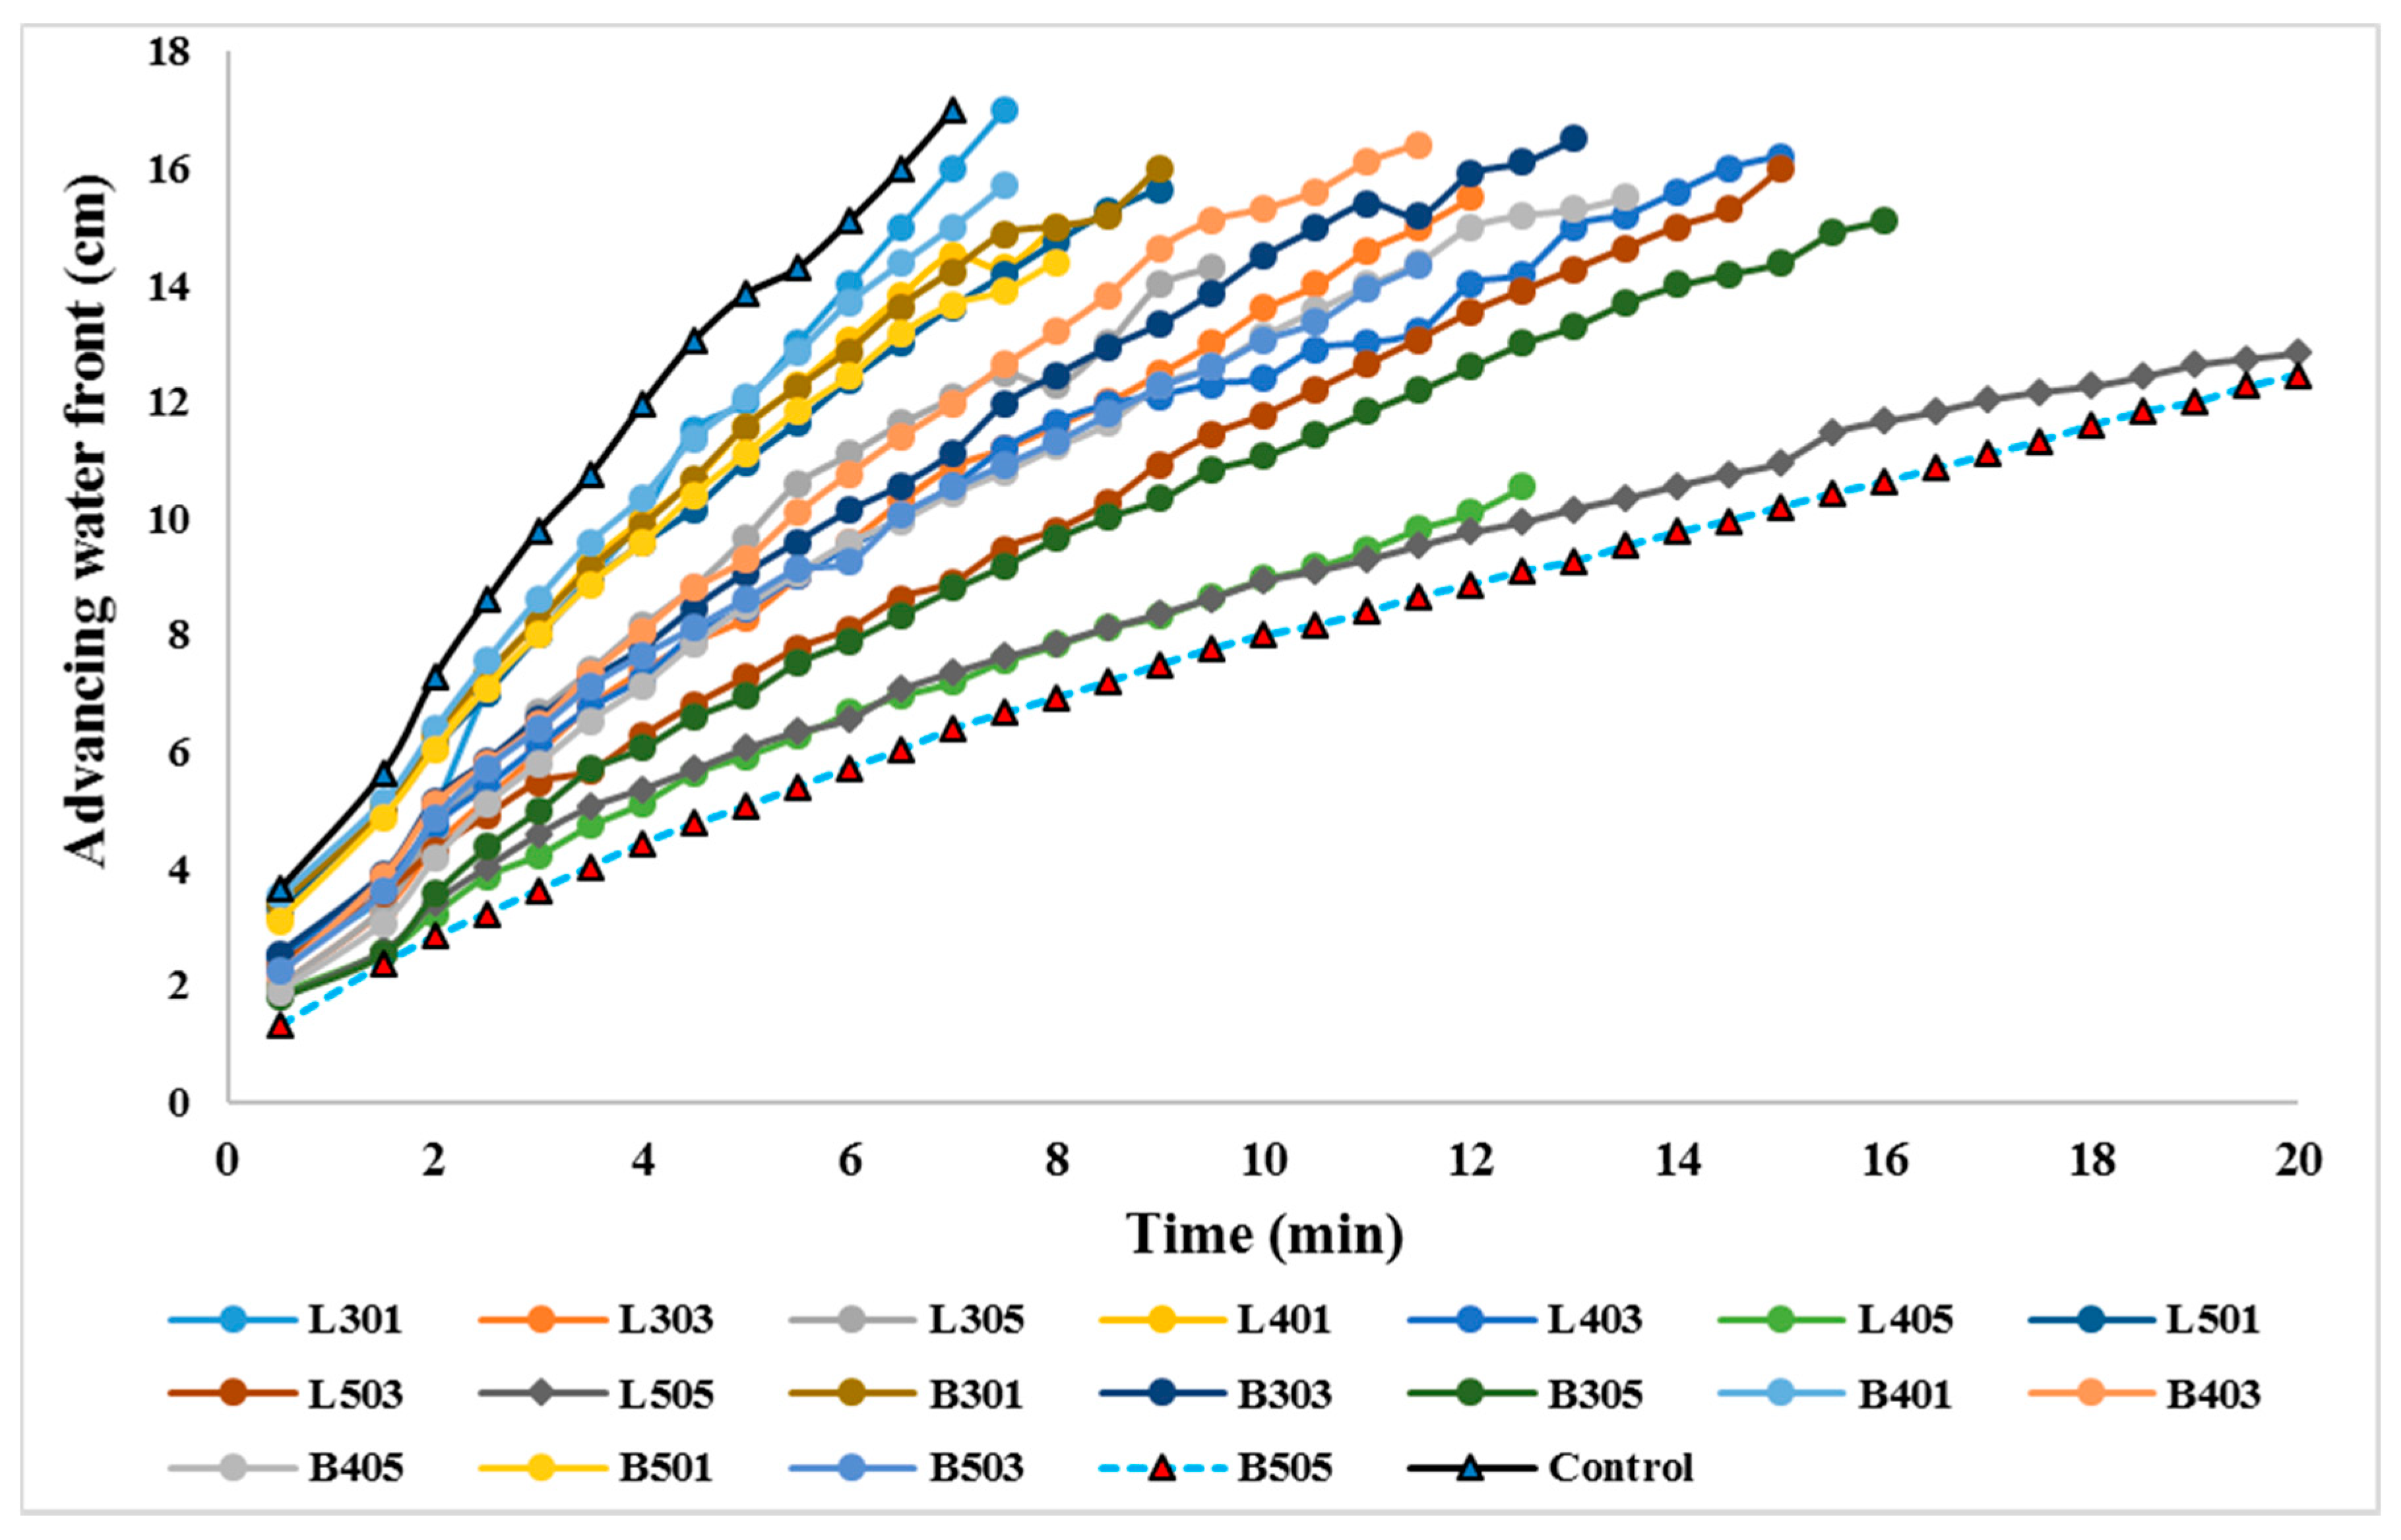
The advancing waterfront was impeded by the addition of biochar, achieving the highest delay for the B505 and L505 treatments (Figure 5) [4].

3.2.2. Saturated Hydraulic Conductivity

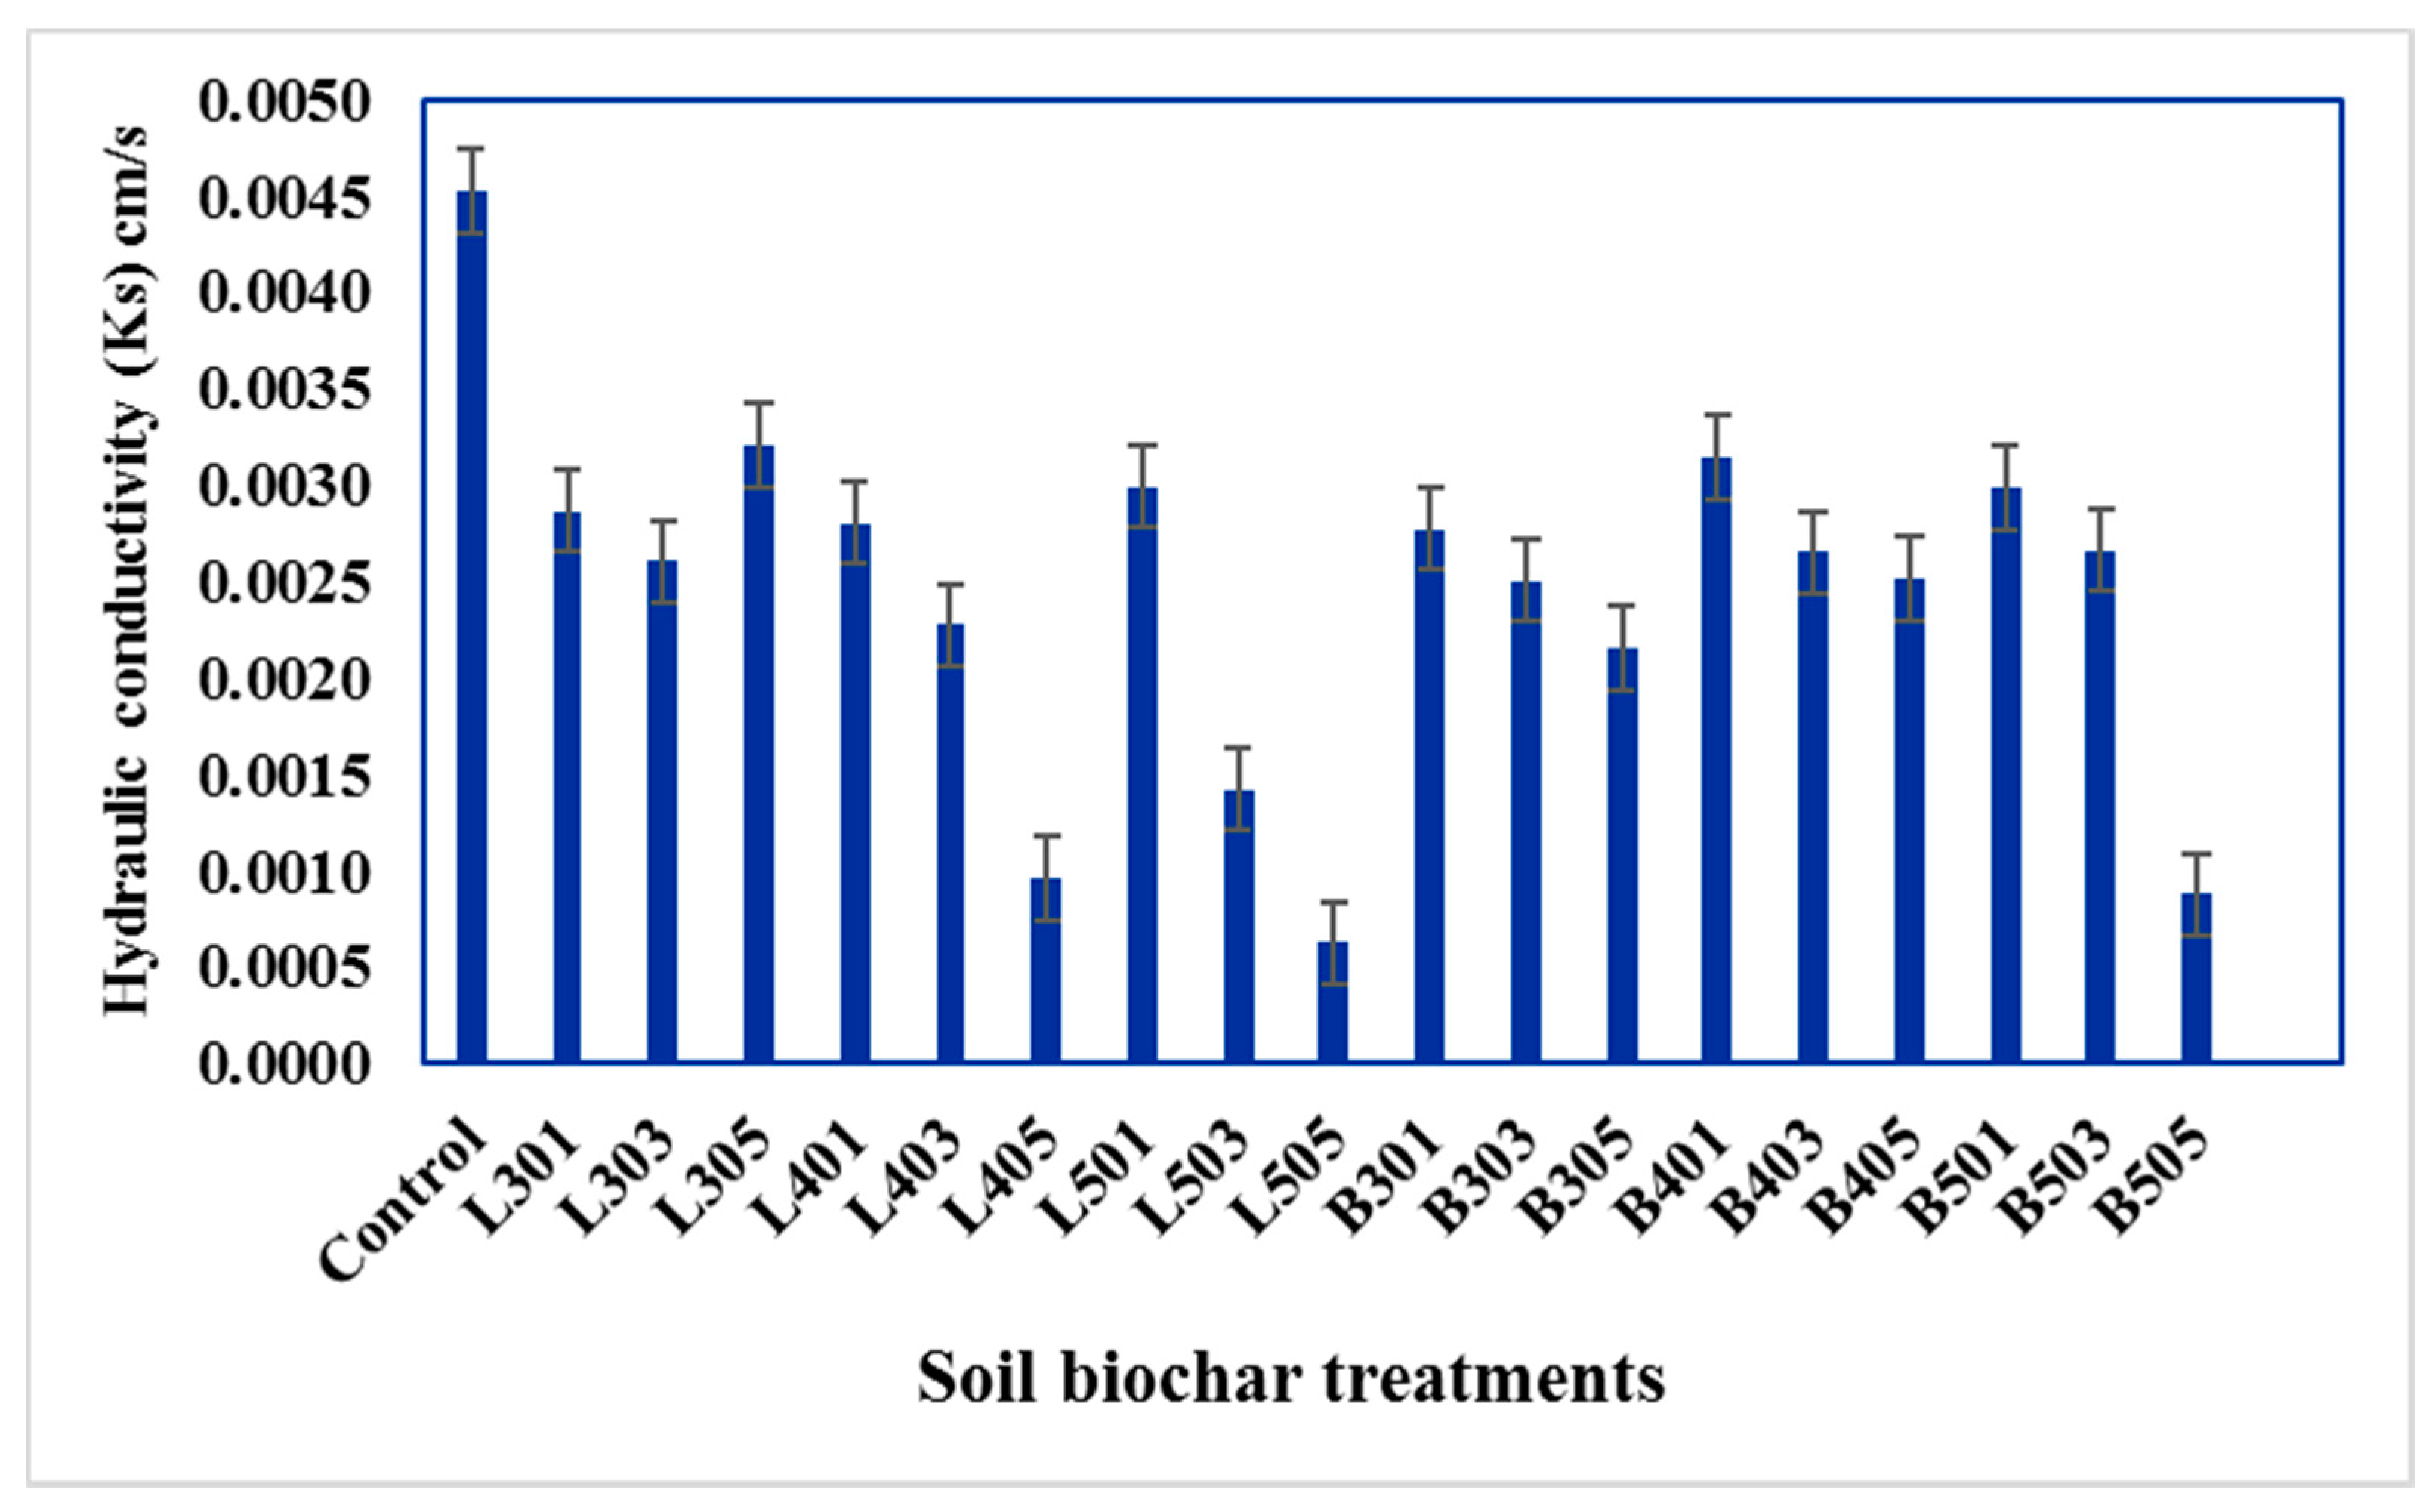
As compared to the control, values of saturated hydraulic conductivity (Ks) decreased significantly for all treatments. This is due to the biochar particles decreasing the average soil grain size and possibly causing the filling or clogging of soil macropores with its fine particles (Figure 6) [32,33]. Moreover, Novak et al. [34] said that the platelike biochar particles may clog soil micropores. In this study, the highest decrease for Ks was measured for the L505 and B505 treatments. The average values of this decrease were 86.16% and 80.57% for L505 and B505, respectively. This finding is in agreement with the findings of Liu et al. [32] and Ni et al. [35]. Furthermore, Barnes et al. [36] found that the biochar decreased the sandy soil saturated hydraulic conductivity by 92 %.

3.2.3. Infiltration

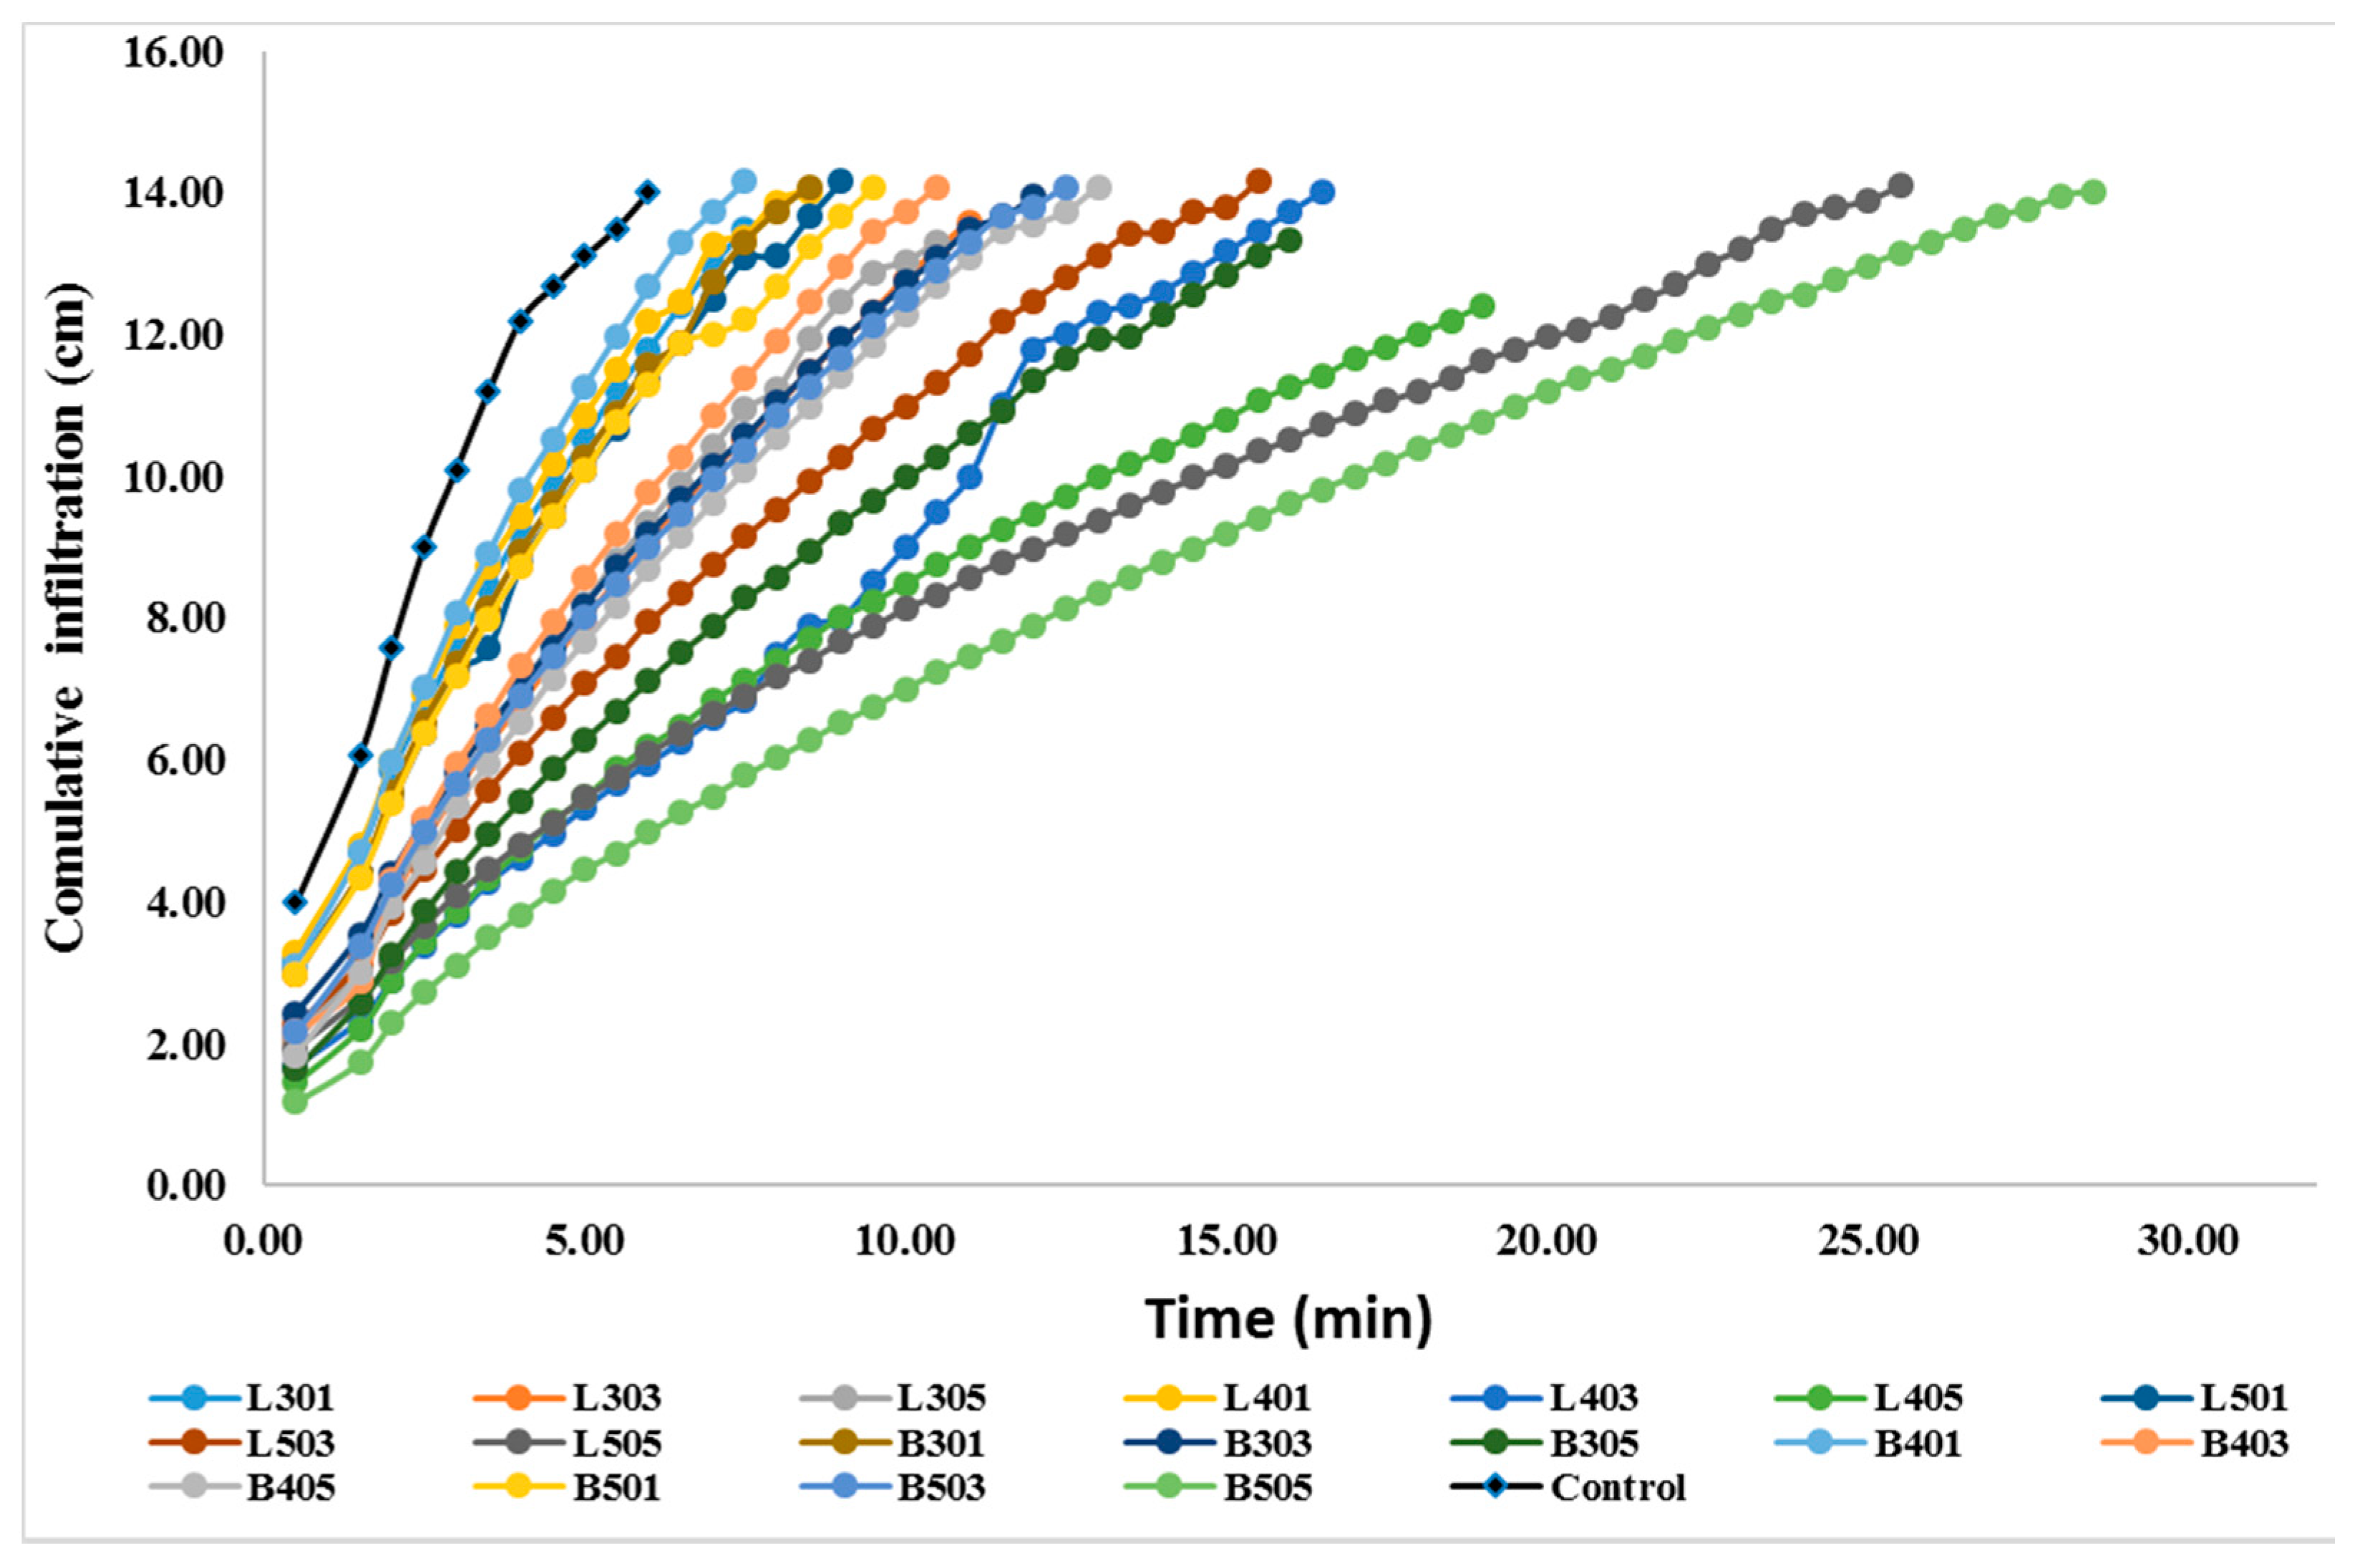
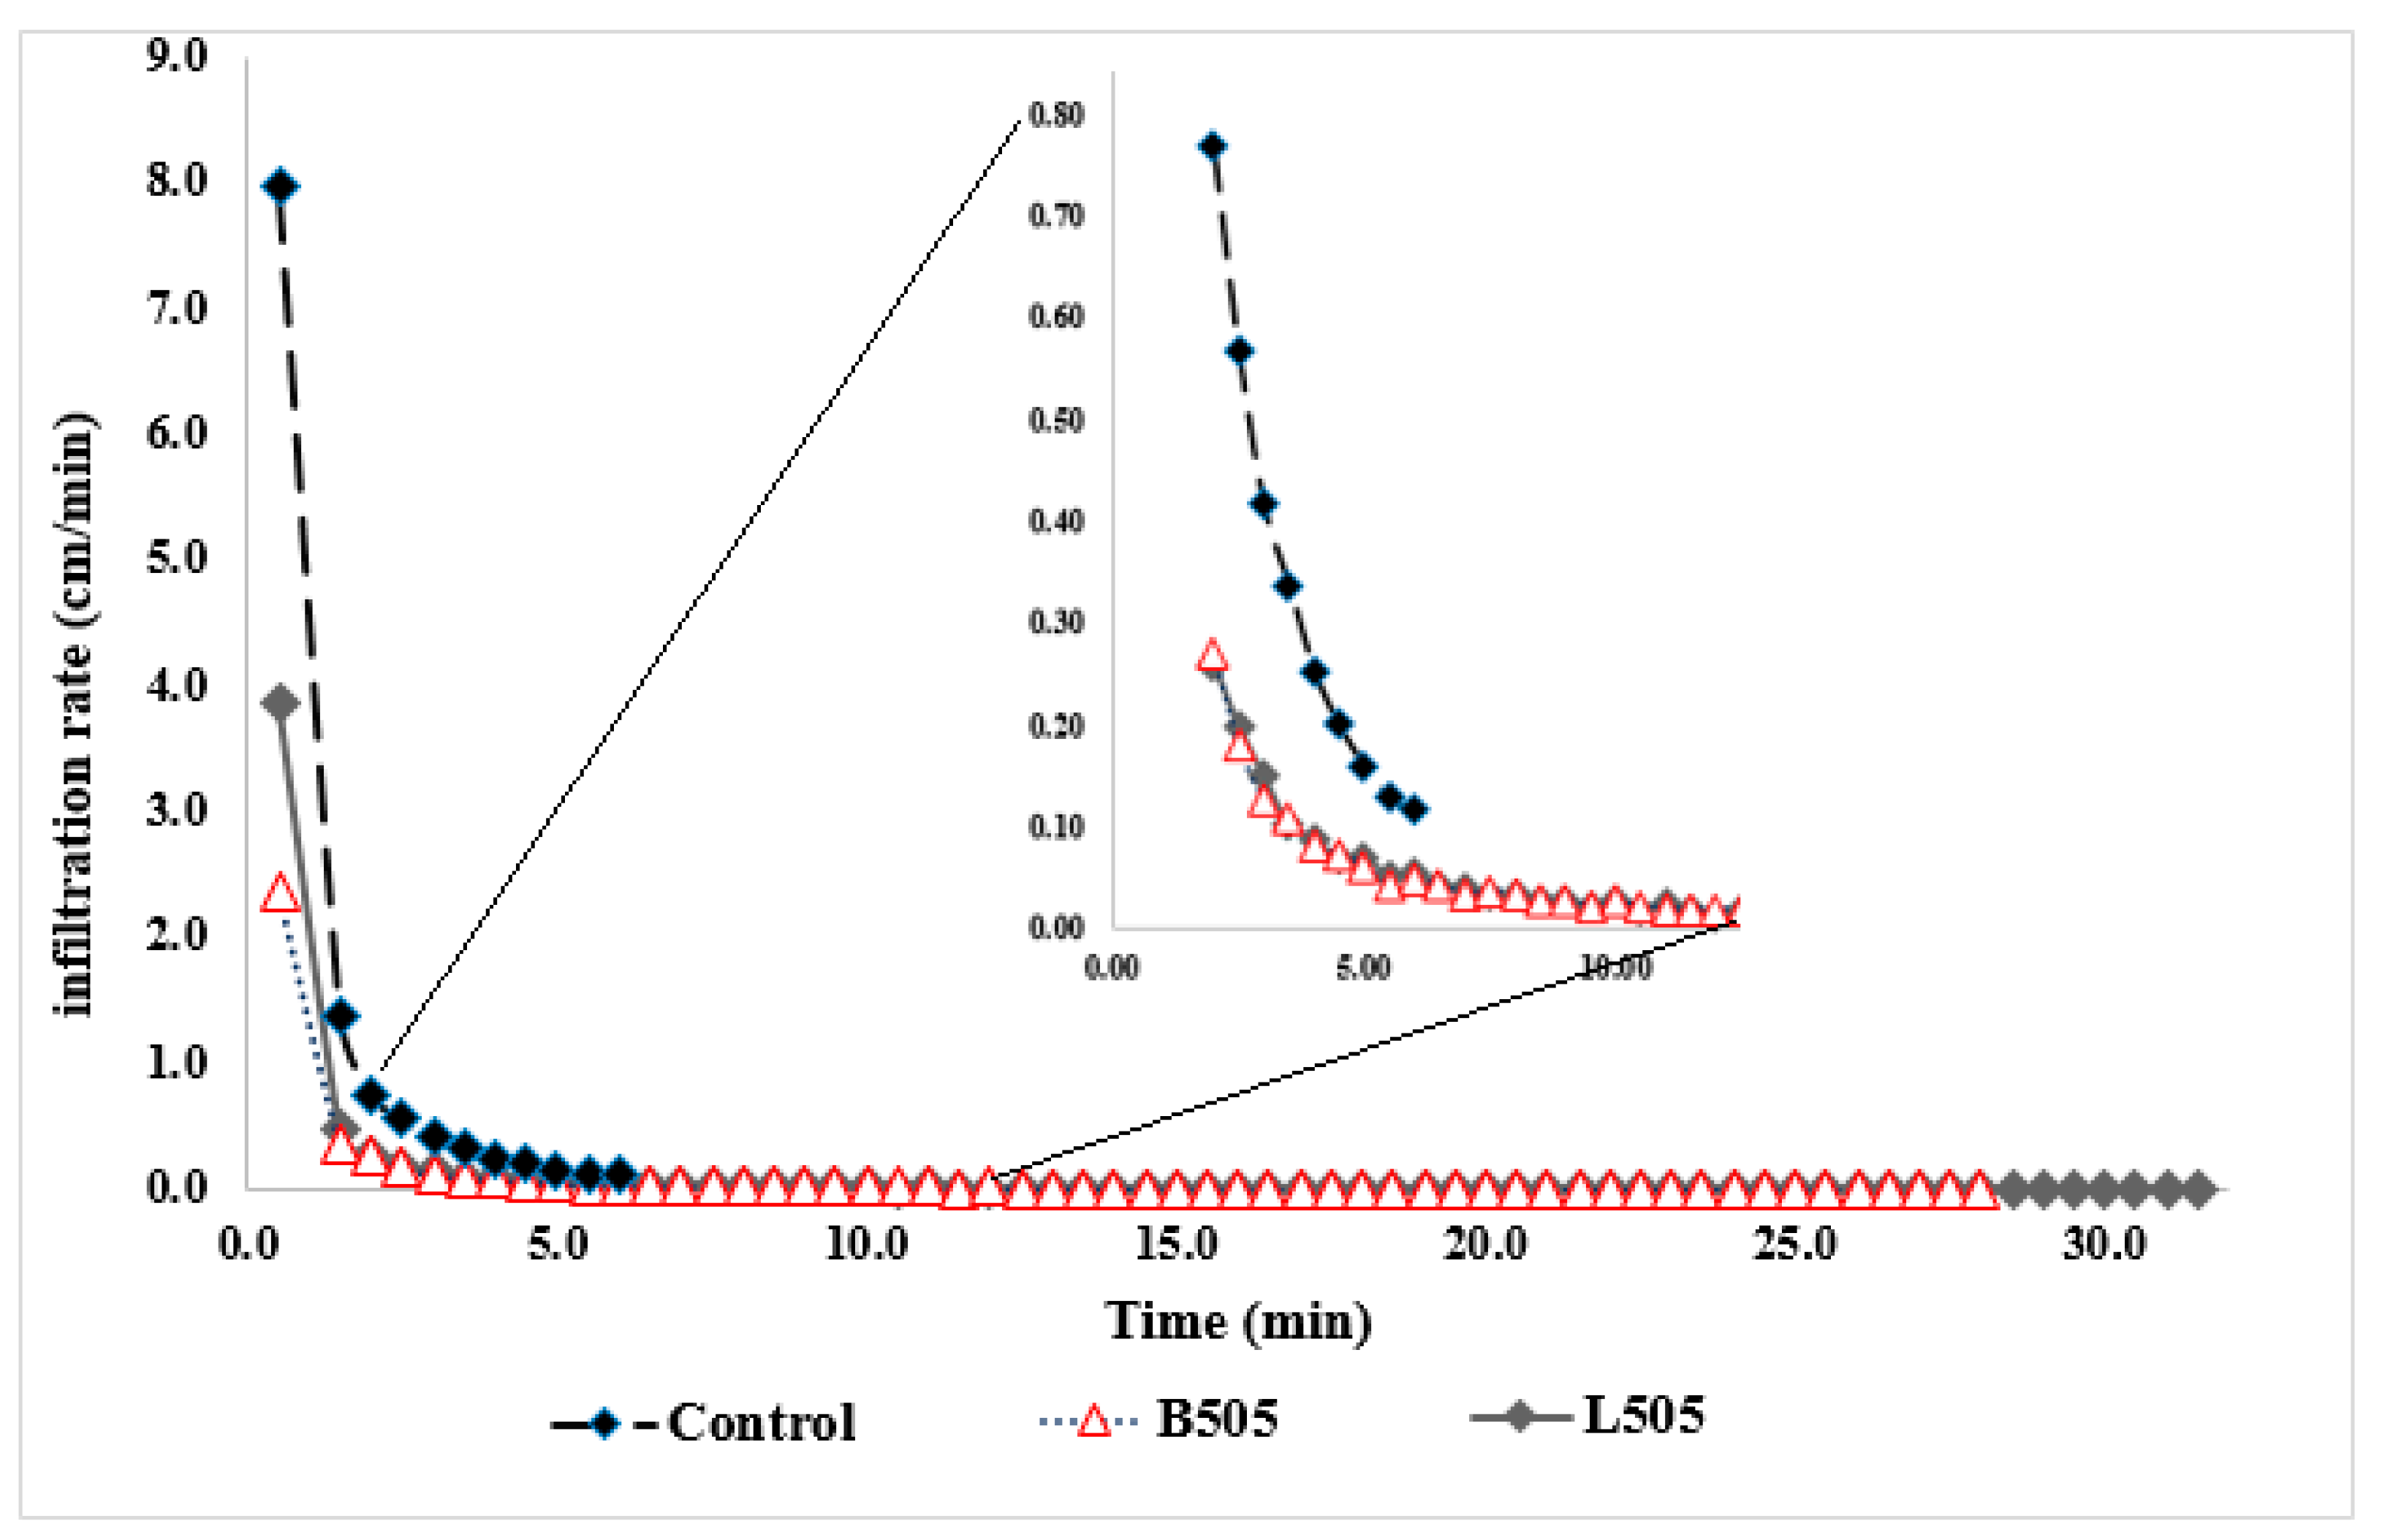
In comparison to the control, cumulative infiltration into the soil significantly decreased with the biochar addition rate (Figure 7). The biggest decline was observed for the B505 treatment, followed by L505 (Figure 7). Biochar also decreased the infiltration rate (Figure 8). When compared to the control treatment and other treatments, the B505 and L505 treatments notably decreased the infiltration rate. Consequently, the retained water, which is a good indicator for the availability of water in the soil for plant uptake, was increased as compared to the control (Table 5 and Table 6). Similar results were found by Ibrahim et al. [7], Ibrahim et al. [8], Al-Omran et al. [9], and Alghamdi et al. [37].
The fine biochar particles reside in the soil pore spaces and limit the pathways of water, reducing soil water infiltration [32,37]. Furthermore, the growth of intraparticle porosity linked with the biochar of small size can contribute to decrease wetting and increased entrapped air, consequently, decreasing the soil cumulative infiltration [38].

3.2.4. Water Retention

As compared to the control, application of the biochar made from either olive leaves or branches enhanced the capacity of the soil to retain water, particularly at −0.3 bar water potential (Table 5). At −0.3 bar, there was a large increase in water content (WC), as compared to the control. Higher application rates of biochar led to higher water retention (Table 5 and Table 6). At −15 bar, similar trends were recorded for WC values across all treatments (Table 4). Alghamdi et al. [4] and Ibrahim et al. [8] obtained similar results. The influence of biochar in enhancing soil water retention could be due to its high hydrophobicity and an increased extent of small pores in sandy soils, which contain mostly large pores. The hydrophobicity of biochar reduces the entry of water into the aggregate pores, leading to an increased aggregate stability and water availability [39].
The results revealed that the addition of biochar increased WC at both FC and wilting point (Figure 5). However, the most important value for WC in the soil is the amount of AW, which is calculated as: AW = FC − PWP. AW has a positive influence on plant growth and development. The results showed that AW increased by 153.33%, 151.11%, 142.22%, 133.33% and 62.22% in B505, L505, B305, L305, and B501, respectively. However, no impact was observed for the low application rate (1%) (L301, L501, and B301) (Table 6).
Biochar, applied at a high treatment rate (5%) and obtained at a high pyrolytic temperature (500 °C), from both leaves and branches, induced the highest increase in the amount of soil AW. A low treatment rate (1%) had either the lowest or a negligible impact. Although the biochar pyrolyzed at 500 °C was found to provide the highest amounts of AW, its application as a soil supplement in arid environments should be adopted with rigid restrictions, due to its high pH (9.69 and 9.29 for L500 and B500, respectively). Furthermore, the biochar prepared from olive leaves at the highest temperature (L500) had a high salinity (EC = 5.07 dS m−1). Salinity of the biochar prepared from olive branches (B500) would not be expected to increase soil salinity like the biochar prepared from leaves, since its salinity was 0.79 dS m−1 (Table 2) [4,6]. Consequently, according to the results of this study, the use of B505 as a soil supplement is recommended either with some restrictions to alkaline soils or without restrictions to acid soils.
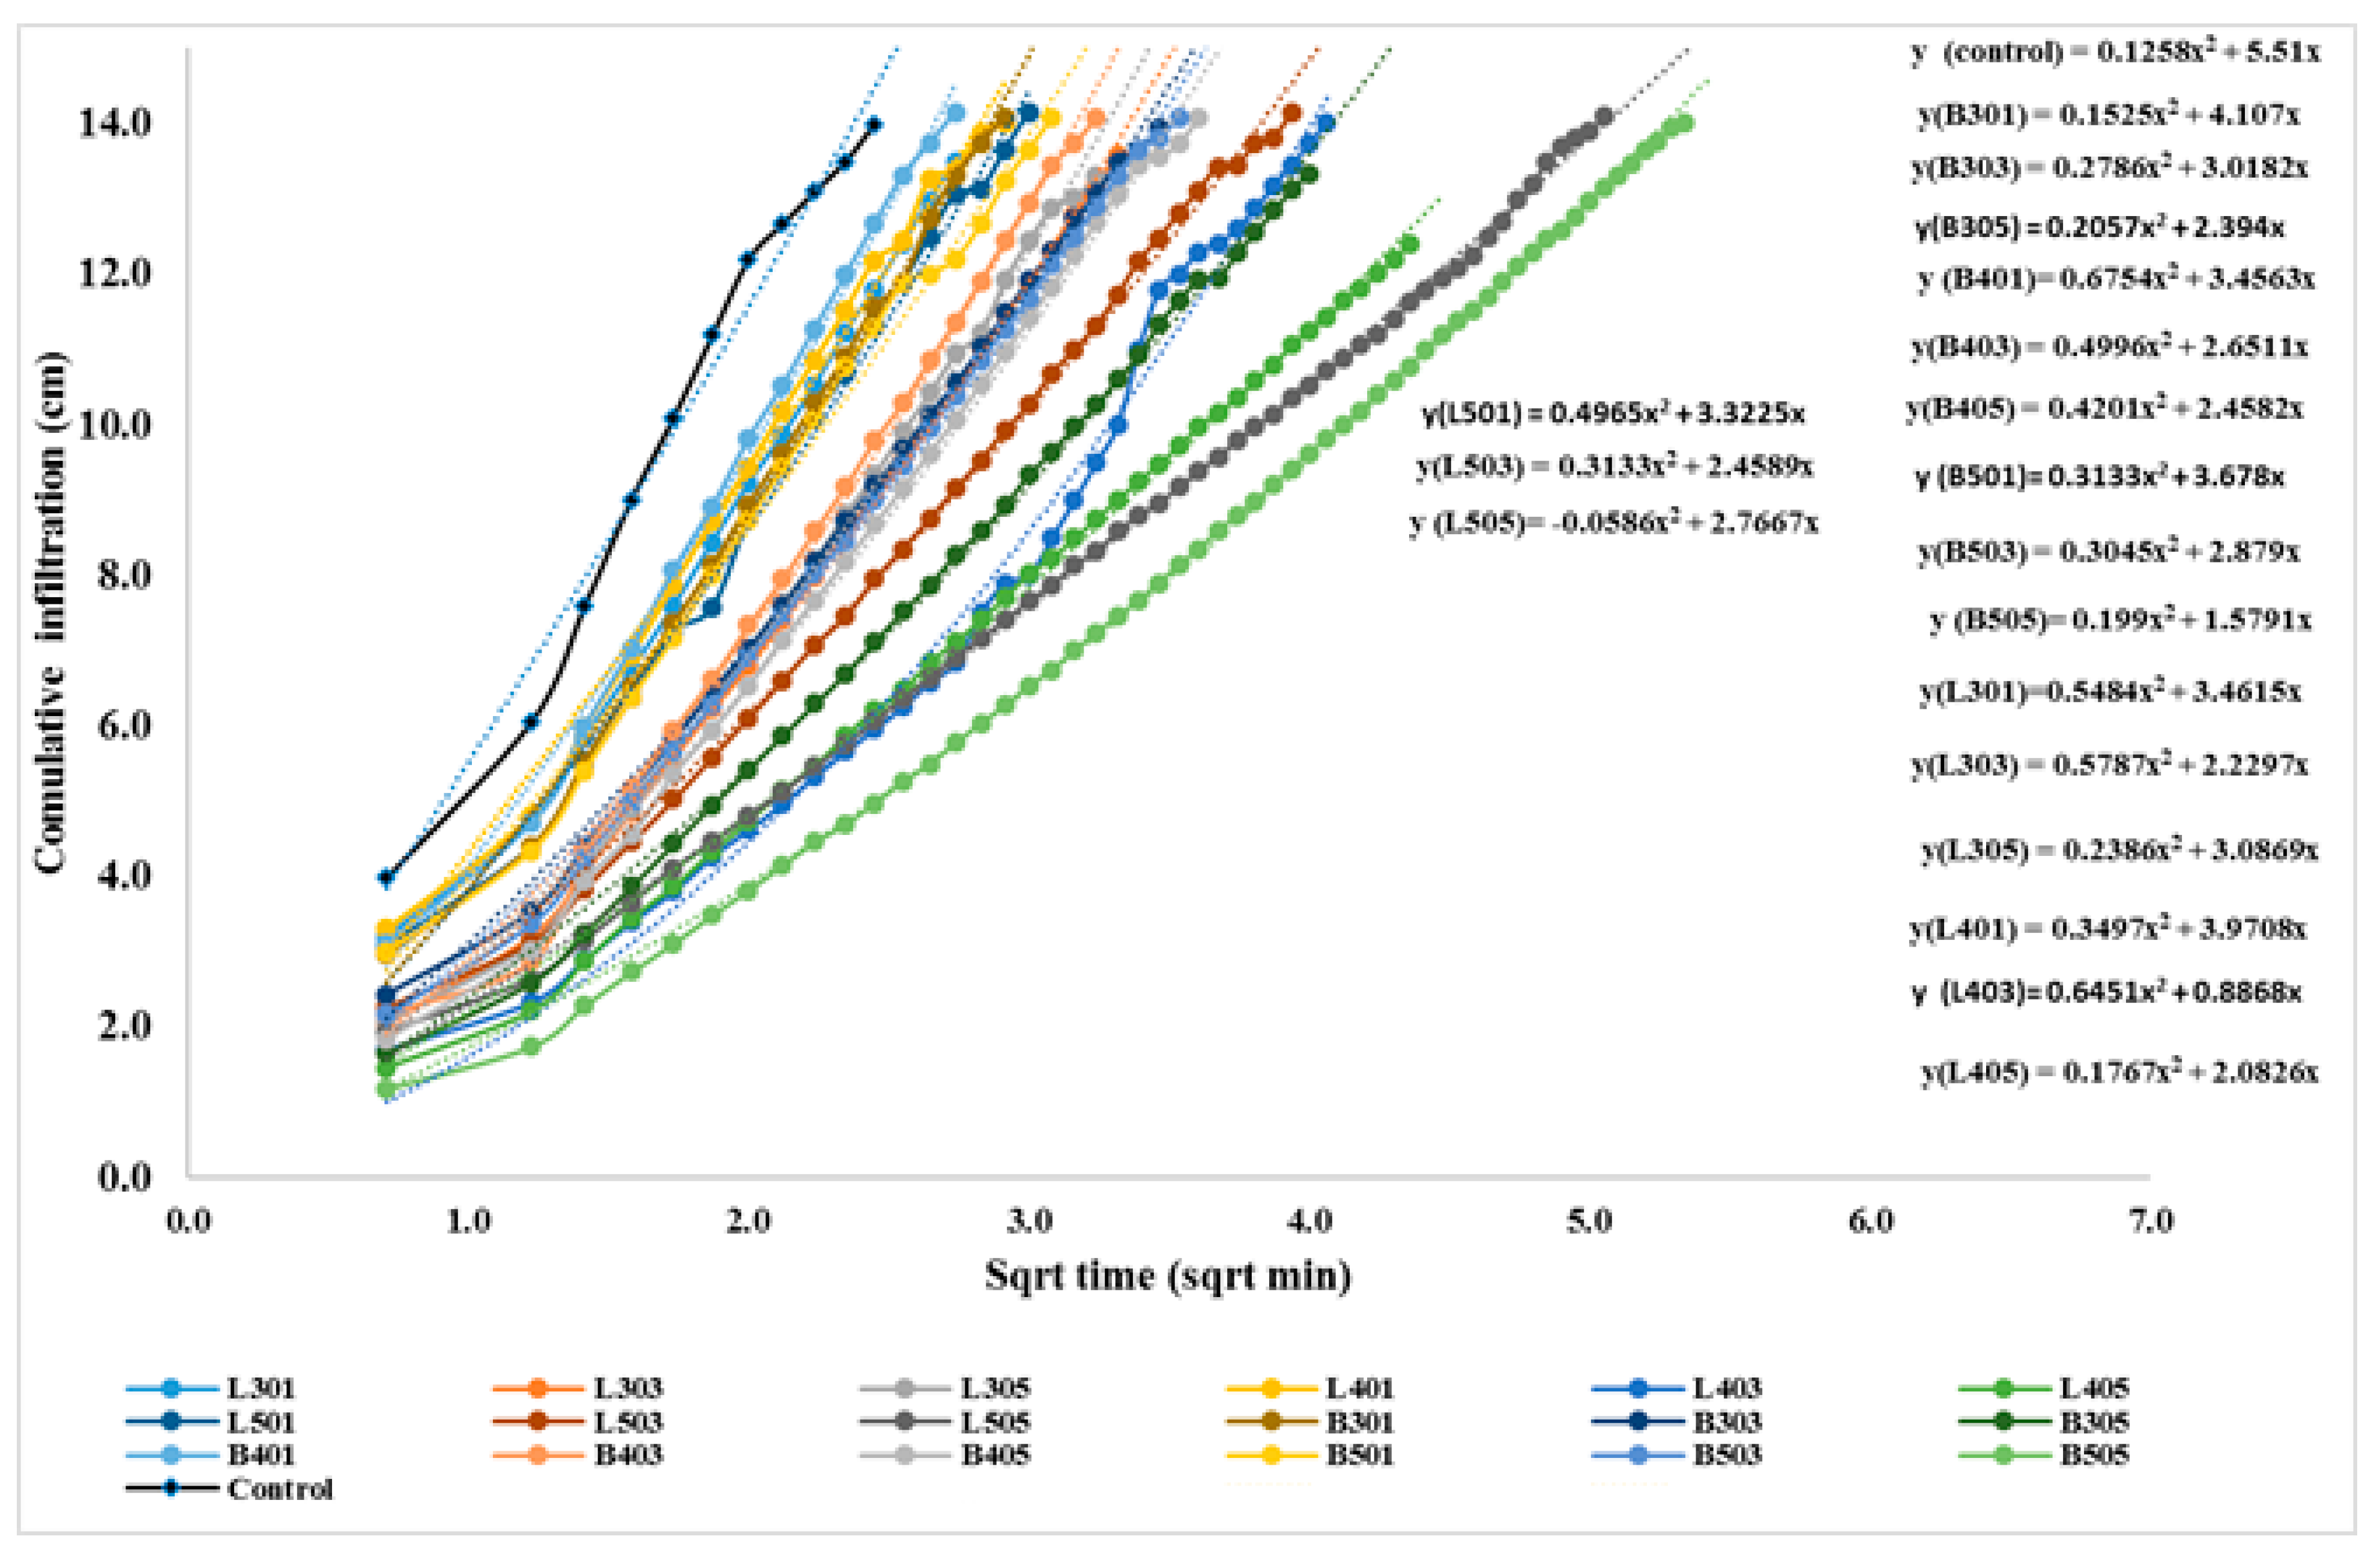
In comparison to the control, sorptivity significantly decreased in the treated soils (Table 6 and Figure 9). Sorptivity is defined as the rate at which water is drawn into soil against the gravity forces. It combines the influence of adsorption at the surface of soil particles and soil capillarity. The higher the sorptivity, the sooner water will be drawn into soil; a high sorptivity could explain the increase in water retention when biochar was added to the soil [4,6,7].

4. Conclusions

The potential of the olive leaves or branches-derived biochar as a soil conditioner was evaluated in this study. The feedstock was pyrolyzed at 300 °C, 400 °C and 500 °C and analyzed for physical and chemical characteristics. Biochar derived from both leaves and branches produced at higher pyrolytic temperature increased the pH values. Likewise, an increase of pyrolytic temperature led to a large increase in the salinity of the biochar made of leaves. However, the biochar prepared from olive branches had a lower salinity at all pyrolytic temperatures, and it can be recommended for safe usage under saline soil conditions. Likewise, surface area, ash, and stable carbon of biochar increased, while hydrogen, nitrogen, and volatile matter decreased with increasing the pyrolysis temperature. At the end of the column experiments that included wetting and evaporation cycles, the recovered water (evaporation + maintained in the column) ranged between 95.2% and 100%. All biochar treatments decreased soil’s cumulative evaporation, but they increased the amount of water retained. Both the advancing wet front and saturated hydraulic conductivity were impeded by the addition of biochar, with the highest delay for the treatments when biochar was added at the highest rate (5%) and was produced at the highest pyrolytic temperature (500 °C). As compared with the control, cumulative infiltration into soil was significantly decreased by biochar treatments. The results also showed that, as compared to the control, soil AW increased by 153.33%, 151.11%, 142.22%, 133.33% and 62.22% in the B505, L505, B305, L305, and B501 treatments, respectively. Overall, the biochar derived from olive branches at 500 °C and added at a rate of 5% was the most effective soil supplement. It can be added either with some restrictions to alkaline soils or without restrictions to acid soils.

Author Contributions

Conceptualization, supervision, funding acquisition, manuscript review and editing: A.G.A.; Methodology, formal analysis and investigation, original draft preparation: B.H.A.; Resources management, data acquisition, statistical analyses, manuscript review and editing: A.A.A. All authors have read and agreed to the published version of the manuscript.

Funding

This research was funded by Deanship of Scientific Research at King Saud University, Research group No (RG-1440-089).

Data Availability Statement

Not applicable.

Acknowledgments

The authors extend their appreciation to the Deanship of Scientific Research at King Saud University for funding this work through research group No (RG-1440-089).

Conflicts of Interest

The authors declare no conflict of interest.

References

  1. Aly, A.A.; Al-Omran, A.M.; Sallam, A.S.; Al-Wabel, M.I.; Al-Shayaa, M.S. Vegetation cover change detection and assessment in arid environment using multi-temporal remote sensing images and ecosystem management approach. Solid Earth 2016, 7, 713–725. [Google Scholar] [CrossRef] [Green Version]
  2. Aly, A.A.; Al-Omran, A.M.; Khasha, A.A. Water management for cucumber: Greenhouse experiment in Saudi Arabia and modeling study using SALTMED model. J. Soil Water Conserv. 2015, 70, 1–11. [Google Scholar] [CrossRef]
  3. Al-Barakah, F.N.; Aly, A.A.; Abaakhel, E.H.S.; Al-Rizki, A.M.; Alghamdi, A.G.; Al-Sewailem, M.S. Comparison and hydrochemical characterization of groundwater resources in the Arabian Peninsula: A case study of Al-Baha and Al-Qassim in Saudi Arabia. Water Resour. 2020, 47, 877–891. [Google Scholar] [CrossRef]
  4. Alghamdi, A.G.; Aly, A.A.; Al-Omran, A.M.; Alkhasha, A. Impact of biochar, bentonite and compost on physical and chemical characteristics of a sandy soil. Arab. J. Geosci. 2018, 11, 670–678. [Google Scholar] [CrossRef]
  5. Alghamdi, A.G. Biochar as a potential soil additive for improving soil physical properties—A review. Arab. J. Geosci. 2018, 11, 766. [Google Scholar] [CrossRef]
  6. Alkhasha, A.; Al-Omran, A.; Aly, A. Effect of biochar and synthetic polymer on hydro-physical properties of sandy soils. Sustainability 2018, 10, 4642. [Google Scholar] [CrossRef] [Green Version]
  7. Ibrahim, A.; Usman, A.R.A.; Al-Wabel, M.I.; Nadeem, M.; Ok, Y.S.; Al-Omran, A. Effects of Conocarpus biochar on hydraulic properties of calcareous sandy soil: Influence of particle size and application depth. Arch. Agron. Soil Sci. 2017, 63, 185–197. [Google Scholar] [CrossRef]
  8. Ibrahim, H.M.; Al-Wabel, M.I.; Usman, A.R.A.; Al-Omran, A. Effect of Conocarpus biochar application on the hydraulic properties of a sandy loam soil. Soil Sci. 2013, 178, 165–173. [Google Scholar] [CrossRef]
  9. Al-Omran, A.; Ibrahim, A.; Alharbi, A. Evaluating the impact of combined application of biochar and compost on hydro-physical properties of loamy sand soil. Commun. Soil Sci. Plant Anal. 2019, 50, 2442–2456. [Google Scholar] [CrossRef]
  10. Igalavithana, A.; Ok, Y.; Niazi, N.; Rizwan, M.; Al-Wabel, M.; Usman, A.; Moon, D.; Lee, S. Effect of corn residue biochar on the hydraulic properties of sandy loam soil. Sustainability 2016, 9, 266. [Google Scholar] [CrossRef] [Green Version]
  11. Randolph, P.; Bansode, R.R.; Hassan, O.A.; Rehrah, D.J.; Ravella, R.; Reddy, M.R.; Ahmedna, M. Effect of biochars produced from solid organic municipal waste on soil quality parameters. J. Environ. Manag. 2017, 192, 271–280. [Google Scholar] [CrossRef]
  12. Ulyett, J.; Sakrabani, R.; Kibblewhite, M.; Hann, M. Impact of biochar addition on water retention, nitrification and carbon dioxide evolution from two sandy loam soils. Eur. J. Soil Sci. 2014, 65, 96–104. [Google Scholar] [CrossRef]
  13. Głąb, T.; Palmowska, J.; Zaleski, T.; Gondek, K. Effect of biochar application on soil hydrological properties and physical quality of sandy soil. Geoderma 2016, 281, 11–20. [Google Scholar] [CrossRef]
  14. Mangrich, A.; Cardoso, E.; Doumer, M.; Romão, L.; Vidal, M.; Rigol, A.; Novotny, E. Improving the water holding capacity of soils of northeast brazil by biochar augmentation. Chapter in ACS Symposium Series. Am. Chem. Soc. 2015, 1206, 339–354. [Google Scholar]
  15. El-Bassi, L.; Azzaz, A.A.; Jellali, S.; Akrout, H.; Marks, E.A.N.; Ghimbeu, C.M.; Jeguirim, M. Application of olive mill waste-based biochars in agriculture: Impact on soil properties, enzymatic activities and tomato growth. Sci. Total Environ. 2021, 755, 142531. [Google Scholar] [CrossRef] [PubMed]
  16. Marks, E.A.; Kinigopoulou, V.; Akrout, H.; Azzaz, A.A.; Doulgeris, C.; Jellali, S.; Jeguirim, M. Potential for production of biochar-based fertilizers from olive mill waste in Mediterranean Basin countries: An initial assessment for Spain, Tunisia, and Greece. Sustainability 2020, 12, 6081. [Google Scholar] [CrossRef]
  17. Hillel, D. Soil and Water Physical Principles and Processes; Academic Press: New York, NY, USA, 1971. [Google Scholar]
  18. Walkley, A.; Black, I.A. An examination of the Degtjareff method for determining soil organic matter and a proposed modification of the chromic acid titration method. Soil Sci. 1934, 37, 29–38. [Google Scholar] [CrossRef]
  19. Gee, G.W.; Bauder, J.W. Particle-size analysis. In Methods of Soil Analysis, Part 1. Physical and Mineralogical Methods, Agronomy Monograph No. 9, 2nd ed.; Klute, A., Ed.; Soil Science Society of America: Madison, WI, USA, 1986; pp. 383–411. [Google Scholar]
  20. Sparks, D.L. Methods of Soil Analysis, Part 3. Chemical Methods; SSSA Book Series No. 5; Soil Science Society of America: Madison, WI, USA, 1996. [Google Scholar]
  21. ASTM. Standard Methods for Chemical Analysis of Wood Charcoal; ASTM D1762-84; ASTM: Philadelphia, PA, USA, 1989. [Google Scholar]
  22. Richards, L.A. Porous plate apparatus for measuring moisture relation and transmutation. Soil Sci. 1948, 66, 105–110. [Google Scholar] [CrossRef]
  23. Zhang, R. infiltration models for the disc infiltrometer. Soil Sci. Soc. Am. J. 1997, 61, 1597–1603. [Google Scholar] [CrossRef]
  24. Philip, J.R. The theory of infiltration: 1. The infiltration equation and its solution. Soil Sci. 1957, 83, 345–358. [Google Scholar] [CrossRef]
  25. Snedecor, G.W.; Cochran, W.G. Statistical Method, 7th ed.; The Iowa State University Press: Iowa, IA, USA, 1980; p. 476. [Google Scholar]
  26. Tomczyk, A.; Sokołowska, Z.; Boguta, P. Biochar physicochemical properties: Pyrolysis temperature and feedstock kind effects. Rev. Environ. Sci. Biotechnol. 2020, 19, 191–215. [Google Scholar] [CrossRef] [Green Version]
  27. Ippolito, J.A.; Cui, L.; Kammann, C.; Kammann, C.; Wrage-Mönnig, N.; Estavillo, J.M.; Fuertes-Mendizabal, T.; Luz Cayuela, M.; Sigua, G.; Novak, J.; et al. Feedstock choice, pyrolysis temperature and type influence biochar characteristics: A comprehensive meta-data analysis review. Biochar 2020, 2, 421–438. [Google Scholar] [CrossRef]
  28. Rafiq, M.K.; Bachmann, R.T.; Rafiq, M.T.; Shang, Z.; Joseph, S.; Long, R. Influence of pyrolysis temperature on physicochemical properties of corn stover (Zea mays L.) biochar and feasibility for carbon capture and energy balance. PLoS ONE 2016, 11, e0156894. [Google Scholar] [CrossRef] [PubMed] [Green Version]
  29. Katyal, S.; Thambimuthu, K.; Valix, M. Carbonisation of bagasse in a fixed bed reactor: Influence of process variables on char yield and characteristics. Renew. Energy 2003, 28, 713–725. [Google Scholar] [CrossRef]
  30. Chen, B.; Chen, Z. Sorption of naphthalene and 1-naphthol by biochars of orange peels with different pyrolytic temperatures. Chemosphere 2009, 76, 127–133. [Google Scholar] [CrossRef] [PubMed]
  31. Ghani, W.A.W.A.K.; Mohd, A.; da Silva, G.; Bachmann, R.T.; Taufiq-Yap, Y.H.; Rashid, U.; Al-Muhtaseb, A.H. Biochar production from waste rubber-wood-sawdust and its potential use in C sequestration: Chemical and physical characterization. Ind. Crop. Prod. 2013, 44, 18–24. [Google Scholar] [CrossRef]
  32. Liu, Z.; Dugan, B.; Masiello, C.A.; Barnes, R.T.; Gallagher, M.E.; Gonnermann, H. Impacts of biochar concentration and particle size on hydraulic conductivity and DOC leaching of biochar–sand mixtures. J. Hydrol. 2016, 533, 461–472. [Google Scholar] [CrossRef] [Green Version]
  33. Blanco-Canqui, H. Biochar and soil physical properties. Soil Sci. Soc. Am. J. 2017, 81, 687–711. [Google Scholar] [CrossRef] [Green Version]
  34. Novak, J.; Sigua, G.; Watts, D.; Cantrell, K.; Shumaker, P.; Szogi, A.; Johnson, M.G.; Spokas, K. Biochars impact on water infiltration and water quality through a compacted subsoil layer. Chemosphere 2016, 142, 160–167. [Google Scholar] [CrossRef]
  35. Ni, J.J.; Bordoloi, S.; Shao, W.; Garg, A.; Xu, G.; Sarmah, A.K. Two-year evaluation of hydraulic properties of biochar-amended vegetated soil for application in landfill cover system. Sci. Total Environ. 2020, 712, 136486. [Google Scholar] [CrossRef]
  36. Barnes, R.T.; Gallagher, M.E.; Masiello, C.A.; Liu, Z.; Dugan, B. Biochar-Induced changes in soil hydraulic conductivity and dissolved nutrient fluxes constrained by laboratory experiments. PLoS ONE 2014, 9, e108340. [Google Scholar] [CrossRef] [PubMed] [Green Version]
  37. Alghamdi, A.G.; Alkhasha, A.; Ibrahim, H.M. Effect of biochar particle size on water retention and availability in a sandy loam soil. J. Saudi Chem. Soc. 2020, 24, 1042–1050. [Google Scholar] [CrossRef]
  38. Eibisch, N.; Durner, W.; Bechtold, M.; Fus, R.; Mikutta, R.; Woche, S.K.; Helfrich, M. Does water repellency of pyrochars and hydrochars counter their positive effects on soil hydraulic properties? Geoderma 2015, 245–246, 31–39. [Google Scholar] [CrossRef]
  39. Glaser, B.; Lehmann, J.; Zech, W. Ameliorating physical and chemical properties of highly weathered soils in the tropics with charcoal: A review. Biol. Fertil. Soils 2020, 35, 219–230. [Google Scholar] [CrossRef]
Figure 1. Illustration of acrylic columns used in the experiment (A) and cut sections through a soil column (B).
Sustainability 13 05493 g001
Figure 2. A scheme summarizing different types of biochar.
Sustainability 13 05493 g002
Figure 3. Weight of column after each wetting cycle (Focused on the highest impact, L505 and B505).
Sustainability 13 05493 g003
Figure 4. Water content (WC) distribution in soil columns treated with olive waste’s biochar, made of leaves (A) and branches (B), after 5 weeks of wetting/evaporation cycles.
Sustainability 13 05493 g004
Figure 5. Effect of biochar application on advancing wetting front (in cm) of sandy soil.
Sustainability 13 05493 g005
Figure 6. Effect of different biochar applications on hydraulic conductivity of studied soil (n = 3 for each treatment).
Sustainability 13 05493 g006
Figure 7. Effect of biochar applications on cumulative infiltration.
Sustainability 13 05493 g007
Figure 8. Effect of biochar application on infiltration rate (Focused on the highest impact, L505 and B505).
Sustainability 13 05493 g008
Figure 9. Effect of biochar applications on mathematical representation of cumulative infiltration and curves were obtained by fitting a second-order polynomial to measured cumulative infiltration versus the square root of time (t0.5).
Sustainability 13 05493 g009
Table 1. Illustration of the symbols used in the experiment.
No.KeyFeedstock TypePyrolysis TemperatureApplication RateColumn Height
1L301Olive leaves300 °C1%Top 10 cm
2L303Olive leaves300 °C3%Top 10 cm
3L305Olive leaves300 °C5%Top 10 cm
4L401Olive leaves400 °C1%Top 10 cm
5L403Olive leaves400 °C3%Top 10 cm
6L405Olive leaves400 °C5%Top 10 cm
7L501Olive leaves500 °C1%Top 10 cm
8L503Olive leaves500 °C3%Top 10 cm
9L505Olive leaves500 °C5%Top 10 cm
10B301Olive branches300 °C1%Top 10 cm
11B303Olive branches300 °C3%Top 10 cm
12B305Olive branches300 °C5%Top 10 cm
13B401Olive branches400 °C1%Top 10 cm
14B403Olive branches400 °C3%Top 10 cm
15B405Olive branches400 °C5%Top 10 cm
16B501Olive branches500 °C1%Top 10 cm
17B503Olive branches500 °C3%Top 10 cm
18B505Olive branches500 °C5%Top 10 cm
19control------Top 10 cm
Table 2. Biochar chemical characteristics.
SampleCodepH
(1:10)
EC
(dSm−1) (1:10)
CEC
(cmol kg−1)
Organic Carbon (%)Total Organic Carbon (%)Organic Matter (%)
1L-3007.87d *0.62c62.838.1310.8418.69
2L-4009.67a3.85b52.397.039.3816.17
3L-5009.69a5.07a47.015.867.8113.47
4B-3008.37c0.65c36.037.479.9617.17
5B-4009.17b0.49c28.356.458.6014.83
6B-5009.29b0.79c27.295.687.5713.06
* Mean separation within each column by Duncan’s multiple range test (DMRT) at 5% level.
Table 3. Surface area and some other characteristics of prepared biochar.
Sample
No.
Surface Area
(m2/g)
CHNProximate Analysis (%)
(%)MoistureAshVolatile MatterStable Carbon
L3000.3546 ± 0.013863.84.851.281.3913.8252.3032.49
L4002.1866 ± 0.042264.792.721.623.5618.1124.5453.79
L5003.9051 ± 0.116864.881.371.213.2319.9623.6153.20
B3005.0949 ± 0.167671.84.33ND *1.777.5427.5363.16
B4007.9997 ± 0.226472.952.48ND3.859.4527.3059.40
B500154.892 ± 3.980468.141.40ND4.6412.116.3166.99
ND * = not detected.
Table 4. Evaporation (at ~25 °C) and amount of water retained (in mm) after 5 weeks of wetting/evaporation cycles.
TreatmentAdded WaterEvaporation (mm)Cumulative EvaporationWater RetainedCumulative Evaporation + Water RetainedRecovery %
(mm)Week 1Week 2Week 3Week 4Week 5(mm)(mm)
L30156.16.06.37.08.310.137.7d *18.0b55.799.4
L30356.16.46.97.98.69.439.2b16.2c55.498.9
L30556.16.57.07.47.67.939.5b15.0d54.597.2
L40156.16.36.97.88.69.238.8c16.0c54.897.7
L40356.15.87.88.79.610.340.1b15.4d55.999.8
L40556.15.96.98.09.810.240.8a15.1d55.999.6
L50156.16.57.38.18.89.439.6b16.4c55.198.2
L50356.16.57.38.08.69.239.7b15.4d55.198.2
L50556.16.56.87.58.08.637.4d18.7a56.1100.0
B30156.16.57.28.08.89.640.1b14.6 e54.797.5
B30356.16.27.48.08.69.739.8b15.0 d53.895.9
B30556.17.27.47.98.38.739.6b15.3 d54.997.9
B40156.16.66.77.38.28.638.4d15.0d52.495.2
B40356.14.76.58.49.09.638.3c17.5c55.799.5
B40556.15.76.47.17.59.136.8e18.8a55.799.5
B50156.16.36.87.47.89.437.8d16.1c53.996.1
B50356.16.57.17.88.28.838.4c17.1c55.598.9
B50556.16.56.87.58.08.437.3d18.7a57.599.8
Control56.16.28.08.88.89.140.9a14.5e55.498.8
* Mean separation within each column by Duncan’s multiple range test (DMRT). The treatment with same letter is not significant at 5% level.
Table 5. Water retention characteristics of the soil treatments.
Ψ (Bar)
Treatments
−0.1−0.3−1−1.5−3−5−10−15
Soil Water Content (cm3 cm−3)
Control0.1350.0750.0470.0380.0380.0380.0370.030
L3010.1450.0850.0570.0520.0490.0470.0460.040
L3050.2390.1450.0870.0740.0610.0540.0470.045
L5010.1550.0950.0670.0620.0590.0570.0560.050
L5050.2300.1590.0800.0670.0680.0520.0500.046
B3010.1700.1090.0820.0760.0730.0710.0670.064
B3050.2100.1530.0780.0750.0630.0590.0460.044
B5010.1590.1060.0610.0590.0510.0440.0350.033
B5050.2220.1660.0940.0940.0790.0720.0680.052
St. deviation0.040.030.020.020.010.010.010.01
Standard error0.150.140.120.120.110.110.110.11
Skew0.190.05−0.35−0.11−0.280.280.460.36
Table 6. Hydrological parameters of water retention and available water content of the soil as affected by different treatments.
Ψ (Bar)Soil Water Content (cm cm−3)
ControlL301L305L501L505B301B305B501B505
−0.3 (FC) 10.0750.0850.1450.0950.1590.1090.1530.1060.166
−15 (PWP) 20.0300.0400.0450.0500.0460.0640.0440.0330.052
AW 30.045c 40.045c0.105a0.045c0.113a0.045c0.109a0.073b0.114a
Sorptivity 5 (cm min−0.5)5.513.463.093.322.774.112.393.681.58
1 Field capacity; 2 Permanent wilting point; 3 Available water (AW = FC − PWP); 4 Mean separation within each column by Duncan’s multiple range test (DMRT). The treatment with same letter is not significant at 5% level; 5 Sorptivity was calculated by fitting a second order polynomial to the plot of cumulative infiltration versus the square root of time (Figure 7).
Publisher’s Note: MDPI stays neutral with regard to jurisdictional claims in published maps and institutional affiliations.