
Material Selection in Green Design: A Method Combining DEA and TOPSIS

Abstract
:1. Introduction
2. Literature Review
2.1. Two Methods of Material Selection
2.2. G-DEA and TOPSIS
2.2.1. DEA Method
2.2.2. TOPSIS Method
- (1)
- Set the evaluation index set and standardize the indexes
- (2)
- Establish the weighted evaluation matrix V with weight vector and determine the weight using the entropy weight method.e is the entropy and
- (3)
- Determine the ideal optimal and worst solutionsIdeal optimal solution: ;Ideal worst solution: .
- (4)
- Calculate the comprehensive distance and sort the solutions according to their relative proximity
3. Combined DEA/TOPSIS Method
- (1)
- Step one: determine the evaluation index system;
- (2)
- Step two: score the materials;
- (3)
- Step three: use G-CCR screening to screen for improved samples with greater efficiency; and,
- (4)
- Step four: calculate the order using TOPSIS;
4. Example of Wood Selection for Furniture
4.1. Step One: Evaluation Index System
4.2. Step Two: Score the Materials
4.3. Step Three: Use G-CCR Screening to Screen for Improved Samples with Greater Efficiency
4.4. Step Four: Calculate the Order Using TOPSIS
5. Results and Discussion
6. Conclusions
Author Contributions
Funding
Institutional Review Board Statement
Informed Consent Statement
Data Availability Statement
Conflicts of Interest
References
- Ashby, M.F.; Johnson, K. Materials and Design: The Art and Science of Material Selection in Product Design; Butterworth-Heinemann: Oxford, UK, 2013. [Google Scholar]
- Ram, V.G.; Kishore, K.C.; Kalidindi, S.N. Environmental benefits of construction and demolition debris recycling: Evidence from an indian case study using life cycle assessment. J. Clean. Prod. 2020, 255, 120258. [Google Scholar] [CrossRef]
- Khare, S.; Dell’Amico, M.; Knight, C.; McGarry, S. Selection of Materials for High Temperature Latent Heat Energy Storage. Sol. Energy Mater. Sol. Cells 2012, 107, 20–27. [Google Scholar] [CrossRef]
- Chauhan, A.; Vaish, R. Magnetic Material Selection Using Multiple Attribute Decision-Making Approach. Mater. Des. 2012, 36, 1–5. [Google Scholar] [CrossRef]
- Prasad, K.; Chakraborty, S. A Quality Function Deployment-based Model for Material Selection. Mater. Des. 2013, 49, 525–535. [Google Scholar] [CrossRef]
- Hosseinijou, S.A.; Mansour, S.; Shirazi, M.A. Social Life Cycle Assessment for Material Selection: A Case Study of Building Materials. Int. J. Life Cycle Assess 2014, 19, 620–645. [Google Scholar] [CrossRef]
- Ribeiro, I.; Peças, P.; Henriques, E. A Life Cycle Framework to Support Material Selection for Ecodesign: A Case Study on Biodegradable Polymers. Mater. Des. 2013, 51, 300–308. [Google Scholar] [CrossRef]
- Van der Velden, N.M.; Kuusk, K.; Köhler, A.R. Life Cycle Assessment and Eco-design of Smart Textiles: The Importance of Material Selection Demonstrated through E-textile Product Redesign. Mater. Des. 2015, 84, 313–324. [Google Scholar] [CrossRef]
- Weil, M.; Dombrowski, K.; Buchwald, A. 10—Life-Cycle Analysis of Geopolymers, in Geopolymers. In Geopolymers; Provis, J.L., van Deventer, J.S.J., Eds.; Woodhead Publishing: London, UK, 2009; pp. 194–210. [Google Scholar]
- Arce, M.E.; Saavedra, Á.; Míguez, J.L.; Granada, E. The Use of Grey-Based Methods in Multi-Criteria Decision Analysis for the Evaluation of Sustainable Energy Systems: A Review. Renew. Sustain. Energy Rev. 2015, 47, 924–932. [Google Scholar] [CrossRef]
- Shafigh, P.; Nomeli, M.A.; Alengaram, U.J.; Mahmud, H.B.; Jumaat, M.Z. Engineering Properties of Lightweight Aggregate Concrete Containing Limestone Powder and High Volume Fly Ash. J. Clean. Prod. 2016, 135, 148–157. [Google Scholar] [CrossRef]
- Kumar, B.; Tike, G.; Nanda, P. Evaluation of Properties of High-volume Fly-ash Concrete for Pavements. J. Mater. Civ. Eng. 2007, 19, 906–911. [Google Scholar] [CrossRef]
- Zhao, R.; Liu, Y.; Zhang, N.; Huang, T. An optimization model for green supply chain management by using a big data analytic approach. J. Clean. Prod. 2017, 142, 1085–1097. [Google Scholar] [CrossRef]
- Zhao, R.; Wu, D.; Patti, S.A. Bibliometric Analysis of Carbon Labeling Schemes in the Period 2007–2019. Energies 2020, 13, 4233. [Google Scholar] [CrossRef]
- Jill, A.; Zalesny, R.; Zalesny, S.; Wiese, A.H.; Hall, R.B. Choosing Tree Genotypes for Phytoremediation of Landfill Leachate Using Phyto-Recurrent Selection. Int. J. Phytoremediation 2007, 9, 513–530. [Google Scholar]
- Anupam, K.; Lal, P.S.; Bist, V.; Sharma, A.K.; Swaroop, V. Raw Material Selection for Pulping and Papermaking using TOPSIS Multiple Criteria Decision Making Design. Environ. Prog. Sustain. Energy 2014, 33, 1034–1041. [Google Scholar] [CrossRef]
- Salwa, H.N.; Sapuan, S.M.; Mastura, M.T.; Zuhri, M.Y.M. Analytic Hierarchy Process (AHP)-based Materials Selection System for Natural Fiber as Reinforcement in Biopolymer Composites for Food Packaging. BioResources 2019, 14, 10014–10046. [Google Scholar]
- Mastura, M.T.; Sapuan, S.M.; Noryani, M. Material Selection of Natural Fibers for Composite Automotive Components using Analytic Hierarchy Process/Analytic Network Process in Concurrent Engineering Approach. Key Eng. Mater. 2019, 801, 53–58. [Google Scholar] [CrossRef]
- Dye, T.A. Assigning Prioritization During Encode of Independently Compressed Objects. Patent Application No. 10/620,684, 5 February 2004. [Google Scholar]
- Abastante, F.; Corrente, S.; Greco, S.; Ishizaka, A.; Lami, I.M. A New Parsimonious AHP Methodology: Assigning Priorities to Many Objects by Comparing Pairwise Few Reference Objects. Expert Syst. Appl. 2019, 127, 109–120. [Google Scholar] [CrossRef] [Green Version]
- Ping-Yu, C.; Hsin-Yi, L. Manufacturing Plant Location Selection in Logistics Network Using Analytic Hierarchy Process. J. Ind. Eng. Manag. 2015, 8, 1547–1575. [Google Scholar]
- Hafezalkotob, A. Fuzzy Entropy-weighted MULTIMOORA Method for Materials Selection. J Intell. Fuzzy Syst. 2016, 31, 1211–1226. [Google Scholar] [CrossRef]
- Khoshand, A.; Rahimi, K.; Ehteshami, M.; Gharaei, S. Fuzzy AHP Approach for Prioritizing Electronic Waste Management Options: A Case Study of Tehran, Iran. Environ. Sci. Pollut. Res. 2019, 26, 9649–9660. [Google Scholar] [CrossRef]
- Yurdakul, M.; İç, Y.T. Comparison of Fuzzy and Crisp Versions of an AHP and TOPSIS model for Nontraditional Manufacturing Process Ranking Decision. Int. J. Adv. Manuf. Technol. 2019, 18, 167–192. [Google Scholar] [CrossRef]
- Lee, H.C.; Chang, C.T. Comparative Analysis of MCDM Methods for Ranking Renewable Energy Sources in Taiwan. Renew. Sustain. Energ. Rev. 2018, 92, 883–896. [Google Scholar] [CrossRef]
- Akram, M.; Ilyas, F.; Garg, H. Multi-Criteria Group Decision Making Based on ELECTRE I Method in Pythagorean Fuzzy Information. Soft Comput. 2020, 24, 3425–3453. [Google Scholar] [CrossRef]
- Mousavi-Nasab, S.H.; Sotoudeh-Anvari, A. A Comprehensive MCDM-Based Approach Using TOPSIS, COPRAS, and DEA as an Auxiliary Tool for Material Selection Problems. Mater. Des. 2017, 121, 237–253. [Google Scholar] [CrossRef]
- Zhao, R.; Liu, S.; Liu, Y.; Zhang, L.; Li, Y. A Safety Vulnerability Assessment for Chemical Enterprises: A Hybrid of a Data Envelopment Analysis and Fuzzy Decision-making. J. Loss Prev. Process. Ind. 2018, 56, 95–103. [Google Scholar] [CrossRef]
- Toloo, M.; Salahi, M. A Powerful Discriminative Approach for Selecting the Most Efficient Unit in DEA. Comput. Ind. Eng. 2018, 115, 269–277. [Google Scholar] [CrossRef]
- Korhonen, P.J.; Siitari, P.A. A Dimensional Decomposition Approach to Identifying Efficient Units in Large-Scale DEA Models. Comput. Oper. Res. 2009, 36, 234–244. [Google Scholar] [CrossRef] [Green Version]
- Yazdani, M.; Payam, A.F. A Comparative Study on Material Selection of Microelectromechanical Systems Electrostatic Actuators Using Ashby, VIKOR, and TOPSIS. Mater. Des. 2015, 65, 328–334. [Google Scholar] [CrossRef]
- Manivannan, R.; Kumar, M.P. Multi-attribute Decision-making of Cryogenically Cooled Micro-EDM Drilling Process Parameters Using TOPSIS Method. Mater. Manuf. Process. 2017, 32, 209–215. [Google Scholar] [CrossRef]
- Mohsin, M.; Zhang, J.; Saidur, R.; Sun, H.; Sait, S.M. Economic Assessment and Ranking of Wind Power Potential Using Fuzzy-TOPSIS Approach. Environ. Sci. Pollut. Res. 2019, 26, 22494–22511. [Google Scholar] [CrossRef]
- Zhang, K.; Zhan, J.; Yao, Y. TOPSIS Method Based on a Fuzzy Covering Approximation Space: An Application to Biological Nanomaterials Selection. Inf. Sci. 2019, 502, 297–329. [Google Scholar] [CrossRef]
- Mardani, A.; Zavadskas, E.K.; Govindan, K.; Senin, A.A.; Jusoh, A. VIKOR Technique: A Systematic Review of the State-of-the-Art Literature on Methodologies and Applications. Sustainability 2016, 8, 37. [Google Scholar] [CrossRef] [Green Version]
- Kuo, J.Y. The Study on the Evaluation of the Pollution Control Situation of the Sewage Systems in the Counties and Cities of Taiwan by Applying the VIKOR Method. Environ. Sci. Pollut. Res. 2017, 24, 26958–26966. [Google Scholar] [CrossRef]
- Dev, S.; Aherwar, A.; Patnaik, A. Material Selection for Automotive Piston Components Using Entropy-VIKOR Method. Silicon 2020, 12, 155–169. [Google Scholar] [CrossRef]
- Gupta, M.; Kumar, S. Multi-Objective Optimization of Cutting Parameters in Turning Using Grey Relational Analysis. Int. J. Ind. Eng. Comput. 2013, 4, 547–558. [Google Scholar] [CrossRef]
- Rajesh, R.; Ravi, V. Supplier Selection in Resilient Supply Chains: A Grey Relational Analysis Approach. J. Clean Prod. 2015, 86, 343–359. [Google Scholar] [CrossRef]
- Bao, J.; Zhang, J.; Shi, S.; Johansson, J. Cleaner Production Assessment of Group Company based on Improved AHP and Grey Relational Analysis. J. Intell. Fuzzy Syst. 2018, 35, 439–444. [Google Scholar] [CrossRef]
- Liao, C.N.; Kao, H.P. An Integrated Fuzzy TOPSIS and MCGP Approach to Supplier Selection in Supply Chain Management. Expert Syst. Appl. 2011, 38, 10803–10811. [Google Scholar] [CrossRef]
- Ramezani, M.; Bashiri, M.; Atkinson, A.C. A Goal Programming-TOPSIS Approach to Multiple Response Optimization Using the Concepts of Non-Dominated Solutions and Prediction Intervals. Expert Syst. Appl. 2011, 38, 9557–9563. [Google Scholar] [CrossRef]
- Bakeshlou, E.A.; Khamseh, A.A.; Asl, M.A.G.; Sadeghi, J.; Abbaszadeh, M. Evaluating a Green Supplier Selection Problem Using a Hybrid Modm Algorithm. J. Intell. Manuf. 2014, 28, 1–15. [Google Scholar] [CrossRef]
- Mousavi-Nasab, S.H.; Sotoudeh-Anvari, A. A New Multi-criteria Decision Making Approach for Sustainable Material Selection Problem: A Critical Study on Rank Reversal Problem. J. Clean. Prod. 2018, 182, 466–484. [Google Scholar] [CrossRef]
- Dornfeld, D.A. Moving towards Green and Sustainable Manufacturing. Int. J. Precis. Eng. Manuf.-Green Technol. 2014, 1, 63–66. [Google Scholar] [CrossRef] [Green Version]
- Amah, E. Corporate Culture and Organizational Effectiveness: A Study of the Nigerian Banking Industry. Eur. J. Bus. Manag. 2012, 4, 212–229. [Google Scholar]
- Dubey, R.; Gunasekaran, A.; Ali, S.S. Exploring the Relationship between Leadership, Operational Practices, Institutional Pressures and Environmental Performance: A Framework for Green Supply Chain. Int. J. Prod. Econ. 2015, 160, 120–132. [Google Scholar] [CrossRef]
- Stewart, W.H., Jr.; Carland, J.C.; Carland, J.W.; Watson, W.W.; Sweo, R. Entrepreneurial Dispositions and Goal Orientations: A comparative Exploration of United States and Russian entrepreneurs. J. Small Bus. Manag. 2003, 41, 27–46. [Google Scholar] [CrossRef]
- Zhao, R.; Peng, D.; Li, Y. An Interaction between Government and Manufacturer in Implementation of Cleaner Production: A Multi-Stage Game Theoretical Analysis. Int. J. Environ. Res. 2015, 9, 1069–1078. [Google Scholar]
- Smith, P. The Relationship between Management Accounting, Profitability and Operations in an Uncertain World: Evidence from Literature and Practice. Ph.D. Thesis, Cranfield University, Cranfield, UK, 2007. [Google Scholar]
- Wang, H.F.; Gupta, S.M. Green Supply Chain Management: Product Life Cycle Approach; McGraw-Hill: New York, NY, USA, 2011. [Google Scholar]
- Testa, F.; Iraldo, F. Shadows and Lights of GSCM (Green Supply Chain Management): Determinants and Effects of These Practices Based on a Multinational Study. J. Clean. Prod. 2010, 18, 953–962. [Google Scholar] [CrossRef] [Green Version]
- Madanhire, I.; Mugwindiri, K.; Mbohwa, C. Enhancing Cleaner Production Application in Fertilizer Manufacturing: Case Study. Clean. Technol. Environ. 2015, 17, 667–679. [Google Scholar] [CrossRef]
- Ljungberg, L.Y. Materials Selection and Design for Development of Sustainable Products. Mater. Des. 2007, 28, 466–479. [Google Scholar] [CrossRef]
- Zhao, R.; Su, H.; Chen, X.; Yu, Y. Commercially Available Materials Selection in Sustainable Design: An Integrated Multi-Attribute Decision Making Approach. Sustainability 2016, 8, 79. [Google Scholar] [CrossRef] [Green Version]
- Fried, H.O.; Lovell, C.A.K.; Schmidt, S.S.; Yaisawarng, S. Accounting for Environmental Effects and Statistical Noise in Data Envelopment Analysis. J. Product. Anal. 2002, 17, 157–174. [Google Scholar] [CrossRef]
- Arakawa, Y.B.Y.N. Multiple Criteria Decision Making with Generalized DEA and an Aspiration Level Method. Eur. J. Oper. Res. 2004, 158, 697–706. [Google Scholar]
- Wittstruck, D.; Teuteberg, F. Integrating the Concept of Sustainability into the Partner Selection Process: A Fuzzy-AHP-TOPSIS Approach. Int. J. Logist. Syst. Manag. 2012, 12, 195–226. [Google Scholar] [CrossRef]
- Chen, C.T. Extensions of the TOPSIS for Group Decision-making under Fuzzy Environment. Fuzzy Sets Syst. 2000, 114, 1–9. [Google Scholar] [CrossRef]
- Sotoudeh-Anvari, A.; Sadi-Nezhad, S. A New Approach Based on the Level of Reliability of Information to Determine the Relative Weights of Criteria in Fuzzy TOPSIS. Int. J. Appl. Decis. Sci. 2015, 8, 164. [Google Scholar]
- Liu, F.; Li, C.B.; Cao, H.J.; Wang, Q.L. Green Manufacturing Technology Connotation and System Framework Based on Product Life Cycle. J. Mech. Eng. 2009, 45, 115e120. [Google Scholar] [CrossRef]
- Wang, S.Y. Research on Sustainable Design of Typical Furniture; Harbin Engineering University: Harbin, China, 2014. [Google Scholar]
- Yu, X.F.; Song, K.Y.; Zhou, X. Simple Analysis of Low Carbon Development on China’s Furniture Industry. Wood Process. Mach. 2013, 24, 40–44. [Google Scholar]
- Wu, Z.H. Green Furniture Technology; China Forestry Publishing House: Beijing, China, 2006. [Google Scholar]
- Liu, Y.; Wu, Z.H.; Xu, W. Review of LCA’s Application to Furniture Industry. World J. For. Res. 2019, 2, 1–6. [Google Scholar]
- Gonzalez-García, S.; Gasol, C.M.; Lozano, R.G.; Moreira, M.T.; Gabarrell, X.; Pons, J.R.I. Assessing the Global Warming Potential of Wooden Products from the Furniture Sector to Improve Their Eco-Design. Sci. Total Environ. 2011, 410, 16–25. [Google Scholar] [CrossRef]
- Deng, B.J.; Tao, T.; Zhu, H. Study on Developing Environment Friendly Furniture Production Industry. China For. Prod. Ind. 2004, 1, 21–23. [Google Scholar]
- Zhu, J.G.; Wu, Z.H. Technology System for Green Manufacturing in Furniture Industry -3rd: Green Design Technology (I). Furniture 2013, 34, 75–79. [Google Scholar]
- Zhu, J.G.; Wu, Z.H. Technology System for Green Manufacturing in Furniture Industry -5th: Green Process Technology. Furniture 2013, 34, 67–71. [Google Scholar]
- Liu, X.H. Discussion of Sampling & Method of Determination of Release of Formaldehyde in Furniture. Furniture 2002, 6, 13–17. [Google Scholar]
- Andersen, P.; Petersen, N.C. A Procedure for Ranking Efficient Units in Data Envelopment Analysis. Manag. Sci. 1993, 39, 1261–1264. [Google Scholar] [CrossRef]
- Mon, D.L. Evaluating Weapon System Using Fuzzy Analytic Hierarchy Process Based on Entropy Weight. Fuzzy Sets Syst. 1994, 62, 127–134. [Google Scholar] [CrossRef]


| Category | Index |
|---|---|
| Input | Direct cost |
| Manufacturing cost | |
| Environmental cost | |
| Output | Product performance |
| Index | Characterization Method | Source |
|---|---|---|
| Direct cost | Material price | In terms of the development of China’s green furniture manufacturing industry, increasing numbers of manufacturers are shifting closer toward social responsibility and environmental protection policies, and are doing so to abide by legal requirements and administrative orders and leave a favorable impression on their consumers. Nevertheless, it is transparently clear that low-cost materials are still favored, and economy is often prioritized when selecting materials [62]. |
| Manufacturing cost | Processing cost | Similar to other material selection criteria, wood’s processing cost is also one of its key factors. Different kinds of wood processed in the same way may result in various degrees of purchaser satisfaction. This is mainly caused by affinity to coatings, textures, required design space based on hardness, and other attributes of different woods [64]. |
| Environmental cost | Shipping distance | In terms of shipping distance, the main consideration is generally cost, and sometimes wood from a distant origin may be selected in order to meet specific design requirements [65]. In the selection of green materials, it is often believed that the farther the shipping distance, the higher the transportation cost, and also the greater the environmental pressure [49]. |
| Regeneration period | Theoretical research on the product life cycle of the household goods industry provides new perspectives for discussion of this issue [66]. Obviously, cutting trees with long growth cycles has a greater impact on the ecological footprint than cutting those with shorter ones [67]. On the other hand, precious woods, usually with longer growth cycles, create higher product satisfaction. Therefore, green material selection in furniture manufacturing is undoubtedly faced with tradeoffs. | |
| Scrap rate | For wood, the raw material of the vast majority green furniture design, another key criterion is the scrap rate, which creates both economic costs and environmental pressures. Due to varying textures of different woods, the leftover materials in the processing process can, to varying degrees, be reused for other purposes [68,69]. | |
| Product performance | Expected product price | In some studies, the attributes of the finished product are separated for evaluation when discussing the material selection scheme [38,49]. Considering that the evaluation of furniture product quality is often affected by cultural and other subjective factors [70], this study condenses product performance into the expected price of the product. |
| Direct Cost | Manufacturing Cost | Environmental Cost | Product Performance | |||
|---|---|---|---|---|---|---|
| Material Price | Processing Cost | Shipping Distance | Regeneration Period | Scrap Rate | Expected Product Price | |
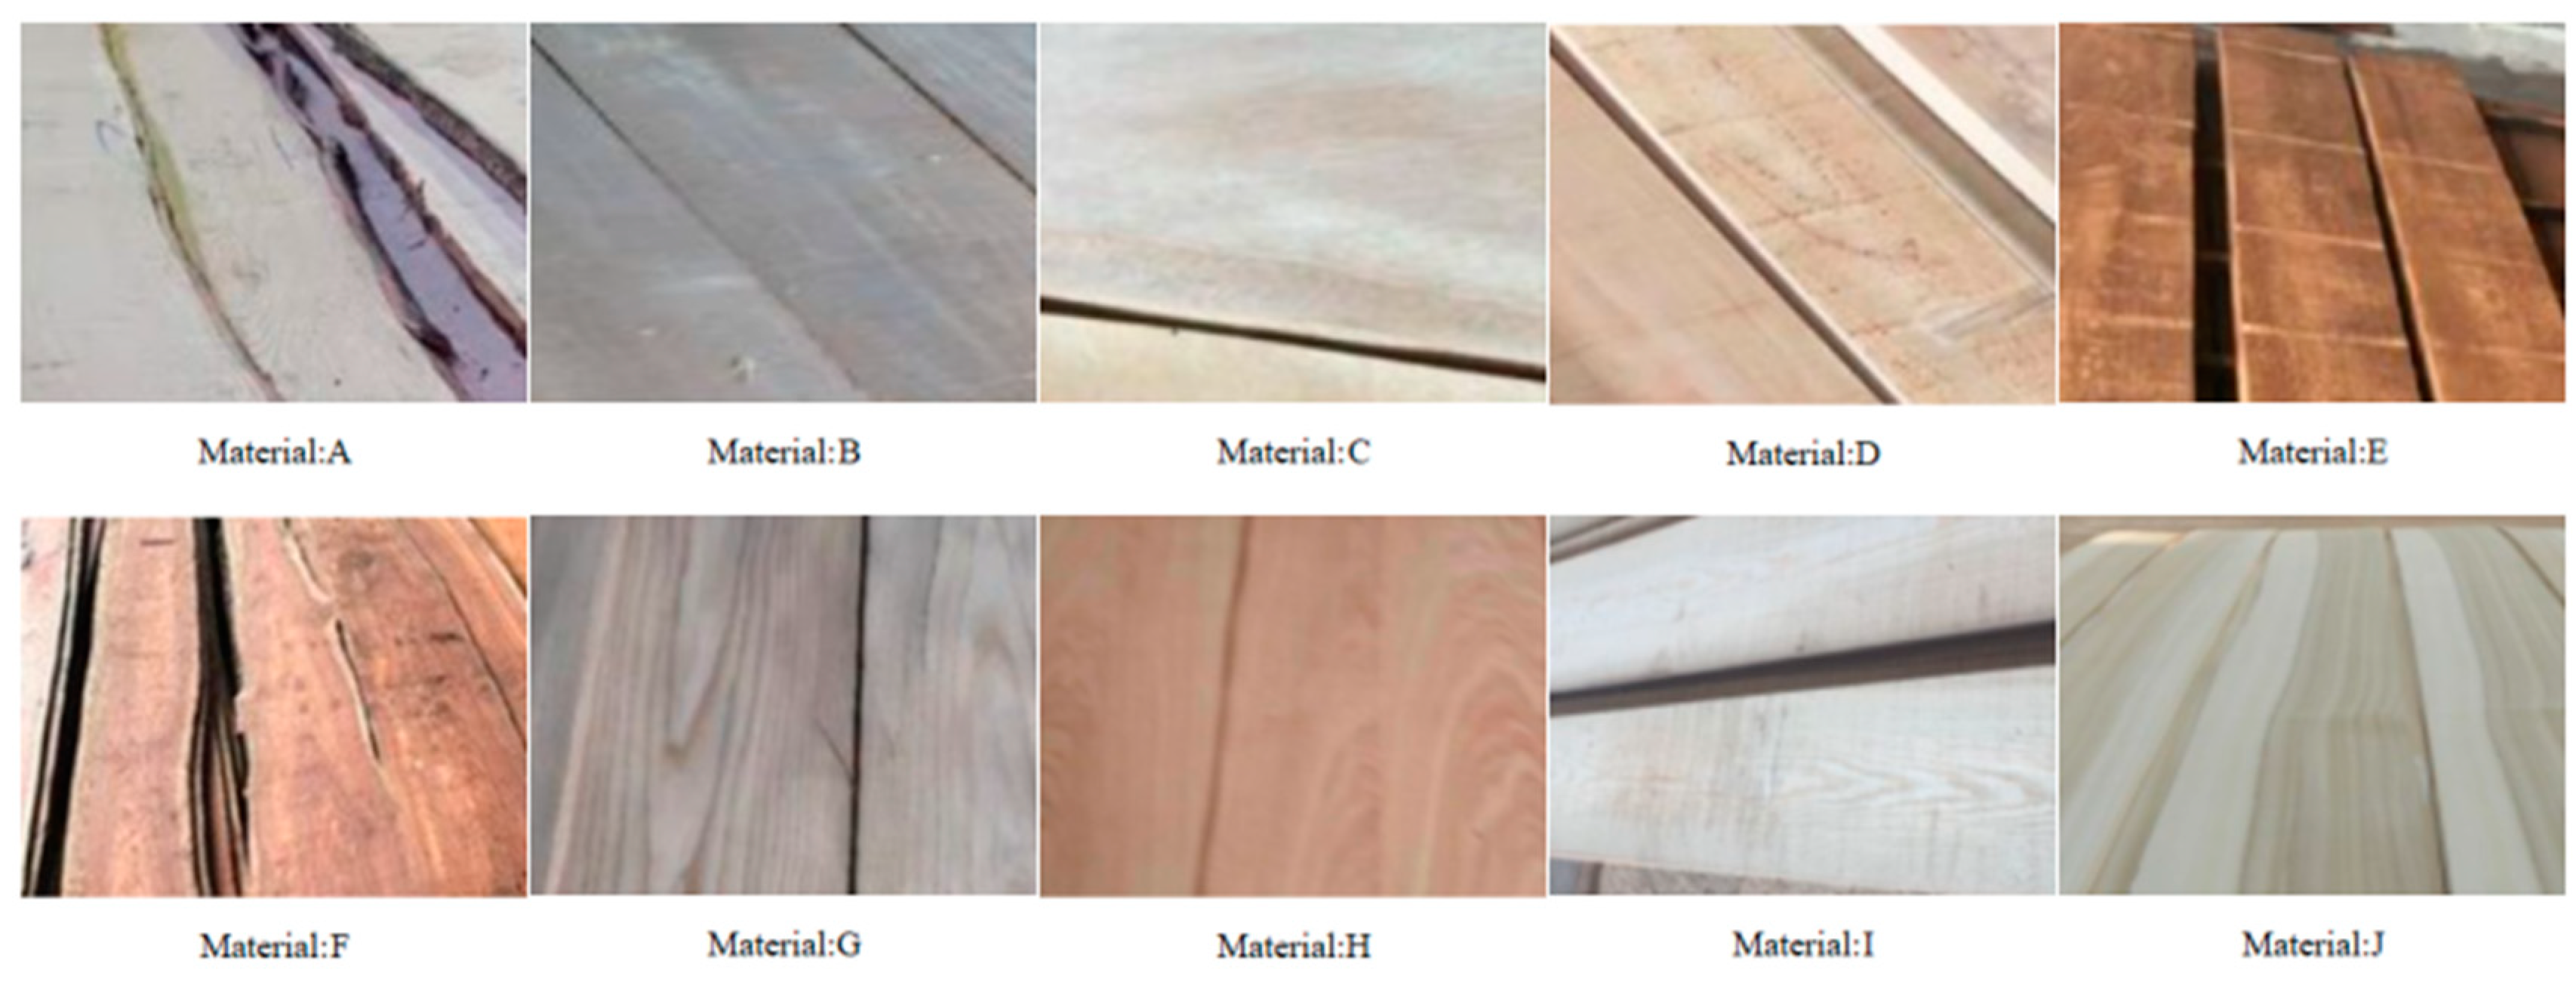
| A: Oak | 15 | 80 | 90 | 69.23 | 84.01 | 82.66 |
| B: Rubber wood | 9 | 84.5 | 84 | 15.38 | 80.74 | 40.37 |
| C: Camphorwood | 4 | 81 | 95 | 7.69 | 93.17 | 44.21 |
| D: Beech | 12 | 83 | 77 | 15.38 | 92.36 | 36.52 |
| E: Walnut | 39 | 81.5 | 96 | 76.92 | 80.49 | 90.35 |
| F: Mahogany | 96 | 82.5 | 95 | 96.38 | 85.62 | 98.04 |
| G: Elm | 7 | 81.5 | 87 | 53.85 | 89.16 | 63.44 |
| H: Birch | 7 | 82.5 | 79 | 23.08 | 86.68 | 48.06 |
| I: Ash wood | 16 | 84 | 92 | 30.77 | 86.92 | 68.06 |
| J: Poplar | 5 | 84 | 76 | 15.38 | 88.07 | 32.68 |
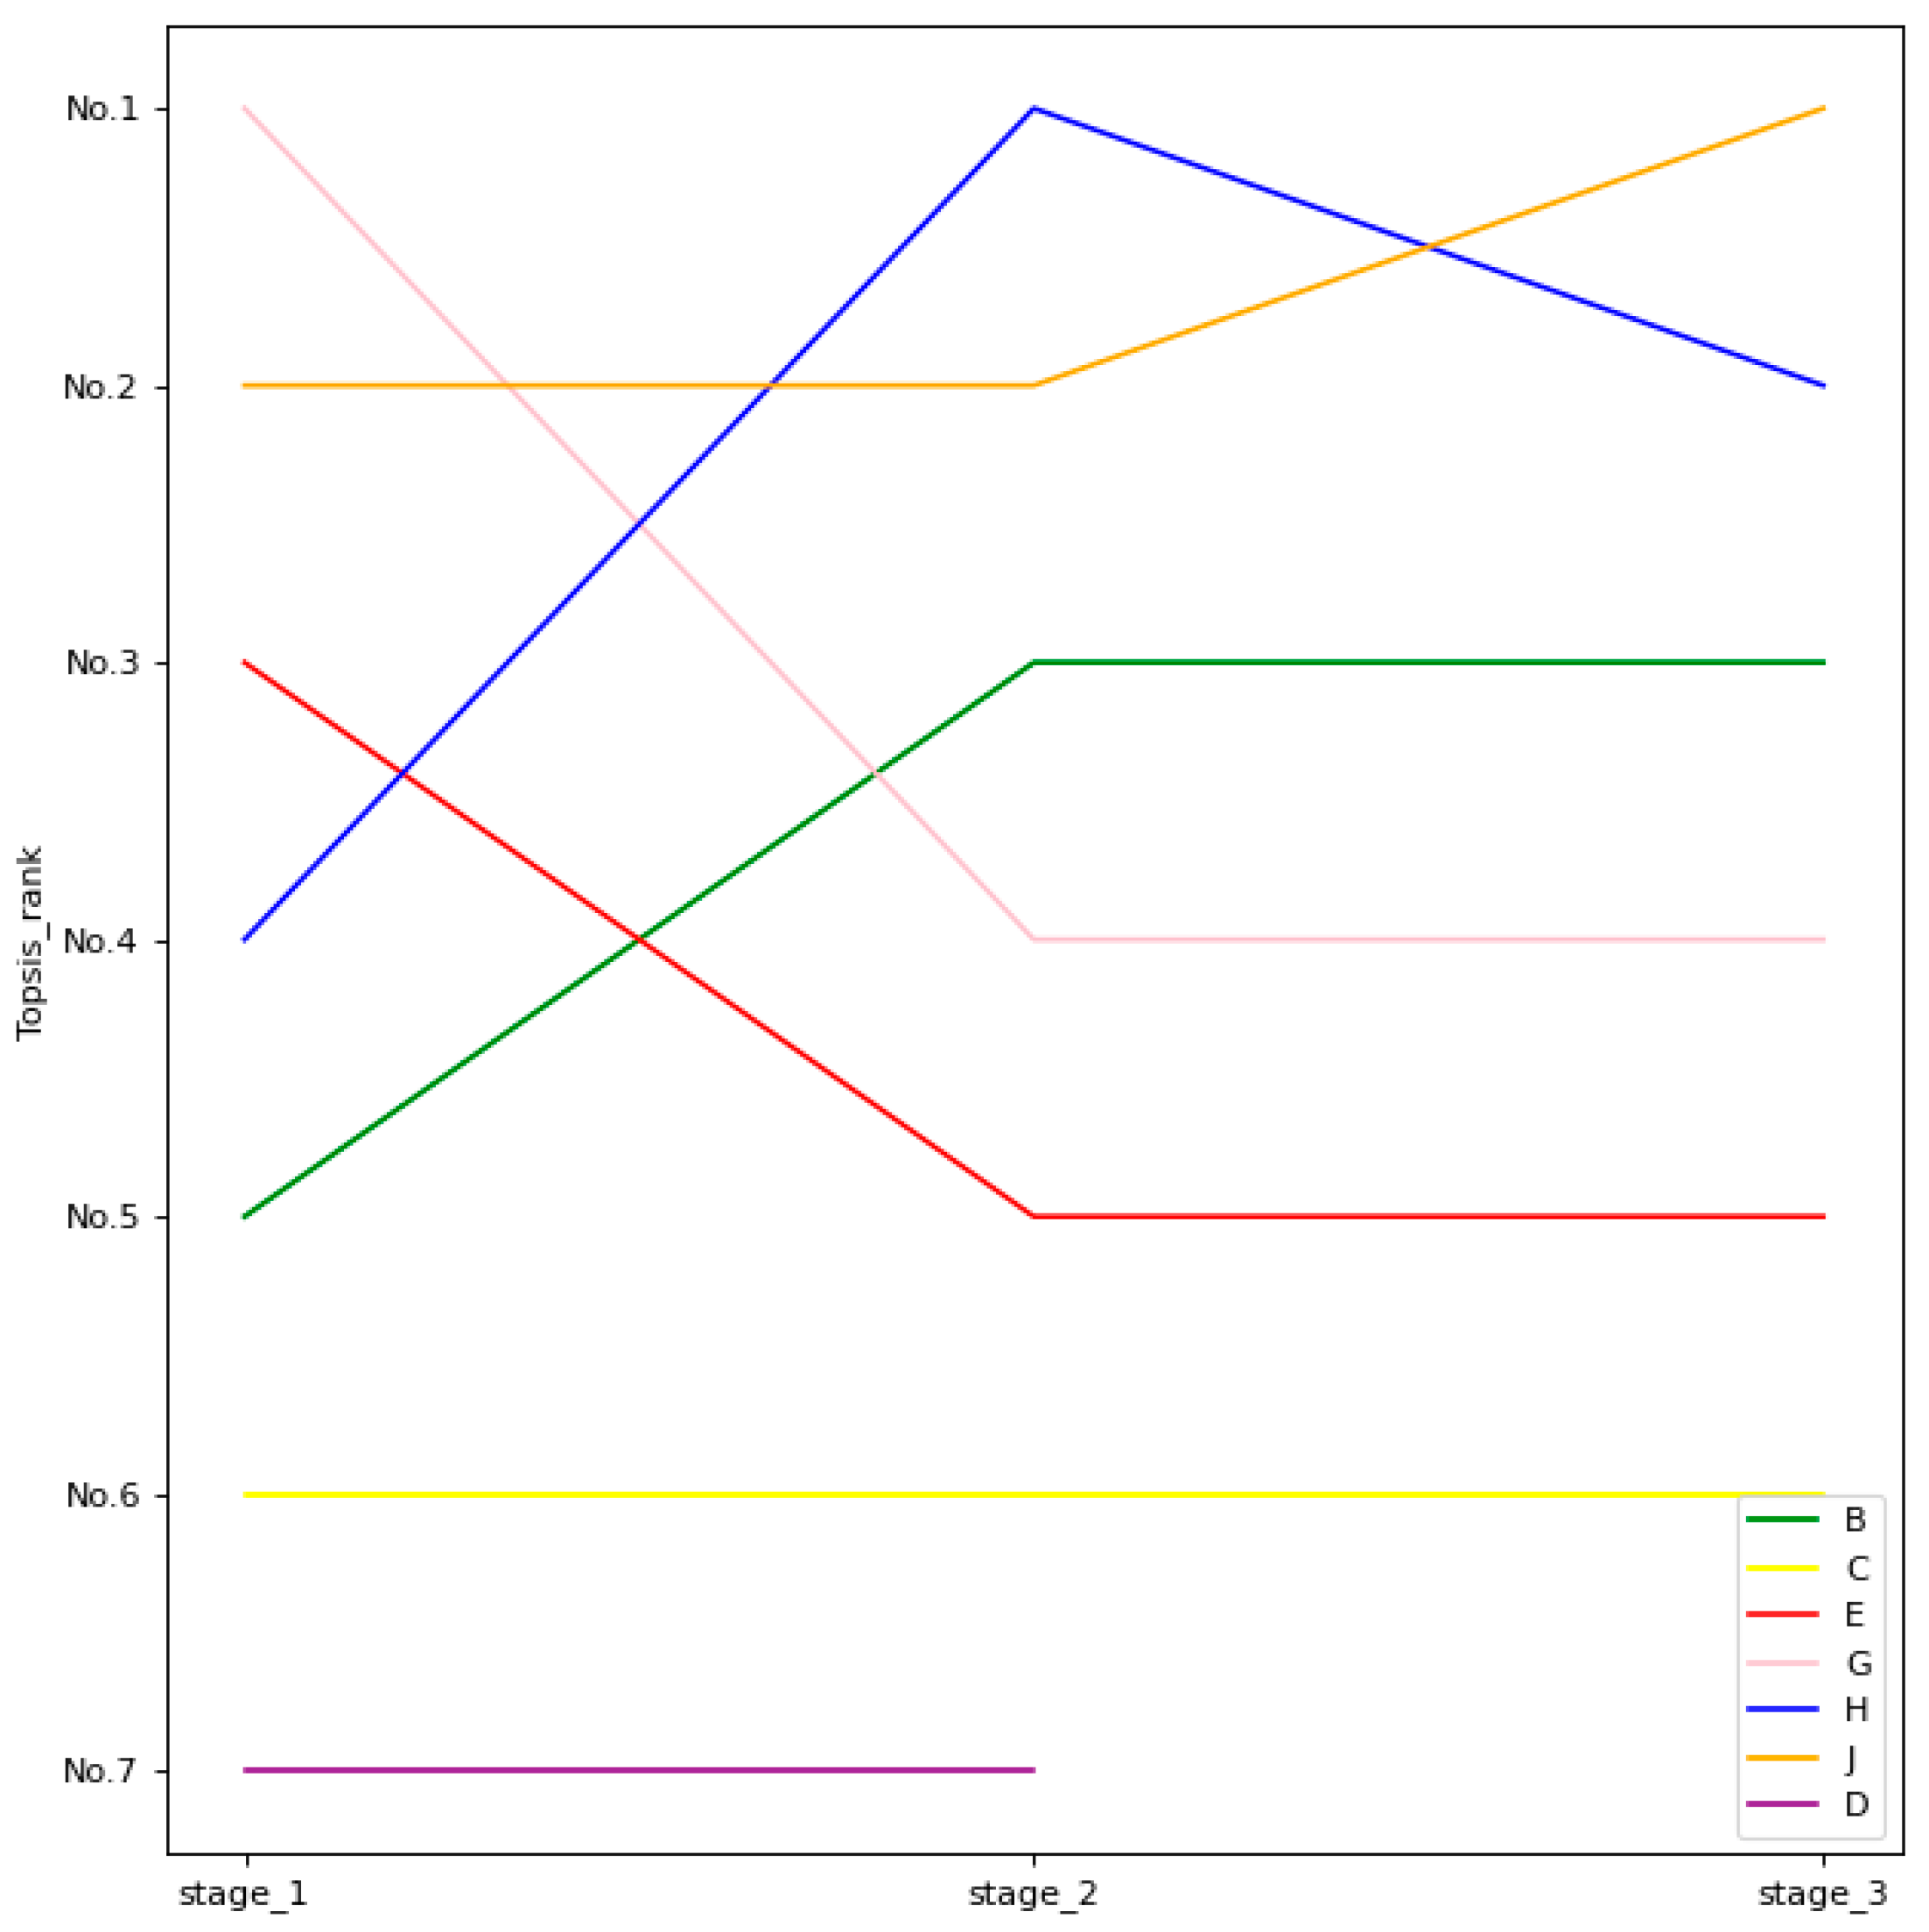
| Timber | A | B | C | D | E | F | G | H | I | J |
|---|---|---|---|---|---|---|---|---|---|---|
| Efficiency Value at Stage I | 0.89 | 1 | 1 | 1 | 1 | 0.98 | 1 | 1 | 0.96 | 1 |
| Efficiency Value at Stage II | \ | 1 | 1 | 0.87 | 1 | \ | 1 | 1 | \ | 1 |
| Timber | A | B | C | D | E | F | G | H | I | J |
|---|---|---|---|---|---|---|---|---|---|---|
| Efficiency Value in Stage I | 0.78 | 0.91 | 0.64 | 1.04 | 1.14 | 0.74 | 1.11 | 1.36 | 0.96 | 1.16 |
| Efficiency Value in Stage II | \ | \ | \ | 0.62 | 1.07 | \ | 1.09 | 1.43 | \ | 1.76 |
Publisher’s Note: MDPI stays neutral with regard to jurisdictional claims in published maps and institutional affiliations. |
© 2021 by the authors. Licensee MDPI, Basel, Switzerland. This article is an open access article distributed under the terms and conditions of the Creative Commons Attribution (CC BY) license (https://creativecommons.org/licenses/by/4.0/).
Share and Cite
Peng, C.; Feng, D.; Guo, S. Material Selection in Green Design: A Method Combining DEA and TOPSIS. Sustainability 2021, 13, 5497. https://doi.org/10.3390/su13105497
Peng C, Feng D, Guo S. Material Selection in Green Design: A Method Combining DEA and TOPSIS. Sustainability. 2021; 13(10):5497. https://doi.org/10.3390/su13105497
Chicago/Turabian StylePeng, Cheng, Dianzhuang Feng, and Sidai Guo. 2021. "Material Selection in Green Design: A Method Combining DEA and TOPSIS" Sustainability 13, no. 10: 5497. https://doi.org/10.3390/su13105497
APA StylePeng, C., Feng, D., & Guo, S. (2021). Material Selection in Green Design: A Method Combining DEA and TOPSIS. Sustainability, 13(10), 5497. https://doi.org/10.3390/su13105497