1. Introduction
Throughout the world, the continuous occurrences of urban transportation issues are portrayed as a serious urban issue. This problem has still not been resolved despite persistent technical and policy support and effort. The issue has further intensified owing to increased population in cities and the increase in megacities to the point where the concept of the megalopolis has been introduced. Moreover, increasing global population and aging are also accelerating the population concentration problem in cities [
1,
2,
3].
The representative urban transportation issues caused by urban population concentration and expansion of cities are as follows: As public transit can only be used after a user arrives at a bus stop or a subway station, it requires that the users walk to a stop or a station. Moreover, waiting time is unavoidable as public transit is not always available immediately when the users arrive at a stop or a station. Road transportation modes such as buses and taxis allow users to experience traffic congestion, which deprives freedom of travel. The more aggravated these inconveniences become in using public transportation, the more personal vehicles are being used. In this regard, research related to automobile dependence on the outskirts [
4,
5,
6] and sustainable rural access [
7,
8,
9,
10] was recently conducted. This automobile dependence leads to demand that exceeds the limited capacity of roads, causing severe traffic congestions. Vehicles that cause the congestion commit illegal parking owing to insufficient parking spaces, leading to extreme social issues such as casualties within child protection zones. Furthermore, the excessive use of vehicles degrades the mobility of public transportation, which again leads to a decreased use of public transportation. Its cumulated results cause serious environmental issues due to particulate matter and gas emissions, etc. In fact, transportation was verified to be the major source of carbon emissions and particulate matter generation, which is particularly recognized as a serious problem [
5,
11,
12].
To overcome these issues, new mobility services have emerged. These services include transportation services using shared transportation modes such as car sharing [
11,
13,
14,
15]. In particular, the concept of integrated transit service called Mobility as a Service (MaaS) was introduced recently and technical development for implementing increasingly advanced services is being encouraged. In the past, MaaS was recognized as the concept of one-card, one-pass (one transit card allowing the use of different transportation modes). However, the concept is being developed into using unlimited transportation services for a certain period by paying a flat-rate fee, regardless of transportation modes. During the process of this development, there has been a start to include personal vehicles (kickboards and bicycles, etc.) and paratransit modes such as the taxi in addition to traditional public transportation modes such as the bus and subway. The development extends its scope to designing and operating a single integrated platform of an entire transportation system by planning travel with all available means including ships and airplanes, etc., and proposing optimal routes and fees. MaaS is expected to provide a more powerful urban transportation service by distributing demand into various transportation modes, suggesting optimal routes, and controlling the traffic flow in urban areas accordingly.
MaaS enables the users to travel (a series of steps from the starting point and endpoint of travel) more efficiently so that they can use it without waiting a long time to facilitate transfer between different modes and provide door-to-door services similar to using personal vehicles. This is usually expected to reduce demand for vehicles to ultimately address urban transportation issues (congestions, parking problems, and pollution, etc.) simultaneously. In addition, it is expected to provide new growth engines toward sustainable green cities, completing a coexisting virtuous cycle of urban structure for the long term. However, the technology is only at the starting line of the conceptual establishment. To provide better services, the technology needs to be advanced by developing more systematic methodologies and implementing a variety of pilot projects, etc. Regarding this matter, many countries have studied a variety of living lab approaches [
16,
17,
18]. Many cases of experimental investigation underscore the importance of community participation [
19,
20,
21,
22]. Furthermore, case studies of small towns or villages demonstrate the importance of local characteristics in the decision-making process [
23,
24,
25].
Nevertheless, it has been determined that there are not enough cases of application or the demonstration of the services in regions with more complex urban structures. As such, this study designed services for Incheon City in the Republic of Korea (ROK) and analyzed the effectiveness based on service provision. In this regard, this study introduces an example of applying the simplest analysis results to the decision-making process conducted for the supply of new transportation means or systems, using data provided by the country that can be obtained simply. Research like this can be of great help in reducing difficulties in areas hesitating to introduce new means and systems, and in giving easy data access to researchers. Although this is a case in Korea, similar survey data are being produced in many countries, and when used, it is expected that it can be easily applied.
2. Status on Service Supply Target Area
Incheon City is a city in ROK, located in the far-east Asian region. Its geographical location is 126°37′ E, 37°28′ N. Among the seven metropolitan cities in the country, Incheon has the largest urban area (1063 km
2), but a relatively low population density (2779 persons/km
2), which is ranked 5th [
26]. Moreover, its administrative area system currently consists of eight units of
gu, one of
eup, 19 of
myeon, and 113 of
dong. When expanded to units of
eup,
myeon, and
dong, it consists of a total of 153 administrative areas, requiring a great deal of investment resources including a variety of supportive policies to balance transportation services in the area.
As shown in
Figure 1, the structure and data source and contents for the basic decision-making method were defined. To examine the current status more objectively and in detail, data research and analysis on the status of transportation facilities and services in the region were conducted as follows. The composition of the following study was classified according to the composition and subject of each data.
Section 2.1 provides the statistics related to roads,
Section 2.2 presents survey results related to bus service,
Section 2.3 presents survey results related to the subway, and
Section 2.4 presents the results of the overall satisfaction survey on public transport services. Each content is related to the status of the transportation facility and the user’s evaluation of the use of the facility.
2.1. Road Statistics
According to the road extension rate statistics shown in
Table 1 [
27], out of 17 cities and provinces, Incheon is rated 10th in the area and 11th in road extension, implying that the road extension compared to the city area is at a similar level to the national average ratio. On the other hand, its population and the number of vehicles are ranked 5th and 4th, respectively, showing a relatively higher population and a greater number of registered vehicles. Thus, it was revealed that the road extension per person is poor, and road extension per vehicle is the lowest of all cities and provinces in the country. This aggravates traffic congestion and shortage of parking spaces. The government has been consistently investing with the budget to resolve these issues; however, as road extension cannot be increased infinitely, transportation modes need to be transferred to public transportation (to decrease the mode share of personal cars).
2.2. Status of Bus Service Provision
As previously reviewed, the city of Incheon has a large area and a mixture of various land uses, providing an unusual bus service. A characteristic is that the stops and routes are concentrated in a specific area.
Incheon City provides an average of 7.73 buses per 10,000 people through a total of 5634 stops and 197 routes, which is higher than Seoul (7.31 buses/10,000 people) and Busan (7.15 buses/10,000 people), and the highest in the country [
28]. The number of buses supplied for the urban area is relatively low, which is 1/6 of Seoul and 2/3 of Busan. However, it is attributable to a higher proportion of islands and mountainous areas than Seoul and Busan.
There are many areas in which public transportation, including such islands, is relatively difficult to supply, and demand is also difficult to maintain, so it is not easy to provide public transportation services. As described above, Incheon has characteristics of both urban and suburban areas, so the results of this study are thus considered to be more meaningful.
2.3. Status of Subway Service Provision
In Incheon, a total of five subway lines operate including Incheon line 1, Incheon line 2, Gyeong-in line, Su-in line, and Seoul metropolitan line 7. The system provides a total of 80 passenger stations (transfer stations duplicated) [
29].
Table 2 shows the subway allocation status by
gu and
gun of Incheon.
Table 3 shows the results of reanalyzing the statistics based on the number of stations per unit area (1 km
2) and population (10,000 people) by excluding Ganghwa-gun and Ongjin-gun, which do not have subway stations.
Compared with Seoul, having the most excellent public transportation service in the country with a total of 316 stations in 25 units of gu, Yeonsu-gu, which has the highest number of stations per unit population in Incheon, is placed between Gangnam-gu in Seoul (0.49 stations/10,000 people) and Yeongdeungpo-gu (0.35 stations/10,000 people). It is equivalent to 7th place out of the 25 units of gu in Seoul. The number of stations per unit population excluding Ganghwa-gun and Ongjin-gun is equivalent to 17th place out of the 25 units of gu in Seoul, which is higher than Seocho-gu. Bupyeong-gu, having the highest number of stations per unit area (0.38 stations/km2) in Incheon, would be the 20th in Seoul, between Seongbuk-gu and Dobong-gu. It is equivalent to the average level of Seoul that has approximately four times higher number of stations per unit population. It was confirmed that Incheon provides moderate investment in infrastructure and services.
2.4. Review of User Satisfaction Level for Public Transportation Service
As the Incheon City government aims to increase the demand mode share of public transportation by reducing demand for private vehicles, the demand can be transferred to public transportation if the user satisfaction level for public transportation is high and continuously increasing. Thus, the citizens’ satisfaction level for public transit was reviewed as shown in
Figure 2. However, the figure demonstrates that in Incheon, the overall user satisfaction level decreased by about 1% each year, and remained lower than the national average level for the three years between 2016 and 2018.
2.5. Comprehensive Analysis Results and Findings
All types of transportation modes operating in the country are concentrated in Incheon City, where also a world-class airport Incheon International Airport is located. The city also has Incheon Port, a representative port of Korea. Moreover, it is equipped with metropolitan land transport infrastructures including express railways that run across the country, and a variety of infrastructures for providing public transportation services. Nevertheless, the user satisfaction level continues to decline; however, it implies that it is not caused by insufficient efforts to expand the transportation service infrastructure and improve services for traffic services including public transportation.
Based on the results of examining the abovementioned statistics, issues related to roads and transportation in Incheon can be diagnosed as follows. Even though each unit of
gu provides a sufficient number of bus stops and subway stations, they are concentrated in certain areas, degrading the accessibility of many citizens to public transportation infrastructures (in cases of long spatial distances), or lowering connectivity, which requires multiple transfers to reach a destination (in cases of lack of information or long temporal/psychological distances). Such cases are also revealed in a precedent study [
33], and to address them, efforts have been made by using different methods including providing additional infrastructure and adding routes (to reduce the number of transfers and waiting time). However, these methods, have been allocated a limited amount of budget, the effectiveness compared to the amount of the budget can be low, and the beneficiary of services is limited to certain areas. Therefore, these are difficult to be considered as alternatives.
To overcome these challenges, this study aimed to provide a new form of public transportation service and established the following goals to be achieved.
Spatial Distance: To reduce travel distance to bus stops/subway stations, and to reduce the travel distance between transfer stations.
Temporal Distance: To reduce travel time to bus stops/subway stations, to reduce transfer time, and to reduce waiting time at bus stops/subway stations.
Psychological Distance: To reduce the number of transfers.
Transportation Information: To provide integrated information on optimal/shortest travel routes/modes during transportation.
These goals are to overcome road and transportation issues by providing a new form of services such as “new sharing means” and “MaaS,” rather than using existing approaches such as adding infrastructure and modes.
3. Subject Areas to Supply Demand Response Public Transportation Modes
To select subject areas to resolve traffic problems through the supply of demand response public transportation modes, the following items were analyzed. The items for analysis include (1) areas with lower user satisfaction level for traffic environment, (2) areas with longer travel time to major infrastructure, (3) areas with lower public transportation competitiveness, (4) areas with higher demand for private vehicles, and (5) areas with expected adjustment of public transportation routes. These factors were comprehensively analyzed to derive areas with service needs.
3.1. Areas with Lower User Satisfaction Level for Traffic Environment
The table below shows the results of the investigation by Incheon City on residents’ subjective satisfaction level for traffic environment based on a comprehensive review of relevant facilities for public transportation and roads. As each user may determine a different user satisfaction level for the same infrastructure, it can be difficult to objectively determine its accuracy. However, it indicates the average satisfaction level of residents in the area, giving it a high value as reference variables to diagnose regional status. The survey of user satisfaction level (out of 5) for traffic environment in Incheon City revealed that out of the 10 units of
gu and
gun, the highest satisfaction level was shown in Yeonsu-gu and the lowest in Ongjin-gun, as shown in
Table 4.
3.2. Areas with Longer Travel Time to Major Infrastructure
The Korean Government provides statistics of travel time (average travel time, Korean Statistical Information Service Portal, 2017) to 11 facility types classified into four categories that citizens must use to go about their daily lives. The 11 facility types are classified as shown in
Table 5. Each type of facility was analyzed for averages of both Incheon City and 10 units of
gu and
gun.
For the entire Incheon City, the average travel time to the 11 facility types by public transportation/walking is 31.83 min, whereas, that using private vehicles was 22.36 min, showing a gap of 9.46 min. The review by the unit of
gu and
gun showed the largest gap of 25.43 min in Ganghwa-gun which is categorized as a remote area (island), followed by Jung-gu, Ongjin-gun, Yeonsu-gu, and Seo-gu. Only for the eight units of
gu, excluding the remote areas Ganghwa-gun and Ongjin-gun, were the biggest travel time gaps shown in the order of Jung-gu, Yeonsu-gu, and Seo-gu, which are the highlighted areas in
Table 6, demonstrating relatively low public transportation competitiveness.
3.3. Areas with Higher Demand for Vehicles
Analysis of mode share for each travel purpose in Incheon showed that the mode share of cars accounts for 50.3% as shown in
Figure 3. The increased mode share in 2016 compared with 2016 represents a mode share added from the share of buses. In 2016, the most recent base year for the disclosed mode shares, buses (public transportation) account for the largest share of 60.6% for going to school, but cars account for the larges shares for all the remaining travel purposes. Especially for commuting, 76.9% of passengers with commuting purposes used cars. It is deemed that, despite the expected severe traffic congestion during peak time, commuters choose cars because the inconveniences of using public transportation exceed the inconvenience of traffic congestion when driving their cars.
3.4. Areas with Expected Adjustment of Public Transportation Routes
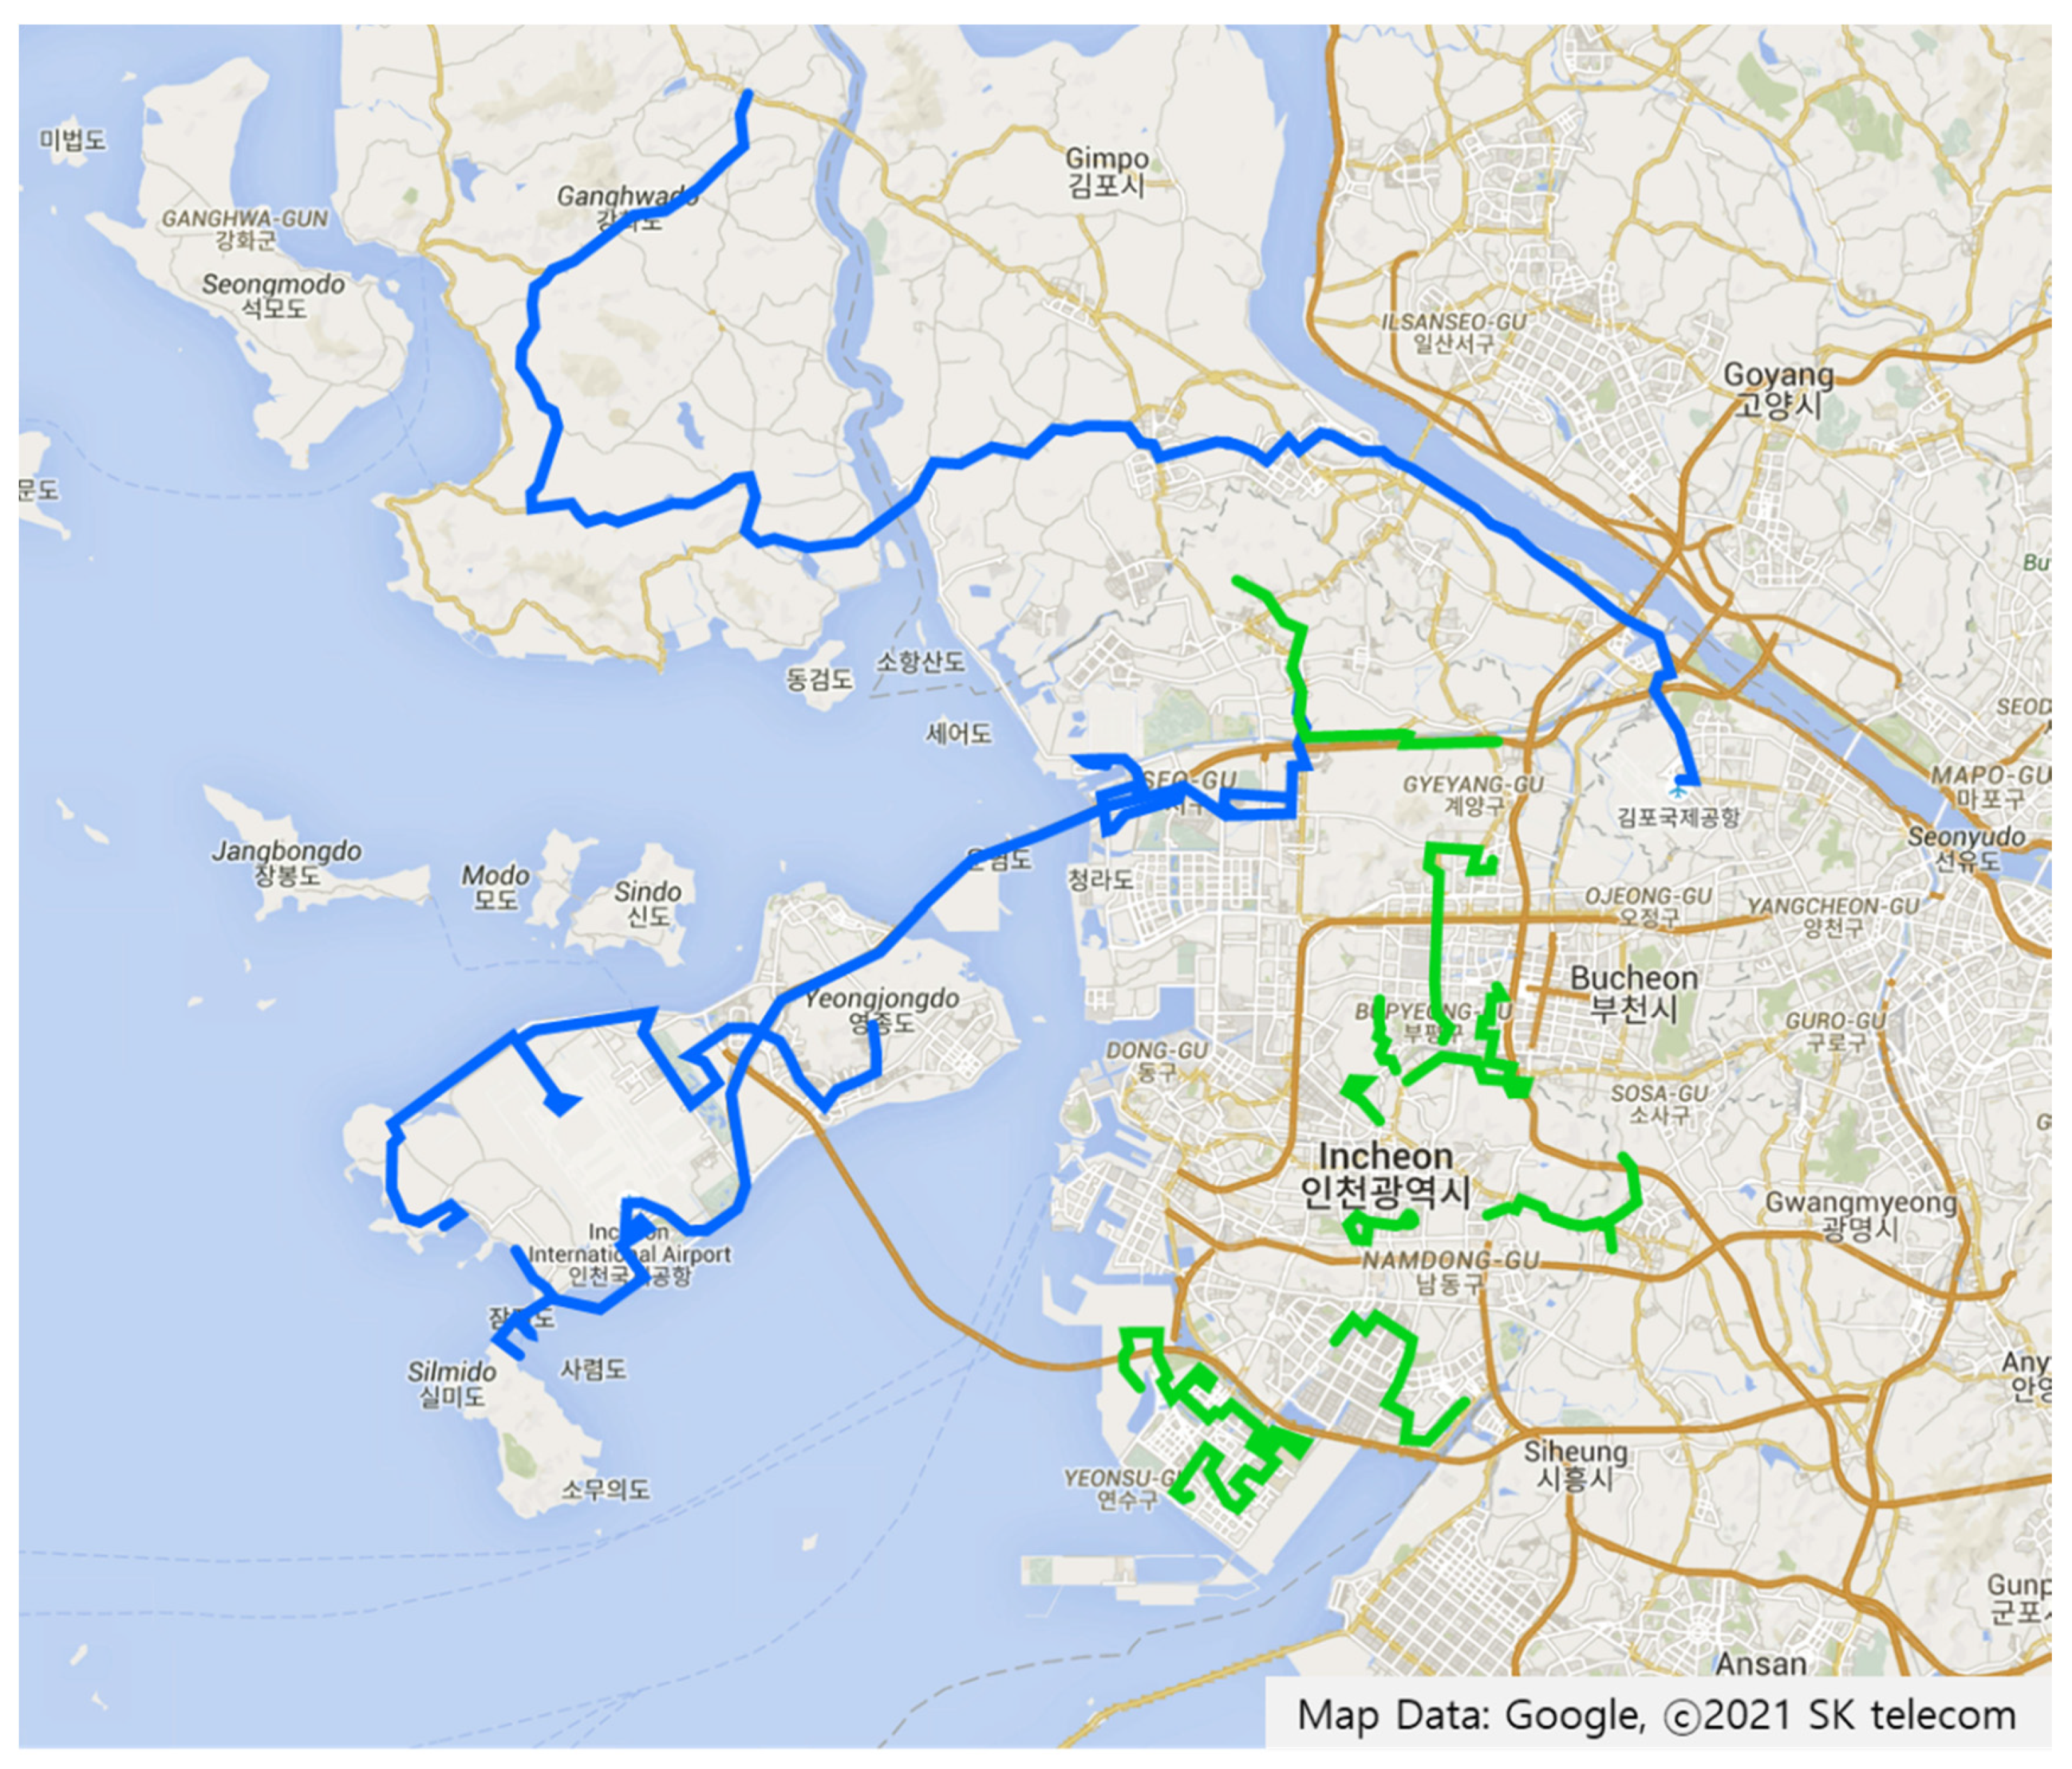
This study analyzed 157 routes from statistical data of route operation systems and operating profits in Incheon City as of 1 January 2020. The statistics include profits generated from the routes, based on which route adjustment and merger occur. In this perspective, areas with the lowest 10% of profits from public transportation were derived based on the high possibility of modification of the operation system through adjustment. As a result, a total of 15 routes was selected as shown in
Figure 4. The blue lines represent main routes, and the green lines represent branch routes.
3.5. Comprehensive Review Results of Subject Areas for Demand Response Public Transportation Modes
To select areas that require the supply of demand response public transportation modes, the above analysis results were collected in accordance with the following principles:
Areas with lower quality of current public transportation services (
Figure 5a,b)
Areas with higher public transportation demand, but insufficient supply of services (
Figure 5c)
Areas with expected disconnection of public transportation due to the reorganization of the route system by the municipal government despite the presence of public transportation demand (
Figure 5d)
Out of the 10 units of
gu and
gun, excluding island areas such as Ongjin-gun and Ganghwa-gun, a total of eight units of
gu was analyzed and the results are shown in
Figure 5. For the results, weighted values were assigned to the areas having the issues, and these were overlapped to each item to derive areas that mostly require improvement.
This study did not apply weighted values when statistics for each item were aggregated. The weighted value for each item may be changed based on a determination by decision-makers or priorities of the area. However, to derive subject areas for regular services, this methodologic study applied the same weight to all items and used the aggregated results to derive areas that require public transportation service improvements and additional supply. The results showed the highest demand for public transportation improvement and additional supply in the order of Jung-gu, Seo-gu, and Yeonsu-gu, which are the highlighted areas in
Figure 6.
4. Effectiveness Verification through Pilot Service
A pilot service was implemented in Jung-gu, which was selected as the area with the highest priority. The basic operation method of demand response public transportation service involved a user entering the current location and destination in a smartphone app, regardless of the location of the station, and allocating transit based on the input. The allocation of transit is based on the location of vehicles, the location of the passenger, the shortest path, and traffic status. Another passenger who has a nearby destination or can be picked up/dropped off on the path may share the vehicle. For the fare, the regular intra-city bus fare was applied and details are shown below.
4.1. Status of Subject Areas for Pilot Operation
Jung-gu, Incheon, belongs to an area with vulnerable public transportation owing to its low population density and transitional characteristics of new town development. In particular, in Yeongjong International City located in Jung-gu, the average bus service operation interval is very large, causing major inconvenience to the users. Therefore, the study aimed to resolve the inconvenience of government-operated buses by supplying the demand response transportation mode in Yeongjong International City of Jung-gu and verifying the possibility of restraining the demand for cars and revitalization of public transportation through this.
There are 181 public transportation vehicles in operation through 20 routes in Yeongjong International City. In addition, eight government-operated buses are currently in operation through six routes. Nevertheless, the area experiences the highest number of bus-related civil complaints compared to other areas; in 2018, 1955 cases of bus-related complaints were filed, which is two times (2.53%) the average complaint rate by population (1.31%) in Incheon. The analysis results of the complaints are shown in
Figure 7, most of which were revealed to be items related to adjustment of bus operation system (54%). This is related to the adjustment of the bus allocation interval and operation hours (the first and the last buses), which only can be addressed by increasing bus operation. To resolve the complaints, the municipal government is increasing its financial expenses by 123% each year, and over 1.3 billion KRW is being spent as the financial expense for government-operated buses as of 2019. Nevertheless, since the government-operated bus allocation interval is 78 min, a user could technically wait up to 155 min if he/she failed to catch a bus. This study verified the possibility of resolving the public transportation problems by applying the demand response public transportation service.
4.2. Pilot Operation Method
The pilot operation was carried out with eight minibuses, each of which accommodates 16 people, for two months (from 1 December 2019 to 31 January 2020). It was operated 20 h a day from 4:00 a.m. to 12:00 a.m. to encourage passengers to use the demand response public transportation service and to facilitate the use of the urban railway located nearby. Passengers who wish to use the demand response public transportation service request the service by sending their current locations using the smartphone application. Then, the system allocates buses most closely located to the passengers by using their request information. Sharing a vehicle is only allowed within the range where sharing is available and which does not cause detours over a certain distance. The operation method is illustrated in
Figure 8. When using the existing bus route, a passenger with a departure point and destination shown in
Figure 8 should move to a bus stop and wait until boarding on a Line 3 bus, then get off at a bus stop to transfer to a Line 2 bus. Through this process, the passenger has to go through a total of three transfers (board and alight) as shown in
Figure 8a, requiring waiting and walking time. In some cases, walking and waiting time for transfers becomes much longer than the actual time onboard. This inconvenience makes passengers prefer using cars to using public transportation. However, if the demand response public transportation service is operated as shown in
Figure 8b, a passenger can travel to the destination with one ride without any transfer. The time required for waiting and transfer is reduced even when a passenger travels along the same route. Even if another passenger with a similar route shares the ride in the process, the travel time is still reduced if it takes less than the time consumed for transfer.
5. Analysis of Results and Effects
As shown in
Figure 9, a total of 21,019 requests were made during the operation period (two months), 13,177 allocations were completed, and 11,071 passengers used the service.
Figure 10 shows the analysis results of the waiting time, which is considered to be most dominant of that experienced by the total of 11,071 passengers. Compared with the average waiting time of 78 min for government-operated buses, which reflected the unique situations of Yeongjong-do, and 18 min for regular public transportation buses, the waiting time was reduced to 13 min for the demand response transportation service.
As shown in
Figure 11, such effects can be increased when a transfer is being taken into account. Because the demand response transportation eliminates waiting and walking time for transfer, travel time was reduced to 16 min from the 27 min which was taken for traveling with the existing public transportation.
The results were also reflected in the survey for user satisfaction level by the passengers, where 1756 passengers (91%) responded that they were satisfied, as shown in
Figure 12.
When asked which transportation mode(s) passengers used before using the demand response public transportation service, 56% of passengers responded they used bus, 24% cars, 9% taxis, and 8% the government-operated bus. Through this, it was confirmed that the demand of 33% of those who drive their own cars can be changed to public transportation. According to the participants, before using the demand response public transportation service, their average waiting time was 18 min, and the average travel time was 27 min when using the existing public transportation. On the other hand, they responded that they experienced a total of 16 min travel time reduction effect when the demand response public transportation was connected to the existing public transportation, as the waiting time and travel time were reduced by 5 min and 11 min, respectively. As detailed response results for the satisfaction level, 30% answered reduced travel time, 28% reduced waiting time, 13% no transfer, and 11% long operating hours (dawn and late-night operations) for using the demand response transportation service. For disadvantages of the demand response transportation service, 54% answered low availability of vehicles, 13% inaccurate arrival time, 9% detour of route, and 7% lack of convenience of using the app. The overwhelming percentage of low availability of vehicles is attributable to concentration of travel demand during rush hours and shortage of operating vehicles, which will be gradually addressed by providing a sufficient number of vehicles, changing the allocation method, and clarifying the operation range.
6. Conclusions
The pilot project in Yeongjong International City in Jung-gu, Incheon, showed that the demand response public transportation service improved passenger convenience by eliminating the causes of avoidance of using the public transportation service due to long allocation intervals, short operating hours, and long transfer distance, etc. which are caused by an imbalance between inter- and intraregional transportation services. The demand response public transportation service provides consistent services to everyone regardless of the distance to a public transit station or the number of public transportation routes available, etc. through demand-based operation, to minimize the imbalance problems of existing public transportation. In this regard, this system is expected to provide seamless mobility through connection with the existing bus and subways systems by closing the temporal and spatial gaps in the existing public transportation, thereby improving the mode share of public transportation. The time required to walk to a stop/station and to wait for a vehicle will be reduced by 16 min on average. This reduced time can be converted into a socioeconomic benefit of 660 million KRW/year by calculating with the values in
Table 7.
The effects of applying a transportation service that incorporates public transportation will expand beyond the boundaries of the area due to the effects of the traffic network connected throughout the country. Moreover, the service itself can have significance only when extended to wider areas. Therefore, this study verified its effectiveness by first implementing the service in the form of a pilot project in a limited area over a short period of time, and checking the benefits through survey and investigation. Tangible benefits of the demand response public transportation service will be demonstrated only by verifying its effectiveness through wider and larger projects. Still, this study clarified the potential of the service as it showed a significant increase in the user satisfaction level for public transportation in an area provided with relatively poor public transportation service, implying that more varied types of wide-area services need to be discovered and attempted.
Author Contributions
Conceptualization, C.-G.R.; methodology, C.-G.R.; formal analysis, C.-G.R.; investigation, C.-G.R. and H.J.; writing—original draft preparation, C.-G.R.; writing—review and editing, C.-G.R. and H.J. All authors have read and agreed to the published version of the manuscript.
Funding
This research was supported by research project “Development of Sustainable MaaS (Mobility as a Service) 3.0+ Technology in Rural Areas” funded by the Korea Institute of Civil Engineering and Building Technology (KICT).
Institutional Review Board Statement
Not applicable.
Informed Consent Statement
Not applicable.
Data Availability Statement
The data presented in this study are available in the list of references. Data not mentioned in references are not publicly available.
Conflicts of Interest
The authors declare no conflict of interest.
References
- Schiller, P.L.; Kenworthy, J. An Introduction to Sustainable Transportation: Policy, Planning and Implementation, 2nd ed.; Routledge: London, UK, 2017. [Google Scholar] [CrossRef]
- Nieuwenhuijsen, M.J.; Khreis, H. Car free cities: Pathway to healthy urban living. Environ. Int. 2016, 94, 251–262. [Google Scholar] [CrossRef]
- Urry, J. The ‘system’ of automobility. Theory Cult. Soc. 2004, 21, 25–39. [Google Scholar] [CrossRef] [Green Version]
- Gray, D.; Farrington, J.; Shaw, J.; Martin, S.; Roberts, D. Car dependence in rural Scotland: Transport policy, devolution and the impact of the fuel duty escalator. J. Rural Stud. 2001, 17, 113–125. [Google Scholar] [CrossRef]
- Shergold, I.; Parkhurst, G.; Musselwhite, C. Rural car dependence: An emerging barrier to community activity for older people. Transp. Plan. Technol. 2012, 35, 69–85. [Google Scholar] [CrossRef]
- Daniels, R.; Mulley, C. Flexible transport services: Overcoming barriers to implementation in low-density urban areas. Urban Policy Res. 2012, 30, 59–76. [Google Scholar] [CrossRef]
- Davison, L.; Enoch, M.; Ryley, T.; Quddus, M.; Wang, C. Identifying potential market niches for demand responsive transport. Res. Transp. Bus. Manag. 2012, 3, 50–61. [Google Scholar] [CrossRef] [Green Version]
- Farrington, J.; Farrington, C. Rural accessibility, social inclusion and social justice: Towards conceptualisation. J. Transp. Geogr. 2005, 13, 1–12. [Google Scholar] [CrossRef]
- Mattioli, G. Where sustainable transport and social exclusion meet: Households without cars and car dependence in Great Britain. J. Environ. Policy Plan 2014, 16, 379–400. [Google Scholar] [CrossRef] [Green Version]
- Verma, I.; Taegen, J. Access to services in rural areas from the point of view of older population—A case study in Finland. Int. J. Environ. Res. Public Health 2019, 16, 4854. [Google Scholar] [CrossRef] [PubMed] [Green Version]
- Velaga, N.R.; Beecroft, M.; Nelson, J.D.; Corsar, D.; Edwards, P. Transport poverty meets the digital divide: Accessibility and connectivity in rural communities. J. Transp. Geogr. 2012, 21, 102–112. [Google Scholar] [CrossRef] [Green Version]
- Vitale Brovarone, E.; Cotella, G. Improving rural accessibility: A multilayer approach. Sustainability 2020, 12, 2876. [Google Scholar] [CrossRef] [Green Version]
- Alonso-González, M.J.; Liu, T.; Cats, O.; Van Oort, N.; Hoogendoorn, S. The potential of demand-responsive transport as a complement to public transport: An assessment framework and an empirical evaluation. Transp. Res. Rec. 2018, 2672, 879–889. [Google Scholar] [CrossRef]
- Mulley, C.; Nelson, J.D. Paratransit: Shaping the Flexible Transport Future; Transport and Sustainability; Emerald Group Publishing Limited: Bingley, UK, 2016; Volume 8. [Google Scholar] [CrossRef]
- Wright, S. Designing flexible transport services: Guidelines for choosing the vehicle type. Transp. Plan. Technol. 2013, 36, 76–92. [Google Scholar] [CrossRef]
- European Commission. Living Labs for User Driven Open Innovation; European Commission: Brussels, Belgium, 2009; Available online: https://www.eurosportello.eu/sites/default/files/Living%20Lab%20brochure_jan09_en_0.pdf (accessed on 27 November 2020).
- Kobzeva, M.; Knickel, K. Interactions and Dependencies Between Rural, Peri-Urban and Urban Areas and Contemporary Governance Approaches; Rural-Urban Outlooks–Unlocking Synergies (ROBUST): Bad Soden am Taunus, Germany, 2018. [Google Scholar]
- Hess, A.; Magin, D.; Koch, M.; Tamanini, C.; Klohe, J. Allgemeines Konzept Living Labs im Ländlichen Raum; Fraunhofer IESE: Kaiserslautern, Germany, 2017. [Google Scholar]
- Šūmane, S.; Kunda, I.; Knickel, K.; Strauss, A.; Tisenkopfs, T.; Des Ios Rios, I.; Rivera, M.; Chebach, T.; Ashkenazy, A. Local and farmers’ knowledge matters! How integrating informal and formal knowledge enhances sustainable and resilient agriculture. J. Rural Stud. 2018, 59, 232–241. [Google Scholar] [CrossRef]
- Mulder, I.; Stappers, P.J. Co-Creating in Practice: Results and Challenges. In Proceedings of the IEEE International Technology Management Conference (ITMC), Leiden, The Netherlands, 22–24 June 2009; pp. 1–8. [Google Scholar] [CrossRef] [Green Version]
- Kobzeva, M.; Knickel, K. “Instead of Just Talking We Are Actually Doing It!” Initial In-Sights into the Use of Living Labs in the EU-Funded ROBUST Project; ROBUST: Gloucestershire, UK, 2018. [Google Scholar]
- Zardo, P.; Barnett, A.G.; Suzor, N.; Cahill, T. Does engagement predict research use? An analysis of the conversation annual survey 2016. PLoS ONE 2018, 13, e0192290. [Google Scholar] [CrossRef] [PubMed] [Green Version]
- Barston, D.; Tusting, K. Beyond Communities of Practice: Language Power and Social Context; Cambridge University Press: Cambridge, UK, 2005. [Google Scholar]
- Wenger, E. Communities of Practice, Learning, Meaning, and Identity; Cambridge University Press: Cambridge, UK, 1998. [Google Scholar]
- Maye, D.; Keech, D.; Matthew, M. Methodological Framework for Case Studies; ROBUST: Gloucestershire, UK, 2018. [Google Scholar]
- Incheon’s Social Indicators, Incheon Metropolitan City. 2019. Available online: https://www.incheon.go.kr/fileviewer/v/pZ5T6uXCbUO (accessed on 27 November 2020).
- Korea Ministry of Land, Infrastructure and Transport, Road Statistics. Available online: http://stat.molit.go.kr/portal/cate/statView.do?hRsId=59&hFormId=&hSelectId=&sStyleNum=&sStart=&sEnd=&hPoint=&hAppr= (accessed on 16 January 2021).
- KISTI. Interim Report on Research Service for Incheon City Bus Route Operation System Reform and Efficiency Plan; KISTI: Incheon City, Korea, 2019. [Google Scholar]
- Gyeonggi Transportation Information Center, Transportation DB. Available online: https://gits.gg.go.kr/gtdb/web/trafficDb/newzone/HD001/5/TRAINSUBWAY/TRAINSUBWAY_STATION_LINE_NUM.do (accessed on 16 July 2020).
- Statistics Korea. National Statistical Office Urban Area (City/City/County/Gu). Available online: https://kosis.kr/statHtml/statHtml.do?orgId=101&tblId=DT_1YL20421E&vw_cd=MT_G (accessed on 27 December 2020).
- Incheon People at a Glance, Incheon Life, Incheon Metropolitan City. 2019. Available online: https://www.incheon.go.kr/fileviewer/v/pgoTrfGFEhD (accessed on 27 November 2020).
- Korea Transportation Safety Authority, 2018 Public Transportation Status Survey Comprehensive Result Report. Available online: http://stat.molit.go.kr/portal/common/downLoadFile.do (accessed on 16 January 2021).
- Park, J.; Ahn, G.; Moon, J. Developing a Quantifying Methodology for Stress from Public Transportation Use; KOTI: Gyeonggi, Korea, 2010. [Google Scholar]
- Korea National Statistics Portal, Average Access Time. Available online: https://www.ktdb.go.kr/www/fileDownTrnsport.do?idx=30948&fileTy=2&fileNo=2 (accessed on 16 January 2021).
- Gyeonggi Transportation Information Center. Available online: https://gits.gg.go.kr/gtdb/web/trafficDb/newzone/HB004/2/ASSPER/6_LENGTH_MODPER.do (accessed on 16 January 2021).
- Korea Ministry of Land, Infrastructure and Transport. The 6th Amendment to the Guidelines for the Evaluation of Investment in Transportation Facilities. Available online: http://www.molit.go.kr/LCMS/DWN.jsp?fold=law&fileName=%EA%B5%90%ED%86%B5%EC%8B%9C%EC%84%A4+%ED%88%AC%EC%9E%90%ED%8F%89%EA%B0%80%EC%A7%80%EC%B9%A8+%EC%A0%9C6%EC%B0%A8%EA%B0%9C%EC%A0%95_%EA%B3%A0%EC%8B%9C%EC%9A%A9.pdf (accessed on 15 November 2020).
| Publisher’s Note: MDPI stays neutral with regard to jurisdictional claims in published maps and institutional affiliations. |
© 2021 by the authors. Licensee MDPI, Basel, Switzerland. This article is an open access article distributed under the terms and conditions of the Creative Commons Attribution (CC BY) license (https://creativecommons.org/licenses/by/4.0/).


