Article

Sustainable Business Model Innovations in the Value Uncaptured Manufacturing Industry: Fitting Gains—Gain Creators

1
Industrial and System Engineering, Institut Teknologi Sepuluh Nopember, Surabaya 60111, Indonesia
2
Department of Agricultural Industrial Technology, Universitas Trunojoyo Madura, Bangkalan 69162, Indonesia
3
Department of Business Management, Institut Teknologi Sepuluh Nopember, Surabaya 60111, Indonesia
*
Authors to whom correspondence should be addressed.
Sustainability 2021, 13(10), 5647; https://doi.org/10.3390/su13105647
Submission received: 12 April 2021 / Revised: 30 April 2021 / Accepted: 7 May 2021 / Published: 18 May 2021
(This article belongs to the Special Issue Business Models for SME’s Sustainability)

Abstract

:
Increased manufacturing activity has an impact on environmental quality degradation. Waste generated from manufacturing activities is one of the causes. Previous studies have referred to this waste as value uncaptured. Minimizing value uncaptured is a solution to improve environmental quality. This study aims to reduce value uncaptured by converting it into value captured. This process requires a value proposition design approach because of its advantages. One of the advantages of this approach is that it can improve existing or future products/services. To do so, this research uses a case study of a furniture company. To implement a converting process, a sustainable business model is proposed to solve this problem. This business model combines several methods: value proposition design, house of value and the product sustainability index matrix. Recently, the existing value proposition problem-solving has been using the value proposition design method. This research proposed implementing a house of value to replace the fitting process. The questionnaire is developed to obtain various value uncaptured in the company. To the weight of the value uncaptured, this research utilized the pairwise comparison method. Then, the weights could represent the importance of jobs. Based on the highest weight of these jobs, the alternative gains would be selected. To provide the weight of the gain creators and value captured, the house of value method is developed. Referring to three pillars of sustainability, the value captured should be considered. This research proposed implementing a product sustainability index which in turn produces eco-friendly products. This study produces “eco-friendly products” as sustainability value captured. The sustainability business model could be an alternative policy to minimize the existence of value uncaptured.

1. Introduction

Along with the growth in industrial activity, environmental issues are rising. The demands of different stakeholders concerning these issues are also rising. Many studies indicate that manufacturing activities make a significant contribution to environmental degradation. Industrial manufacture causes an increase in carbon emissions by 36 percent and represents one-third of world energy consumption [1]. The manufacturing sector also consumes a lot of materials and produces waste [2]. Based on these findings, manufacturing industry waste is one of the sources of environmental damage. Various attempts have been made to mitigate the presence of waste.
Some of the efforts made include using waste to make it valuable. Nurmesniemi et al. investigated waste utilization at the Stora Enso Oyj Veitsiluoto Mills paper mill in Kemi, Northern Finland [3]. This study suggested using green liquid waste from caustic processes to neutralize water acidity. The resulting solid waste is all burned in a fluidized bed boiler to produce energy.
Singh et al. [4] examined the use of paper waste as a material for building bricks. The waste produced is Deinking Paper Mill Sludge (DPMS). The non-thermal brick developed is more heat resistant than conventional bricks and can be an alternative to traditional bricks. Other research on waste utilization occurs in the food industry. Food industry wastes originating from tropical fruits produce phenolic compounds [5]. Based on these studies, the manufacturing industry’s waste still has the potential to be utilized. Many manufacturing industries have not realized the potential value that the waste produced has. The potential value possessed by the waste is known as Value Uncaptured (VU).
VU is a potential value that the company has not captured, even though it benefits the company [6]. According to Yang M. et al. [6], VU’s presence is detected throughout the beginning of life, middle of life and end of life (product life cycle). VU can take the form of waste heat (waste energy), overproduction, and lack of resources/input [6]. The existence of VU in these forms shows that its manufacturing practices have not efficient. Meanwhile, the VU still has the potential to be a source of value for the company. Companies need to identify the existence of the VU.
Yang et al. [6] studied VU in companies operating business models of the Product-Service System (PSS) in China, England, and America. In companies that adopt this business model, this study has established 26 VU sources. This study aims to change value uncaptured (VU) to value captured (VC) through the innovation of a Sustainable Business Model (SBM).
Several things need to be considered in the SBM innovation concept, namely business model innovation and SBM. The combination of these two concepts will produce new values and have a sustainable character.
Business model innovation generates new value through a process of capture, create, and deliver. Two essential concepts in a business model are value creation and value capture. Value creation is the process aimed at increasing value generation [7]. Value capture is the process of obtaining profits from value creation and distributing these profits to the parties involved, such as providers, customers and partners [8]. Meanwhile, Sjödin et al. [9] put forward the idea of aligning value creation and value capture in the context of business model innovation. With this alignment, the value creation process is no longer provider-centric but also involves the consumer. This concept is in line with this study. This suitability can be seen from how this study conducts value creation with the tools used.
A sustainable business model (SBM) is a business model that contributes to sustainable development resulting in a competitive advantage due to the superior value offered to customers [10]. Meanwhile, other studies have linked sustainability in business models with three sustainability pillars, economic, social, and environmental. SBM creates and embodies social and ecological values in addition to economic benefits [11]. Value creation that considers environmental, social, economic pillars becomes organizational challenges to create competitiveness [12]. Meanwhile, value creation can refer to various forms of social or economic value [13]. One form of SBM that can be applied is the Circular Business Model (CBM).
In Closed Material Loops (CML), CBM is the premise of how organizations capture, create and deliver value [14]. CML means that either as a bulk material, product, or component, the material may be used again [14]. The Circular Economic (CE) definition is the reuse of materials, items or components. Thus, CBM is a business model implemented by CE implementing manufacturing firms. Several studies demonstrate the success stories of CBM implementation. This business model’s performance offers economic advantages in the form of savings valued at more than $1 million [15]. All stakeholders expect support from CBM’s application in the process of value creation. The Swedish men’s apparel company, Nudie Jeans, Dutch carpet company Desso, and French furniture company Steelcase, have introduced CBM [16]. The empirical evidence of this success story will cause CBM adoption by manufacturing companies. Lewandowski suggests a discourse on evaluating the efficiency of CBM in the context of a fit between the Value Proposition (VP) and the Consumer Segment (CS) [17]. This discourse is appropriate for the principle of Value Proposition Design (VPD) offered [18].
VPD is a continuous process that generates a value proposition to fulfill customer desires [18]. From the perspective of consumers and producers, VPD maps value. From a customer viewpoint, VPD maps value in terms of jobs, gains and pains. Meanwhile, producers map the inherent values of product/service, gain creators, and pain reliever. Many studies show the success stories of using VPD in solving corporate value mapping issues. Pokorná et al. [19] established the factors of the business model that form the VP of customers of the agricultural sector. The research was able to classify jobs (supply of safe and fresh foods and emotions of pleasure to buy), gain creators (new and healthy food), and pains (higher prices and less comfortable opening hours). Baldassarre et al. [20] merged the idea of sustainable business model innovation and user-driven innovation. A sustainable value proposition that takes all stakeholders into account is the outcome of this study. To respond to the sense of sustainability in a circular business model framework, VPD generates an environmental value proposition [21]. The qualitative VPD model used in these studies is in the form of a mapping and a framework. As well as the steps that producers take to respond to these desires, these models often reflect customer preferences. These models are identical to the House of Quality (HOQ) concept.
HOQ is a matrix that defines the process of translating the customer’s needs and how to fulfill them [22]. HOQ has so far been widely used as a method to link customer preferences with responses from producers. The HOQ matrix consists of client requirements (row—what) and design requirements (column—way). The HOQ approach is widely adopted to solve problems outside of product design. Many studies have implemented the HOQ approach for problem-solving in different fields. HOQ has been used to assess human errors in supply chain activities [23]. HOQ is used to resolve risk reduction issues in the supply of tuna fish [24]. In the meantime, Pulansari et al. [25] used HOQ to evaluate the variables affecting company efficiency and consumer concerns. These studies usually used HOQ to solve problems (what) in a way (how).
This research model was developed based on previous studies on the recognition of the existence of VU [6], sustainable business model innovation [17], qualitative VPD methods [18,20,21] and versatility in the use of HOQ [23,24,25]. The goal of this study is to create a sustainable business model to turn VU into VC. This research utilizes an approach to sustainable business model innovation (CBM). VPD can become a reference in determining value from two perspectives (consumers and producers). HOQ is a tool in the VPD fitting process. The use of two instruments (VPD and HOQ) to strengthen previous studies’ shortcomings is the novelty of this study.
Using a combination of VPD and HOQ approaches, this study restricts the process of converting VU to VC. The problem-solving steps are approached in the order of VU—jobs (triggers)—gains—gain creators—VC. The sustainable business model approach connects VC with the elements of the three pillars of sustainability.
This research uses a case study in one of the furniture companies in Indonesia. This company is an online wholesaler, exporter and wholesale producer of handicrafts, Indonesian teak furniture. It has been in this business for more than 12 years in manufacturing, designing, developing, wholesaling, and exporting wooden furniture and rattan furniture. Ninety-five percent of the furniture products are for export needs. Even though this company is quite large, it still produces inefficiencies in its manufacturing and business practices. The existence of this inefficiency becomes an indicator of the presence of VU, which may not be realized. This model can be applied to the manufacturing industry in general. It is also possible to use this model in the service sector by looking at inefficient activities that indicate value uncaptured.

2. Research Methods

This study builds a sustainable business model based on the circular business model concept [17]. Based on the idea of a business model, this study uses two kinds of input in the context of value. These inputs can come from two perspectives, namely consumers and producers. The information from the consumer’s and producer’s perspective can be detailed as follows:
  • Jobs explain what clients in their job or life are trying to get done [18]. Jobs come from customers’ voices about the function of a product that current products have not fulfilled.
  • Gains define the outcomes and benefits that consumers want [18]. Gains come from the voices of customers on the advantages they feel by using current goods.
  • Value Uncaptured (VU) is the potential value possible of becoming captured but not yet caught [6]. VU comes from detecting inefficient production processes such as waste, defects in quality, and so forth.
  • Gain creators explain how producers create consumer gains [18]. Gain creators are the reactions of producers to customers’ voices regarding their benefits by using current goods. By enhancing the method to create a better product or service, the producers will generate gain creators.
This model uses Value Proposition Design (VPD) and House of Quality (HOQ) methods. VPD is a guide in identifying jobs, gains, and gain creators. In the meantime, HOQ is a guide for fitting the client’s product specifications with the design requirements. The synthesis of these two approaches is the novelty of this model. Understanding of this model using a systems approach.
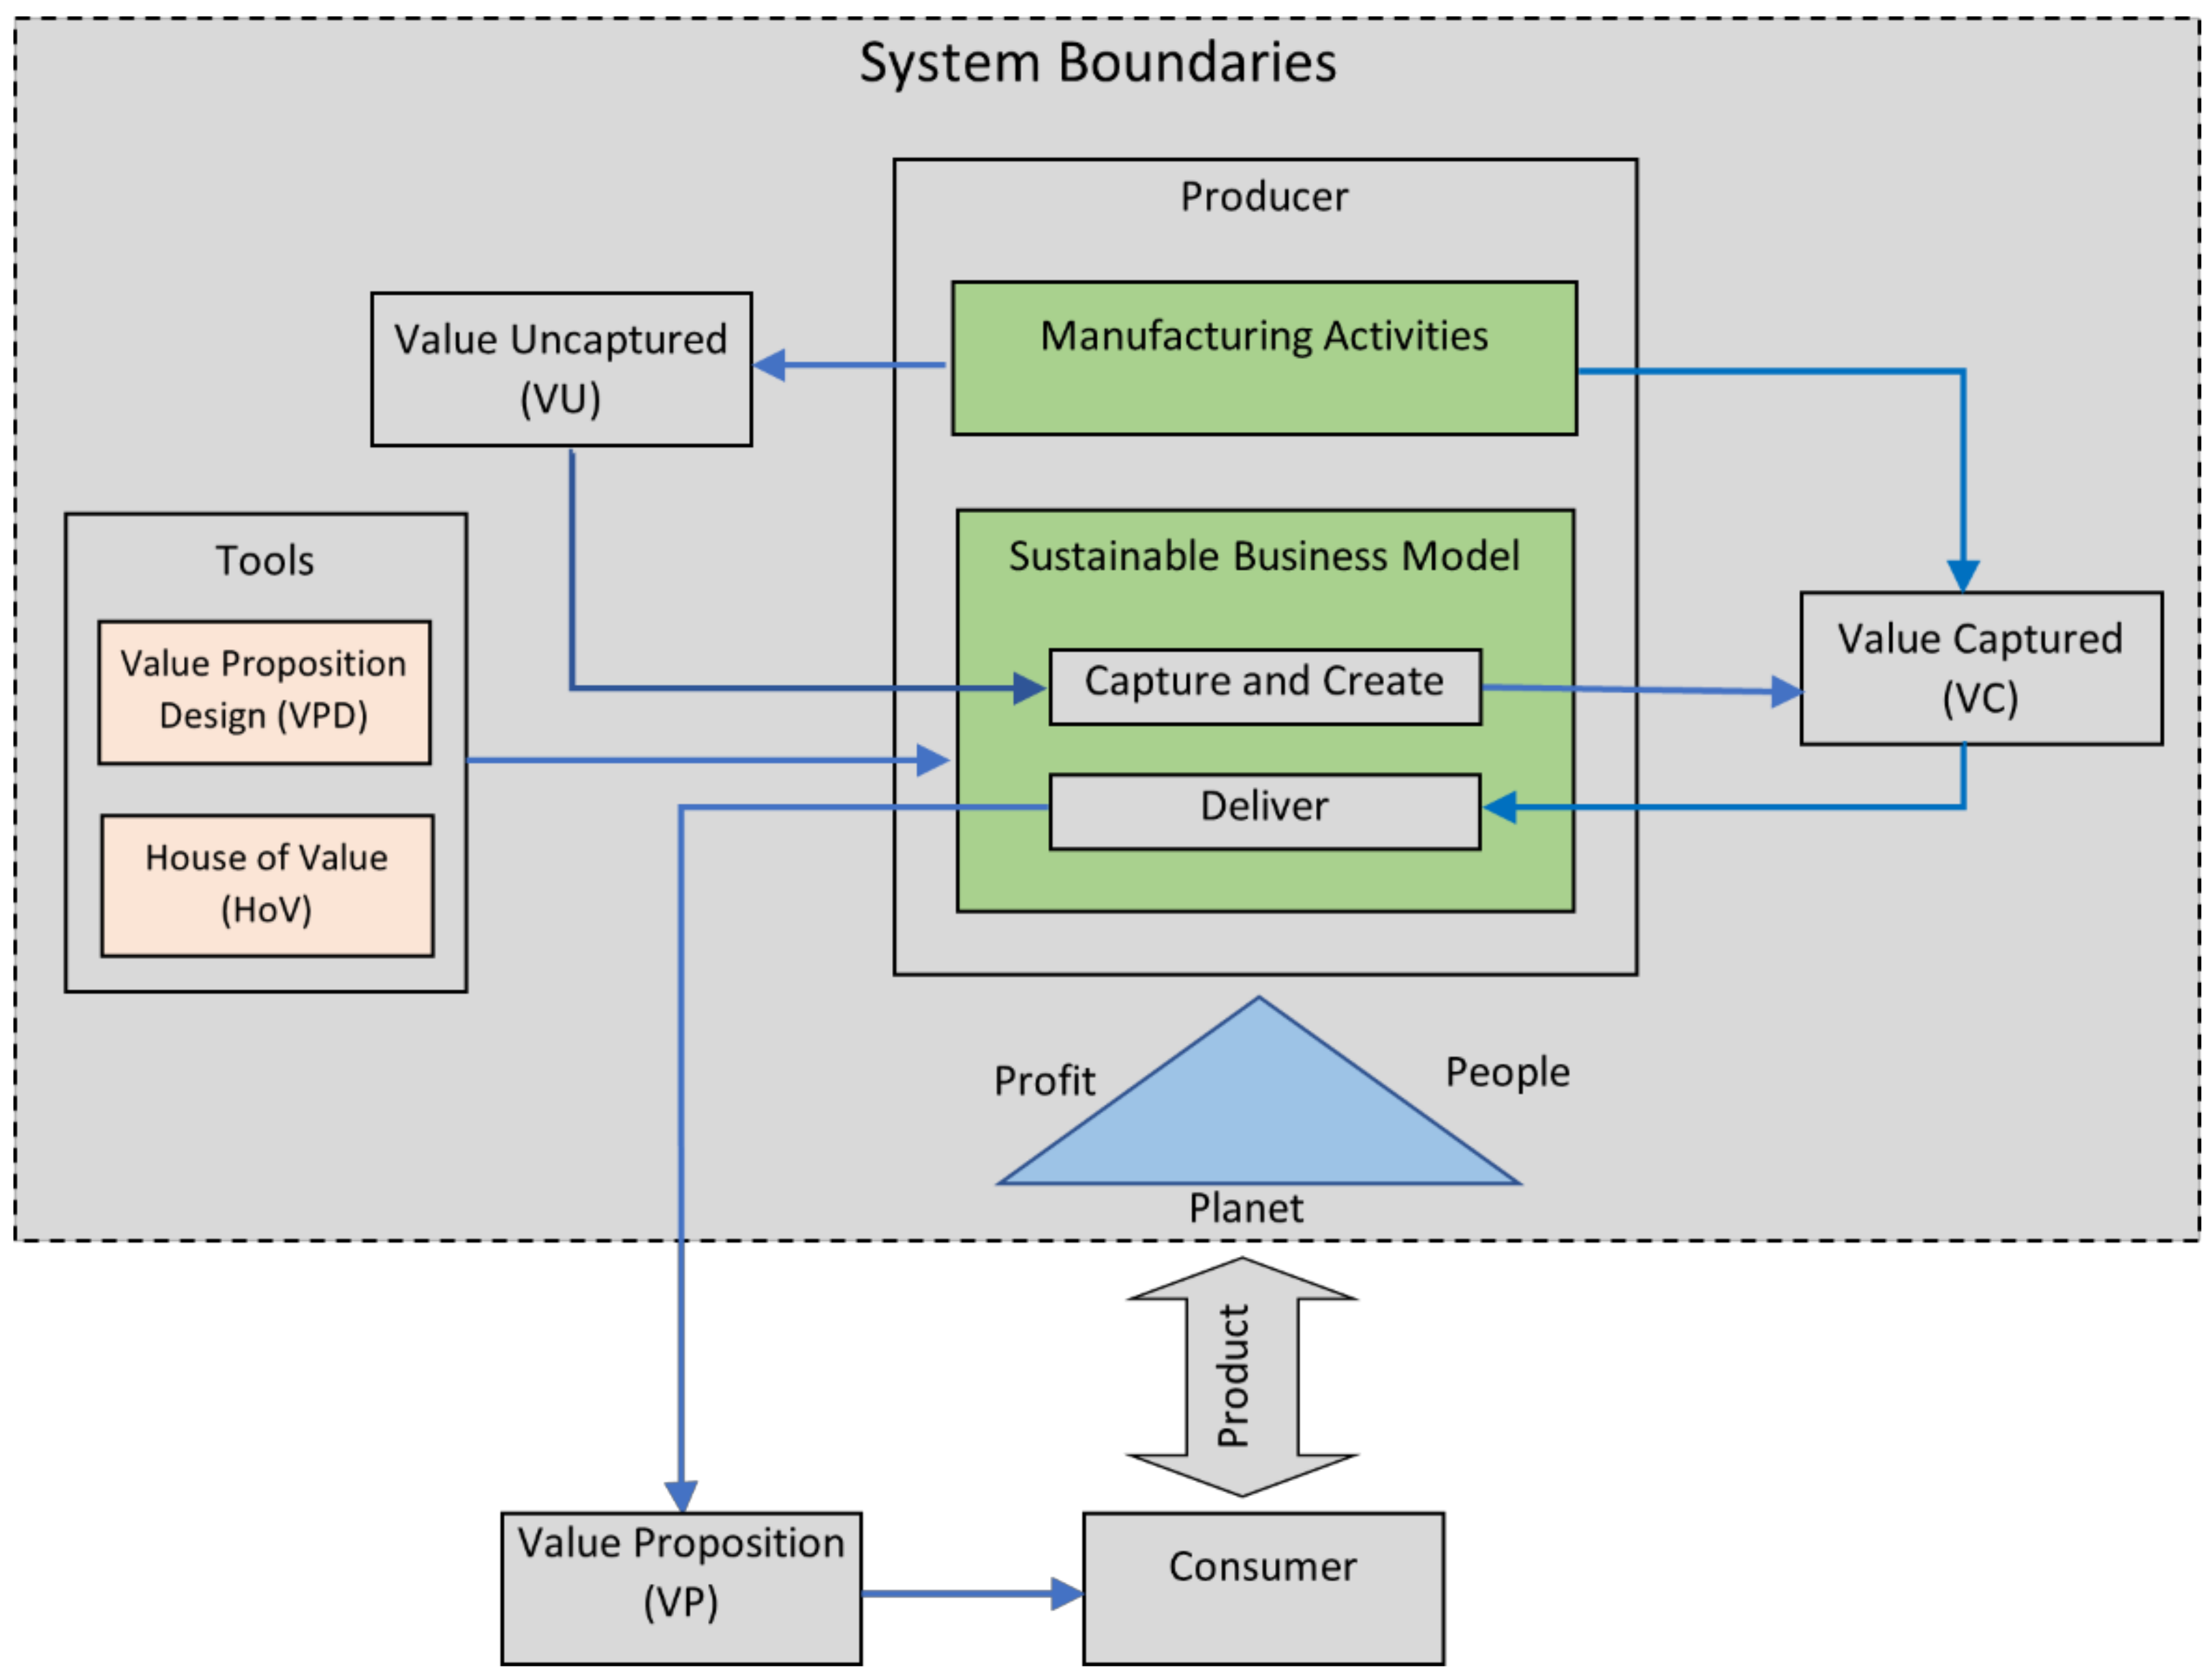
VU in this analysis comes from inefficiencies in the production process and the resulting waste. This business model will turn VU into VC. A sustainable business model (Circular Business Model—CBM) is used to solve this issue. The definition of sustainability here refers to all business activities that pay attention to sustainability’s three pillars (Profit People Planet—3P). VPD and HOQ are the methods used to implement CBM. VPD is used as a reference for identifying and mapping jobs, gains, and gain creators. The fitting process is the final stage of this method. In this study, the fitting process was carried out using the HOQ method. Because this study uses the value case, the researcher calls it the House of Value (HOV) for the fitting process in HOQ. Figure 1 shows that manufacturing operations often render Value Uncaptured (VU) in addition to generating Value Captured (VC).
Figure 2 provides a more detailed combined use of these methods (a,b,c).

2.1. The Process of Obtaining Value Uncaptured (VU)

Researchers made observations on the company’s manufacturing practices to get VU. Yang et al. [6] provides a reference to the presence of VU during the product life cycle. The company’s interviews resulted in three VUs, namely the size (dimension) of the product does not match what the consumer needs (VU # 1), quality does not match consumer expectations (VU # 2), and the remaining material (pieces of rattan) which have economic value (VU # 3).
The measurement of the weight of VU uses a pairwise comparison process. The criteria used in this study are Value Missed (VM), Value Surplus (VS), and Value Absence (VA) [6]. Value missed is a value that exists and is required but is not exploited. Value surplus is a value that exists but is not required. Value absence is a value that is needed but does not exist. Figure 3 presents a decision hierarchy for determining the weight of the relative importance of VU. Table 1 explains the measurement scale (1, 3, 5, 7, and 9). For each VU, this study generates a weight of relative importance, namely W # VU1, W # VU2, …, W # VUn. The design of calculating the relative weight of value uncaptured follows the following steps (1) making a pairwise comparison matrix between criteria (2) making a pairwise comparison matrix between alternatives.
Using a measurement scale (Table 1), a questionnaire was distributed to the producers. The results of the questionnaire are presented in Table 2 and Table 3.
Appendix A shows the complete calculation of the relative weight of value uncaptured. The pairwise comparison method produces the relative weights of value uncaptured W_VU1, W_VU2, and W_VU3. These values will be used in calculating the relative weights of jobs at a later stage.

2.2. The Process of Obtaining Information about Jobs from Consumers (Customers)

Osterwalder et al. [18] defined the basic notion of jobs. Meanwhile, Vaida et al. [26] described jobs that furniture customers want with a smart furniture concept approach. This description is in line with the concept suggested by [18]. This study uses the following jobs based on these two concepts: furniture products that are easy to clean (Jb # 1), products that cause the appearance of the house (indoor and outdoor) to be tidier (Jb # 2), decorative handicraft products (Jb # 3), and eco-friendly craft products (Jb # 4). Each job includes some gains, as shown in Table A14.
To obtain the value R _ V U i J b j , the relationship between VU and jobs is determined. Figure 4 illustrates the relationship between VU and jobs. The R _ V U i J b j value follows the measurement scale of 1 = slightly strong, 3 = moderate, and 9 = strong. A questionnaire was distributed to the producers using the Google Forms application. Table 4 shows the results of the questionnaire. The results of scoring the relationship between value uncaptured and jobs ( R _ V U i J b j ) being the input of the HOV matrix (Figure 5).
Job selection uses the criteria that have the greatest relative weight. The relative weight measurement of jobs uses the HOV method (Figure 5).
The calculation of the absolute and relative weights of jobs uses Equations (1) and (2).
A I _ J b j = i = 1 n W _ V U i   .   R _ V U i J b j ; j = 1 ,   2 ,   , n
R I _ J b j = A I _ J b j S u m ; j = 1 ,   2 ,   ,   n .
W _ V U i = weight of relative importance of VU i.
A I _ J b j = Absolute importance of jobs j
R I _ J b j = Relative importance of jobs j
Sum = the horizontal summation of the weight of the absolute importance of the job
The study yields the relative weights of jobs RI_Jb1, RI_Jb2, …, RI_Jbn. Jobs that have the largest relative weight are selected as inputs at a later stage.

2.3. The Process of Obtaining Gains from Consumers (Customers)

This research uses Osterwalder et al. [18] as a conceptual approach and Vaida et al. [26] as a practical approach to interpreting gains. Gains demonstrated the benefits that customers feel after using existing goods. Gains also reflect the expected benefits of the product.
This analysis uses gains relating to specific jobs based on the chosen jobs (Figure 5). The relative gains weight calculation utilizing the basis of a consumer questionnaire’s results through the Google Forms application. The distribution of questionnaires to 30 respondents was sufficient to represent the sample in this study. Respondents are taken from regular customers (not only consumers) from the company so that the data gains obtained can be accounted for its validity.
Table 5 summarizes the results of the questionnaire and the calculation of the gains’ relative weight. The scores used in this analysis were 1 = not significant, 2 = less important, 3 = very important, 4 = important, and 5 = quite important. Equation (4) is used to calculate the weight of relative gains. This research results in the relative weight gain of W_Gn1, W_Gn2, …, W_Gnn. This relative weight is used as input for calculating the relative weight of the gain creators.
S u m _ G n   = j = 1 n S u m _ G n j
W _ G n j = S u m _ G n j S u m _ G n ; j = 1 ,   2 ,   ,   n .  

2.4. The Process of Obtaining Gain Creators from the Company (Producer)

Conceptually, the notion of GC fits the definition proposed by [18]. The company responds to the gains from consumers in the form of gain creators (GC). Researchers conducted interviews with company owners to get a response to consumer’s gains. The GCs used in this study were GC # 1, GC # 2, GC # 3, GC # 4, GC # 5.
The relative weight of gain creators (RI_GC) is provided by fitting the gains with the gain creators (Figure 6). It is determined using the following steps:
(1)
Calculation of absolute weight (absolute importance) of gain creators—Equation (5)
A I _ G C j = i = 1 n W _ G n i . R _ G n i G C j .  
W_Gni is the weight of gains i (the result of the pairwise comparison).
R G n i G C j = the relationship score of Gains i and Gain Creators j
(2)
Calculation of the relative weight (relative importance) of gain creators—Equation (6)
R I _ G C j = A I _ G C j j = 1 n A I _ G C j .  
This research resulted in n relative weight gain creators R I _ G C 1 , R I _ G C 2 , …, R I _ G C n . All gain creators would point to a value, namely Value Captured (VC), with different relative weights.

2.5. The Process of Obtaining the Company’s Value Captured (VC)

The company realizes gain creators in the form of Value Captured (VC). VC is attached to the design of the company’s product. This research resulted in some VCs: VC # 1, VC # 2, VC # 3, VC # 4, and VC # 5.
The R _ G C i V C j value follows the measurement scale of 1 = slightly strong, 3 = moderate and 9 = strong. A questionnaire was distributed to the producers using the Google Forms application. The results of the questionnaire can be seen in Table 6. The results of scoring the relationship between value uncaptured and jobs ( R _ G C i V C j ) being the input of the HOV matrix (Figure 7). The results of scoring the relationship between the value uncaptured and jobs ( R _ G C i V C j ) were the input of the HOV matrix (Figure 7). The absolute importance weight of each VC (AI_VCj) is calculated using Equation (7). The VC’s relative weight (RI_VCj) is determined using Equation (8).
(1)
Calculation of Value Captured absolute importance weight
A I _ V C j = i = 1 n R I _ G C i . R _ G C i V C j .  
R G C i V C j states the relationship score between Gain Creators i and value Captured j
(2)
Calculation of Value Captured relative importance weight.
R I _ V C j = A I _ V C j S u m   ;   S u m = j = 1 n A I _ V C . j .

2.6. The Process of Linking the Concept of Sustainability to the Resulting VC

As this takes account of the demands of different stakeholders, it is essential to raise sustainability concerns. In this study the values captured were linked with the three sustainability pillars using the concept provided by Toivonen [27] and Shuaib et al. [28]. Shuaib et al. [28] identifies the components of the three sustainability pillars. In the meantime, Hapuwatte et al. [29] provides a guide as a model for calculating the Sustainable Value Captured (SVC).
Figure 8 describes the elements of the three pillars of sustainability. Meanwhile, Table 7 shows a framework for measuring VCs and aspects of the three sustainability pillars relationship. The relationship scores in Table 7 being the input of Table 8 as a design for measuring Sustainable Value Captured (SVC).
The Equations (9)–(12) shows matrix calculation description from Table 7.
(1)
Economy Pillar:
Weighted value calculation at Sub Index Level—Equation (9):
S _ V C j _ E c = 1 n i = 1 n R E c i V C j ; j = 1 , 2 , , n .  
S V C i E c = the weighted value of VC i on the economic pillar.
1 / n = weight for the economic pillar on cluster j
R E c i V C j = the relationship between VC j and the economic pillars of cluster i (see Table 6)
(2)
Society Pillar
Weighted value calculation at Sub Index Level—Equation (8):
S _ V C i _ S c = 1 n i = 1 n R S c i V C j ; j = 1 , 2 , , n .  
S V C i S c = the weighted value of VC i on society pillar
1 / n = weight for the social pillar on cluster j
R S c i V C j = the relationship between VC j and the social pillars of cluster i (see Table 6).
(3)
Environmental Pillar
Weighted value calculation at Sub Index Level—Equation (9):
S V C i E n = 1 n i = 1 n R E n i V C j ; j = 1 , 2 , , n .
S V C i E n = the weighted value of VC i on the environmental pillar
1 / n = weight for the environmental pillar on cluster j
R E n i V C j = the relationship between VC j and the environmental pillars of cluster i (see Table 6)
(4)
Calculation of the final value of VC with the index of sustainability—Equation (10):
S V C i = j = 1 3 W S I j   .   S V C i S I j   ;   i = 1 ,   2 ,   ,   n .
S V C i = the final value of VC i
W S I j = the weight of the sustainability index j = 0.33
S V C i S I j = the value of VC i on the sustainability index j
The study uses a case study at furniture company X.

3. Results

The results of this analysis refer to the sequence of problem-solving presented in the research design. The order includes:

3.1. Value Uncaptured (VU)

Table 9 presents the results of VU identification which refers to [6]. Table 10 shows the relative weight of VU as a result of calculations using the pairwise comparison method.
In the next step, the VU relative weights will determine jobs.

3.2. Jobs

This research uses jobs concerning [19]. Table 11 presents the jobs identified in this study.
Determination of the relative weight of each job uses the HOV (Figure 6) and Equations (1) and (2). Table 12 summarizes the results of calculating the relative weight of each job. Eco-friendly furniture products (Jb # 4) are selected based on the highest relative weight.

3.3. Gains

Gains describe the benefits gained by consumers when using existing products. The firm must sustain these gains to enhance the performance of current products or to create new products. Ultimately, gains will support the jobs the customer wants. Table 13 shows gains supporting the selected jobs.
The selected jobs (Jb # 4) include several gains based on the results of the interview. Table 12 presents these gains. The questionnaire with 30 respondents produced the relative weight of gains (Table 14). Using the design method shown in Table 2, the relative weights for gains are determined.

3.4. Gain Creators

In response to consumer gains, interviews with producers will generate gain creators. Table 15 presents the results of interviews about gain creators with the owner of the firm.
The next step is to fit the gains and gain creators using HOV (Figure 6). The gain creators’ relative weight is determined using Equations (5) and (6). Table 16 summarizes these results.
The process (action) that the firm must respond to the gains is called Gain Creators (GC). GC will be in the form of value attached to a product. This study calls it value captured.

3.5. Value Captured (VC)

This study resulted in five VCs listed in Table 17. The weight of the relative importance of VC was determined using the HOV method (Figure 7) and Equations (7) and (8).
VC # 1 has the highest relative weight, based on Table 17. Therefore, the study decided to choose Harmless furniture. In making a choice, the issue of sustainability is one of the business considerations. Thus, the five VCs defined must be linked to the three pillars of sustainability.

3.6. Sustainability

As defined in Table 18, this study uses elements from the three sustainability pillars. These elements are determined based on reference [28] and the results of field observations. Table 7 shows the design for scoring the relationship between VC and the elements of the three pillars of sustainability. This relationship’s score being input to compile the Sustainable Value Captured (SVC) calculation matrix (Table 7).
The SVC value is obtained by the designed method as shown in Table 7 and Equations (9)–(12). Table 19 shows the results of the SVC calculation. The study concluded that eco-friendly products are the chosen alternative because they have the highest score.

4. Discussion

Some studies supporting this research include the following: [18,21,22,28,29]. Osterwalder et al. [18] pointed out that VU is an issue for manufacturing companies that need to be solved and proposed an idea of a sustainable business model to solve the VU problem. Meanwhile, Manninen et al. [21] use the Circular Business Model (CBM) in closed material loops for material reuse. The definition of [18] for the VU issue is relevant to this business model. Thus, solving this problem can use the CBM method. In the meantime, Franceschini [22] demonstrates how CBM output can be measured by adjusting Value Proposition (VP) with Customer Segment (CS). This output measurement can be done using the Value Proposition Design (VPD) tool. This VPD operation generates VC. In the meantime, Shuaib et al. and Hapuwatte et al. [28,29] are the basis of the interaction between VC values and sustainability issues.
Study [9] introduced Outcome-Based Business Models to be applied in companies. The model proposes the simultaneous application of the concepts of value creation and value capture. By using this model, the company is expected to achieve a competitive advantage. This condition is indicated by the value attached to the product, which results from value creation involving producers and consumers. This study is in line with [9], where the company includes consumers in the value creation process to convert VU into VC. This consumer involvement can be seen when using the value proposition design (VPD) and the house of value tools.
This study’s output is a VC that meets the economic, social, and environmental requirements (SVC). Here are the steps for calculating the SVC value:
  • Three VUs resulting from this study are shown in Table 8. Consumers’ changing needs are the reason for the emergence of VU # 1. Often, existing products are not supported by these alterations. The reason for VU # 2 existence is increased customer standards for product quality. There were several complaints about product quality, such as untidy rattan matting. The presence of VU # 3 is related to the waste generated by the company. The number of rattan pieces found in the company being proof of the VU # 3 existence. At a later stage, these three VUs will be linked to consumer jobs.
  • Table 10 shows the types of jobs based on the interview results. This study chose Jb # 4 to be followed up based on the highest relative importance weight (Table 11). Buyers are increasingly concerned with the importance and advantages of environmentally friendly furniture products. Another explanation for this is that, in part, the furniture produced is for the export market. Foreign consumers are more concerned with furniture items that take eco-friendly features into account.
  • The resulting gains would support the jobs currently chosen. The gains identified are shown in Table 12. To fulfill the jobs that its consumers want, the firm must respond to these five gains. In general, studies attribute these gains to healthy furniture products for consumers. The safety of this furniture is inseparable from using the materials and components that make up the product. The value of durability refers to the use of materials that consider aspects of sustainability and dematerialization. Such market response is based on increasing awareness among consumers of environmentally friendly furniture products.
  • The manufacturer responds to five gains with five gain creators (Table 14). The manufacturers do process improvement and the use of auxiliary health-safe materials. Process improvements include water-based paint finishing. Usage of health-safe additional materials by using bio-varnish as a replacement for solvent-based paint. This paint has a low content of volatile organic compounds (VOC). Besides being health-safe, it is not flammable either.
  • Five Value Captured (VC) resulted from the interviews (Table 16). All VCs generated relate to the features of superior products from an environmental perspective. This perspective makes sense since the aim of the company is to raise exports. Countries are importing furniture and demanding environmentally friendly products. Ultimately, the fulfillment of these demands will be a competitive advantage for the company. However, to be competitive, the company must pay attention to two other aspects (economic and social). The step taken by the company is to link VC with the concept of sustainability.
  • A requirement that the company must fulfill is the issue of sustainability. The benefits that companies get from meeting this issue are in the form of increased competitiveness. A Sustainable Value Captured (SVC) that met the requirements for sustainability resulted from this study. The study selects eco-friendly products (VC # 3) based on their highest SVC value. Many factors and reasons for choosing VC # 3 include (1) the company’s intention to increase exports of its furniture products to several American and European countries; (2) the demand for worldwide furniture products tends to grow, and (3) the potential for waste (rattan pieces) to be transformed into valuable handicraft products.
It might be possible to undertake future research to develop this study. Future research encompasses:
  • The determination of VC from the side of the pains faced by consumers.
  • The application of this model is for companies engaged in foods and beverages.
  • The application of this model is for companies in the service sector.

5. Conclusions

This study develops a sustainable business model in manufacturing businesses to convert VU into VC. This issue can be addressed using the Circular Business Model (CBM). The combination of three methods: value proposition design (VPD), house of value (HOV), and product sustainability index matrix is a novelty in this study. Managerial contributions from this research can be applied at both the manufacturing level and the company level.
At the manufacturing level, the circular economy concept is the basis for thinking about this study. Identification of VU throughout the product life cycle is the first step in implementing the circular economy concept. This study resulted in three VUs covering (1) the size (dimension) of the product does not match what the consumer needs; (2) quality does not match consumer expectations, and (3) the remaining material (rattan pieces) still has economic value.
Meanwhile, at the company level, the concept of a sustainable business model becomes a guide to transforming VU into VC. By using the proposed tools, this study produces the following VCs: (1) harmless furniture 1; (2) harmless furniture 2; (3) eco-friendly product 1; (4) eco-friendly product 2; and (5) durable product (long life furniture product. The sustainable value captured (SVC) is the final result of this study. The “eco-friendly product” was selected based on the calculation results.

Author Contributions

Conceptualization, B., U.C., M.L.S. and I.B.; Data curation, B.; Formal analysis, B.; Investigation, B.; Methodology, B., U.C., M.L.S. and I.B.; Supervision, U.C. and M.L.S. All authors have read and agreed to the published version of the manuscript.

Funding

This research received no external funding.

Institutional Review Board Statement

The study did not involve humans or animals.

Informed Consent Statement

Not applicable.

Data Availability Statement

The data presented in this study are available on request from the corresponding author. The data are not publicly available due to company policy.

Acknowledgments

The authors would like to thank to the company where the case study was conducted. Thank you also to the Department of System and Industrial Engineering, Institut Teknologi Sepuluh Nopember, Surabaya, for providing facilities and support during the research and the preparation of the manuscript.

Conflicts of Interest

The authors declare no conflict of interest.

Appendix A

i.
Creating a pairwise comparison matrix for criteria (VM = Value Missed, vs. = Value Surplus, and VA = Value Absence)
Table A1. Pairwise Comparison Matrix for Criteria.
-VMVSVA
VM X 11 = 1 X 12 X 13
VS 1 / X 12 X 22 = 1 X 23
VA 1 / X 13 1 / X 23 X 33 = 1
S u m j S u m 1 S u m 2 S u m 3
S U M j = i = 1 3 X i j .  
ii.
Create a normalization matrix
Table A2. Normalized Matrix.
VMVSVA
VM Y 11 Y 12 Y 13
VS Y 21 Y 22 Y 23
VA Y 31 Y 32 Y 33
Y i j = X i j S U M j .
iii.
Calculates priority criteria
Table A3. Priority Criteria.
VMVSVASum RowPriority
VM Y 11 Y 12 Y 13 Y 1 j P r i o r 1
VS Y 21 Y 22 Y 23 Y 2 j P r i o r 2
VA Y 31 Y 32 Y 33 Y 3 j P r i o r 3
TotalY1
P r i o r j = Y i j Y .
iv.
Test the consistency of priority criteria
a.
Arrange a matrix A = multiplication of the basic matrix with a priority matrix
A = X 11 X 12 X 13 X 21 X 22 X 23 X 31 X 32 X 33   X   P r i o r 1 P r i o r 2 P r i o r 3 = A 1 A 2 A 3 .
b.
Constructing a matrix B = dividing matrix A by the priority matrix
B = A 1 A 2 A 3 P r i o r 1 P r i o r 2 P r i o r 3 = B 1 B 2 B 3 .
c.
Calculates the maximum lambda ( λ m a x )
λ m a x = B 1 + B 2 + B 3 3 .
d.
Calculates the consistency index (CI) for n criteria
C I = λ m a x n n 1 .
e.
Calculating the consistency ratio (CR)
C R = C I R I ;   RI = random   index   ( Table   A 4 ) .
Table A4. Random Index.
n3456
RI0.580.901.121.24
If the CR value is < 0.10, it is stated that the calculation results are consistent.
v.
Determine alternative local priorities (value uncaptured)
  • Criterion 1: Value Missed (VM)
    Table A5. Alternative Comparison Matrix for Criterion 1.
    Table A5. Alternative Comparison Matrix for Criterion 1.
    VMVU # 1VU # 2VU # n
    VU # 1X11X12 X1n
    VU # 2X21X22 X2n
    VU # nXn1Xn2 Xnn
    S u m j S u m 1 S u m 2 S u m n
    Table A6. Alternative Comparison Normalized Matrix for Criterion 1.
    Table A6. Alternative Comparison Normalized Matrix for Criterion 1.
    VMVU # 1VU # 2VU # nSum RowPriority
    VU # 1 Y 12 Y 12 Y 1 n Y 1 j P r i o r 11
    VU # 2 Y 21 Y 22 Y 2 n Y 2 j P r i o r 21
    VU # n Y n 1 Y n 2 Y n n Y n j P r i o r n 1
    TotalY1
    Equation (A2) is used to calculate Y i j , while Equation (A3) to calculate P r i o r j 1 (priority value uncaptured j with Criterion 1).
  • Criterion 2: Value Surplus (VS)
    Table A7. Alternative Comparison Matrix for Criterion 2.
    Table A7. Alternative Comparison Matrix for Criterion 2.
    VSVU # 1VU # 2VU # n
    VU # 1 X 11 X 12 X 1 n
    VU # 2 X 21 X 22 X 2 n
    VU # n X n 1 X n 2 X n n
    S u m j S u m 1 S u m 2 S u m n
    Table A8. Alternative Comparison Normalized Matrix for Criterion 2.
    Table A8. Alternative Comparison Normalized Matrix for Criterion 2.
    VSVU # 1VU # 2VU # nSum RowPriority
    VU # 1 Y 11 Y 12 Y 1 n Y 1 j P r i o r 12
    VU # 2 Y 21 Y 22 Y 2 n Y 2 j P r i o r 22
    VU # n Y n 1 Y n 2 Y n n Y n j P r i o r n 2
    Equation (A2) is used to calculate Y i j . Equation (A3) is used to calculate P r i o r j 2 (priority value uncaptured j with criterion 2).
  • Criterion 3: Value Absence (VA)
    Table A9. Alternative Comparison Matrix for Criterion 3.
    Table A9. Alternative Comparison Matrix for Criterion 3.
    VAVU # 1VU # 2VU # n
    VU # 1 X 11 X 12 X 1 n
    VU # 2 X 21 X 22 X 2 n
    VU # n X n 1 X n 2 X n n
    S u m j S u m 1 S u m 2 S u m n
    Table A10. Alternative Comparison Normalized Matrix for Criterion 3.
    Table A10. Alternative Comparison Normalized Matrix for Criterion 3.
    VAVU # 1VU # 2VU # nSum RowPriority
    VU # 1 Y 11 Y 12 Y 1 n Y 1 j P r i o r 13
    VU # 2 Y 21 Y 22 Y 2 n Y 2 j P r i o r 23
    VU # n Y n 1 Y n 2 Y n n Y n j P r i o r n 3
    Equation (A2) is used to calculate Y i j . Equation (A3) is used to calculate P r i o r j 3 (priority value uncaptured j with criterion 3).
  • Develop a priority matrix from the alternatives used
    Table A11. Priority Matrix of Value Uncaptured.
    Table A11. Priority Matrix of Value Uncaptured.
    AlternativesVMVSVA
    VU # 1 P r i o r 11 P r i o r 12 P r i o r 13
    VU # 2 P r i o r 21 P r i o r 22 P r i o r 23
    VU # n P r i o r n 1 P r i o r n 2 P r i o r n 3
vi.
Determine the priority (weight) of all alternatives
a.
Develop alternative priority matrices with priority criteria (Table A12)
Table A12. Alternative Priority with Criteria Priority.
AlternativesVMVSVA
Priority Criteria
P r i o r 1 P r i o r 2 P r i o r 3
VU # 1 P r i o r 11 P r i o r 12 P r i o r 13
VU # 2 P r i o r 21 P r i o r 22 P r i o r 23
VU # n P r i o r n 1 P r i o r n 2 P r i o r n 3
b.
Arrange the value uncaptured relative weight matrix (Table A13)
Table A13. Value Uncaptured Relative Weight Matrix.
AlternativesVMVSVARelative Weights
VU # 1 W 11 W 12 W 13 W_VU1
VU # 2 W 21 W 22 W 23 W_VU2
VU # n W n 1 W n 2 W n 3 W_VUn
The formulas used in Table A13 are as follows:
W i j = P r i o r j   .   P r i o r i j ; i = 1 ,   2 ,   , n   and   j = 1 ,   2 ,   3 .
W V U i = j = 1 3 W i j ; i = 1 ,   2 ,   , n .              
Table A14. Jobs with Multiple Supporting Gains.
JobsGains
Furniture products that are easy to clean (Jb # 1)The material that makes up the product, which is predominantly wood, is quite easy to care for (Gn # 1)
Furniture products made of wood as the main ingredient, so they are light to move during the cleaning process (Gn # 2)
Staining on furniture products causes the surface to be smoother (Gn # 3)
The sanding process on the finish makes furniture products have a smoother surface (Gn # 4)
Products that cause the appearance of the house (indoor and outdoor) to be tidier (Jb # 2)Stored items are more neat and organized (Gn # 1)
The product shape adapts to the shape of the room (Gn # 2)
The product size adapts to the size of the room (Gn # 3)
Product design that adapts to customer desires (Gn # 4)
Decorative handicraft products (Jb # 3)Natural product appearance (Gn # 1)
The indoor appearance (room, living room, kitchen, etc.) is more elegant (Gn # 2)
The appearance of indoor plants is neater (Gn # 3)
The outdoor appearance (terrace, garden, etc.) is more attractive and elegant (Gn # 4)
Product design that adapts to customer desires (Gn # 5)
Eco-friendly craft products (Jb # 4)The resulting furniture products do not endanger the health of customers (Gn # 1)
The resulting furniture products do not use much metal additives (Gn # 2)
Furniture products use dyes that are safe for consumers and the environment (Gn # 3)
Low-risk furniture products produce hazardous waste at the end of their life (Gn # 4)
The resulting furniture products are durable (Gn # 5)

References

  1. Shubham, S.; Charan, P.; Murty, L.S. Organizational Adoption of Sustainable Manufacturing Practices in India: Integrating Institutional Theory and Corporate Environmental Responsibility Organizational Adoption of Sustainable Manufacturing Practices. Int. J. Sustain. Dev. World Ecol. 2018, 25, 23–34. [Google Scholar] [CrossRef]
  2. Bhanot, N.; Rao, P.V.; Deshmukh, S. An integrated approach for analysing the enablers and barriers of sustainable manufacturing. J. Clean. Prod. 2017, 142, 4412–4439. [Google Scholar] [CrossRef]
  3. Nurmesniemi, H.; Pöykiö, R.; Keiski, R.L. A case study of waste management at the Northern Finnish pulp and paper mill complex of Stora Enso Veitsiluoto Mills. Waste Manag. 2007, 27, 1939–1948. [Google Scholar] [CrossRef] [PubMed]
  4. Singh, S.; Kulkarni, S.; Kumar, V.; Vashistha, P. Sustainable utilization of deinking paper mill sludge for the manufacture of building bricks. J. Clean. Prod. 2018, 204, 321–333. [Google Scholar] [CrossRef]
  5. Cheok, C.Y.; Adzahan, N.M.; Rahman, R.A.; Abedin, N.H.Z.; Hussain, N.; Sulaiman, R.; Chong, G.H. Current trends of tropical fruit waste utilization. Crit. Rev. Food Sci. Nutr. 2016, 58, 1–27. [Google Scholar] [CrossRef]
  6. Yang, M.; Vladimirova, D.; Evans, S. Creating and Capturing Value Through Sustainability. Res. Manag. 2017, 60, 30–39. [Google Scholar] [CrossRef]
  7. Chesbrough, H.; Lettl, C.; Ritter, T. Value Creation and Value Capture in Open Innovation. J. Prod. Innov. Manag. 2018, 35, 930–938. [Google Scholar] [CrossRef] [Green Version]
  8. Dyer, J.H.; Singh, H.; Hesterly, W.S. The relational view revisited: A dynamic perspective on value creation and value capture. Strat. Manag. J. 2018, 39, 3140–3162. [Google Scholar] [CrossRef]
  9. Sjödin, D.; Parida, V.; Jovanovic, M.; Visnjic, I. Value Creation and Value Capture Alignment in Business Model Innovation: A Process View on Outcome-Based Business Models. J. Prod. Innov. Manag. 2019, 37, 158–183. [Google Scholar] [CrossRef] [Green Version]
  10. Lüdeke-Freund, F. Towards a Conceptual Framework of Business Models for Sustainability. In Proceedings of the ERSCP-EMSU Conference 2010, Delft, The Netherlands, 25–29 October 2010. [Google Scholar]
  11. Adams, R.; Jeanrenaud, S.; Bessant, J.; Denyer, D.; Overy, P. Sustainability-oriented Innovation: A Systematic Review. Int. J. Manag. Rev. 2016, 18, 180–205. [Google Scholar] [CrossRef]
  12. Høgevold, N.M.; Svensson, G.; Wagner, B.; Petzer, D.J.; Klopper, H.B.; Varela, J.C.S.; Padin, C.; Ferro, C. Sustainable Business Models Corporate Reasons, Economic Effects, Social Boundaries, Environmental Actions and Organizational Challenges in Sustainable Business Practices. Balt. J. Manag. 2014, 9. [Google Scholar] [CrossRef]
  13. Zott, C.; Amit, R.; Raffi, H.; Massa, L. The Business Model: Recent Developments and Future Research. SSRN Electron. J. 2011, 37, 1019–1042. [Google Scholar] [CrossRef] [Green Version]
  14. Mentink, B.A.S. Circular Business Model. Innovation A Process. Framework and A Tool for Business Model. Innovation in A Circular Economy; Delft University of Technology & Leiden University: Delft, The Netherlands, 2014. [Google Scholar]
  15. Macarthur, E. Towards The Circular Economy: Accelerating The Scale-up Across Global Supply Chains. J. Ind. Ecol. 2013, 2, 23–44. [Google Scholar]
  16. Guldmann, E. Best Practice Examples of Circular Business Models; The Danish Environmental Protection Agency: Copenhagen, Denmark, 2016. [Google Scholar]
  17. Lewandowski, M. Designing the business models for circular economy—Towards the conceptual framework. Sustainability 2016, 8, 43. [Google Scholar] [CrossRef] [Green Version]
  18. Osterwalder, A.; Pigneur, Y.; Bernarda, G.; Smith, A. Value Proposition Design; John Wiley & Sons, Inc.: Hoboken, NJ, USA, 2014. [Google Scholar]
  19. Pokorná, J.; Pilař, L.; Balcarová, T.; Sergeeva, I. Value Proposition Canvas: Identification of Pains, Gains and Customer Jobs at Farmers’ Markets. Econ. Inform. 2015, 7, 123–130. [Google Scholar] [CrossRef] [Green Version]
  20. Baldassarre, B.; Calabretta, G.; Bocken, N.; Jaskiewicz, T. Bridging sustainable business model innovation and user-driven innovation: A process for sustainable value proposition design. J. Clean. Prod. 2017, 147, 175–186. [Google Scholar] [CrossRef] [Green Version]
  21. Manninen, K.; Koskela, S.; Antikainen, R.; Bocken, N.; Dahlbo, H.; Aminoff, A. Do circular economy business models capture intended environmental value propositions? J. Clean. Prod. 2018, 171, 413–422. [Google Scholar] [CrossRef] [Green Version]
  22. Franceschini, F. Advanced Quality Function Deployment; CRC Press: Boca Raton, FL, USA, 2001. [Google Scholar]
  23. Dewa, P.K.; Pujawan, I.N.; Vanany, I. Human Errors in Warehouse Operations: An Improvement Model. Int. J. Logist. Syst. Manag. 2017, 27, 298–317. [Google Scholar] [CrossRef]
  24. Mabe, S.; Pujawan, N.; Dana, P.; Engelseth, P. Mitigating Risk in The Tuna Supply Through Traceability System Development. Int. Food Agribus. Manag. Rev. 2016, 19, 59–82. [Google Scholar]
  25. Pulansari, F.; Suparno, S.; Partiwi, S.G. A development of A Framework for Evaluation of Reverse Logistics Maturity Level. Int. J. Logist. Syst. Manag. 2018, 29, 151–172. [Google Scholar] [CrossRef]
  26. Vaida, C.; Gherman, B.; Dragomir, M.; Iamandi, O.; Banyai, D.; Popescu, D. Smart Furniture—Quo Vadis. Int. Conf. Prod. Res. Afr. Eur. Middle East. 2014, 493–498. [Google Scholar]
  27. Toivonen, R.M. Product quality and value from consumer perspective—An application to wooden products. J. For. Econ. 2012, 18, 157–173. [Google Scholar] [CrossRef]
  28. Shuaib, M.; Seevers, D.; Zhang, X.; Badurdeen, F.; Rouch, K.E.; Jawahir, I.S. Product Sustainability index (ProdSI): A Metrics-Based Framework To Evaluate The Total Life Cycle Sustainability of Manufactured Products. J. Ind. Ecol. 2014, 18, 491–507. [Google Scholar] [CrossRef]
  29. Hapuwatte, B.; Seevers, K.D.; Badurdeen, F.; Jawahir, I. Total Life Cycle Sustainability Analysis of Additively Manufactured Products. Procedia CIRP 2016, 48, 376–381. [Google Scholar] [CrossRef] [Green Version]
Figure 1. Manufacturing System with a Circular Business Model.
Sustainability 13 05647 g001
Figure 2. Combination of Value Proposition Design and House of Value Application.
Sustainability 13 05647 g002aSustainability 13 05647 g002b
Figure 3. Value Uncaptured Decision Hierarchy.
Sustainability 13 05647 g003
Figure 4. Relationship between VU and Jobs.
Sustainability 13 05647 g004
Figure 5. HOV of Determining Jobs Relative Importance Weight.
Sustainability 13 05647 g005
Figure 6. HOV of Determining Gain Creators Relative Weight.
Sustainability 13 05647 g006
Figure 7. HOV of Determining Value Captured Relative Importance Weight.
Sustainability 13 05647 g007
Figure 8. The Structure of the Three Pillars of Sustainability with Its Elements.
Sustainability 13 05647 g008
Table 1. Measurement Scale Used.
Measurement ScaleExplanation
1Both statements are equally important
3Statement 1 is marginally more important than Statement 2
5Statement 1 is more important than Statement 2
7Statement 1 is more important than Statement 2
9Statement 1 is far more important than Statement 2
Table 2. Pairwise Comparison Matrix Design Between Criteria.
CriteriaScoreCriteria
975313579
VM X VS
X VA
VS X VA
Table 3. Pairwise Comparison Matrix Design between Alternatives.
AlternativesCriterion # 1: VMAlternatives
Score
975313579
VU # 1 X VU # 2
X VU # 3
VU # 2 X VU # 3
Criterion # 2: VS
Score
975313579
VU # 1 X VU # 2
X VU # 3
VU # 2 X VU # 3
Criterion # 3: VA
Score
975313579
VU # 1 X VU # 2
X VU # 3
VU # 2 X VU # 3
Table 4. Matrix of Relationship between VU and Jobs.
Value Uncaptured (VU)ScoreJobs (Jb)
139
VU # 1 X Jb # 1
X Jb # 2
X Jb # 3
X Jb # 4
VU # 2 X Jb # 1
X Jb # 2
X Jb # 3
X Jb # 4
VU # 3X Jb # 1
X Jb # 2
X Jb # 3
XJb # 4
Table 5. Design of Scoring Calculation of Gains Relative Weights.
NoCustomers ScoresTotal
Gn # 1Gn # 2Gn # 3Gn # 4Gn # 5
1Cust # 154455
2Cust # 233333
3Cust # 343444
30Cust # 3052545
S u m _ G n j 12193116110122 S u m _ G n
W _ G n j W _ G n 1 W _ G n 2 W _ G n 3 W _ G n 4 W _ G n 5 1
Table 6. Matrix of Relationship between Gain Creators and Value Captured.
Gain Creators (GC)ScoreValue Captured (VC)
139
GC # 1 XVC # 1
X VC # 2
X VC # 3
X VC # 4
X VC # 5
GC # 2 X VC # 1
XVC # 2
X VC # 3
X VC # 4
X VC # 5
GC # 3 X VC # 1
X VC # 2
XVC # 3
X VC # 4
X VC # 5
GC # 4X VC # 1
X VC # 2
X VC # 3
XVC # 4
X VC # 5
GC # 5X VC # 1
X VC # 2
X VC # 3
X VC # 4
XVC # 5
Table 7. Matrix of Relationship between Value Captured and Three Pillars of Sustainability.
Value CapturedScoreThree Sustainability Pillars
139
Average Score
VC # 13Ec # 1: Ec # 1.1, Ec # 1.2, and Ec # 1.3
3Ec # 2
5Ec # 3: Ec # 3.1 and Ec # 3.2
1Sc # 1: Sc # 1.1 and Sc # 1.2
2Sc # 2: Sc # 2.1 and Sc # 2.2
1Sc # 3
9Sc # 4
4En # 1: En # 1.1, En # 1.2, and En # 1.3
1En # 2
1En # 3
3En # 4: En # 4.1 and En # 4.2
VC # 23Ec # 1: Ec # 1.1, Ec # 1.2, and Ec # 1.3
3Ec # 2
5Ec # 3: Ec # 3.1 and Ec # 3.2
1Sc # 1: Sc # 1.1 and Sc # 1.2
2Sc # 2: Sc # 2.1 and Sc # 2.2
3Sc # 3
9Sc # 4
2En # 1: En # 1.1, En # 1.2, and En # 1.3
1En # 2
1En # 3
2En # 4: En # 4.1 and En # 4.2
VC # 32Ec # 1: Ec # 1.1, Ec # 1.2, and Ec # 1.3
3Ec # 2
5Ec # 3: Ec # 3.1 and Ec # 3.2
1Sc # 1: Sc # 1.1 and Sc # 1.2
2Sc # 2: Sc # 2.1 and Sc # 2.2
3Sc # 3
3Sc # 4
4En # 1: En # 1.1, En # 1.2, and En # 1.3
3En # 2
3En # 3
5En # 4: En # 4.1 and En # 4.2
VC # 42Ec # 1: Ec # 1.1, Ec # 1.2, and Ec # 1.3
1Ec # 2
5Ec # 3: Ec # 3.1 and Ec # 3.2
1Sc # 1: Sc # 1.1 and Sc # 1.2
2Sc # 2: Sc # 2.1 and Sc # 2.2
3Sc # 3
3Sc # 4
2En # 1: En # 1.1, En # 1.2, and En # 1.3
1En # 2
1En # 3
2En # 4: En # 4.1 and En # 4.2
VC # 57Ec # 1: Ec # 1.1, Ec # 1.2, and Ec # 1.3
3Ec # 2
5Ec # 3: Ec # 3.1 and Ec # 3.2
6Sc # 1: Sc # 1.1 and Sc # 1.2
2Sc # 2: Sc # 2.1 and Sc # 2.2
1Sc # 3
1Sc # 4
1En # 1: En # 1.1, En # 1.2, and En # 1.3
1En # 2
1En # 3
1En # 4: En # 4.1 and En # 4.2
Table 8. The Design of Sustainable Value Captured (SVC) Scoring.
SVCSub Index LevelCluster Level
VC # 1VC # nSub IndexWeightWeighted ScoresClusterWeightWeighted Scores
VC #1VC # nVC # 1VC # n
S_VC1S_VCnProfit0.33S_VC1_EcS_VCn_EcEc # 11/nR_VC1Ec1R_VCnEc1
Ec # n1/nR_VC1EcnR_VCnEcn
People0.33S_VC1_ScS_VCn_ScSc # 11/nR_VC1Sc1R_VCnSc1
Sc # n1/nR_VC1ScnR_VCnScn
Planet0.33S_VC1_EnS_VCn_EnEn # 11/nR_VC1En1R_VCnEn1
En # n1/nR_VC1EnnR_VCnEnn
Table 9. Value Uncaptured Identification.
ReferencesValue Uncaptured
Design: insufficient design and low design quality; Production: low production technology and quality problems; Operation management: poor flexibility; Customer needs: unclear customer needsThe size (dimension) of the product does not match what the consumer needs (VU # 1)
Design: low design quality and production: quality problemsQuality does not match consumer expectations (VU # 2)
Production: over procurement or too early procurement dan seven wastes from lean productionThe remaining material (rattan pieces) still has economic value (VU # 3)
Table 10. Value Uncaptured Relative Importance Weight.
NoValue UncapturedWeight
1The size (dimension) of the product does not match what the consumer needs (VU # 1)0.08
2Quality does not match consumer expectations (VU # 2)0.34
3The remaining material (rattan pieces) still has economic value (VU # 3)0.58
Table 11. Jobs Identification.
References Jobs
Easy to cleanFurniture products that are easy to be cleaned (Jb # 1)
DesignProducts that cause the appearance of the house (indoor and outdoor) to be tidier (Jb # 2)
DesignDecorative handicraft products (Jb # 3)
Eco-friendlyEco-friendly handicraft products (Jb # 4)
Table 12. Jobs Relative Importance Weight.
JobsWeight
Furniture products that are easy to be cleaned (Jb # 1)0.14
Products that cause the appearance of the house (indoor and outdoor) to be tidier (Jb # 2)0.14
Decorative handicraft products (Jb # 3)0.24
Eco-friendly handicraft products (Jb # 4)0.48
Table 13. Jobs with Supported Gains.
JobsGains
Eco-friendly craft products (Jb # 4)The resulting furniture products do not endanger the health of customers (Gn # 1)
The resulting furniture products do not use much metal additives (Gn # 2)
Furniture products use dyes that are safe for consumers and the environment (Gn # 3)
Low-risk furniture products produce hazardous waste at the end of their life (Gn # 4)
The resulting furniture products are durable (Gn # 5)
Table 14. Gains Relative Importance Weight.
GainsWeight
The resulting furniture products do not endanger the health of customers (Gn # 1)0.22
The resulting furniture products do not use metal additives (Gn # 2)0.17
Furniture products use dyes that are safe for consumers and the environment (Gn # 3)0.21
Low-risk furniture products produce hazardous waste at the end of their life (Gn # 4)0.20
The resulting furniture products are durable (Gn # 5)0.22
Table 15. Gain Creators Identification.
GainsGain Creators
The resulting furniture products do not endanger the health of customersThe use of natural ingredients that are according to standards and safe for consumers (GC # 1)
The resulting furniture products do not use metal additivesDesigns that do not use much additional material (GC # 2)
Furniture products use dyes that are safe for consumers and the environmentThe use of water-based wood paint from bio-varnish (GC # 3)
Low-risk furniture products produce hazardous waste at the end of their lifeDesigns that do not use much additional material (GC # 4)
The resulting furniture products are durableSelection of right quality materials (GC # 5)
Table 16. Gain Creators Relative Weight.
Gain CreatorsWeight
The use of natural ingredients that are according to standards and safe for consumers (GC # 1)0.29
Designs that do not use much additional material (GC # 2)0.11
The use of water-based wood paint from bio-varnish (GC # 3)0.26
Designs that do not use much additional material (GC # 4)0.12
Selection of good quality materials (GC # 5)0.23
Table 17. Value Captured Relative Importance Weight.
Value CapturedWeight
Harmless furniture 1 (VC # 1)0.24
Harmless furniture 2 (VC # 2)0.18
Eco-friendly product 1 (VC # 3)0.23
Eco-friendly product 2 (VC # 4)0.18
Durable product (long life furniture product) (VC # 5)0.17
Table 18. Elements of Sustainability Three Pillars.
Three Pillars of SustainabilityElements
Economy (Profit)Initial investment (Ec # 1)
Direct/indirect costs and overheads (Ec # 2)
Benefits and losses (Ec # 3)
Society (People)Product quality and durability (Sc # 1)
Functional performance (Sc # 2)
Product EOL management (Sc # 3)
Product safety and health (Sc # 4)
Environmental (Planet)Material use and efficiency (En # 1)
Energy use and efficiency (En # 2)
Other resources use and efficiency (En # 3)
Water and emissions (En # 4)
Product EOL (En # 5)
Table 19. Sustainable Value Captured Scores.
Value CapturedSVC
Harmless furniture 1 (VC # 1)3.02
Harmless furniture 2 (VC # 2)2.94
Eco-friendly product 1 (VC # 3)3.07
Eco-friendly product 2 (VC # 4)2.11
Durable product (long life furniture product) (VC # 5)2.79
Publisher’s Note: MDPI stays neutral with regard to jurisdictional claims in published maps and institutional affiliations.

