Abstract
Climate change impacts urban areas with greater frequency and exposes continental cities located on floodplains to extreme cloudbursts events. This scenario requires developing specific flooding vulnerability mitigation strategies that improve local knowledge of flood-prone areas at the urban scale and supersede the traditional hazard approach based on the classification of riverine buffers. Moreover, decision-makers need to adopt performance-based strategies for contrasting climate changes and increasing the resilience of the system. This research develops the recent Flooding Risk Mitigation model of InVEST (Integrated Evaluation of Ecosystem Services and Trade-off), where cloudburst vulnerability results from the soil’s hydrological conductivity. It is based on the assumption that during cloudburst events, all saturated soils have the potential for flooding, regardless of the distance to rivers or channels, causing damage and, in the worst cases, victims. The model’s output gives the run-off retention index evaluated in the catchment area of Turin (Italy) and its neighborhoods. We evaluated the outcome to gain specific insight into potential land use adaptation strategies. The index is the first experimental biophysical assessment developed in this area, and it could prove useful in the revision process of the general town plan underway.
1. Introduction
The spatial knowledge of local conditions obtained using advanced digital technologies and modelling scenarios is one of the most debated and discussed approaches to preparing and adapting urban systems to deal with future challenges [1,2]. Among others, climate change will be one of the greatest threats for urban areas [3], since the quantity, duration, and intensity of heavy rains, urban heat islands, storms, wind, and other climate-related extreme events will increase the exposure of both natural and human-made systems, with a greater impact in urban areas due to the population density [4,5].
Despite the technological and social predictive capacity enabling us to understand where and how new phenomena will occur, it is certain that the traditional timescale, occurrence, and intensity of extreme events have changed and will continue to do so rapidly in the next few decades, according to the most recent studies [6,7].
Therefore, the failure of the traditional determination of hazard areas requires analysis to focus on the vulnerability concept instead of risk [3]. Considering that all cities can be potentially affected by extreme events, the vulnerability assessment includes an entire catchment, and not only how and where the catchment is prone to be impacted by certain circumstances (with a certain degree of intensity and with a predicted return time), as assumed by the traditional risk diagnosis.
To this matter, international literature demonstrates how the changing dynamics of extreme natural events and their impacts on environments and humans affect the health, the security, and the economy of cities [8]. Among other kinds of hazards, floods can induce health losses, deaths, accidents, mental health issues, diseases, vector-borne illnesses, and waterborne diseases [9], therefore flood susceptibility models are nowadays urgently demanded [10,11].
This research deals with cloudburst events, as introduced by Rosenzweig et al. [12], from the perspective of intrinsic vulnerability, as the propensity of an urban system to be flooded during a cloudburst event (e.g., the rainfall event that occurred in Copenhagen on 2 July 2011, where, in some parts of the city, over 100 mm of rain fell in one hour [13]).
As stated by Rosenzweig et al. [12], there are three basic categories of knowledge to support cloudburst resilience: (1) knowledge of the current weather and future climate conditions that determine a cloudburst hazard; (2) understanding of the vulnerability of urban social, ecological, and infrastructure systems, and (3) knowledge of potential strategies for cloudburst management [12].
This research investigates the second category, employing the model called “Urban Flood Risk Mitigation” of InVEST software (Integrated Valuation of Ecosystem Services and Tradeoffs, version 3.8.5) [14], an open-source modelling suite jointly developed by Stanford University, the University of Minnesota, the Nature Conservancy, and the World Wildlife Fund. This specific Ecosystem Service (ES) model was presented and taught during the course “Introduction to the Natural Capital Approach and Urban InVEST”, organized by Stanford University during the 10th World Ecosystem Service Partnership Conference in Hanover (21 November 2019). The ES modelling output has been used to evaluate the distribution of biophysical values of run-off retention in the metropolitan catchment of Turin (Italy). According to other previous studies [15,16], the vulnerability of urban areas to a cloudburst can be measured with the run-off assessment during the present predicted scenario, assuming the model returns a picture of the site-specific vulnerability in the analyzed urban catchment and that it is possible to run alternative scenarios to verify how specific nature-based or technological solutions help to improve retention performance [17,18,19]. It is worth mentioning that flooding by cloudburst has a different dynamic from riverine or fluvial flooding. While fluvial flooding is due to rivers exceeding their capacity, cloudburst flooding (or pluvial flooding) is due to extreme precipitations. It does not depend on river dynamics, but it can represent a concurrent cause of fluvial flooding, contributing to a rapid overcharge of the water streams during a cloudburst event. This means that run-off is a key parameter that determines how vulnerable the entire system is (not only riverine areas) and where the system should be transformed and adapted to reduce run-off (not only along with river-beds). This assumption clarifies that the flooding vulnerability assessment in urban areas has its peculiarity, since it is strongly conditioned by the morphological development of buildings and their distribution in public and private spaces [11,20]. The changes of natural streams during urbanization by substitution with anthropic channels limit the capacity of the system to convey floodwaters [21]. Roads and buildings increase the flood hazards by affecting the natural hydrological cycle and making the estimation of the water discharge during a rain event much more difficult due to the complexity of the urban environment and the numerous variables that should be considered [22]. A detailed evaluation of how the morphological characters of the urban environment affects the run-off volume can be found in several international publications [23,24,25]. As stated by Brunetta and Salata [15], the vulnerability assessment is the first step towards adaptation, considered as the measure of the vulnerable biophysical characters used to build a detailed spatial knowledge [26,27,28], and learning and understanding the system dynamics [29]. Even the slippery concept of resilience [30] deals with adaptation toward vulnerability reduction, broadening the “physical” meaning to incorporate socio-economic structures and governance, while including pro-active and co-evolutive feedback encompassing preparedness with knowledge and physical adaptation [31,32,33]. In practical terms, the resilience concept is operationalized at its base throughout the preliminary vulnerability measurement and identifies solutions to cope with emerging dynamics.
The research assumes the definition of the areas vulnerable to cloudburst events as the first step towards the “resilience of the system”, according to the vision of “co-evolutionary resilience” [34]. Through this vision, it is possible to identify the conditions for resilient urban planning: the preservation of the system’s constitutional framework and the ability to evolve, thus aiding the decision-making processes [35] while identifying problems (e.g., vulnerability analysis) and determining the kind and quantity of solutions through plans and projects.
In the famous cases of Phoenix and New York City (USA) or Copenhagen (Denmark), the utilization of run-off modelling through detailed spatial maps has been virtuously employed in water management plans and projects while adapting the city to cloudbursts.
This study aims to apply a similar methodology in an Italian context, while modelling with Geographic Information System (GIS)-based software the spatial distribution of the run-off, and to understand where and how nature-based solutions can contribute to adapt the system towards a greener and healthier environment.
The model and related approach presented in the paper is tested in the metropolitan catchments of the city of Turin (IT), an Italian city of medium size that has undergone rapid growth during the 20th Century. Mainly, Turin is intrinsically vulnerable to every rain event since its urban land is characterized by a high rate of imperviousness and a compact, densely built-up settlement system [36].
The manuscript is structured as follows: first is the methodology, presenting the catchment area and its distinctive characteristics; next, the functioning and input data required for the Urban Flood Mitigation model are described; and finally, the results describing the numerical/graphical outputs of the model, the discussion summarizing the evidence derived by the run-off retention service, and the conclusions, briefly presenting all relevant matters and proposing innovative and potential applications for future research, are presented. The novelty of this work consists in applying a common methodological framework for defining the area subjected to flooding, the intensity of the phenomenon, and the most suitable solutions that could substantially reduce the vulnerability, by using an open-access GIS experimental ES model. The use of a case study aims to highlight the possible planning application and how this kind of approach needs to be considered for setting future urban strategies.
2. Materials and Methods
2.1. The Turin Metropolitan Area
The catchment area includes 21 municipalities that border the city of Turin (Figure 1), defined as the “first ring” due to their strong interaction with the main city, namely, Baldissero Torinese, Beinasco, Borgaro Torinese, Caselle Torinese, Castiglione Torinese, Collegno, Druento, Gassino Torinese, Grugliasco, Leinì, Mappano, Moncalieri, Nichelino, Orbassano, Pecetto Torinese, Pianezza, Pino Torinese, San Mauro Torinese, San Raffaele Cimena, Settimo Torinese, Torino, Venaria Reale, and Volpiano. Despite the high administrative fragmentation, the city of Turin consists physically of a unique semi-dense continuous built-up system that from the core area shapes the surrounding zones while comprising a heterogeneous land use [37]. The average daily temperature varies from below 1.4 °C in January to 23.6 °C recorded in July, the climate is warm and temperate with significant rainfall throughout the year (about 864 mm of annual precipitation), and the driest month is January, with 38 mm, while May is the wettest month, with an average of 108 mm (https://en.climate-data.org/ accessed on 16 September 2020).
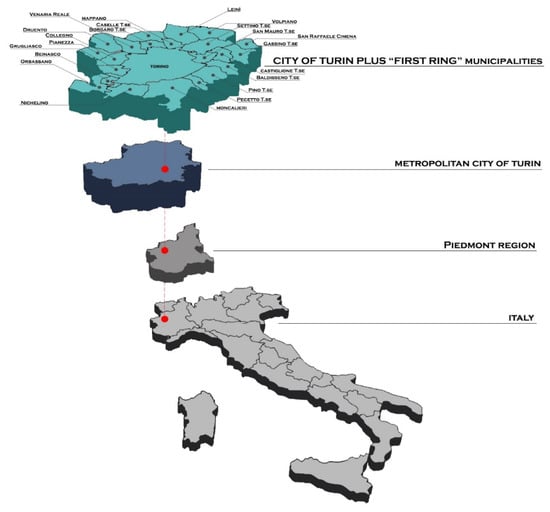
Figure 1.
A schematic view of the catchment area (top sub-figure). The whole of Turin plus the surrounding municipalities.
The catchment area (Figure 1) covers 56,777 hectares, with an altitude that varies between 180 and 715 m above sea level (Turin is located at 248 m a.s.l.). About 36% of the area is hilly land (mean altitude ranging between 100 and 600 m a.s.l.), while the rest is lowland areas (mean altitude below 100 m a.s.l.), according to the regional topographic database.
The area consists of a varied heterogeneous landscape, from the suburban eastern hills with a semi-dense built-up zone to the dense and continuous built-up area of the city center and the lowland river areas of Sangone, Dora, and Stura that shape the orography of this flood-prone catchment area.
According to the Land Cover dataset (2017) of the National Superior Institute for Environmental Protection and Research (ISPRA), the land use of Turin consists of 35.41% artificial surface, 0.28% unvegetated natural areas, 23.44% trees, 0.14% shrubs, 39.86% agricultural land, and 0.87% water bodies and wetlands.
The extent of artificial surfaces with impermeable cover is relatively high in Turin, highlighting the peak of 100% of sealed surfaces (e.g., the productive sites or the densely built-up residential areas) in some urban districts. The combination of floodplain soils and high sealed surfaces makes this territory prone to flooding during any rainfall events: both the prolonged and less intense events that mostly cause riverine flooding, and the single and unpredictable cloudburst event.
The most recent event was on 17 August 2020, when more than 70 mm of rainfall fell in less than one hour, flooding the city at several sites while creating damage to infrastructures and a sewage system black-out causing dangerous situations (Figure 2). Two metro stations were partially inundated, while for two consecutive days, the streets, canals, and sewage system were temporarily inoperative due to the high quantity of debris that flowed into the city, especially along the Po River and the hill (see local-newspaper-reported photos and videos, e.g., TorinoToday https://www.torinotoday.it/meteo/maltempo-temporale-strade-fiumi-17-agosto.html accessed on 3 October 2020).
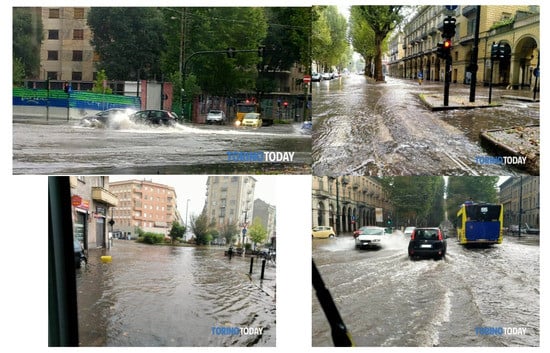
Figure 2.
Images of the rainy event of 17 August 2020 in Turin (Credits: Pictures taken by Alex Oberto, published by the online journal TORINOTODAY on 17 August at 4:08 p.m., permission asked to the online journal).
Despite the evidence of the problem, there is no strategic plan or program that addresses this threat by proposing solutions that can solve it or limit the damage. The approach adopted is still focused on identifying risky areas by the interaction between settlements and riverine-flood-prone areas. At the same time, there is no overall strategy that involves the city in all its complexity selecting the most appropriate solutions to reduce its vulnerability.
2.2. Model Input
The Urban Flood Mitigation model has been recently added to the software InVEST (version 3.8.5) [14], released by the Natural Capital Project. This model represents one of the first tools designed explicitly for mapping urban ES, since this suite of tools was originally designed to map ES while not considering the influence of the built-up infrastructures of the city on ES provision.
The model aims to verify the capacity of urban catchments to limit the run-off process, avoiding potential urban flooding by a cloudburst. It assumes that flood-prone areas are those where a coupled interaction between the kind of permeable/impermeable materials of artificial surfaces (e.g., urban areas) and the quantity of soil drainage (depending on water conductivity) generates the amount of water that accumulates by surface run-off during a cloudburst, resulting in temporary flooding. The model simplifies the process of run-off discharge by considering that the water on the impervious surface moves directly to the area next to it, contributing directly to a surface flow accumulation. Nevertheless, in dense urban catchments, the building roofs, terraces, and other horizontal or vertical surfaces that capture the rainwater do not directly contribute to the soil run-off. Instead, the water is temporarily withheld in various paths (e.g., water pipes of the rainwater sewer system) and contributes to the total discharge sometime later. Specific literature on this dynamic demonstrates how the biophysical quantification of the run-off in the built environment exposed to torrential hazards can be significantly difficult to estimate [20], since the quantity, quality, and surface of buildings, the sewer systems, the presence of dust in the ground, and the dryness of the soil can affect the discharge volume during cloudburst [11,38].
Therefore, the results of this study should be evaluated bearing in mind that the InVEST model uses an empirical simplification by calculating the discharge volume in urban areas using a plain bidimensional model based on the run-off curve number. The run-off curve number is a parameter that assumes that where there is a highly sealed surface and the soil has low conductivity, the run-off process will be the highest (e.g., high run-off means that the exact amount of rainfall is not retained by soil and flows in another part of the city). On the other hand, when there are fewer sealed surfaces and soils with high conductivity, the potential retention is more elevated.
This model considers the potential of porous green areas to reduce the run-off process by absorbing water, slowing surface flows, and creating space for water collection (in floodplains or basins). The output calculates the run-off reduction (i.e., the amount of run-off retained per pixel compared to the storm volume) and, for each watershed, gives a potential estimate of the economic damage by overlaying information on flood extent potential and built infrastructure (see Figure 3). In this case, the model has been employed without economic evaluation due to limited data and knowledge necessary for running the model correctly.
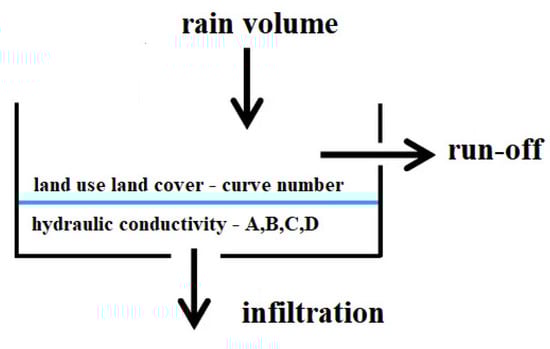
Figure 3.
Scheme of the model functioning.
The inputs required are:
- Watershed Vector delineating areas of interest;
- Depth of rainfall in mm (of a single cloudburst event);
- Land Cover Map;
- Soils Hydrological Group Raster;
- The biophysical value corresponding to each of the land use classes in the Land Cover Map.
Since run-off retention depends on the interaction between soil and land cover, the incorporation of the following two databases is crucial:
- Data on land use (or land cover map) used to set the run-off curve number (RCN). RCN represents the hydrologic soil capacity and indicates the run-off potential: the higher the RCN, the higher the run-off potential [39].
- Data on hydraulic conductivity was used to establish soil drainage properties to verify the quantitative measure of a saturated soil’s ability to transmit water when subjected to a hydraulic gradient [40].
A Table with RCN A, B, C, and D was associated with the classes (Table 1) on the permeability of urban soil. Therefore, the land use classification was entirely built around the USDA classes employing the regional topographic geodatabase (BDTRE) available at https://www.geoportale.piemonte.it/cms/bdtre/bdtre-2 (accessed on 10 June 2020). The data on urban green areas were extracted with a thematic overlap between BDTRE and the Land Cover Piedmont (2010), which classifies the urban areas according to the Corine Land Cover thematic legend (available at https://land.copernicus.eu/pan-european/corine-land-cover, accessed on 10 June 2020). The final layer allows the urban districts, infrastructure system, open spaces, and buildings to be identified.

Table 1.
Land Use Curve numbers used in the sensitivity table (model input).
We employed two additional datasets to rank these layers in permeability/condition classes:
- The National High-Resolution Land Consumption map (NHRLC) is a raster database of 10 m pixel size produced yearly (by the Italian Institute for Environmental Protection and Research) since 2015, covering the entire Italian territory and monitoring activities of institutional land take. This dataset was obtained using semi-automatic classification techniques from high-resolution satellite images to detect sealed and artificial areas and is downloadable as open access data from the SINANET portal (http://groupware.sinanet.isprambiente.it/uso-copertura-e-consumo-di-suolo/library/consumo-di-suolo, accessed on 3 June 2020);
- The Normalized Difference Vegetation Index (NDVI) detects the consistency of vegetation by measuring the difference between near-infrared (which is reflected by vegetation) and red light (which is absorbed by the plant). The NDVI employed in this research was provided by the Regional Agency for Environmental Protection in Piedmont (ARPA Piedmont) and obtained by Sentinel 2A image of 2016 (Copernicus Program). More information and data are available at http://webgis.arpa.piemonte.it/geoportalserver_arpa/catalog/search/resource/details.page?uuid=ARLPA_TO:SENTINEL2_NDVI_2016-01-18-10:00, accessed on 3 June 2020.
The NHRLC was used to calculate the permeability of urban districts, while NDVI was used to define the “condition” (poor, fair, and good) of urban open spaces according to USDA classification of RCN. For both datasets, the procedure was the same: the Land Use layer was intersected with the NHRLC or NDVI dataset. Then, the average values of imperviousness and vegetation density for each land use class were calculated. Agricultural land, natural land, and water bodies were assigned the average values found from USDA parameters.
The final biophysical table is shown below (Table 1) and organized into 17 Land Use classes characterized by a particular run-off curve parameter for each soil group.
The second database represents the saturated hydraulic conductivity (Ksat, mm/h, Table 2), which is defined as the soil’s ability to be vertically drained by liquids in a saturated condition. This means that soil with good conductivity allows a significant quantity of water absorption and movement in a short period (high conductivity). With a high conductivity, the water quickly reaches the aquifer, while the surface flow processes’ result is limited. Therefore, conductive soils are protective against surface erosion and ensure a better quality of surface water. On the contrary, permeable soils are not protective of groundwater because of the high conductivity. The situation is the opposite in the presence of conductivity characterized by low infiltration and high processes of surface run-off [41].
Table 2.
Soil Groups according to USDA classification.
Lastly, hydraulic conductivity is a function of soil porosity: the water’s movement is facilitated when pores are large and continuous, while it is more difficult when the pores are small and disconnected. The soil’s porosity is connected with soil texture: clay soils generally have a lower saturated hydraulic conductivity than the sandy and gravel soils, where the pores, less numerous but larger, facilitate the passage of significant volumes of water [15].
To map soil conductivity in the catchment, we used the digital “Map of soil protection capacity” (available online at https://www.regione.piemonte.it/web/temi/agricoltura/agroambiente-meteo-suoli, accessed on 3 June 2020). The map represents the soil’s protective capacity against the infiltration of pollutants, taking the conductivity (“Fk” values) as a proxy for protection (high conductivity corresponds to low protection and vice versa). The map is grouped into eight classes, from high to low protection.
We made a reclassification into four classes, considering the low protective capacity as the first class (Group A), assuming that all those soils that did not protect groundwater (with high Fk values) have high conductivity:
- Group A (Fk 7 and Fk 8);
- Group B (Fk 5 and Fk 6);
- Group C (Fk 3 and Fk 4);
- Group D (Fk 1 and Fk 2).
The result is presented in Figure 4, where it can be noted how the dense built-up system of the city of Turin stands on a Group B soil, which is a good one (medium-high conductivity) while the hill (eastern part) is rooted in Groups C and D, resulting in its being extremely vulnerable to rainfall events.
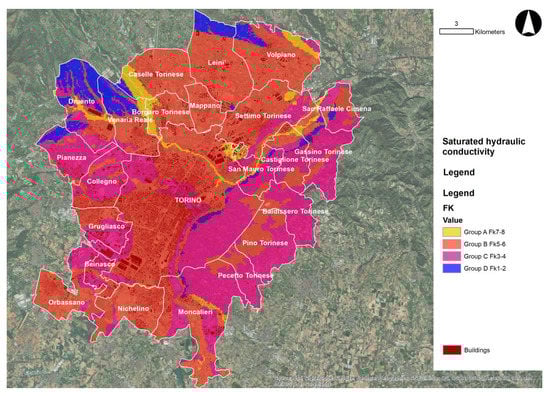
Figure 4.
The soil conductivity map (World imagery sources: Esri, DigitalGlobe, Earthstar Geographics, CNES/Airbus DS, GeoEye, USDA FSA, USGS, Getmapping, Aerogrid, IGN, IGP, and the GIS User Community).
The model was run considering a single rain event of 50 mm, which has been established as a threshold of cloudburst, according to Rosenzweig et al. [12].
3. Results
3.1. Urban Flood Risk Model Output
The result provides data on run-off process, identifying the quantities of the phenomenon and, consequently, how much the retention should be increased to limit floods from cloudburst events (Table 3).
Table 3.
Flood Mitigation Risk Model output.
Table 3 shows the run-off retention values for each municipality of the catchment area, including the absolute quantity of retained water in cubic meters (cu.m.) and the relative run-off index. Caselle Torinese, Borgaro Torinese, Mappano, and Pino Torinese are the municipalities with the highest relative retention index (absolute values should be judged against the extent of the municipalities). At the same time, Turin has the lowest retention capacity, although Beinasco, Collegno, and Grugliasco are also in the lower group. Table 3 also provides the average absolute retention per hectare in each municipality: Caselle Torinese, the best performing municipality, can retain more than 356 cu.m. of water per hectare during a rain event of 50 mm, while Turin can retain less than 240 cu.m.
Figure 5 provides a spatial distribution of the run-off retention index among the selected municipalities.
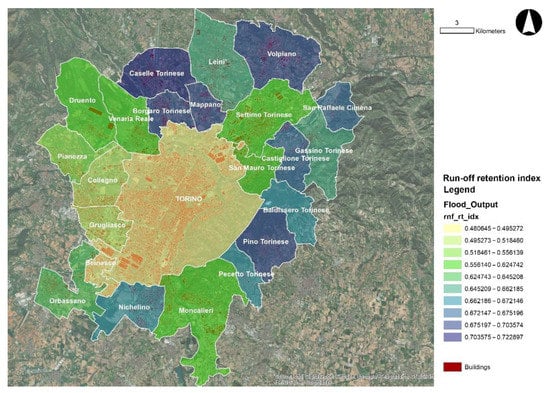
Figure 5.
Run-off retention index (rnf_rt_idx in legend) distribution (World imagery sources: Esri, DigitalGlobe, Earthstar Geographics, CNES/Airbus DS, GeoEye, USDA FSA, USGS, Getmapping, Aerogrid, IGN, IGP, and the GIS User Community).
The municipalities filled by dark blue color have good run-off retention, unlike those closer to light yellow with a lower retention capacity; the city of Turin is one of many.
Table 4 calculated the run-off index (%) as the total volume of rainfall in each municipality less the fraction that is retained (Table 3). The city of Turin reaches 52% of the run-off index. This means that 52% of the rainfall volume cannot be retained by soil, thus creating a pluvial surface stream. Therefore, more than half of the total rain volume is subject to run-off in the city, generating severe problems in terms of human safety, hydraulic safety, and water management, in addition to all the indirect effects that these phenomena may entail (e.g., congestion of the water and sewer network). The total volume of the run-off discharge is 3.4 million cubic meters, which is a huge amount, considering that the relative run-off per hectare ranges from 230 to 430 cu.m. per hectare.
Table 4.
Calculation of the run-off rate.
The simulated quantity of run-off estimated with the model can be considered similar to the event of 17 August (more than 62 mm rainfall), since it can be assumed that a fraction of the water falling during the real event has been absorbed (considered as the first 12 mm) before the soil reached its saturated capacity.
On the contrary, the same index for the most performing municipality (Caselle Torinese) has a value of 28%, which explains the difference between the two situations.
These first results are only averagely calculated for each municipality, but the model output provides a detailed distribution for each pixel of the run-off retention index (Figure 6).
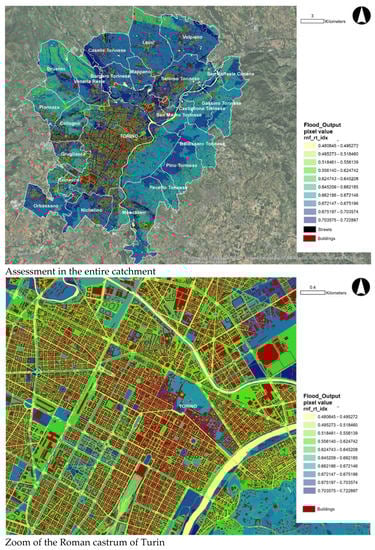
Figure 6.
Per-pixel run-off retention index (rnf_rt_idx in legend). Above the general, below the detailed map.
3.2. Selection of Nature-Based Solutions for Flood Risk Management
As already mentioned, the results can support the determination of strategies to reduce and prevent flooding events. The results can also address decision-making by suggesting solutions to mainstream the resilience of territories in their planning, and ensuring that those solutions are practicable. In the following chapters, the integration of the flooding vulnerability assessment has been investigated for the city of Turin. The latest City Planning Technical Document (2020) describes the general vulnerability of the city to hydrological hazards. However, quantitative data provides no evidence of the spatial distribution at the district level, and the real discharge capacity of the city of Turin during a single rain event is not known at the moment. Even the preliminary document of the Strategic Environmental Assessment (SEA) does not contain any proper assessment of soil infiltration capacity at the city level; thus, it is not known whether the city is vulnerable to rain events and, if so, at which threshold the city experiences a potential flood event. Therefore, a comparison between the quantity of estimated run-off by the InVEST Urban Flood Model (3.4 million cubic meters) and the real discharge capacity of the stormwater drainage system cannot be appropriately made (maybe only estimated).
We associated the quantitative evaluation of retention and run-off values produced by the model with the land use zoning of the Turin general town plan, estimating which part of the city needs a specific solution (favoring those that are nature-based) as a way to adapt the city to climate changes.
Nature-Based Solutions (NBS) are “living solutions inspired and supported by the use of natural processes and structures” that “are designed to address various environmental challenges in an efficient and adaptable manner, while simultaneously providing economic, social, and environmental benefits” [42,43].
NBS also include Sustainable Urban Drainage Systems (SUDS) as solutions specifically dedicated to improved water quality and quantity management, controlling the rates of run-off discharged into receiving water bodies. As an NBS, SUDS achieves these aims by using a mix of natural processes and green/grey components to harvest, infiltrate, slow, store, convey, and treat run-off onsite [44]. Both can be implemented as a new development or as a retrofit of existing structures.
Despite the growing interest in NBS and the proliferation of studies and international projects, their implementation to mainstream resilience remains poor or unsuccessful in most cities. Limited research has been done on how the implementation of NBS provides tangible biophysical benefits concerning specific vulnerabilities [45]. Nevertheless, NBS should be integrated into many policy sectors, including climate regulation strategies and territorial planning [45], while constructing a framework on how NBS perform on target areas [46].
In this work, we propose a selection of NBS to be implemented through the Turin general town plan, based on the flooding vulnerability assessment as a framework to set the capacity to reduce a specific degree of vulnerability.
The analysis of the run-off retention at the district level has been spatially distributed using the mean retention value for each urban feature of the city.
The functional zoning of the Turin general town plan has been superimposed on the flooding vulnerability output for identifying the distribution of critical run-off thresholds and classifying the retention capacity according to the main functional destination (e.g., residential, commercial, tertiary, or public facilities). This operation supported the selection of NBS, also considering the context of their implementation. Five classes were identified in the city of Turin (Figure 7 and Figure 8): from low retention capacity (highly sealed/low conductivity areas) to high retention capacity (unsealed/high conductivity areas).
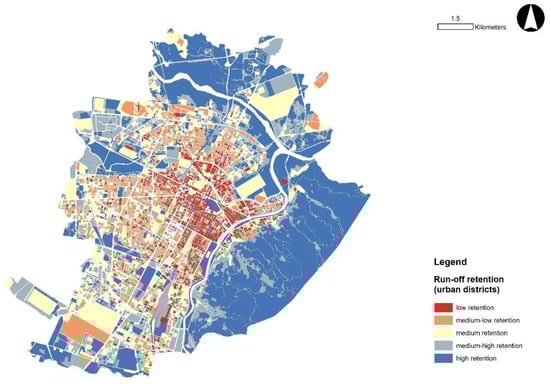
Figure 7.
Run-off retention index at the district level.
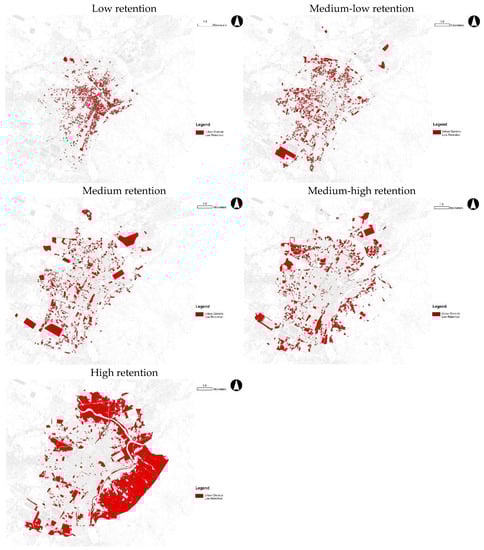
Figure 8.
Selection of urban districts with similar retention values.
The NBS selection considers the results derived from the Horizon2020 project “URBAN GreenUP”, supported by the European Commission, and from the Ihobe Environmental Management agency [47], studies of Beven [48], and the “Guidelines for the adoption of sustainable urban drainage systems for a resilient city to climate change” (available at: http://www.blueap.eu/site/wp-content/uploads/2018/07/Linee-Guida-SUDS-Bologna_EIB_rev1.pdf, accessed on 10 September 2020) published in 2018 by the Municipality of Bologna, which was the first Italian city to develop a climate change adaptation plan.
3.2.1. Low Retention Values
More than 8 million square meters have a low retention capacity (values ranging from 1.6 to 10 L per square meter), meaning that most of the historic city of Turin retains less than the 20% of the total rainfall volume per square meter (50 L). Table 5 shows that residential areas (R2, R3 and R4) and mixed-use areas (MP, districts with mixed productive use: productive, commercial, services, and residential) are the most extended land-use zones with low retention values.
Table 5.
Land use zones with low retention (with an area of at least 1 million square meters).
For these areas, the intensity of NBS contributions must be high, considering the low value of retention; therefore, a combination of strategies is encouraged. The following NBS are selected:
- Retrofitting solutions “green over grey”: These are compatible with existing buildings and concern green filters, natural wastewater treatment, biofilters, community composting, green façades, green roofs, green covering shelters, shady green structures, and green resting areas with parklets and urban orchards [49]. The project “URBAN GreenUP” reports that a green roof can absorb up to 100% of incident rainfall, dependent on conditions, and can do so regionally with only 10% of roofs greened. A 2.7% reduction in stormwater run-off can result, with a 54% average reduction in run-off per individual building [50]. Dürr [51] has estimated that a green roof with 20 cm of substrate and expanded clay can retain 90 L/sq.m. of water.
- Porous pavements: Considering the high level of sealed surfaces, the existing asphalt or concrete surface could be replaced with a porous material, increasing the percolation of rain and collecting up to 95% of surface water [52].
- Rain Gardens: This NBS could collect distributed inflows of run-off or convey run-off on the surface while enhancing access corridors or other open spaces. They could be installed in tiny areas while ensuring excellent performance and obtaining additional storage capacity to attenuate surface run-off during rainfall events. It is estimated that most inflow (98.8%) leaves the rain garden as subsurface flow [49]. In areas with a high percentage of sealing surfaces, they could be located along driveways, in low-lying areas of a property, or, if necessary, close to the building, preventing water seepage into foundations or underneath houses.
- Constructed filters or infiltration trenches: These are “mechanical” solutions consisting of structures or excavated areas containing a layer of sand, compost, organic material, peat, or other facilitating media, which work by reducing, lowering, and diffusing the stormwater run-off while augmenting the capacity of soil to drain the water during intense rainfalls. Constructed filters are suitable for sites without sufficient surface area available for bio-retention. They could be located along the perimeter of an impervious surface (e.g., parking lots, roadways, and highways).
One can expect that combining these solutions can increase retention from 20% to 23% of the total rain volume in these land use zones, which corresponds to additional retention of between 1 and 2 L per square meter. It is expected that with this improvement, the total run-off volume in these districts can be reduced by 12,746 cubic meters (during a single rain event of 50 mm).
3.2.2. Medium-Low Retention Values
More than 11 million square meters have a medium-low retention capacity (values ranging from 10 to 12.8 L retained per square meter), meaning that a great amount of the compact-consolidated city of Turin retains less than 26% of the total rain volume fall in each square meter (50 L).
Table 6 shows that residential areas (R2, R3) and mixed-use areas (M1) plus the areas for different activities (AdA) are the most extended land-use zones where medium-low retention values are obtained.
Table 6.
Land use zones with low retention (with an extension of at least 1 million square meters).
For these areas, the most suitable NBS are:
- The “green over grey” strategy where appropriate, also considering the high level of sealed surfaces.
- Permeable parking pavements or cycling-pedestrian green pavements, which are made of interlocking concrete blocks, stones, or other materials (plastic), and used to reduce the amount of overland flow reaching receiving waters and facilitating rain infiltration. This strategy can be implemented in all those private or public surfaces with dense human utilization (e.g., parking areas, squares, recreation areas, slow mobility streets) both in existing and new development zones. The gravel and vegetated systems have larger void spaces (90%), allowing greater infiltration capacity. The study conducted by Li et al. [41] has shown that permeable pavements contributed significantly to flood reduction, with a run-off control rate of 67.5%.
- Filter strips and/or filter drains: existing hard-surfaced area (e.g., roads) can be supported by incorporating semi-natural soil drainage layers to block solid transport and facilitate the infiltration of rainwater in the first layers of soil depth while also retaining pollutants. This NBS is a mechanical SUDS suitable in each district (public or private) and environment, since there is no visible effect on the natural soil cover (therefore, strips are not directly visible in the landscape) and it has a low cost of implementation.
One can expect that combining these solutions can increase the retention from 26% to 30% of the total rain volume in these land use zones, which corresponds to additional retention between 2 and 2.2 L per square meter. It is expected that within this improvement, the total run-off volume in these districts can be reduced by 26,193 cubic meters (during a single rain event of 50 mm).
3.2.3. Medium Retention Values
More than 15 million square meters have a medium retention capacity (values ranging from 12.8 to 19.6 L retained per square meter), meaning that a great amount of the public and private facilities of Turin retain less than the 39% of the total rain volume fall in each square meter (50 L).
Table 7 shows that public and private facilities, AdA, and residential R1 are the most extended land-use zones where medium retention values are obtained. These areas are characterized by a medium degree of imperviousness, a medium built-up index for different activities (residential, tertiary, productive), and ample public spaces for urban facilities.
Table 7.
Land use zones with low retention (with an extension of at least 1 million square meters).
The NBS suitable for these areas are:
- Permeable parking pavements or cycling-pedestrian green pavements, which are useful for areas with limited green spaces.
- Detention ponds or dry ponds, which are stormwater basins designed to intercept stormwater run-off for temporary impoundment and gradual release to a conveyance system or a receiving waterbody. Requiring drainage areas greater than 4 hectares [53] are not functional in dense urban areas, but only in scattered or peri-urban areas.
- Floodable parks, which are designed for mitigating potential impacts caused by surface run-off water from rainfall. They can be designed to be any size, depending on the storage requirements, and suited to dual-purpose use (e.g., open spaces such as public parks). For the case study, they could also be scattered pocket parks located in strategic areas where the model reveals an intensification of the run-off process. Floodable parks are a high-intensity strategy for contrasting flooding risk [54], but they were not compatible with the areas described in subchapters 4.1 and 4.2 that have a high degree of impervious surfaces.
One can expect that combining these solutions can increase retention from 39% to 46% of the total rain volume in these land use zones, which correspond to additional retention between 3 and 3.4 L per square meter. It is expected that with this improvement, the total run-off volume in these districts can be reduced by 56,624 cubic meters (during a single rain event of 50 mm).
3.2.4. Medium-High Retention Values
More than 18 million square meters have a medium/high retention capacity (values ranging from 19.6 to 29.6 L retained per square meter), meaning that a great amount of the public and private green and residential areas of Turin retain less than the 59% of the total rain volume fallen in each square meter (50 L).
Table 8 shows that public and private green areas, residential R1, areas for different activities, and residential R7 are the most extended land-use zones where medium-high retention values are obtained.
Table 8.
Land use zones with low retention (with an extension of at least 1 million square meters).
For these areas, two kinds of NBS are suggested, taking into account that these zones are averagely sealed with a medium-low built-up index for residential and public facilities with a huge prevalence of public spaces for green areas:
- Urban trees include tree box filters, arboretums, renewal of urban trees, and arboreal areas around urban areas. Urban trees have a high propensity for intercepting and abating run-off following extreme weather events. They can limit the impacts of flooding in urban areas and are highly suitable on public (or at least private) paved areas, especially the tree box filters that can generate a healthier and greener environment. As reported by URBAN GreenUP New Strategy for Renaturing Cities through Nature-Based Solutions [42], trees can reduce urban surface water run-off by 62% compared to areas of continuous asphalt [55].
- Swales as vegetated semi-natural canals (with water and soil erosion-resistant species) that can or cannot hold water streams permanently. The water flow in the swales can be retained by small vegetation while reaching a higher hydraulic balance and reducing the run-off. In the most advanced and efficient cases, the water harvested in the canal can be temporarily stored in artificial or natural basins. This solution has a medium contrast action against flood risk and a high potential for reducing run-off in terms of intensity and velocity.
One can expect that combining these two solutions can increase retention from 59% to 68% of the total rain volume in these land use zones, which corresponds to additional retention between 4 and 4.4 L per square meter. It is expected that with this improvement, the total run-off volume in these districts can be reduced by 82,847 cubic meters (during a single rain event of 50 mm).
3.2.5. High Retention Values
More than 48 million square meters have a high retention capacity (values ranging from 29.6 to 48.8 L retained per square meter), meaning that a great amount of the open spaces in Turin retain an amount of water that is approximately 98% of the total rain volume fallen in each square meter (50 L).
Table 9 shows that public and private green areas, private green areas, woods, public and private facilities, and residential R6 are the most extended land-use zones where high retention values are obtained. For these areas, the NBS aims to avoid possible land-use changes and interference that can worsen the existing situation, taking into account that these zones are mostly open natural and semi-natural spaces with huge potential for recreation activities.
Table 9.
Land use zones with low retention (with an extension of at least 1 million square meters).
The NBS of this last class are dedicated to landscaping that creates normally dry depression areas. These are devoted to recreation activities, except during and immediately following storm events or terrain movements that can direct water flow into storage areas. Among the many NBS, there are:
- Vegetated detention basins, which are a component of the landscape design for public open space determining the topography for green or hard landscaped areas. It can help to increase the effectiveness of sediment settling by slowing flow across the basin. They can also have a permanent pond that acts as a wetland, with additional surrounding landscaped banks that provide extra storage capacity during rainfall events.
- Stormwater ponds and wetlands created by excavating an existing natural depression or through the construction of embankments provide run-off quantity control. They have a permanent presence of water where the rain volumes captured by conduits, canals, or trenches can be harvested to be controlled and regulated, while limiting the surface erosion, increasing the biodiversity, and facilitating the fruition of semi-natural vegetated spaces. These measures are extremely efficient when projected in large natural or semi-natural environments to store a large amount of water volume.
- Bioslopes, which are permeable linear slopes that allow stormwater run-off to infiltrate and filter through the material before exiting through an underdrain. They are considered a low-impact development (LID) strategy [53] used to reduce stormwater run-off. Bioslopes provide a run-off reduction volume between 50% and 25%, depending on the hydrologic soil types [56].
- Urban forests: natural and semi-natural spaces could be involved by planting new trees, shrubs, and other native vegetation in previously disturbed areas, considering the greater infiltration capacity of soils under forests to store run-off and for aquifer recharge. Urban forests also have a moderate ability to slow run-off depending on the texture of the soil, having higher porosity and organic matter content than soils underlying other land cover types.
One can expect that combining these solutions can increase the retention from 98% to 100% of the total rain volume in these land use zones, which corresponds to additional retention between 2 and 2.2 L per square meter. It is expected that with this improvement, the total run-off volume in these districts can be reduced by 105,685 cubic meters (during a single rain event of 50 mm).
4. Discussion
4.1. Validation
Directive 2007/60/EC, which is entitled “Flood Directive”, established a framework on the assessment and management of flood risk, aiming at the “reduction of the adverse consequences of floods for human health, environment, cultural heritage, and economic activities” (article 1). The directive requires all EU Member States to prepare flood risk management plans, including flood hazard and flood risk maps, considering every aspect of the flood risk such as prevention, protection, and preparedness, including flood forecast and early warning systems.
During the directive implementation process, various documents were adopted and promoted, also introducing the climate change impacts on flooding risk, such as the “Flood Risk Assessment, specific requirement on and climate change” (a preliminary report was released in December 2018, while the deadline for the final version is settled for December 2021; more information is available at https://ec.europa.eu/environment/water/flood_risk/implem.htm, accessed on October 10 2020).
Among the possible measures to reduce the negative impacts of floods, there is the use of
“effective solutions which work with nature, rather than against it, are becoming more important than ever. Flood risk management can go hand in hand with nature protection and restoration and deliver benefits for both people and nature. Measures which improve the storage capacities of floodwater temporarily during flood events, can be effective in protecting against flooding, as well as also provide other benefits deriving from ecosystem services, such as for leisure activities and nature protection” (https://ec.europa.eu/environment/water/flood_risk/better_options.htm, accessed on 10 October 2020).
Therefore, the implementation of NBS is fostered to reduce territorial vulnerability to flood risk to regulate the flow and transport of water. In the directive, there are no quantitative reduction targets of flood risk or proposed methodology for the use of NBS for flood risk management.
Within this framework, and considering the Flood Directive aims, an estimate of the possible contribution of NBS (and SUDS) to control and management of flood risk is provided by simulating the biophysical impact derived by the widespread implementation of the strategies (Section 3.2), and assuming the target of 2% as an increase of the retention capacity of rainwater. This assumption is an exercise aiming to quantify the benefits of NBS in terms of water regulation and, specifically, flood control, giving evidence of the reduction of run-off process and the increase of retention. The method could be used to determine a quantitative reduction target and the NBS necessary to reach it.
To simulate this scenario, the curve numbers for the hydrologic soil group was adjusted in the sensitivity table (model input), reducing the RCN table values by 2% in each land use/land cover (while leaving identical all the other inputs and the quantity of rain). The results showed the following changes:
As shown in Table 10, the mean retention index of the city increases by 0.059, shifting from 0.48 to 0.53. The total water retention volume increases by 382,321 cubic meters. In relative terms, the retention per hectare increases by 29.41 cubic meters (from 239 to 268 cu.m./ha). The obtained run-off reduction exceeds 11%, demonstrating that the widespread implementation of NBS can substantially upgrade the city’s biophysical retention capacity. This result can be considered a theoretical reference threshold for evaluating a resilient strategy for the city against cloudburst events.
Table 10.
Simulation of the biophysical impact of NBS in the Land Use Plan of Turin.
4.2. Future Research Development
The research conducted is not without limitations, and various new fields of study could be investigated starting with the assumptions and results presented in this research.
First of all, as declared in Section 2.2, “Model Input”, the biophysical quantification is based on a parametric application of the run-off curve number associated with the hydraulic conductibility of soil. If compared with other more specific models that use different variables, this study has the limit of underestimating the effect of horizontal and vertical surfaces on water discharge, but has the advantage of approximating the run-off volume to large-scale catchments by using few variables. For the purpose of this study, and in general of the ES framework applied to urban planning [57,58], models are always used to understand the spatial distribution of criticities/qualities at the urban scale, instead of providing “real” quantifications but in limited areas [59]. This does not mean that ES models cannot be inaccurate (InVEST provide monthly releases of new models to overcome this limit), but that the “real” biophysical study of hydrology conditions should be done by soil scientists and specific experts, using field analysis in limited test sites by evaluating the modelling results against real measures. In this paper, the model has been used to (i) define the priority areas of intervention based on vulnerability analysis, and (ii) simulate a potential benefit derived from the implementation of diffuse NBS in the catchment.
The second limit of this study is that economic issues, both in terms of implementation cost of NBS and of avoided or reduced costs derived by potential damages and losses, are not considered. The paper’s results could be a starting point for future research adding, for example, a cost-benefit analysis for disaster reduction measures or for creating Payment for Ecosystem Services (PES) schemes as a way to pay for the societal benefits of sustainable land management [60]. The different NBS could also be selected depending on the financial resources available or the stakeholders’ willingness to pay.
Furthermore, the temporal scale is not considered for the definition of NBS. The scales can be classified by long-term benefits (decades), seasonal benefits (years), and short-term benefits (hours) [61,62], and can be selected considering the desired benefits.
The temporal scale must also be considered for the administrative and bureaucratic procedures necessary to approve a territorial instrument (plan or program) that includes these contents. Therefore, the incorporation of the flood risk map and NBS in general town plans (and SEA) establishing how they could address the future development strategies of a city by acting on the normative framework of the plan could require a long-term planning process that needs to be taken into account.
Lastly, public involvement and the stakeholder’s engagement in the definition of NBS strategies for flood control is fundamental, and needs to be investigated in detail, defining the ES beneficiaries as those who benefit from and demand ES or who are involved or affected positively by a given environmental or management public policy [62].
5. Conclusions
This research developed and tested the recent Flooding Risk Mitigation model of InVEST while contributing to estimating the potential biophysical effect of a cloudburst event in the metropolitan area of Turin. Flooding vulnerabilities measured in terms of the integration of surface run-off have been spatially mapped. Vulnerability has also been evaluated with the infiltration capacity, which has been spatially mapped by integrating data on land use and soil hydrological conductivity. The biophysical assessment has been analytically compared in the entire catchment, while an in-depth evaluation of the potential adaptation and planning solutions was conducted in Turin.
Results demonstrate that during a cloudburst event such as the one that happened on 17 August 2020, where more than 6.5 million cubic meters of rain fell in less than 1 h, the total volume of the run-off discharge is 3.4 million cu.m., with a measured relative run-off per hectare ranges from 230 to 430 cu.m. per hectare. Therefore, 52% of the rainfall volume (more than half) cannot be retained by the soil, thus creating a pluvial surface stream, generating severe human and public safety problems.
Run-off outputs were then· classified and superimposed with the land use plan to see where and how the adoption of site-specific NBS can reduce the vulnerability of the city. Finally, a simulation of the biophysical effects of NBS was performed to see how the integration of specific adaptation measures against cloudburst events can change the initial run-off volume. Results demonstrate how performance-based planning can aid decision-making with tangible and measurable effect at the city-scale level.
The research shows how a methodology for ES mapping could be functional to set NBS while operationalizing the ES concept for planning purposes. Moreover, the approach used in the paper can make planning decisions oriented towards the performance-based design of urban open spaces (both public and privates), for example, ensuring permeability by using porous pavements, or increasing the quality of vegetations by adding new urban trees and forestry areas, which could enhance the flooding process intercepting and abating run-off during extreme weather events.
Ensuring effective and site-specific NBS is an urgent need to include ES in the planning process, using them to define and set urban design parameters to make cities more resilient to the effects of climate changes. The study was able to provide valid knowledge support for planners and decision-makers in setting NBS using an ES-based approach.
Author Contributions
S.S.: conceptualization, methodology, formal analysis, data curation, writing—original draft; S.R.: conceptualization, methodology, formal analysis, writing—review and editing; C.G.: validation and supervision; A.A.: writing—review and editing, validation, and supervision; G.G.P.: visualization (graphical support). All authors have read and agreed to the published version of the manuscript.
Funding
This research received no external funding.
Institutional Review Board Statement
Not applicable.
Informed Consent Statement
Not applicable.
Data Availability Statement
All input Data for modelling are available in a publicly accessible repository as explained in Section 2.2.
Conflicts of Interest
The authors declare no conflict of interest.
Nomenclature and Abbreviations
AdA—Areas for different activities; BDTRE—Regional topographic geodatabase; ES—Ecosystem Service; EU—European Union; GIS—Geographic Information System; InVEST—Integrated Evaluation of Ecosystem Services and Trade-off; ISPRA—National Superior Institute for Environmental Protection and Research; LID—Low-Impact Development; MP—Mixed-use area; NBS—Nature-Based Solutions; NDVI—Normalized Difference Vegetation Index; NHRLC—National High-Resolution Land Consumption; PES—Payment for Ecosystem Services; R1, R2, R3, R4, R6, R7—Residential areas with different characteristics; RCN—Run-off Curve Number; SEA—Strategic Environmental Assessment; SUDS—Sustainable Urban Drainage Systems; USDA—United States Department of Agriculture.
References
- Rahmati, O.; Darabi, H.; Panahi, M.; Kalantari, Z.; Naghibi, S.A.; Ferreira, C.S.S.; Kornejady, A.; Karimidastenaei, Z.; Mohammadi, F.; Stefanidis, S.; et al. Development of novel hybridized models for urban flood susceptibility mapping. Sci. Rep. 2020, 10, 1–19. [Google Scholar] [CrossRef] [PubMed]
- Bertilsson, L.; Wiklund, K.; Tebaldi, I.D.M.; Rezende, O.M.; Veról, A.P.; Miguez, M.G. Urban flood resilience-A multi-criteria index to integrate flood resilience into urban planning. J. Hydrol. 2019, 573, 970–982. [Google Scholar] [CrossRef]
- IPCC. Climate Change 2014: Impacts, Adaptation, and Vulnerability; Field, C.B., Barros, V.R., Intergovernmental Panel on Climate Change, Eds.; Cambridge University Press: New York, NY, USA, 2014; ISBN 978-1-107-64165-5. [Google Scholar]
- UNISDR EFDRR. Survey on Sendai Framework Implementation in Europe; The United Nations Office for Disaster Risk Reduction: Brussels, Belgium, 2017. [Google Scholar]
- Van Bavel, B.; Curtis, D. Better Understanding Disasters by Better Using History: Systematically Using the Historical Record as One Way to Advance Research into Disasters. Int. J. Mass Emerg. Disasters 2016, 34, 143–169. [Google Scholar] [CrossRef]
- Gill, S.E.; Handley, J.F.; Ennos, A.R.; Pauleit, S. Adapting Cities for Climate Change: The Role of the Green Infrastructure. Built Environ. 2007, 33, 115–133. [Google Scholar] [CrossRef]
- Williams, P.; Hannah, L.; Andelman, S.; Midgley, G.; Araújo, M.; Hughes, G.; Manne, L.; Martinez-Meyer, E.; Pearson, R. Planning for Climate Change: Identifying Minimum-Dispersal Corridors for the Cape Proteaceae. Conserv. Biol. 2005, 19, 1063–1074. [Google Scholar] [CrossRef]
- Gencer, E.A. Natural Disasters, Urban Vulnerability, and Risk Management: A Theoretical Overview. Gend. Land Tenure Context Disaster Asia 2013, 582, 7–43. [Google Scholar] [CrossRef]
- Ali, R.; Kuriqi, A.; Kisi, O. Human–Environment Natural Disasters Interconnection in China: A Review. Climate 2020, 8, 48. [Google Scholar] [CrossRef]
- Islam, A.R.M.T.; Talukdar, S.; Mahato, S.; Kundu, S.; Eibek, K.U.; Pham, Q.B.; Kuriqi, A.; Linh, N.T.T. Flood susceptibility modelling using advanced ensemble machine learning models. Geosci. Front. 2021, 12, 101075. [Google Scholar] [CrossRef]
- Diakakis, M.; Deligiannakis, G.; Pallikarakis, A.; Skordoulis, M. Factors controlling the spatial distribution of flash flooding in the complex environment of a metropolitan urban area. The case of Athens 2013 flash flood event. Int. J. Disaster Risk Reduct. 2016, 18, 171–180. [Google Scholar] [CrossRef]
- Rosenzweig, B.; Ruddell, B.L.; McPhillips, L.; Hobbins, R.; McPhearson, T.; Cheng, Z.; Chang, H.; Kim, Y. Developing knowledge systems for urban resilience to cloudburst rain events. Environ. Sci. Policy 2019, 99, 150–159. [Google Scholar] [CrossRef]
- The City of Copenhagen. The City of Copenhagen Cloudburst Management Plan 2012; The city of Copenhagen: Copenhagen, Denmark, 2012; pp. 1–28. Available online: https://en.klimatilpasning.dk/media/665626/cph_-_cloudburst_management_plan.pdf (accessed on 10 September 2020).
- Sharp, R.; Douglass, J.; Wolny, S.; Arkema, K.; Bernhardt, J.; Bierbower, W.; Chaumont, N.; Denu, D.; Fisher, D.; Glowinski, K.; et al. The Natural Capital Project, Stanford University, University of Minnesota, The Nature Conservancy, and World Wildlife Fund, Stanford. VEST User Guide-InVEST 3.8.5.post2+ug.g04b5301 Documentation. 2018. Available online: https://invest-userguide.readthedocs.io/_/downloads/en/3.9.0/pdf/ (accessed on 10 September 2020).
- AbdelRahman, M.A.; Natarajan, A.; Srinivasamurthy, C.; Hegde, R. Estimating soil fertility status in physically degraded land using GIS and remote sensing techniques in Chamarajanagar district, Karnataka, India. Egypt. J. Remote Sens. Space Sci. 2016, 19, 95–108. [Google Scholar] [CrossRef]
- Pappalardo, V.; La Rosa, D.; Campisano, A.; La Greca, P. The potential of green infrastructure application in urban runoff control for land use planning: A preliminary evaluation from a southern Italy case study. Ecosyst. Serv. 2017, 26, 345–354. [Google Scholar] [CrossRef]
- Childers, D.L.; Bois, P.; Hartnett, H.E.; McPhearson, T.; Metson, G.S.; Sanchez, C.A. Urban Ecological Infrastructure: An inclusive concept for the non-built urban environment. Elem. Sci. Anth. 2019, 7, 1–14. [Google Scholar] [CrossRef]
- Grêt-Regamey, A.; Altwegg, J.; Sirén, E.A.; van Strien, M.J.; Weibel, B. Integrating ecosystem services into spatial planning—A spatial decision support tool. Landsc. Urban. Plan. 2017, 165, 206–219. [Google Scholar] [CrossRef]
- Davies, C.; Lafortezza, R. Transitional path to the adoption of nature-based solutions. Land Use Policy 2019, 80, 406–409. [Google Scholar] [CrossRef]
- Fuchs, S.; Keiler, M.; Ortlepp, R.; Schinke, R.; Papathoma-Köhle, M. Recent advances in vulnerability assessment for the built environment exposed to torrential hazards: Challenges and the way forward. J. Hydrol. 2019, 575, 587–595. [Google Scholar] [CrossRef]
- Attard, G.; Winiarski, T.; Rossier, Y.; Eisenlohr, L. Review: Impact of underground structures on the flow of urban groundwater. Hydrogeol. J. 2015, 24, 5–19. [Google Scholar] [CrossRef]
- Exall, K.; Vassos, T. Integrated urban water management: Water use and reuse. In Metropolitan Sustainability; Elsevier: Amsterdam, The Netherlands, 2012; pp. 319–349. [Google Scholar]
- Sjöman, J.D.; Gill, S.E. Residential runoff-The role of spatial density and surface cover, with a case study in the Höjeå river catchment, southern Sweden. Urban. For. Urban. Green. 2014, 13, 304–314. [Google Scholar] [CrossRef]
- Chang, B.; Wherley, B.; Aitkenhead-Peterson, J.A.; McInnes, K.J. Effects of urban residential landscape composition on surface runoff generation. Sci. Total Environ. 2021, 783, 146977. [Google Scholar] [CrossRef]
- Xu, C.; Rahman, M.; Haase, D.; Wu, Y.; Su, M.; Pauleit, S. Surface runoff in urban areas: The role of residential cover and urban growth form. J. Clean. Prod. 2020, 262, 121421. [Google Scholar] [CrossRef]
- Brunetta, G.; Salata, S. Mapping Urban Resilience for Spatial Planning—A First Attempt to Measure the Vulnerability of the System. Sustainability 2019, 11, 2331. [Google Scholar] [CrossRef]
- Terryn, E.; Boelens, L.; Pisman, A. Beyond the divide: Evaluation in co-evolutionary spatial planning. Eur. Plan. Stud. 2016, 24, 1079–1097. [Google Scholar] [CrossRef]
- Folke, C. Resilience. Ecol. Soc. 2016, 21, 44. [Google Scholar] [CrossRef]
- Bulkeley, H.; Broto, V.C.; Edwards, G. Bringing climate change to the city: Towards low carbon urbanism? Local Environ. 2012, 17, 545–551. [Google Scholar] [CrossRef]
- Holling, C.S. Understanding the Complexity of Economic, Ecological, and Social Systems. Ecosystems 2001, 4, 390–405. [Google Scholar] [CrossRef]
- Gunderson, L. Ecological and Human Community Resilience in Response to Natural Disasters. Ecol. Soc. 2010, 15, 29. [Google Scholar] [CrossRef]
- Allen, C.R.; Angeler, D.G.; Garmestani, A.S.; Gunderson, L.H.; Holling, C.S. Panarchy: Theory and Application. Ecosystems 2014, 17, 578–589. [Google Scholar] [CrossRef]
- Folke, C.; Carpenter, S.; Elmqvist, T.; Gunderson, L.; Holling, C.S.; Walker, B. Resilience and Sustainable Development: Building Adaptive Capacity in a World of Transformations. Ambio 2002, 31, 437–440. [Google Scholar] [CrossRef]
- Davoudi, S.; Shaw, K.; Haider, L.J.; Quinlan, A.E.; Peterson, G.D.; Wilkinson, C.; Fünfgeld, H.; McEvoy, D.; Porter, L. Resilience: A Bridging Concept or a Dead End? “Reframing” Resilience: Challenges for Planning Theory and Practice Interacting Traps: Resilience Assessment of a Pasture Management System in Northern Afghanistan Urban Resilience: What Does it Mean in Planning Practice? Resilience as a Useful Concept for Climate Change Adaptation? The Politics of Resilience for Planning: A Cautionary Note. Plan. Theory Pr. 2012, 13, 299–333. [Google Scholar] [CrossRef]
- Pede, E.C. Planning for Resilience, New Paths for Managing Uncertainty; Springer: Berlin, Germany, 2020; ISBN 978-3-030-17262-6. [Google Scholar]
- Doost, D.M.; Buffa, A.; Brunetta, G.; Salata, S.; Mutani, G. Mainstreaming Energetic Resilience by Morphological Assessment in Ordinary Land Use Planning. The Case Study of Moncalieri, Turin (Italy). Sustainability 2020, 12, 4443. [Google Scholar] [CrossRef]
- Giaimo, C.; Barbieri, C.A.; Salata, S. Ecosystem Services Based Approach for Participatory Spatial Planning and Risk Management in a Multi-Level Governance System. In Resilient Cities; Springer: Berlin/Heidelberg, Germany, 2018; pp. 59–74. [Google Scholar]
- Gölz, S.; Schinke, R.; Naumann, T. Assessing the effects of flood resilience technologies on building scale. Urban. Water J. 2013, 12, 30–43. [Google Scholar] [CrossRef]
- USDA-United States Department of Agriculture Hydrology Training Series. Module 104: Runoff Curve Number Computations. Study Guide. In USDA-United States Dep. Agric.; 1989; Module 104 Study Guide. Available online: https://www.wcc.nrcs.usda.gov/ftpref/wntsc/H&H/training/runoff-curve-numbers1.pdf (accessed on 12 July 2020).
- USDA-United States Department of Agriculture. S.S.D.S. Soil Survey Manual; USDA Handbook 18; Government Printing Office: Washington, DC, USA, 2017. [Google Scholar]
- Borgogno-Mondino, E.; Fabietti, G.; Ajmone-Marsan, F. Soil quality and landscape metrics as driving factors in a multi-criteria GIS procedure for peri-urban land use planning. Urban. For. Urban. Green. 2015, 14, 743–750. [Google Scholar] [CrossRef]
- European Commission. Towards an EU Research and Innovation policy agenda for Nature-Based Solutions & Re-Naturing Cities; Publications Office of the European Union: Luxembourg, 2015; ISBN 978-92-79-46051-7. [Google Scholar]
- Maes, J.; Jacobs, S. Nature-Based Solutions for Europe’s Sustainable Development. Conserv. Lett. 2017, 10, 121–124. [Google Scholar] [CrossRef]
- Davis, M.; Naumann, S. Making the Case for Sustainable Urban Drainage Systems as a Nature-Based Solution to Urban Flooding. In Urban Sustainability Transitions; Springer: Berlin/Heidelberg, Germany, 2017; pp. 123–137. [Google Scholar]
- Matthews, T.; Lo, A.Y.; Byrne, J.A. Reconceptualizing green infrastructure for climate change adaptation: Barriers to adoption and drivers for uptake by spatial planners. Landsc. Urban. Plan. 2015, 138, 155–163. [Google Scholar] [CrossRef]
- Watkin, L.J.; Ruangpan, L.; Vojinovic, Z.; Weesakul, S.; Torres, A.S. A Framework for Assessing Benefits of Implemented Nature-Based Solutions. Sustainability 2019, 11, 6788. [Google Scholar] [CrossRef]
- Ihobe Environmental Management Agency. Nature-Based Solutions for Local Climate Adaptation in the Basque Country; Ihobe, Environmental Management Agency, Ministry of the Environment, Territorial Planning and Housing—Basque Government: Bilbao, Spain, 2017; Available online: http://growgreenproject.eu/wp-content/uploads/2018/05/NBS-Climate-Adaptation-Basque-Country.pdf (accessed on 14 May 2020).
- Woods Ballard, B.; Wilson Udale-Clarke, H.; Illman, S.; Scott, T.; Ashley, R.; Kellagher, R. The SuDS Manual; CIRIA: London, UK, 2015. [Google Scholar]
- URBAN GreenUP. New Strategy for Renaturing Cities through Nature-Based Solutions Climate Change Challenge Catalogue; Periodic Reporting for period 2—URBAN GreenUP: Bruxelles, Belgium, 2018; Available online: https://cordis.europa.eu/project/id/730426/reporting (accessed on 10 September 2020).
- Mentens, J.; Raes, D.; Hermy, M. Green roofs as a tool for solving the rainwater runoff problem in the urbanized 21st century? Landsc. Urban. Plan. 2006, 77, 217–226. [Google Scholar] [CrossRef]
- Dürr, A. Dachbegrünung. Ein ökologischer Ausgleich. Umweltwirkungen, Recht, Förderung; Bauverlag: Berlin, Germany, 1995; ISBN 9783762532385. [Google Scholar]
- Li, Y.; Huang, Y.; Ye, Q.; Zhang, W.; Meng, F.; Zhang, S. Multi-objective optimization integrated with life cycle assessment for rainwater harvesting systems. J. Hydrol. 2018, 558, 659–666. [Google Scholar] [CrossRef]
- UACDC-University of Arkansas Community Design Center LID. Low Impact Development, A Desing Manual for Urban Areas; Fay Jones School of Architecture; University of Arkansas Press: Fayetteville, AK, USA, 2010; p. 55. ISBN 9780979970610. [Google Scholar]
- Armson, D.; Stringer, P.; Ennos, A. The effect of street trees and amenity grass on urban surface water runoff in Manchester, UK. Urban. Green. 2013, 12, 282–286. [Google Scholar] [CrossRef]
- AECOM, Atlanta regional Commission, Center for Watershed Protection, Center Forward, Georgia Environmental Protection Division, and Mandel Design. Stormwater Management Manual. 2016. Available online: http://documents.atlantaregional.com/gastormwater/GSMM_2016%20EDITION_FINAL_V1.pdf (accessed on 14 May 2021).
- BenDor, T.K.; Spurlock, D.; Woodruff, S.C.; Olander, L. A research agenda for ecosystem services in American environmental and land use planning. Cities 2017, 60, 260–271. [Google Scholar] [CrossRef]
- Langemeyer, J.; Gómez-Baggethun, E.; Haase, D.; Scheuer, S.; Elmqvist, T. Bridging the gap between ecosystem service assessments and land-use planning through Multi-Criteria Decision Analysis (MCDA). Environ. Sci. Policy 2016, 62, 45–56. [Google Scholar] [CrossRef]
- Salata, S.; Garnero, G.; Barbieri, C.A.; Giaimo, C. The Integration of Ecosystem Services in Planning: An Evaluation of the Nutrient Retention Model Using InVEST Software. Land 2017, 6, 48. [Google Scholar] [CrossRef]
- Balmford, A.; Rodrigues, S.I.; Walpole, M.; ten Brink, P.; Kettunen, M.; Braat, L.; Groot, R.S. The Economics of Biodiversity and Ecosystems: Scoping the Science; University of Cambridge: Cambridge, UK, 2008. [Google Scholar]
- Zhang, W.; Li, W.; Zhang, C.; Ouimet, W.B. Detecting horizontal and vertical urban growth from medium resolution imagery and its relationships with major socioeconomic factors. Int. J. Remote Sens. 2017, 38, 3704–3734. [Google Scholar] [CrossRef]
- Ronchi, S. Ecosystem Services for Spatial Planning. In Innovative Approaches and Challenges for Practical Applications; Green Energy; Springer: Cham, Switzerland, 2018; ISBN 9783319901848. [Google Scholar]
- García-Nieto, A.P.; García-Llorente, M.; Iniesta-Arandia, I.; Martín-López, B. Mapping forest ecosystem services: From providing units to beneficiaries. Ecosyst. Serv. 2013, 4, 126–138. [Google Scholar] [CrossRef]


Publisher’s Note: MDPI stays neutral with regard to jurisdictional claims in published maps and institutional affiliations. |
© 2021 by the authors. Licensee MDPI, Basel, Switzerland. This article is an open access article distributed under the terms and conditions of the Creative Commons Attribution (CC BY) license (https://creativecommons.org/licenses/by/4.0/).