Article

Exploring the Use of Polyols, Corn, and Beet Juice for Decreasing the Freezing Point of Brine Solution for Deicing of Pavements

Civil & Environmental Engineering, North Dakota State University, Fargo, ND 58105, USA
*
Author to whom correspondence should be addressed.
Sustainability 2021, 13(11), 5765; https://doi.org/10.3390/su13115765
Submission received: 3 April 2021 / Revised: 4 May 2021 / Accepted: 13 May 2021 / Published: 21 May 2021
(This article belongs to the Special Issue Towards Sustainable Engineering: New Technologies and Methodologies)

Abstract

:
Deicing of pavements is essential to ensure safe and timely movement of traffic in geographical locations where snow and ice events are anticipated. State and local municipalities employ brine solution with 23.3 wt% sodium chloride (NaCl) available in the form of rock salt to deice the pavements. Unlike water, the brine solution does not freeze until the temperature falls below −21.0 °C, i.e., the freezing point of water is depressed by −21.0 °C with the addition of 23.3 wt% NaCl. The depressed freezing point of the brine solution plays a key role in deicing pavements. Unfortunately, a further increase in rock salt content does not lower the freezing point of the brine solution. In this study, different combinations of agricultural products such as polyols including sorbitol, maltitol, and mannitol in brine (23.3 wt% of NaCl in water), and NaCl-juice (corn and beet juice) were investigated to achieve freezing point depressions below −21.0 °C for potential deicing applications in extremely cold areas. Different weight fractions of polyols-brine solutions ranging from 7.14% to 27.77% were considered, and corresponding freezing points were determined. While the sorbitol-brine solution exhibited the lowest freezing point of −38.1 °C at a higher concentration, the maltitol-brine solution exhibited a freezing point of −35.6 °C at the same concentration. Based on the °Brix value, beet juice had almost three times more soluble solids and a lower freezing point compared to corn juice. Adding 23.3 wt% of NaCl in 70% corn juice lowered the freezing point up to −23.5 °C.

1. Introduction

Snow and icy pavements disrupt the smooth flow of traffic, rendering the traffic network dysfunctional [1,2]. They not only result in heavy economic losses but also cause discomfort to the public and sometimes even loss of life. For instance, commercial vehicle operators lose about 32.6 billion driving hours each year (equivalent to USD 2.2 to USD 3.5 billion) due to the traffic delays caused by bad road conditions [3]. According to United States Federal Highway Administration (FHWA), about 10%, 8%, and 9% of weather-related crashes that occurred between the years 2005 and 2014 were attributed to snow/sleet, ice, and snow/slush on pavements, respectively [4]. Therefore, to minimize traffic delays and to avoid crashes/fatalities during winter months, the local and state bodies constantly perform maintenance routines. The maintenance routines generally include the improvement of the pavement surface by either deicing the pavement after a snow event or by adding anti-icing agents to the pavements before a snow event. While deicing is regarded as the process of removing snow, frost, or ice from the surface of the pavement by melting/plowing, anti-icing is the process of delaying the formation of ice or its adhesion to the surface by applying chemical/abrasive agents to the surface of the pavements [5]. Examples of some commonly used deicers and anti-icing chemicals include sodium chloride, magnesium chloride, calcium chloride, calcium magnesium acetate, potassium acetate, and sodium acetate [6].
Deicers fundamentally works by depressing the freezing point of water. For instance, when chloride-based salt comes in contact with the surface of ice crystals, water molecules on the surface of the ice readily react with the salt to form a thin layer of salty water that contains chloride ions [7]. This reaction is facilitated by the presence of loosely bonded, unstable, and mobile water molecules on the surface of the ice. The freezing temperature of the salt solution is lower than the freezing point of pure water as the salt molecules hinder the formation/growth of ice crystals [7]. The process of ice melting is further accelerated as salt water spreads on the ice surface occupying more surface area and melting more ice. Salt/sodium chloride (NaCl) is often preferred by many state and local bodies as a deicer considering the low cost and abundant availability. In general, 23.3 wt% of NaCl is mixed with water and sprayed on pavements. At this weight percentage, brine solution (NaCl + water) does not become ice until −21 °C (also referred to as freezing point depression) and, hence, is preferred when the temperatures of the cold regions are within this temperature [5]. However, when the temperature falls below −21 °C during the winter months, the brine solution is no more effective in deicing the pavement. Although there are other chloride/acetate-based salts that have freezing point depression values below −21 °C, they are either expensive and/or possess serious disadvantages [5,6]. Therefore, an attempt was made in this study to enhance the freezing point depression of brine solution that could be suitable for deicing pavements in extremely cold places that constantly experience temperatures below −21 °C during the winter months.
In this study, polyols and agricultural products were employed to explore their role in enhancing the freezing point depression of brine solution. Polyols were found to improve the ice-melting capacity of salt-brine and drastically cut down the corrosion in automobiles in recent studies conducted by the authors [8,9]. Polyols are chemical compounds that contain three or more hydroxyl groups [10]. Sorbitol, mannitol, maltitol, lactitol, xylitol, and erythritol are examples of some of the polyols that are commonly available in the market. These polyols have been generally used to regulate the physical properties of frozen foods in the food industry, where the freezing point depression was one of the properties that played a vital role. The freezing point depression of polyol-aqueous solutions generally depends on the polyol weight fraction, which was investigated by Uraji et al. [11] for sorbitol, maltitol, lactitol, xylitol, and hydrogenated corn syrup. Four different weight fractions of the polyol-aqueous solution, 30%, 40%, 50%, and 60%, were considered, and the freezing point depression was evaluated. With an increase in the weight fraction of the polyol, the freezing point was reported to decrease. The magnitude of the freezing point depression of sorbitol, maltitol, lactitol, xylitol, and hydrogenated syrup were determined to be −20 °C, −14 °C, −14.5 °C, −25 °C, and −11 °C, respectively, at a higher weight fraction of 60%. Besides polyols, there have been many reports encouraging the utilization of beet juice and agricultural products as a potential deicer [12,13,14,15,16,17].
The goal of the current study was to explore the role of two different categories of materials, namely polyols and raw agricultural products, on the freezing point depressions of brine solution for transportation applications. Specifically, the following three polyols along with two agricultural products were explored in this study: polyols—sorbitol, maltitol, and mannitol; and agricultural products—corn juice and beet juice. The objectives of this study were (1) to investigate the influence of different weight fractions of polyols on the freezing point depression of brine solution, and (2) to investigate the influence of different weight fractions of sodium chloride on the freezing point depression of corn and beet juice. To this end, different types of aqueous solution samples were prepared in this study (1) for varying the weight fractions of polyols in the brine solution, and (2) for varying the weight fractions of sodium chloride in corn/beet juice, and the freezing point depressions tests were carried out. The rest of the manuscript was organized as follows: the procedure for sample preparation and the experimental setup was provided in Section 2, a description of a typical freezing point depression curve was provided in Section 3. The results of the experiments were discussed in Section 4, and conclusions of the study were listed in Section 5.

2. Experimental Study

In this section, the details of the materials that were employed to enhance the freezing point depression of brine solution were provided, and the procedure adopted for the preparation of the aqueous solution samples was described. In addition to this, the in-house experimental setup that was employed to measure the freezing point depression of the aqueous solutions was described, and the procedure adopted to perform the test was elaborated.

2.1. Materials

Three different polyols and two different agricultural products were employed in this study to investigate their influence on the freezing point depression of brine solution. While all the three polyols, namely sorbitol, maltitol, and mannitol, were acquired from a commercial supplier in the United States, corn and beet were acquired from local farmers in Fargo, North Dakota (USA). The chemical structures and the physio-chemical properties of all three polyols are presented in Figure 1 and Table 1, respectively. While both sorbitol and mannitol were observed to have similar molecular weights, the solubility of the former polyol was higher than the latter one. Among all the three polyols that were chosen in this study, maltitol had higher molecular weight, and mannitol had the lowest solubility. Unlike polyols, the physio-chemical properties of the corn and beet juices were not available in the literature. However, the sugar content/soluble solids of these two agricultural products was of interest in the context of the current study and were measured using the refractometer method. Details of sugar content/soluble solids measurement were provided later in this section.

2.2. Sample Preparation

The procedure adopted to prepare the aqueous solution samples for freezing point depression tests was as follows.

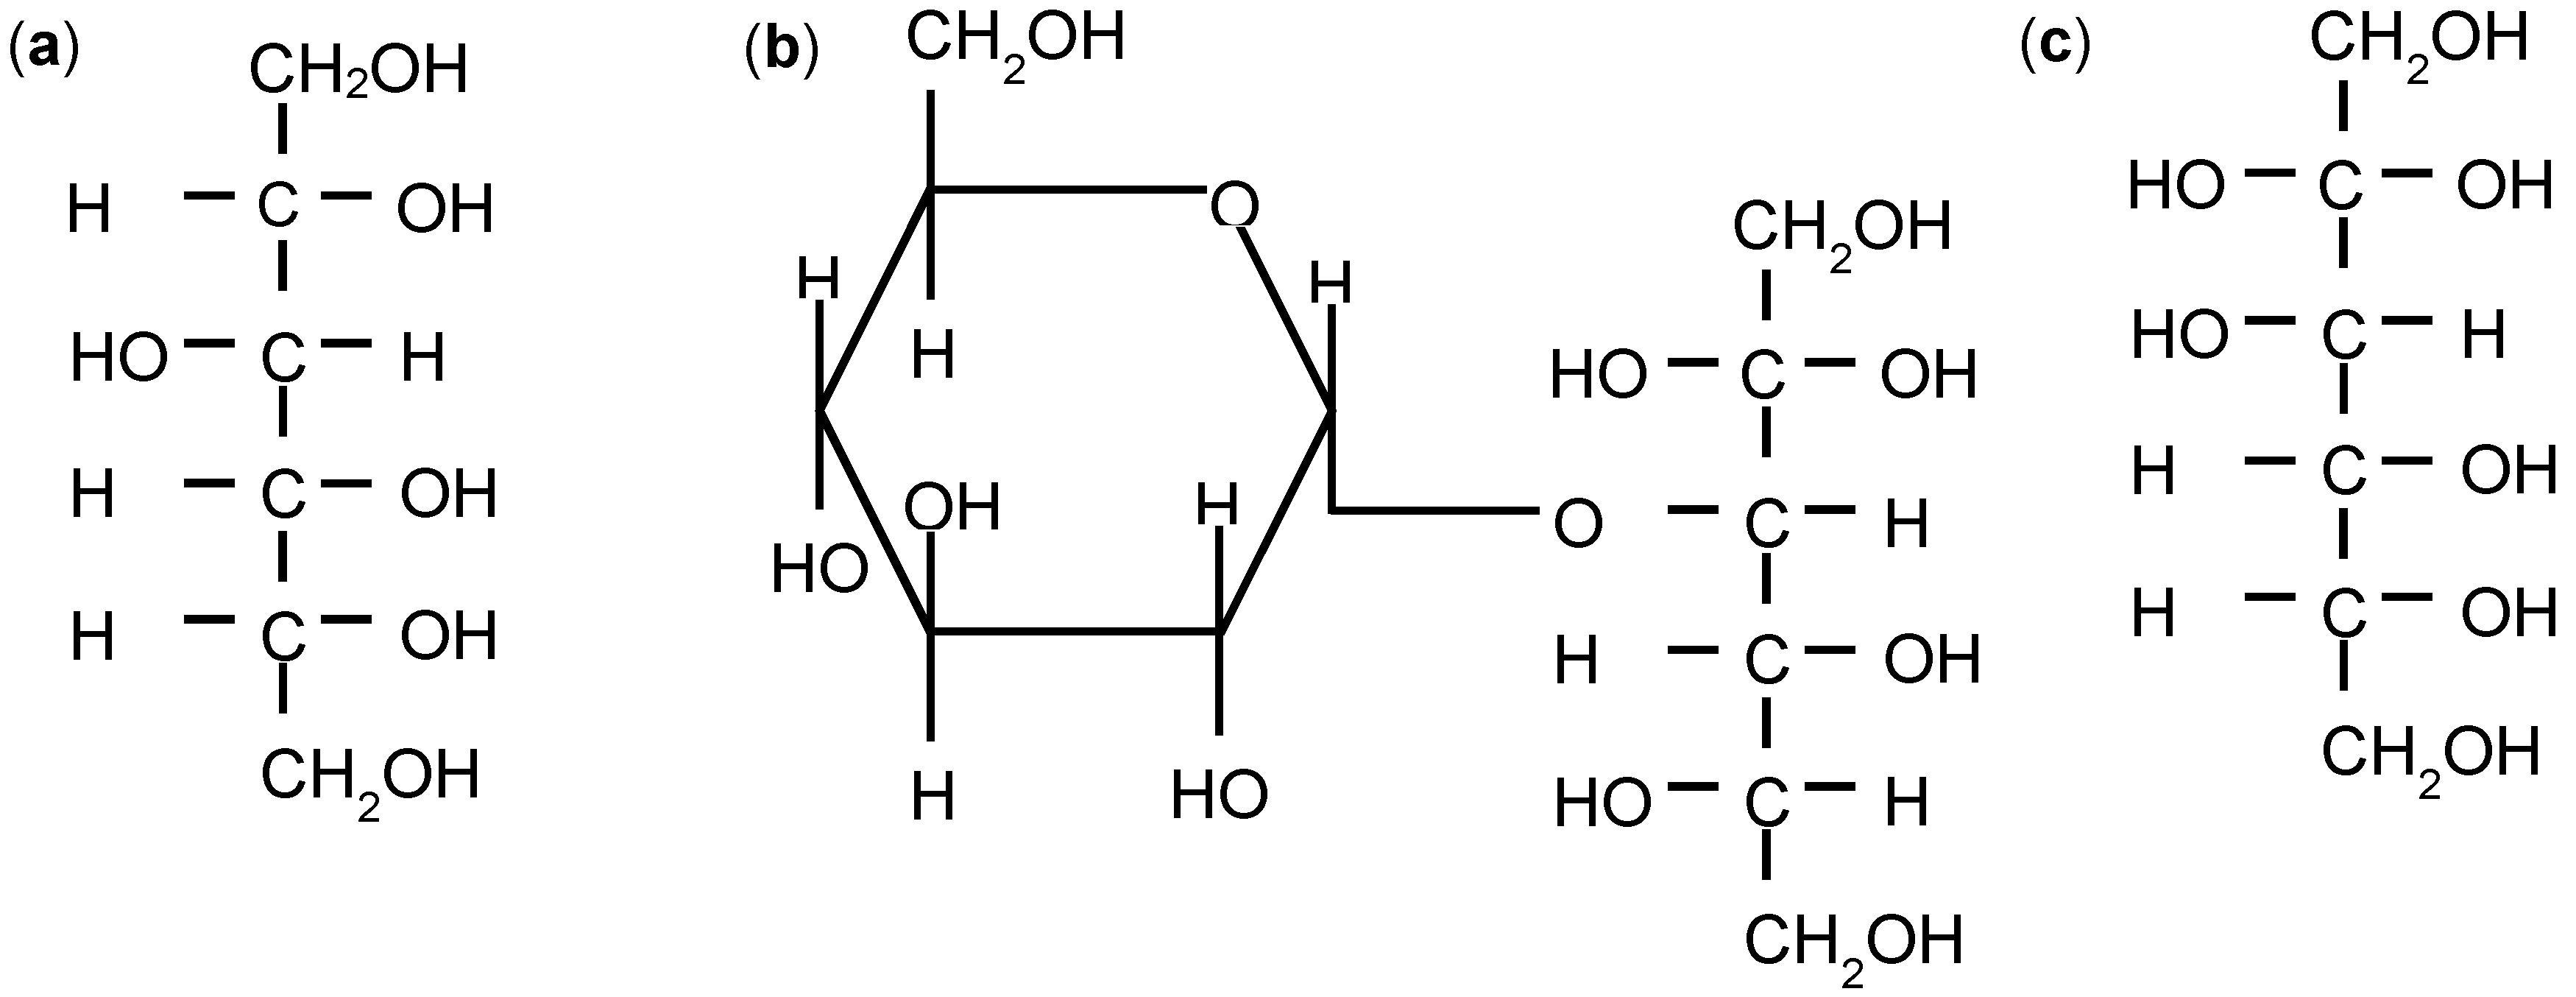
2.2.1. Polyols-Brine Solution

In this study, the following procedure was adopted to prepare an aqueous solution comprising of water, NaCl, and polyol. Firstly, a 23.3 wt% of NaCl or brine solution was prepared by mixing 3 g of NaCl to a glass beaker containing 10 g of water. This weight fraction was considered as the brine solution achieved a maximum freezing point depression (−21.1 °C) at 23.3 wt% [12]. The resulting mix was then continuously stirred for 5 min using a magnetic stirrer at room temperature until the NaCl was completely dissolved. Followed by the preparation of brine solution, a specific weight fraction of a polyol was chosen and was added to the 23.3 wt% of brine solution. The mix was continuously stirred for another 5 min using a magnetic stirrer at room temperature to achieve the complete solubility of polyol in brine. In this study, the weight fraction of polyol was defined as the ratio of the weight of polyol to the weight of combined brine and polyol solution and, the following weights fractions were considered: sorbitol—7.14%, 10.34%, 16.13%, 18.75%, 23.52%, and 27.77%; maltitol—7.14%, 10.34%, 16.13%, 18.75%, 23.52%, and 27.77% and; mannitol—7.14%, 10.34%, and 13.34 %. Weight fractions higher than 13.34% were not considered for mannitol because of its low solubility in a brine solution (see Table 1).

2.2.2. Corn Juice-NaCl Solution

In this study, the following procedure was adopted to prepare an aqueous solution sample comprising of NaCl and corn juice. To obtain the corn juice, first, the dry corn kernels were soaked in the water for 24 h, and this process was referred to as steeping. Depending on the quantity of the soaked corn kernels, different concentrations of corn juice could be achieved. In this study, ten different weights of corn kernels were chosen, which were soaked in 250 g of water (corn steeping). These ten different weights of the corn kernels corresponded to the 5%, 10%, 15%, 20%, 25%, 30%, 40%, 50%, 60%, and 70% of corn kernels to water weight fractions. Followed by 24 h of soaking, the steeped corn was transferred to a commercial blender and ground. The ground mixture was then centrifuged to separate the pulp and the juice. Followed by the extraction of corn juice, a mixture of the corn-juice-NaCl solution was prepared by adding 3 g of NaCl to the 10 g of corn juice.

2.2.3. Beet-Juice-NaCl Solution

In this study, a commercial plunger-type juicer was employed to extract the concentrated beet juice. The raw beets were thoroughly washed before the juice extraction to avoid the presence of dust and other impurities. From the extracted beet juice, different concentration(s) of juice was prepared by diluting it with tap water in an appropriate quantity. In this study, the following four concentrations of beet juice were adopted—20%, 40%, 60%, and 80%. Pure beet juice was diluted with water to obtain these concentrations. For example, adding 2 mL of water to 8 mL of pure beet juice results in 80% beet juice. Similarly, other concentrations of beet juice were obtained by diluting the pure beet juice with water. Followed by the extraction of beet juice, a mixture of beet juice-NaCl solution was prepared by adding 3g of NaCl to the 10g of beet juice.

2.3. Freezing Point Depression Test

In this study, two different types of experimental setups were employed to perform the freezing point depression tests: (1) an in-house experimental setup similar to the one demonstrated in [19,20], and (2) differential scanning calorimetry (DSC).

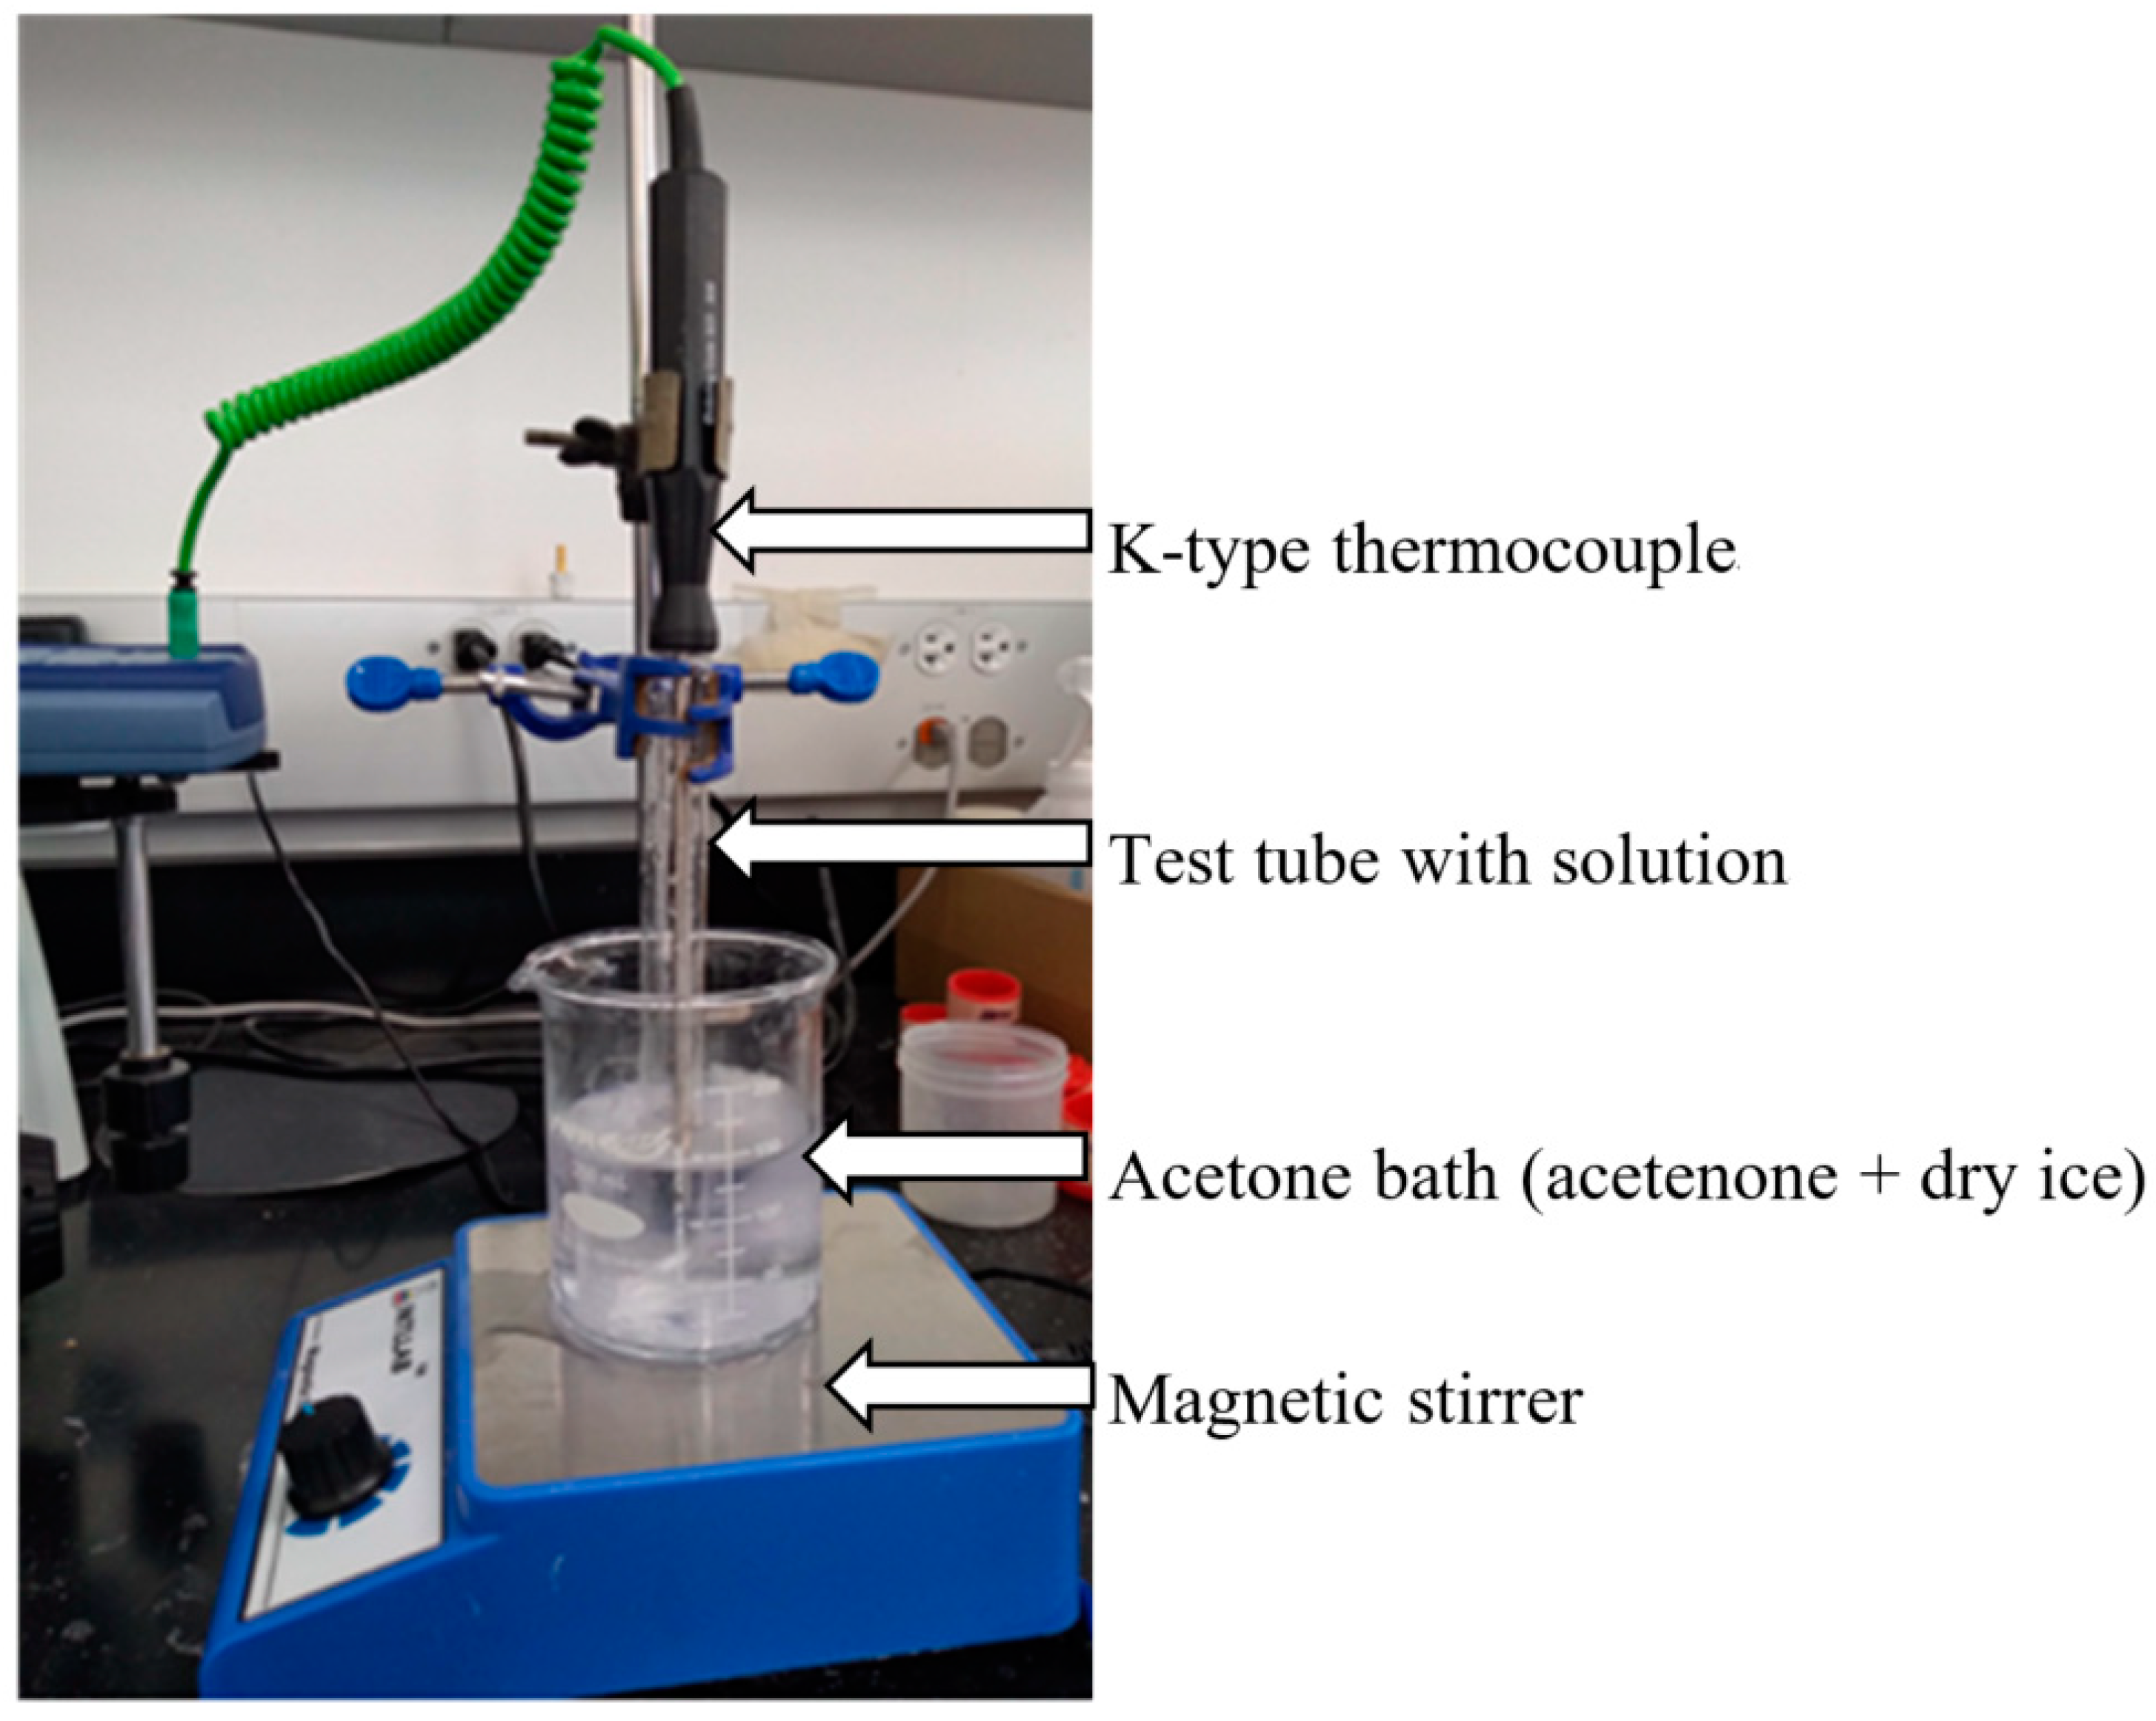
2.3.1. In-House Experimental Setup

An in-house experimental setup was built in this study, which essentially consisted of four major components (see Figure 2): (a) test tube to hold the aqueous solution sample, (b) a K-type thermocouple for measuring the temperature of the solution, (c) a magnetic stirrer to stir the solution sample, and (d) a cooling bath to facilitate the drop in temperature below 0°C in the test tube holding aqueous solution sample. Acetone had a freezing point close to −78 °C, and dry ice was added to the acetone to achieve very low temperatures to serve the purpose of a cooling bath in this study. This setup was used to investigate the freezing point depression of different weight fractions of polyols in brine, and 70% corn juice and pure beet juice had 23.3 wt% of NaCl in it.
To perform the freezing point depression experiment, first, six mL of the sample solution was transferred to a test tube, which was fixed on a vertical stand (see Figure 2). In the next step, a K-type thermocouple was immersed in the sample solution to measure the temperature of the solution. To ensure that a representative temperature of the solution was measured, the thermocouple was positioned at the center of the test tube, i.e., away from the test tube walls. The thermocouple was then connected to a data acquisition system that was obtained from Pico Instruments Inc. The test tube was then gradually lowered into the cooling bath that was maintained at −50 °C, and the temperature of the solution was simultaneously acquired. In this study, the temperature of the sample solution was recorded every 900 milliseconds. Note that the solution was continuously stirred using a magnetic stirrer during the experiment to maintain a homogeneous temperature in the sample solution. The authors also performed the tests by holding multiple thermocouples at various positions in the test tube at the same time, i.e., both horizontally and vertically. It was observed that the temperature distribution was constant in the test tube. Before the deployment of this setup, a series of experiments were performed on brine solution alone that was prepared by adding various weight fractions of NaCl below 23.3 wt% to tap water (see Section 4.1). This exercise was carried out for validation purposes.

2.3.2. Differential Scanning Calorimetry (DSC) Analysis

Differential scanning calorimetry (DSC) is one of the thermo-analytical techniques often used to measure the phase transitions occurring in a material. While a calorimeter measures the heat flow into or out of a sample, a differential calorimeter measures the heat of a sample relative to a reference sample (generally air). For the sake of brevity, the working principle of DSC was not provided in this paper and can be found elsewhere [21]. In this study, the DSC technique was employed to determine the freezing point of corn and beet juice. The freezing temperatures for the following weight fraction(s) of corn 5%, 10%, 20%, 30%, 40%, 50%, 60%, and 70% were determined using DSC. The freezing points for the following beet juice weight fractions: 20%, 40%, 60%, 80%, and 100% were evaluated using DSC. In addition to this, the freezing point of pure beet juice mixed with 23.3 wt% of NaCl was also determined using DSC. This technique was also used to determine the freezing point of high concentration (27.77%) of polyols in brine due to ambiguous results obtained from the in-house experimental setup. For experimentation, the DSC (2920 Modulated DSC, TA Instruments, New Castle, DE, USA) equipment that was available in the Research Park−1 facility at North Dakota State University was used. A Universal Analysis Program (Version 1.11A, TA Instruments, New Castle, DE, USA) was employed to monitor and process the heat flow-temperature curves. Aluminum Hermite sample pans were used for holding the sample during the DSC runs. Solution samples (10–25 mg) were transferred to aluminum DSC pans using a 25 µL syringe and were spread as films using tweezers, and the resulting samples were sealed using Universal Crimper Press. Nitrogen gas (flow rate, 50 mL/min) was used for the cell purge, and helium (flow rate, 150 mL/min) was used for refrigerating the cooling system. The DSC was calibrated at 2 °C/min using indium and water as standards. Two thermal events, namely, the cooling and heating cycle, were carried out on the samples during DSC runs. While the material samples were cooled to temperatures between −30 °C and −60 °C at a rate of −10 °C/min in the cooling cycle, they were heated at a rate of 5 °C/min in the heating cycle to obtain the DSC thermogram.

2.4. Measuring Soluble Solids in Corn and Beet Juice

The quantity of total soluble solids present in corn and beet juices with various weight concentrations was determined using a refractometer. A refractometer was an optical instrument that used the principle of refraction of light to measure the soluble solids in the juice. It provided the °Brix value of the juice, which represented the mass (g) of soluble solids in 100 mL of juice. For instance, a reading of 5 °Brix on the refractometer implied that 5 g of soluble solids were present in 100 g of the juice. In this study, a fresh drop of extracted juice was placed onto the glass slide of the refractometer, and the °Brix reading was recorded. This procedure was repeated for all different concentrations of corn and beet juices.

3. Description of Typical a Freezing Point Depression Curve and DSC Thermogram

In this section, the description of a typical freezing point depression curve of aqueous solutions that were obtained from an in-house experimental setup was provided, and the underlying mechanisms that governed each segment of the curve were briefly described. In addition to this, the description of a typical DSC thermogram of aqueous solutions obtained from DSC experiments was also provided.

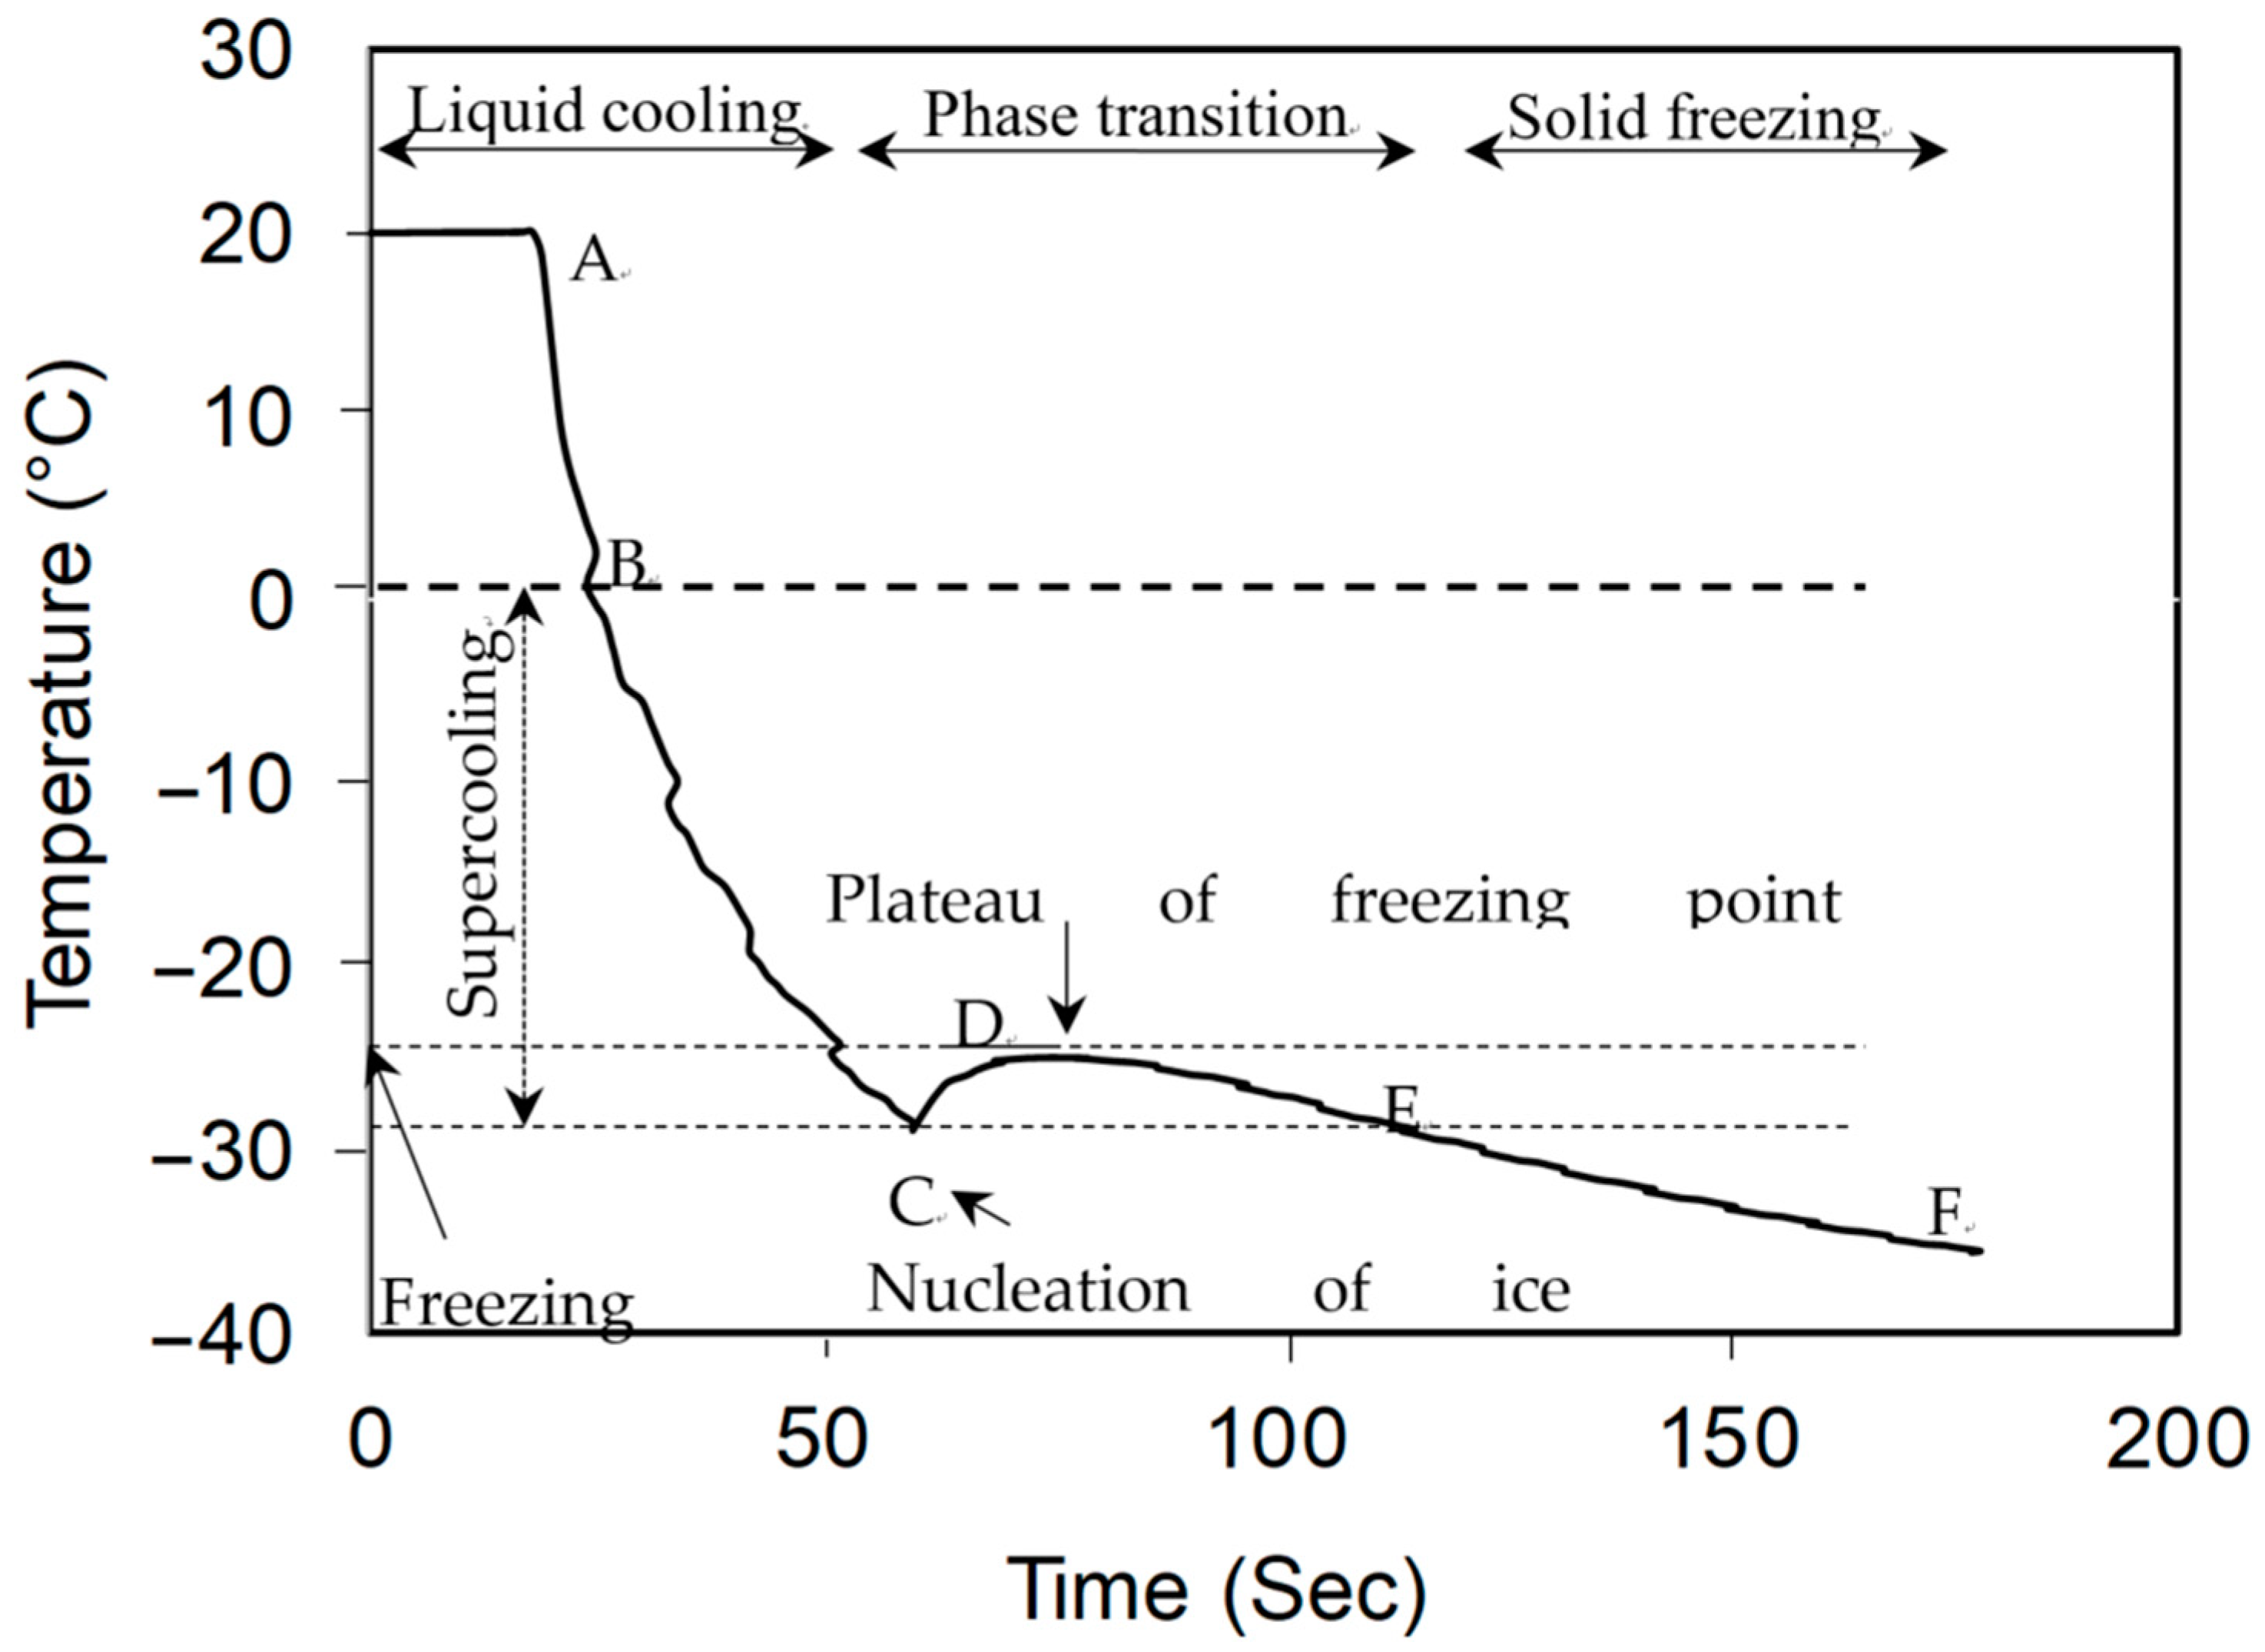
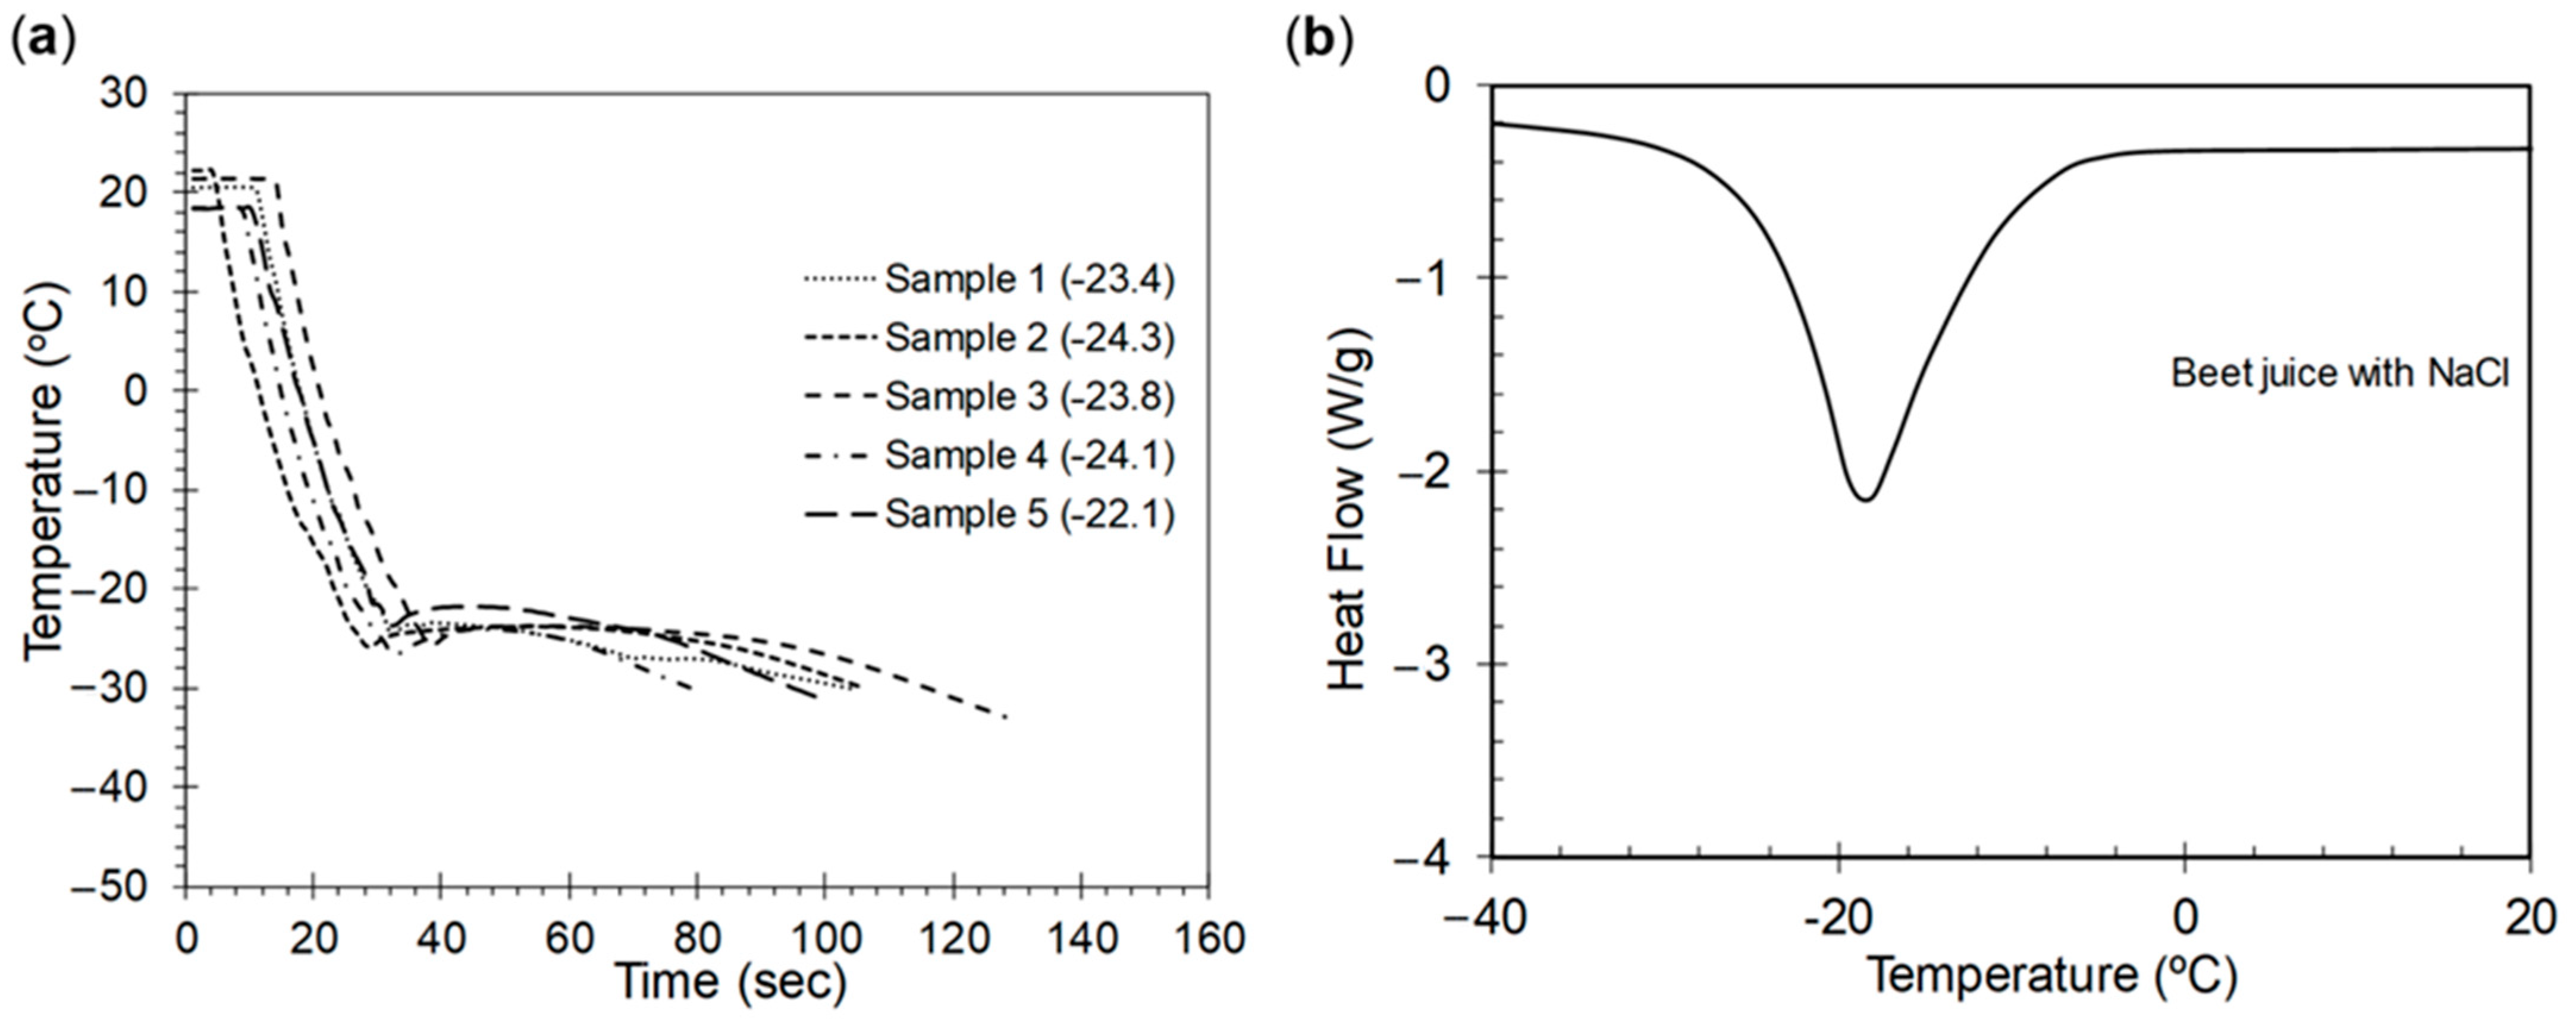
3.1. Freezing Point Depression Curve

In this section, a brief description of a typical freezing point depression curve was provided, which would aid in evaluating the freezing points of aqueous solutions from the in-house experimental setup. The schematic of a typical freezing point depression curve is shown in Figure 3. This curve comprised of three different segments or thermal events, namely (1) cooling period, (2) nucleation propagation and crystallization (also referred to as recalescence), and (3) solid freezing [22]. During the first thermal event, which extended from A to C, the temperature of the aqueous solution dropped continuously, and the sensible heat was released. Sensible heat was the amount of heat absorbed or lost by a substance that resulted in a temperature change in the substance [23]. Consequently, the thermal energy required for the molecular vibrations of the aqueous solution also decreased. While point A represented the room temperature of an aqueous solution and point B represented the freezing point of water (i.e., 0 °C), point C represented the nucleation temperature achieved during cooling of the aqueous solution. Nucleation temperature was the temperature at which the formation of ice crystals began. Note that the solution did not freeze at point B, i.e., at 0 °C and extended up to point C (see Figure 3). This difference in the temperature between point B and C was due to supercooling that occurred before nucleation. Supercooling was the stage in which the aqueous solution was still in a liquid state and was unstable, i.e., the molecules were still in a disorderly state. In other words, the ordered lattice structure required for the formation of ice crystals did not exist in this temperature range. The second event, referred to as nucleation formation, propagation and crystallization occurred from point C to point E. During this stage, nucleation, which had begun at point C, spread throughout the aqueous solution, and crystal growth in the solution occurred until equilibrium was reached (formation of ice). A phase transition from liquid to solid state was observed in this process, which resulted in the release of energy, also referred to as latent heat. Latent heat was the heat required for the phase transition without an increase in temperature [24]. Note that there was a rapid rise in the temperature from C to D, which was attributed to the release of the heat from the crystallizing supercooled water after the start of nucleation [25]. Beyond point D, a horizontal plateau was observed up to point D, which was also referred to as freezing point depression [22]. The third event, referred to as solid freezing, occurred from point E to point F. During this stage, the temperature of the frozen solid could further drop until the temperature of the frozen solid and the temperature of the cooling bath became equal.

3.2. Freezing Point and DSC Thermogram

In this section, a brief description of a DSC thermogram was provided, which aided in the interpretation of the DSC thermograms of aqueous solutions that were obtained from DSC experiments. A schematic of a typical DSC thermogram is shown in Figure 4. This thermogram comprises of two thermal events, namely (1) cooling event and (2) heating event. While the cooling event involved the process of dropping the temperature of the sample to −60 °C and maintaining in isothermal equilibrium for two minutes (see Section 2.3), the heating event involved raising the temperature of the frozen sample gradually to 20 °C. The amount of differential heat absorbed by the sample, with respect to reference material (in general air), as a function of temperature was then recorded by the DSC. In what follows, only the heating event of the thermogram was described in this paper because the current study focused on freezing point determination, which was generally captured during the heating event. During the heating event, an endothermic peak was observed (see Figure 4b). The area under this peak represented the heat absorbed by the frozen sample relative to the reference material in that temperature range. Upon drawing the steepest tangent to the left-hand side of the endothermic peak, an x-intercept was obtained, which represented the melting point. In other words, it represented the temperature at which maximum heat was absorbed with the least change of temperature, i.e., the heat absorbed was consumed primarily for ice-to-water phase transition. Hence the temperature corresponding to this event was the melting point of the sample solution. It should be noted that, in the case of DSC, the melting point was obtained, whereas, in the case of the in-house setup, the freezing point was obtained. This difference could be attributed to the difference in the heating or cooling cycles employed in the experimental process. In the case of the DSC, the frozen samples were heated, whereas the liquid sample solutions were cooled in the case of the in-house setup. However, it was important to note that the freezing points and the melting points obtained from the in-house setup and DSC were numerically equal (i.e., water freezes at 0 °C and ice melts at 0 °C).

4. Results and Discussion

In this section, the calibration process of the in-house experimental setup was described, and the time-temperature cooling curves of various aqueous solutions (see Section 2.2) were interpreted. Additionally, the influence of the weight fractions of polyols, corn, and beet juice on freezing point depressions was discussed.

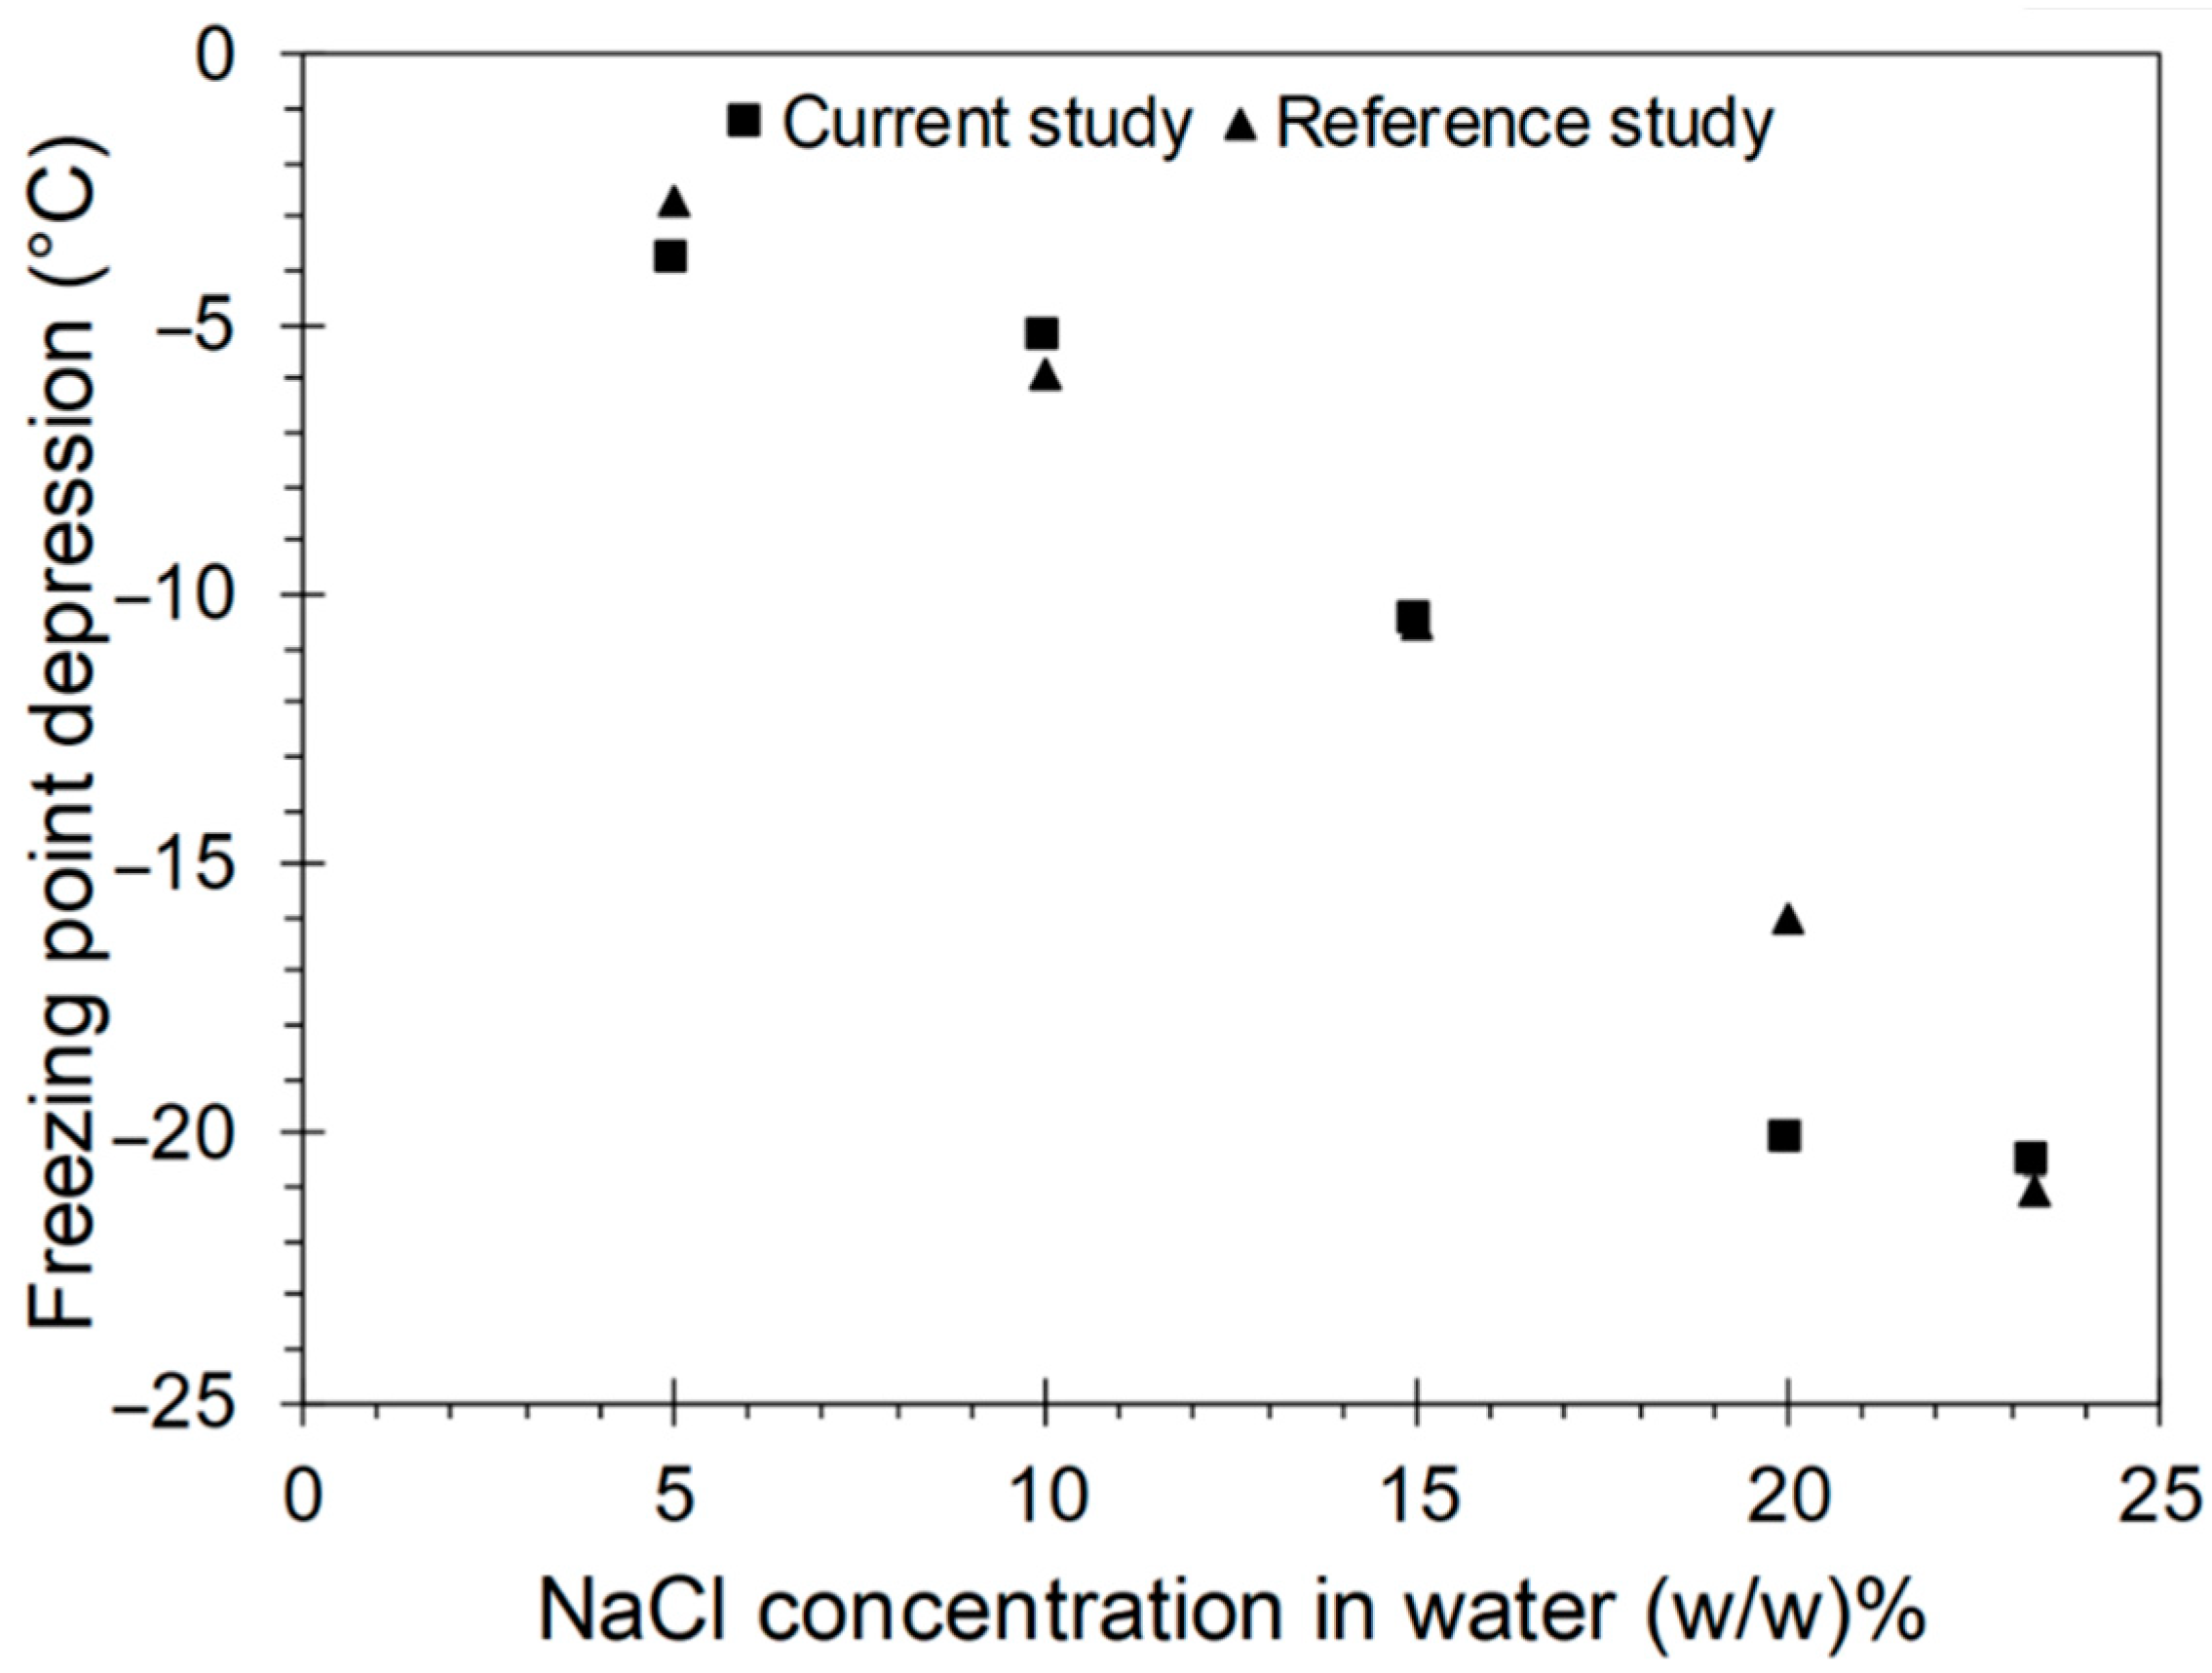
4.1. Validation of the Experimental Setup

Validation of the in-house experimental setup was carried out in this study to ensure the reliability and consistency of results. For this purpose, the brine solution of five different weight concentrations was chosen: 5%, 10%, 15%, 20%, and 23.3%, and the experiments were performed according to the procedure explained in Section 2.3.1. Because the freezing point depressions of brine solution at different weight concentrations had been well-established in the literature [12], NaCl was preferred in this study for the sake of calibration purposes. The time-versus-temperature-cooling curves were obtained for the chosen concentrations of the brine solution (see Section 2.3.1), and the freezing point depressions were evaluated (see Section 3.1). The weight-fraction-versus-freezing point depressions are plotted in Figure 5 and are compared to the values provided by the Federal Highway Administration [12]. From Figure 5, it was evident that the freezing point depression values obtained using an in-house experimental setup matched the values provided by the Federal Highway Administration validating the in-house setup. In this study, the concentration of brine solution beyond 23.3 wt% was not investigated, as it did not depress the freezing point of the brine solution any further [12]. The increase in the freezing point, when the concentration of the brine solution was greater than 23.3 wt%, could be attributed to the reduction in ion disassociation of NaCl in water beyond this concentration [26,27].

4.2. Freezing Points of Polyol-Brine Solutions

The time-versus-temperature-cooling curves of polyol-brine solutions (see Section 2.2.1) were obtained from the experiments, and the results were provided in this section. Further, the freezing points and the influence of weight fractions of polyols in brine solution on freezing points were discussed.

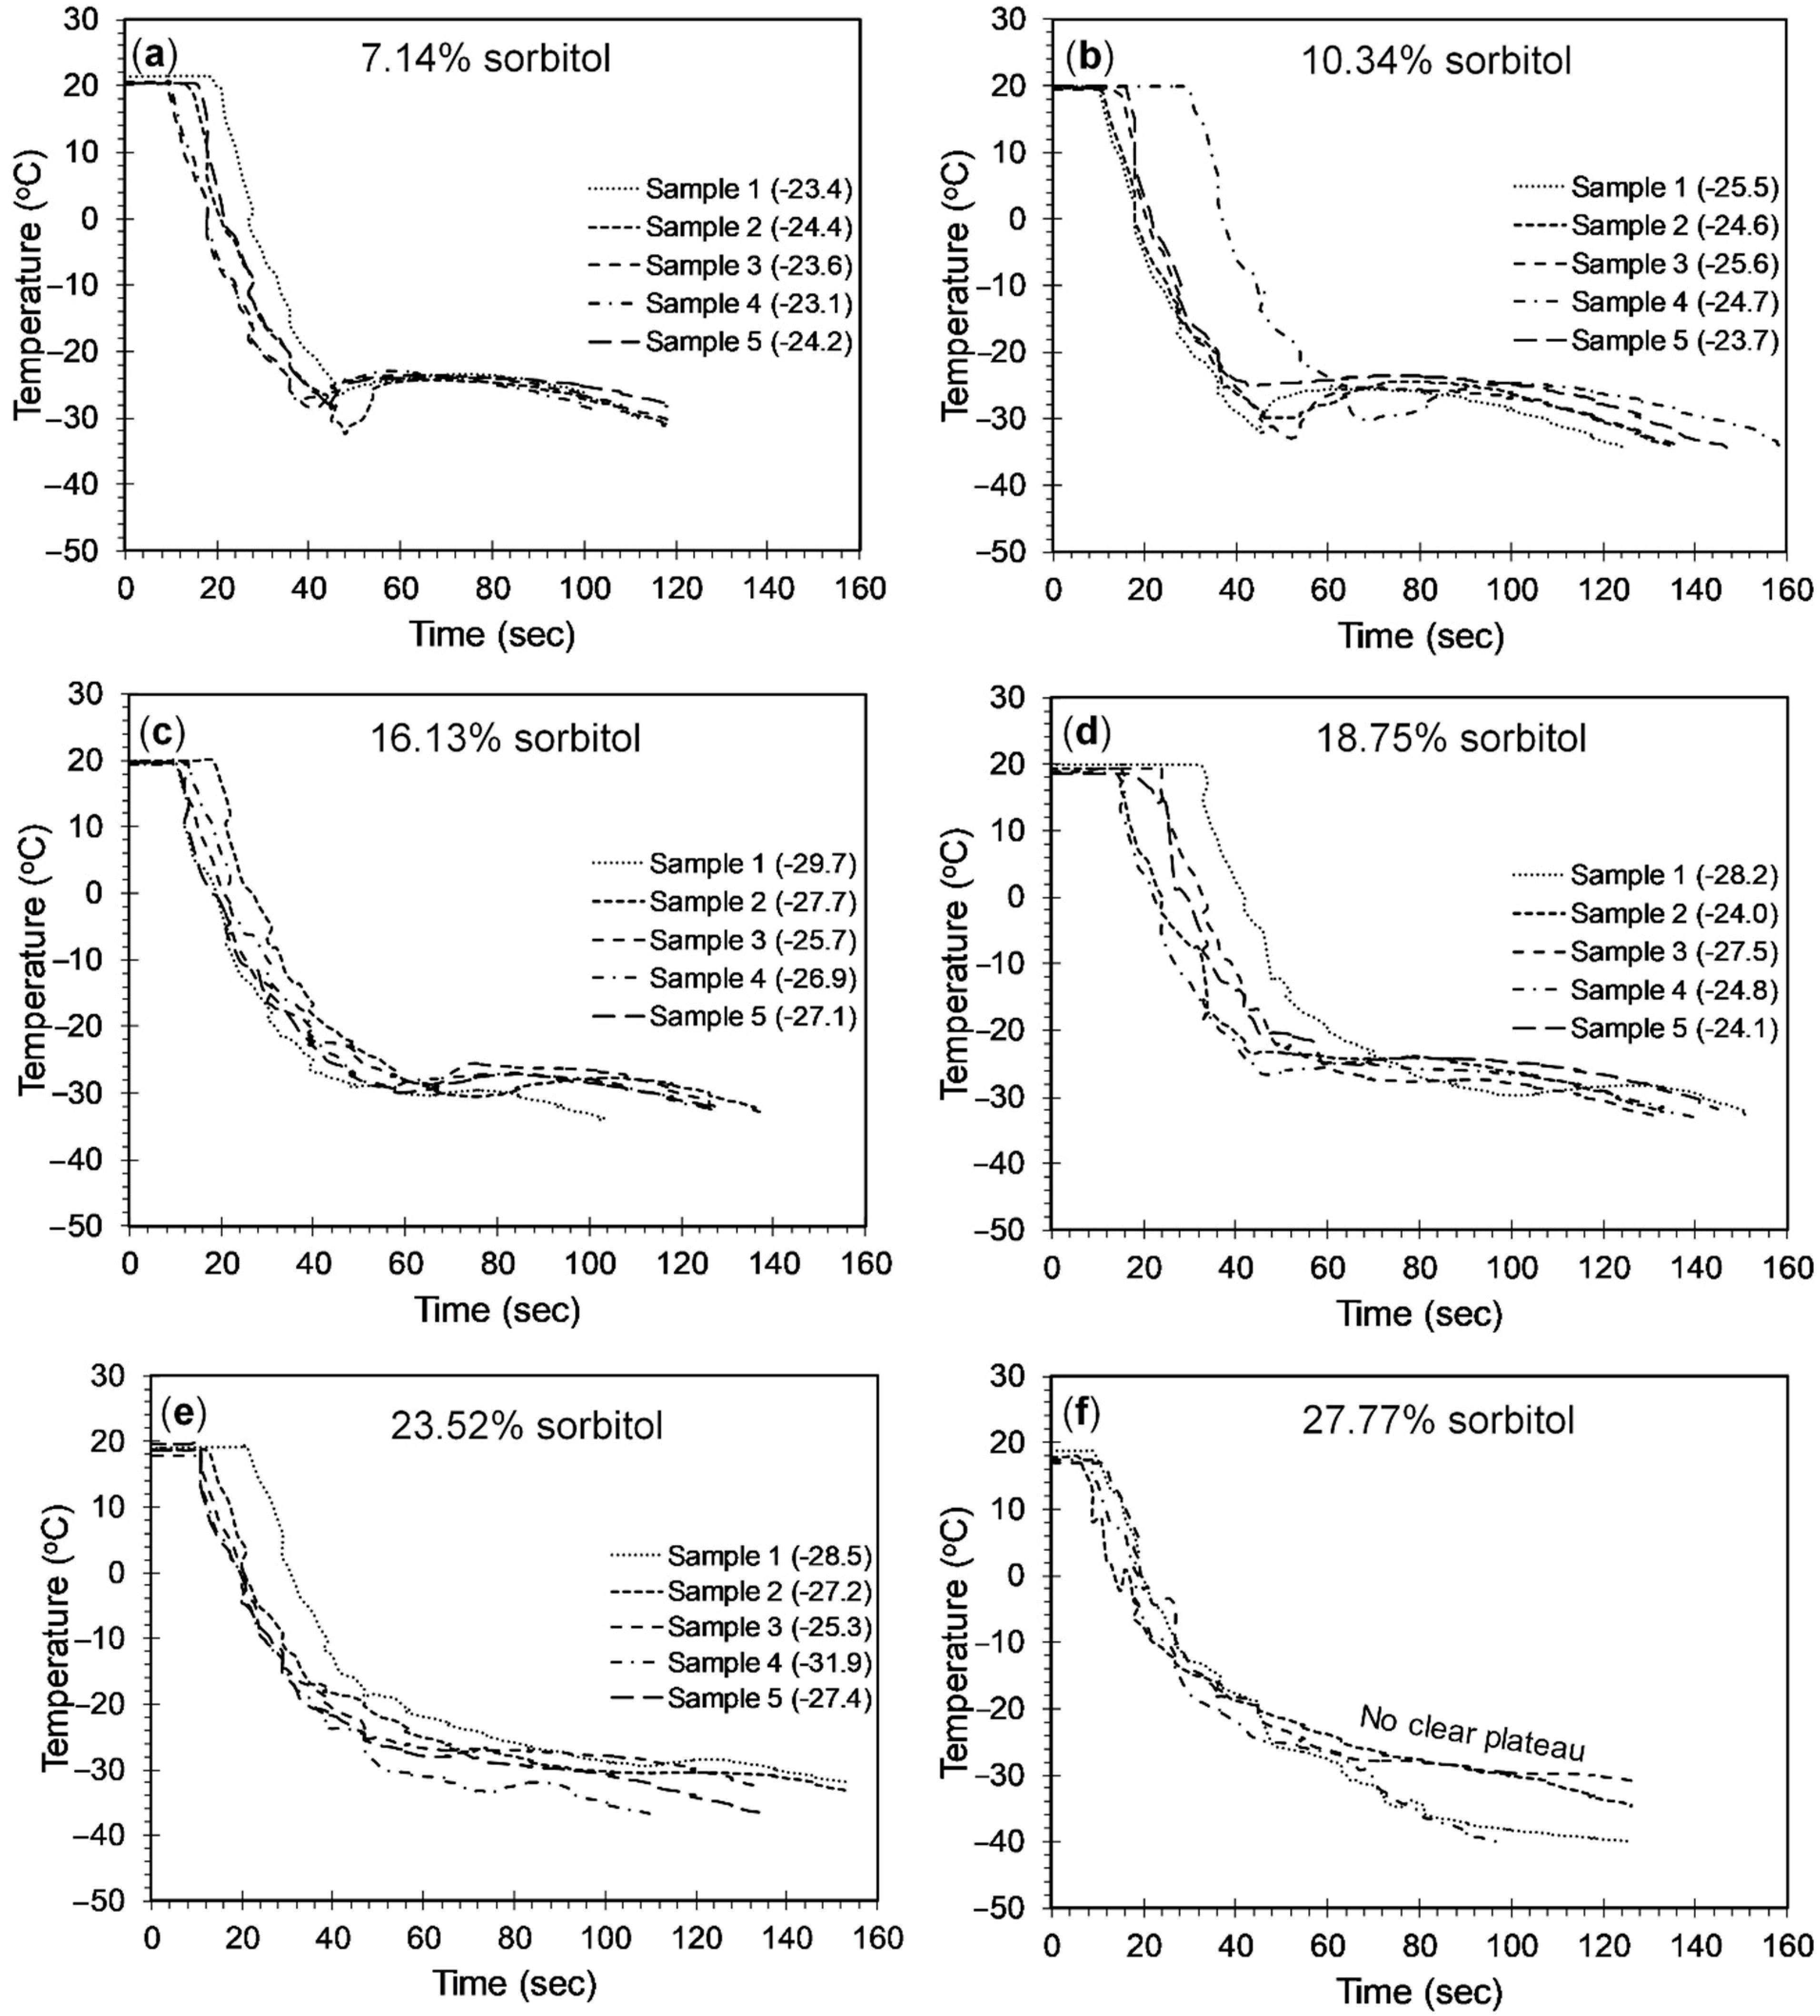
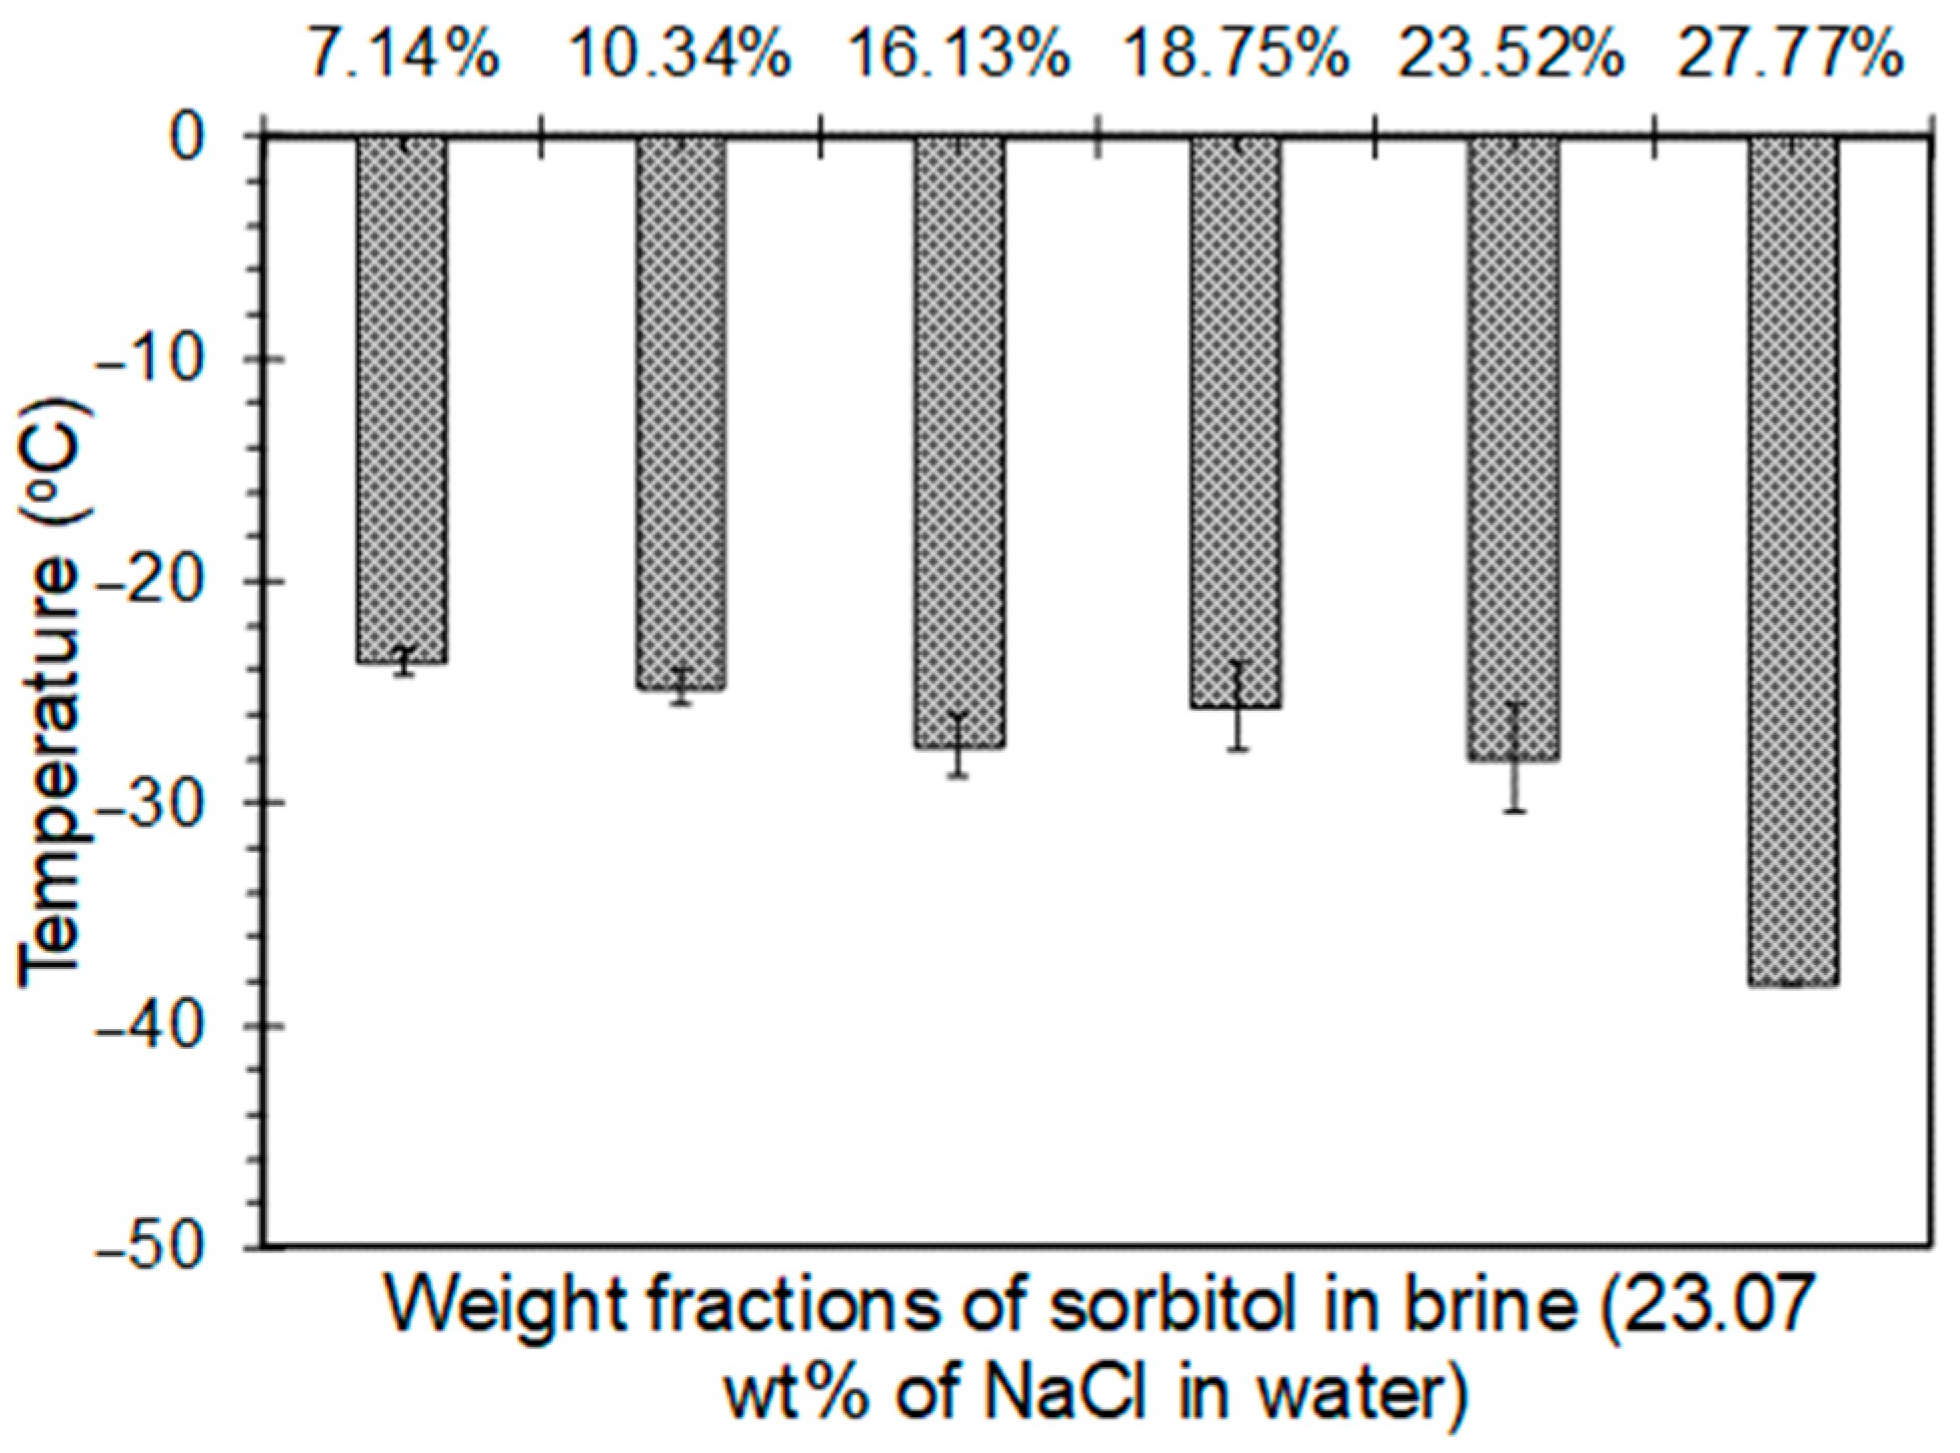
4.2.1. Sorbitol-Brine Solutions

In this study, six different weight fractions of sorbitol (in 23.3% brine solution), 7.14%, 10.34%, 16.13%, 18.75%, 23.52%, and 27.77% were considered, and their freezing points were determined. The time-versus-temperature-cooling curves were obtained for each weight fraction of sorbitol, and the results are shown in Figure 6. From Figure 6, it was evident that the cooling curves were fairly repeatable for all the weight fractions of sorbitol that were considered in this study. Unlike all other weight fractions of sorbitol, 27.77% weight fraction of sorbitol did not exhibit a clear horizontal plateau on the cooling curve. Although the exact reason was not clear, this horizontal plateau represented the phase transition of liquid into solid and was important in determining the freezing point depression. Therefore, to evaluate the freezing point depression for this particular weight fraction, DSC was employed. The freezing point depressions evaluated for all six weight fractions of sorbitol—7.14%, 10.34%, 16.13%, 18.75%, 23.52%, and 27.77%—were −23.8 °C, −24.8 °C, −27.4 °C, −25.7 °C, −28.1 °C, and −38.1 °C, respectively. These values were provided in the form of a bar chart in Figure 7 to illustrate the trend of freezing points with respect to the weight fractions of sorbitol.
From Figure 7, it could be inferred that the freezing point of the sorbitol-brine solution dropped with an increase in the weight fraction of the sorbitol. While a drop of 15.13% was observed when the sorbitol weight fraction was increased from 7.14% to 16.13%, a drop of 35.59% was observed when the sorbitol weight fraction increased from 23.52% to 27.77%. However, a small dip in the trend was observed at the 18.75% weight fraction of sorbitol. The temperature at which the solution froze depended upon the concentration and type of solute present in the mixture. The extent of the freezing point depression was based on the number of solute molecules and their size. Molecules of a comparatively smaller size had the greatest effect; the higher the concentration of these small molecules, the lower the freezing point [28]. The increase in the freezing point depression with an increase in the weight fraction of sorbitol could be attributed to the increased number of dissolved sorbitol molecules, which inhibited the bonding of water molecules, thereby hindering the growth of ice crystals [29].

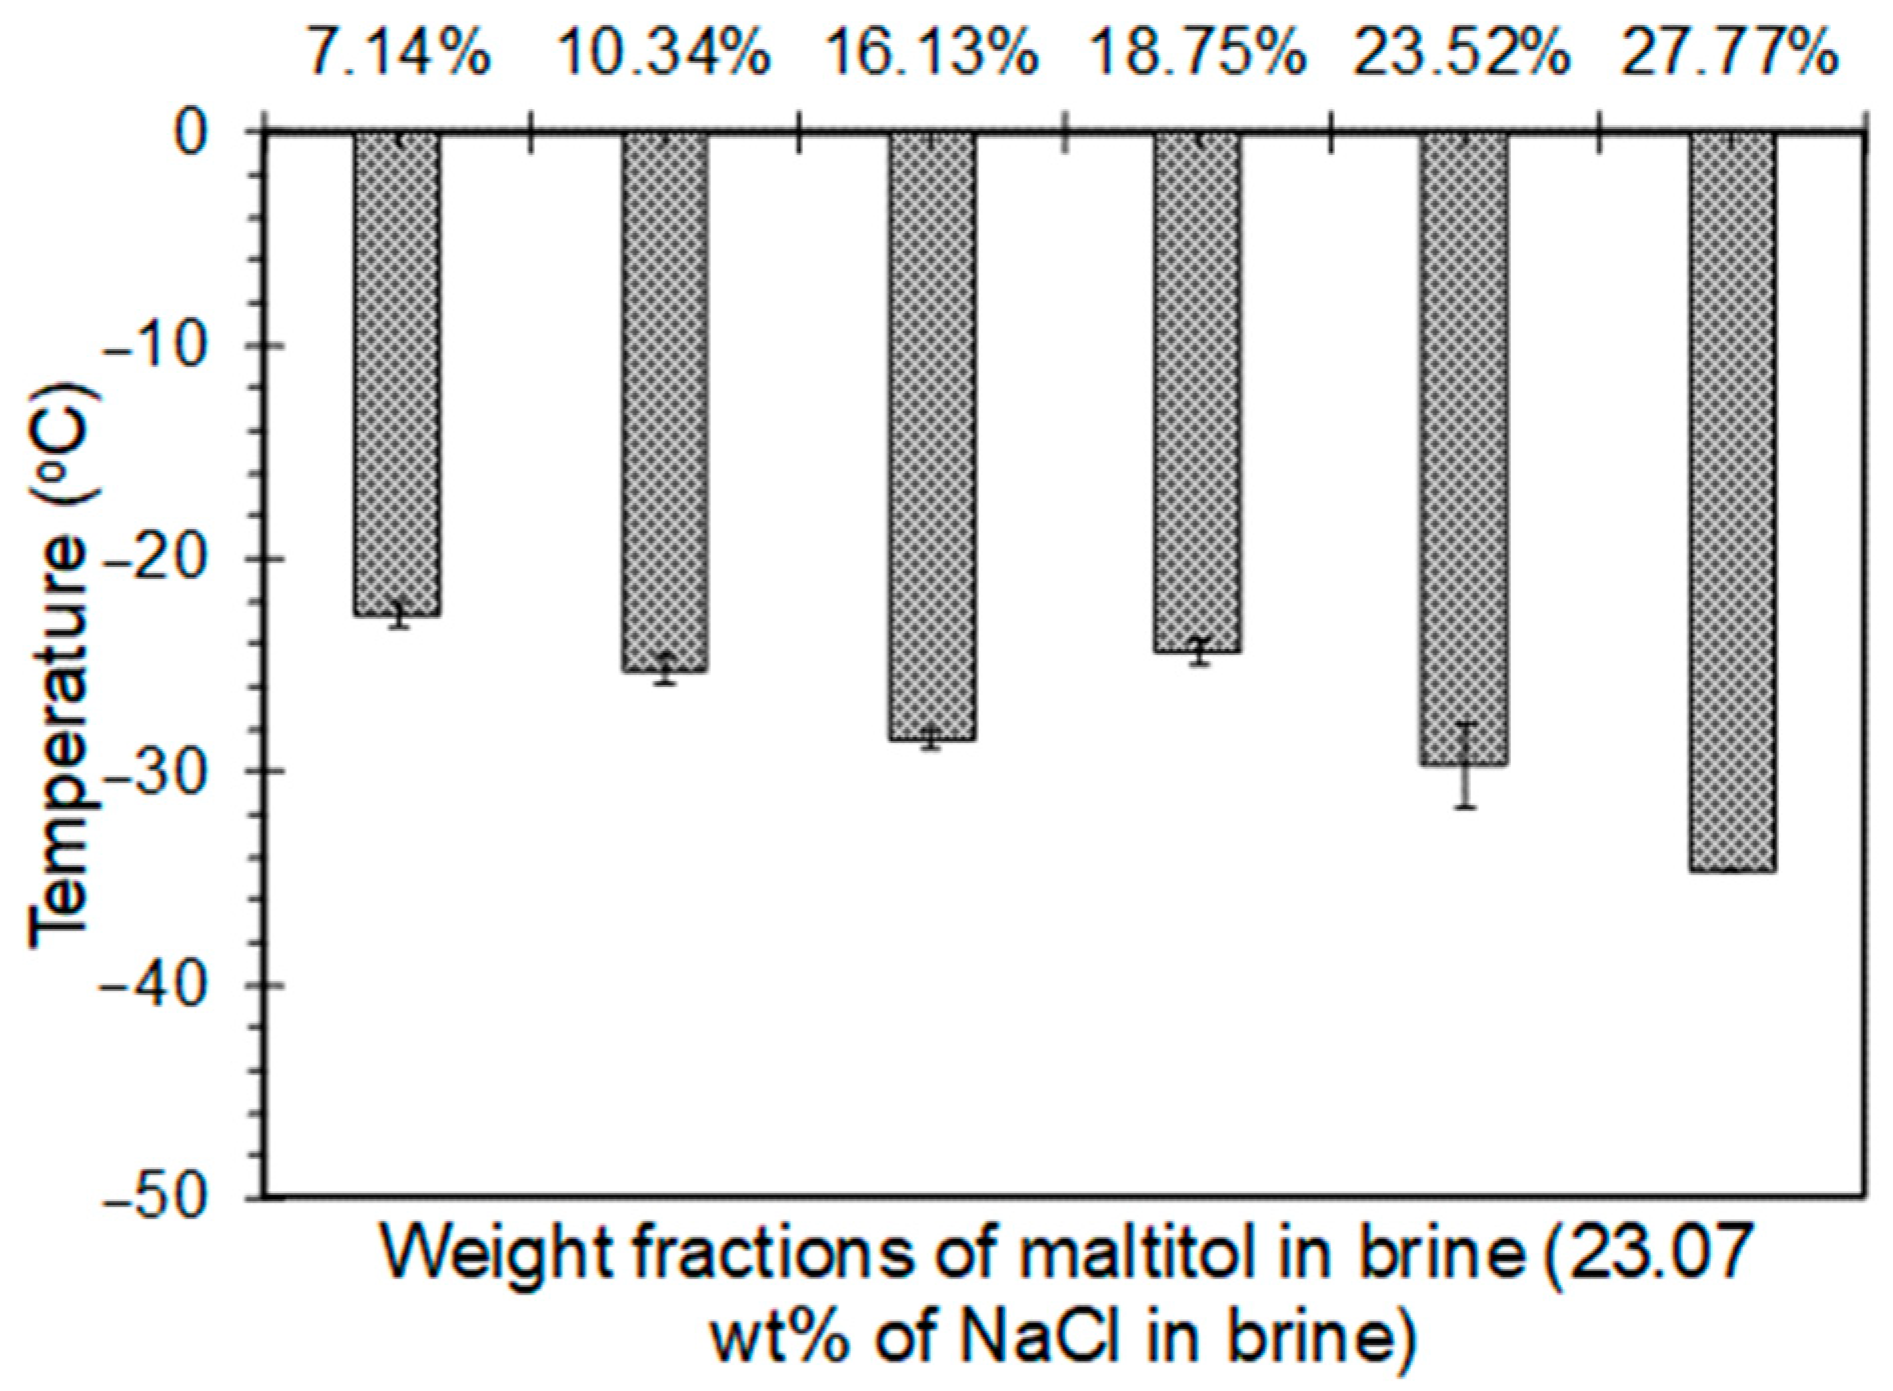
4.2.2. Maltitol-Brine Solutions

In this study, six different weight fractions of maltitol (in 23.3% brine solution), 7.14%, 10.34%, 16.13%, 18.75%, 23.52%, and 27.77%, were considered and their freezing points were determined. The time-versus-temperature-cooling curves were obtained for each weight fraction of maltitol, and the results are shown in Figure 8. From Figure 8, it was evident that the cooling curves were fairly repeatable for all the weight fractions of maltitol that were considered in this study. Similar to sorbitol, at 27.77% weight fraction, the maltitol-brine solution also did not exhibit a clear horizontal plateau in the cooling curve. Therefore, to evaluate the freezing point depression for this particular weight fraction, DSC was employed. The freezing point depressions evaluated for all six weight fractions of maltitol, 7.14%, 10.34%, 16.13%, 18.75%, 23.52%, and 27.77%, were −22.6 °C, −25.2 °C, −28.5 °C, −24.4 °C, −29.8 °C, and −35.6 °C, respectively. These values were provided in the form of a bar chart in Figure 9 to illustrate the trend of freezing points with respect to the weight fractions of maltitol.
From Figure 9, it could be inferred that the freezing point of the maltitol-brine solution dropped with an increase in the weight fraction of the maltitol. While a drop of 26.11% was observed when the maltitol weight fraction was increased from 7.14% to 16.13%, a drop of 19.46% was observed when the maltitol weight fraction increased from 23.52% to 27.77%. Similar to sorbitol, a small dip in the trend was again observed in the case of the 18.75% weight fraction of the maltitol-brine solution. The drop in the freezing point depression with an increase in the weight fraction of maltitol could be attributed to the high concentration of solute (maltitol in this case) molecules in the water, which hindered the bonding of water molecules from forming ice crystals [29,30]. Although a detailed examination was not performed in this study to understand the process behind the unusual dip at 18.75 wt%, it might be possible that the disassociation of the solute (polyols) molecules in brine solution at 18.75 wt% was less when compared to other weight fractions. Since lower disassociation of solute in solvent indicated an increase in the freezing point depression, the sorbitol and maltitol might have been exhibiting an unusual dip. Additionally, it might be possible that complex interaction between NaCl and polyol occurred. Further investigation would be required to understand the process behind the unusual dip.

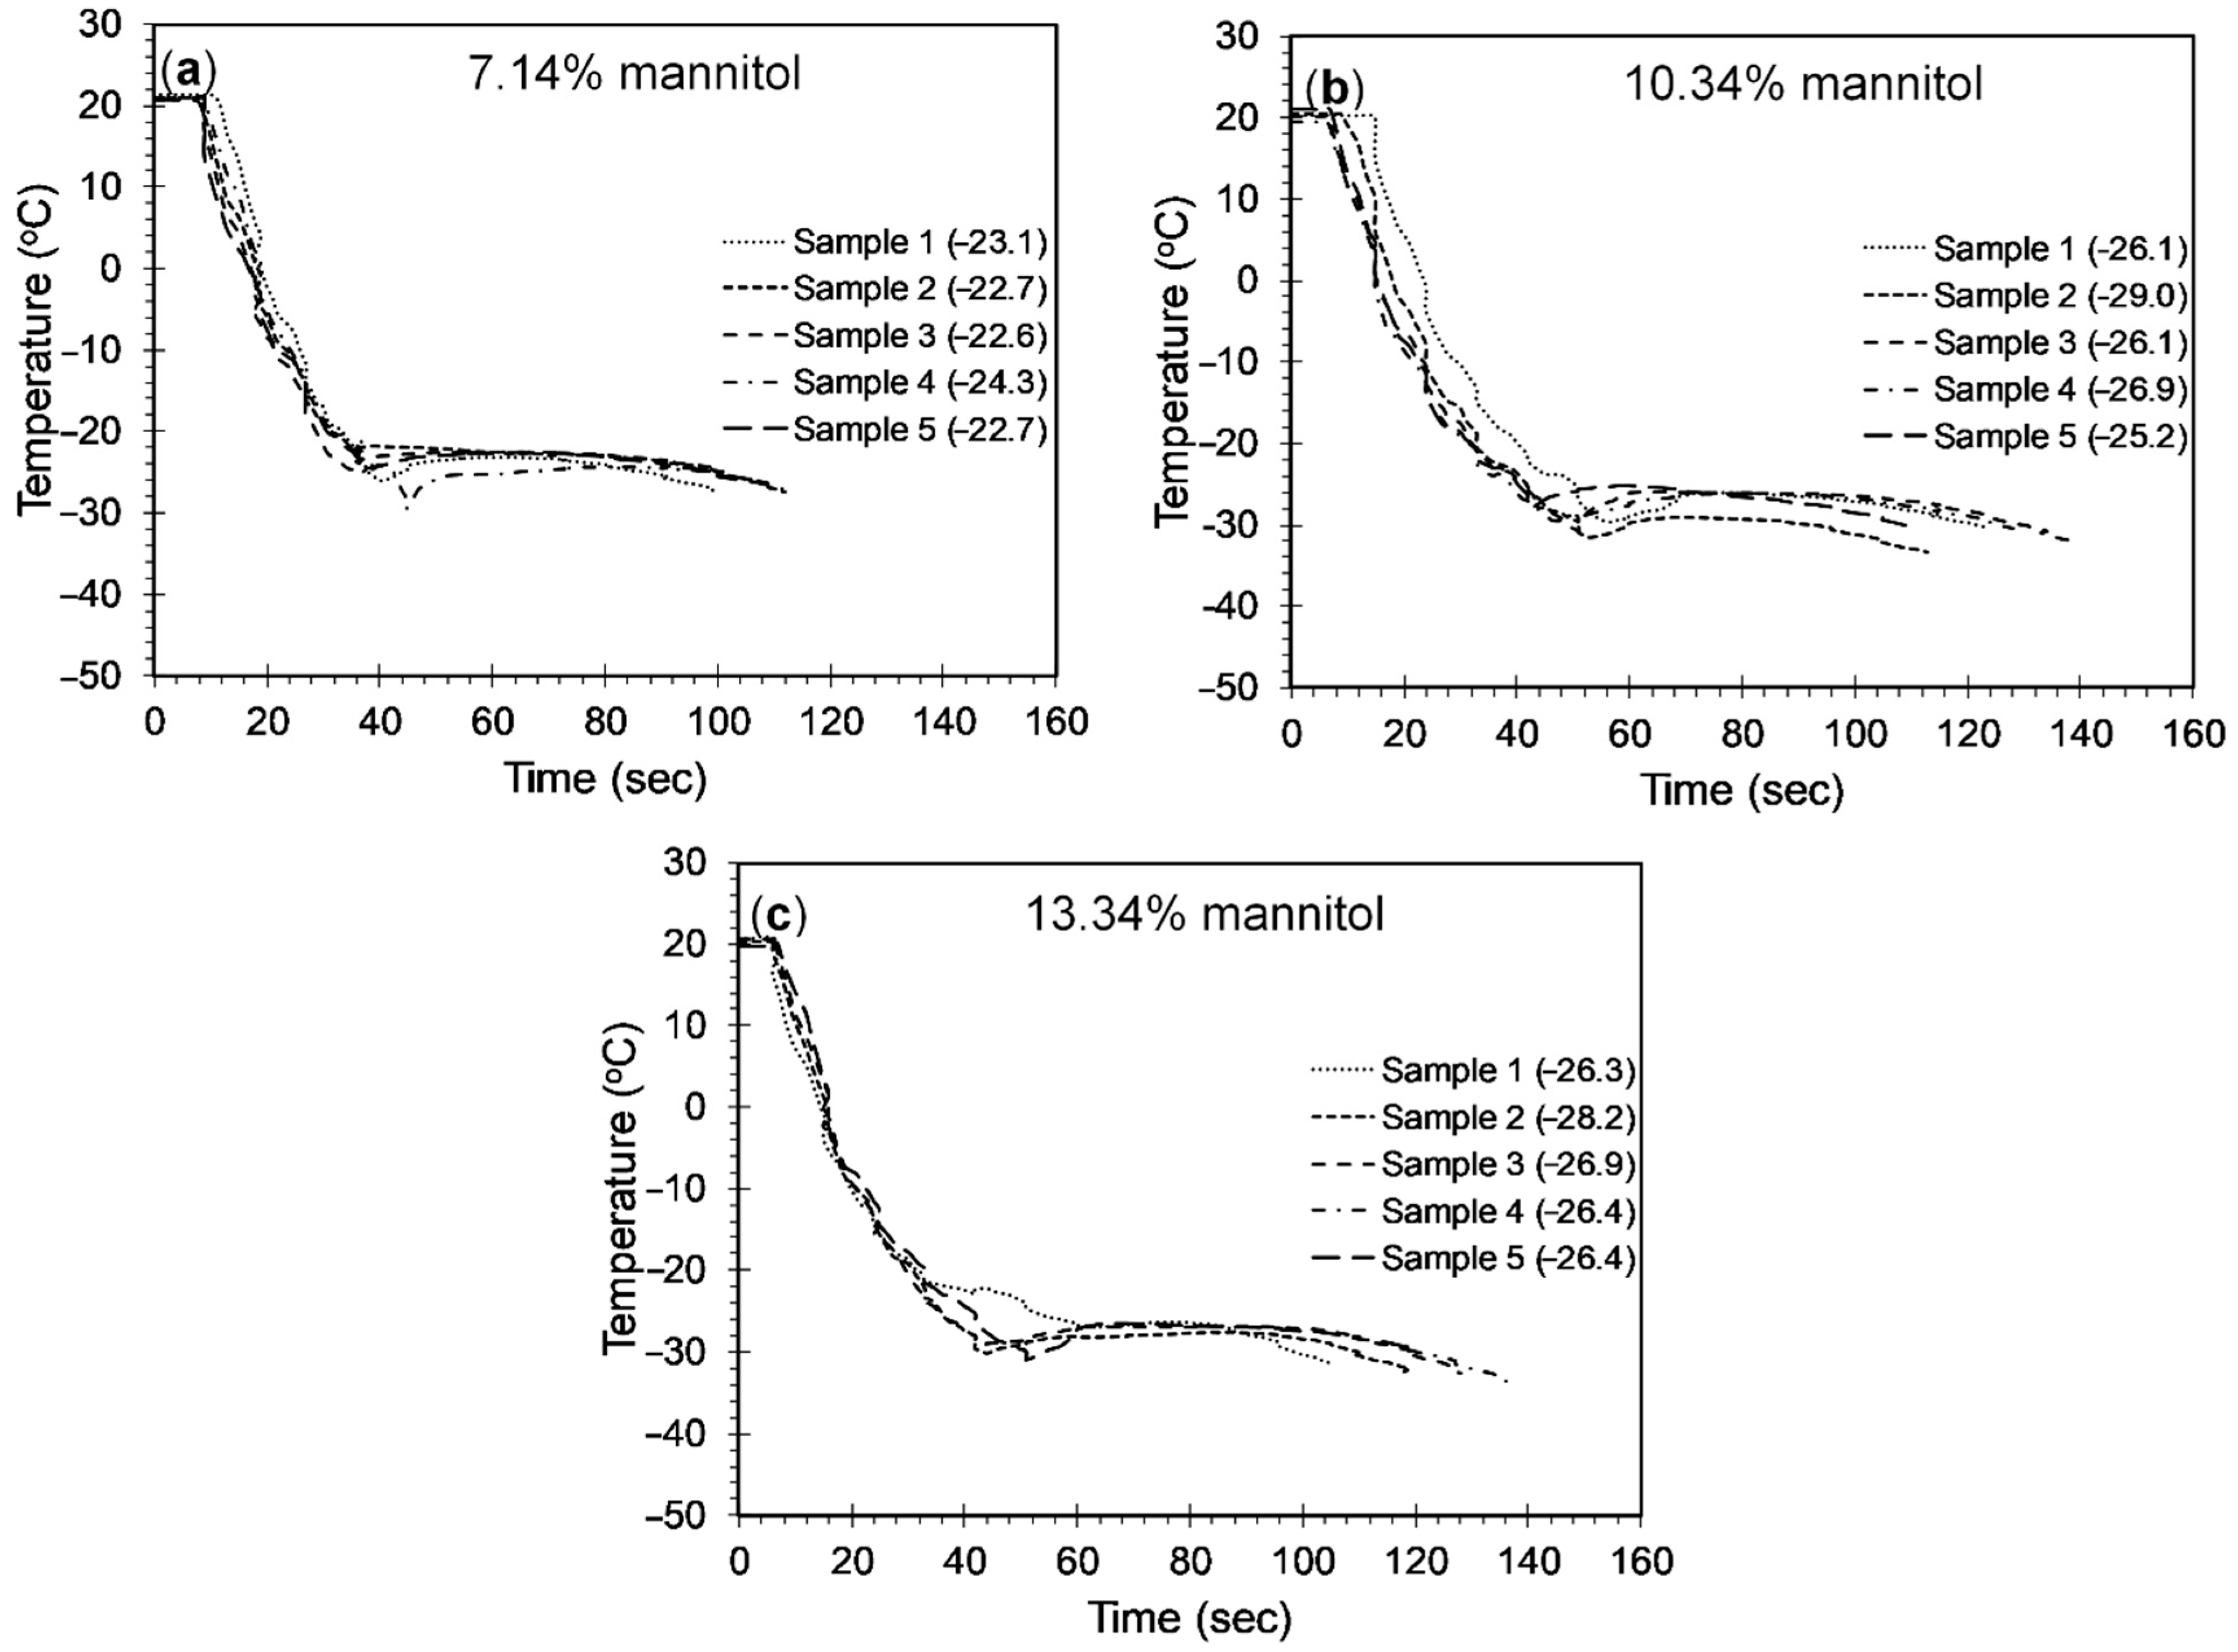
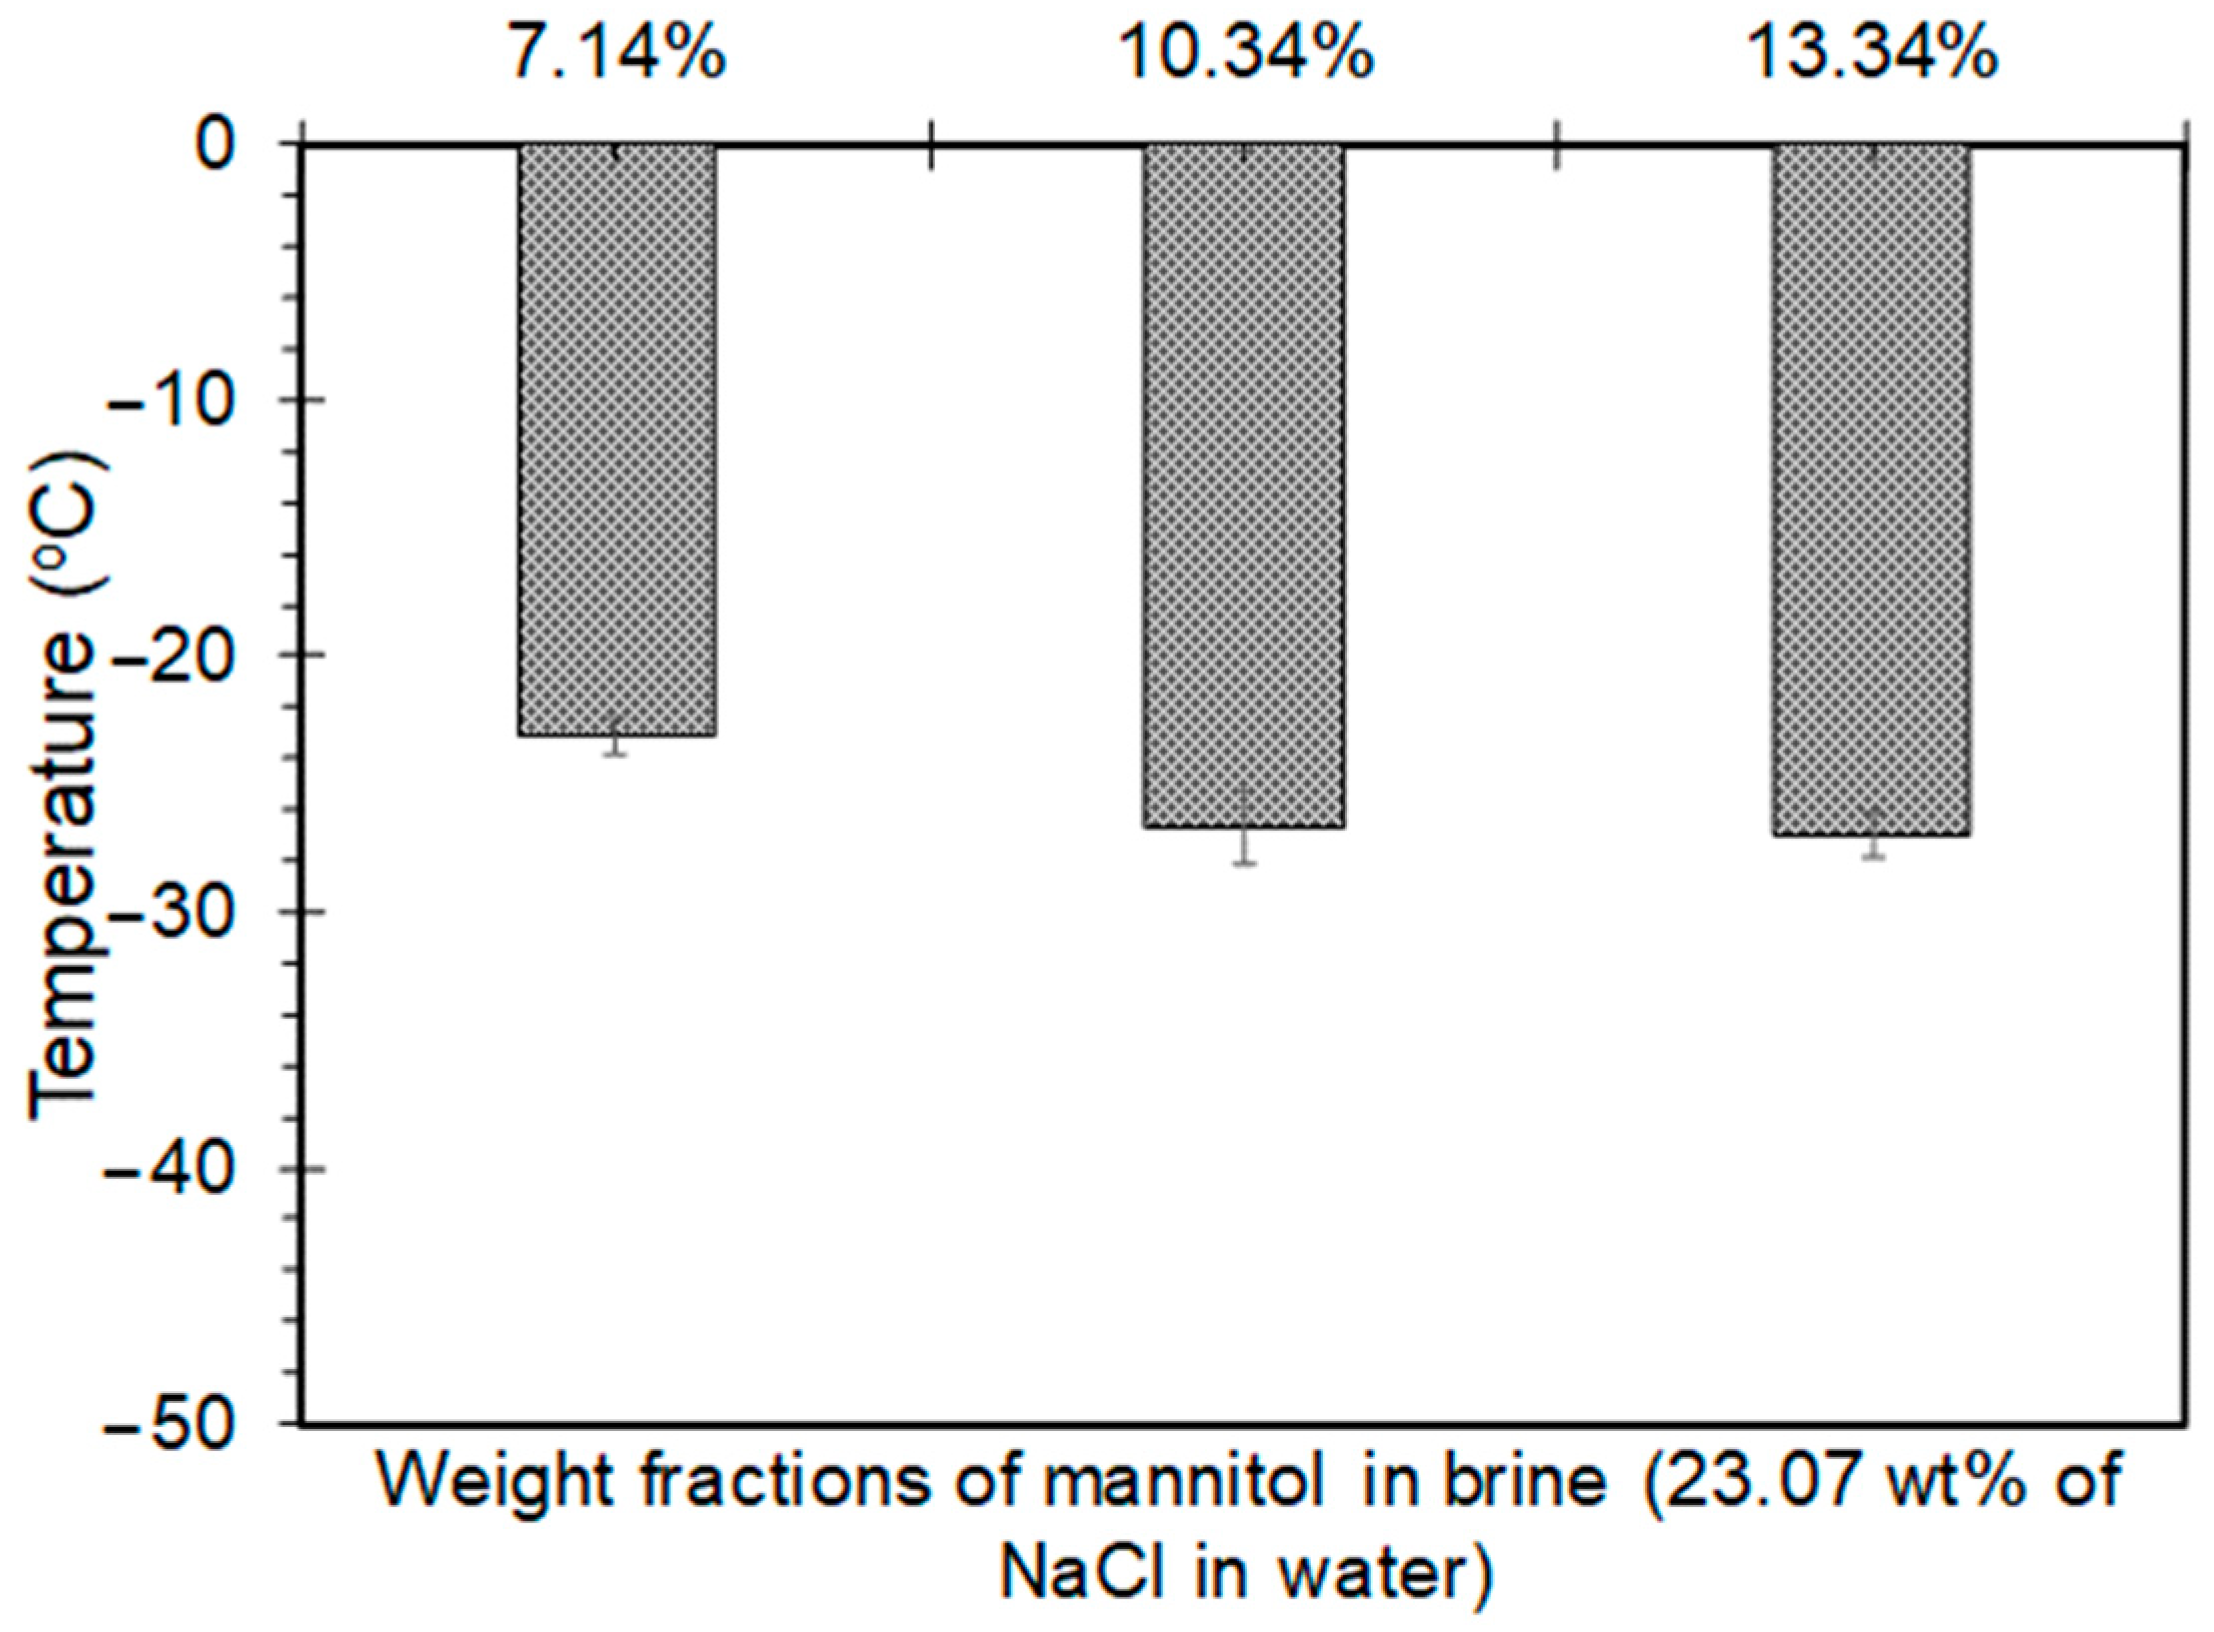
4.2.3. Mannitol-Brine Solutions

In this study, three different weight fractions of mannitol (in 23.3% brine solution), 7.14%, 10.34%, and 13.33%, were considered, and their freezing points were determined. Weight fractions beyond 13.33% were not considered due to the low solubility of mannitol in the brine solution. The time-versus-temperature-cooling curves were obtained for each weight fraction of mannitol, and the results are shown in Figure 10. From Figure 10, it was evident that the cooling curves were fairly repeatable for all the weight fractions of mannitol considered in this study. The freezing point depressions evaluated for the three weight fractions of mannitol, 7.14%, 10.34%, and 13.33%, were −23.10 °C, −26.70 °C, and −27.00 °C, respectively. These values are provided in the form of a bar chart in Figure 11 to illustrate the trend of freezing points with respect to the weight fraction of mannitol. From Figure 11, it could be inferred that the freezing point of a mannitol-brine solution dropped with an increase in the weight fraction of the mannitol. While a drop of 15.08% is observed when the maltitol weight fraction was increased from 7.14% to 10.34%, only a drop of 1.13% was observed when the maltitol weight fraction was increased from 10.34% to 13.33%. Again the drop in the freezing point depression with an increase in the weight fraction of mannitol could be attributed to the presence of more solute molecules in the solution, which inhibited the formation of ice crystals [29,30].

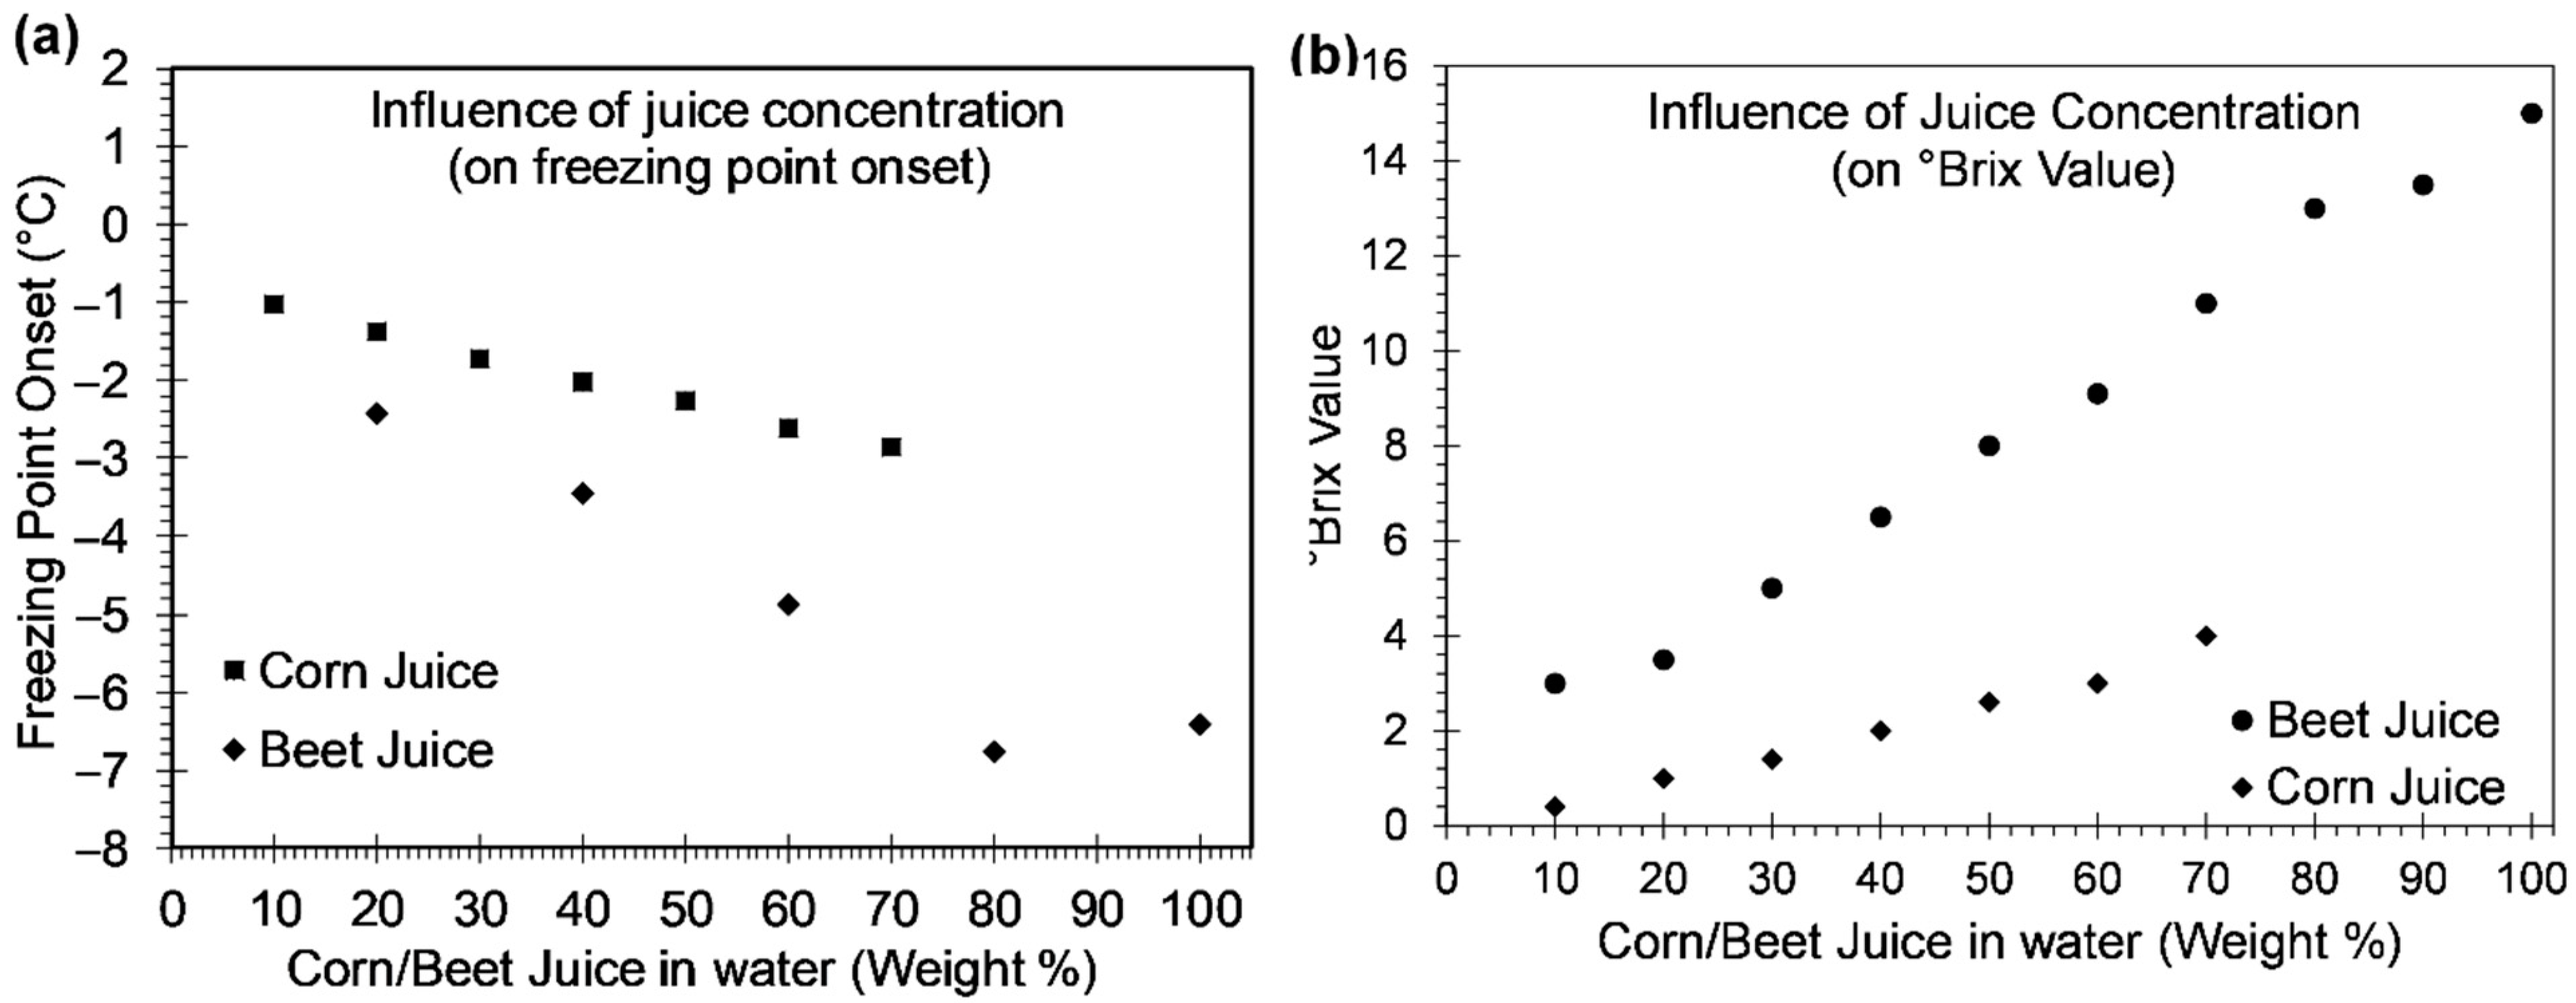
4.3. Freezing Points of Corn and Beet Juice

The freezing points of different concentrations of corn and beet juices were determined, and the influence of total soluble solids on their freezing points was investigated. In addition to this, the role of NaCl in depressing the freezing point of corn juice was also investigated. The freezing point depressions evaluated for different concentrations of corn and beet juice are shown in Figure 12a. It could be observed that the freezing point of corn juice dropped with the increase in the weight fraction of corn kernels. While the freezing point depression of corn juice was found to be −0.88 °C at 5% weight fraction, it was found to be −2.87 °C at 70% weight fraction (see Figure 13). The drop in the freezing points with an increase in the weight fraction of corn could be attributed to the increased quantity of total soluble solids present in the solution with high corn juice concentration [31]. Note that the composition of soluble solids was not determined as it fell outside the scope of the current study. Total soluble solids measured for different concentrations of corn juice are provided in Figure 12b. The °Brix value at 70 wt% of corn juice (°3.8) was found to be ten times higher than 5 wt% of corn juice (°0.4).
A similar trend in the decrease in freezing points was noticed in the case of beet juice with the increase in weight concentration. While the freezing point of beet juice was found to be −2.43 °C at 20% weight fraction, it was found to be −6.7 °C at 100% weight fraction (Figure 13b). It can be seen in Figure 12b that the °Brix value for pure beet juice was higher (°15) than 20% beet juice (°3.5). It was proposed in the literature that the higher the °Brix value, which represents total sugar solids such as sucrose, fructose, and glucose in fruit juices, the lower the freezing point of the fruit juice [31]. Therefore, it can be concluded that beet juice has a lower freezing point than corn juice because of the higher Brix value.

Influence of NaCl on the Freezing Point of Corn and Beet Juice

The influence of the addition of NaCl to corn and beet juices was presented in this sub-section. As discussed earlier, pure beet juice and 70% corn juice had a lower freezing point depression than the corresponding diluted juices. Therefore, only these two juice concentrations were considered. Figure 14a,b show the cooling curves of 70% corn juice-NaCl solution and the DSC thermogram of pure beet-juice-NaCl solution. It was evident that the cooling curves were repeatable for corn-juice-NaCl, and the freezing point depression of corn-juice-NaCl was found to be −23.5 °C, the freezing point depression of pure beet-juice-NaCl was found to be −28 °C. As discussed in Section 3, the presence of NaCl and soluble solids in fruit juice NaCl solutions hindered the formation and growth of ice crystals lowering the freezing points below −21.1 °C.

5. Conclusions

In this study, the influence of different weight fractions of polyols such as sorbitol, maltitol, and mannitol on the freezing point depression of brine solution was investigated for potential pavement deicing applications. In addition to this, the freezing point of corn and beet juice was also determined, and the influence of NaCl in lowering their freezing points below −21.1 °C was investigated. The following conclusions could be drawn from this study:
  • Addition of polyols to the 23.3 wt% brine solution was observed to lower the freezing point below −21.1 °C. The freezing point decreased until the solubility limit of polyols was reached. While a 15.13%, 26.11%, and 15.08% drop in the freezing point was observed when the weight fraction was increased from 7.14% to 16.13% for sorbitol, maltitol, and mannitol, respectively, a 35.39% and 19.46% drop was observed in the freezing point depression when the weight fraction was increased from 23.52% to 27.77% for sorbitol and maltitol, respectively.
  • The minimum freezing points achieved by sorbitol, maltitol, and mannitol, when combined with 23.3 wt% brine solution, were −38.1 °C, −35.6 °C, and −26.7 °C, respectively, at weight fractions of 27.77%, 27.77%, and 13.33%, respectively.
  • The freezing points of corn and beet juice were observed to decrease with an increase in their weight concentration. This phenomenon could be attributed to the higher quantity of the total soluble solids in the higher concentration juices. While corn juice exhibited a freezing point of −2.87 °C at 70% weight fraction of corn kernels, 100% concentration beet juice exhibited a freezing point of −6.8 °C.
  • Addition of NaCl to corn and beet juice further depressed their freezing points. The 70 wt% corn and 100% concentration beet juice with 23.3 wt% NaCl lowered the freezing points to −23.5 °C, and −28 °C, respectively.
Based on the experimental results, the combination of 27.77 wt% of sorbitol +23.3 wt% salt-brine solution is recommended for deicing in regions where the freezing temperatures are below −30°C. In future work, the authors intend to perform a detailed investigation on the environmental impacts of the reported polyols and the agricultural products.

Author Contributions

Conceptualization, R.K.; Funding acquisition, R.K.; Investigation, T.A. and D.N.L.; Methodology, R.K.; Supervision, R.K.; Writing—original draft, T.A.; Writing—review & editing, D.N.L. and R.K. All authors have read and agreed to the published version of the manuscript.

Funding

This research was funded in part by Iowa Highway Research Board, grant number FAR0029796 and Bioprocessing and Bioengineering Program (2021-67022-34500) from the USDA National Institute of Food and Agriculture. Any opinions, findings, conclusions, or recommendations provided in this paper are those of the author(s) and do not necessarily reflect the views of the funding agencies.

Institutional Review Board Statement

Not Applicable.

Informed Consent Statement

Not Applicable.

Data Availability Statement

The raw/processed data required to reproduce these findings cannot be shared at this time due to technical or time limitations.

Acknowledgments

This study was supported in part by the Iowa Highway Research Board (Funding number-FAR0029796) and by the Bioprocessing and Bioengineering Program (2021-67022-34500) from the USDA National Institute of Food and Agriculture. Any opinions, findings, conclusions, or recommendations provided in this paper are those of the author(s) and do not necessarily reflect the views of the funding agencies.

Conflicts of Interest

The authors declare no conflict of interest.

References

  1. Izumi, I.; Nakamura, T.; Sack, R.L. Snow Engineering: Recent Advances. In Proceedings of the Third International Conference, Sendai, Japan, 26–31 May 1996; CRC Press: Boca Raton, FL, USA, 1997. [Google Scholar]
  2. Kao, J.C.; Sung, W.-P. Civil, Architecture and Environmental Engineering Volume 2. In Proceedings of the International Conference ICCAE, Taipei, Taiwan, 4–6 November 2016. [Google Scholar]
  3. National Research Council (US). Deicing, Highway Deicing: Comparing Salt and Calcium Magnesium Acetate; Transportation Research Board: Washington, DC, USA, 1991. [Google Scholar]
  4. FHWA. How Do Weather Events Impact Roads?—FHWA Road Weather Management. 2018. Available online: https://ops.fhwa.dot.gov/weather/q1_roadimpact.htm (accessed on 7 March 2021).
  5. Fischel, M. Evaluation of Selected Deicers Based on a Review of the Literature; Colorado Department of Transportation, Research Branch: Denver, CO, USA, 2009. [Google Scholar]
  6. Akin, M.; Huang, J.; Shi, X.; Veneziano, D.; Williams, D. Snow Removal at Extreme Temperatures; Western Transportation Institute, Montana State University: Bozeman, MT, USA, 2013. [Google Scholar]
  7. Kimbrough, D. Salting roads: The solution for winter driving. ChemMatters 2006, 24, 14–16. Available online: file:///C:/Users/MDPI/AppData/Local/Temp/chemmatters-feb2006-salting-roads-1.pdf (accessed on 7 March 2021).
  8. Sajid, H.U.; Kiran, R.; Qi, X.; Bajwa, D.S.; Battocchi, D. Employing corn derived products to reduce the corrosivity of pavement deicing materials. Constr. Build. Mater. 2020, 263. [Google Scholar] [CrossRef]
  9. Sajid, H.U.; Naik, D.L.; Kiran, R. Improving the ice-melting capacity of traditional deicers. Constr. Build. Mater. 2021, 271. [Google Scholar] [CrossRef]
  10. Goldberg, I. Functional Foods: Designer Foods, Pharmafoods, Nutraceuticals; Springer Science & Business Media: Berlin, Germany, 2012. [Google Scholar]
  11. Uraji, T.; Kohno, H.; Yoshimura, H.; Shimoyamada, M.; Watanabe, K. Freezing Point Depression of Polyol-Aqueous Solutions in the High Concentration Range. Food Sci. Technol. Int. Tokyo 1996, 2, 38–42. [Google Scholar] [CrossRef]
  12. Aliyu, B.K.; Osheku, C.A.; Oyedeji, E.O.; Adetoro, M.A.L.; Okon, A.A.; Idoko, C.M. Validating a novel theoretical expression for burn tine and average thrust in solid rocket motor design. Adv. Res. 2015, 5, 1–11. [Google Scholar]
  13. Dewick, P.M. Essentials of Organic Chemistry: For Students of Pharmacy, Medicinal Chemistry and Biological Chemistry; John Wiley & Sons: Chichester, UK, 2006. [Google Scholar]
  14. Guddat, S.; Thevis, M.; Schänzer, W. Identification and Quantification of the Osmodiuretic Mannitol in Urine for Sports Drug Testing Using Gas Chromatography-Mass Spectrometry. Eur. J. Mass Spectrom. 2008, 14, 127–133. [Google Scholar] [CrossRef] [PubMed]
  15. BeMiller, J.N. Carbohydrate Chemistry for Food Scientists; Elsevier BV: New York, NY, USA, 2019. [Google Scholar]
  16. Kalsoom, U.; Bennett, I.; Boyce, M.C. A review of extraction and analysis: Methods for studying osmoregulants in plants. J. Chromatogr. Sep. Tech. 2016, 7, 2. [Google Scholar] [CrossRef] [Green Version]
  17. Zumbé, A.; Lee, A.; Storey, D. Polyols in confectionery: The route to sugar-free, reduced sugar and reduced calorie confectionery. Br. J. Nutr. 2001, 85, S31–S45. [Google Scholar] [CrossRef] [PubMed]
  18. Ketcham, S.; Minsk, L.D.; Blackburn, R.R.; Fleege, E.J. Manual of Practice for an Effective Anti-Icing Program: A Guide for Highway Winter Maintenance Personnel; Federal Highway Administration: Washington, DC, USA, 1996. [Google Scholar]
  19. Villa-Vélez, H.A.; Telis-Romero, J.; Higuita, D.M.C.; Telis, V.R.N. Effect of maltodextrin on the freezing point and thermal conductivity of uvaia pulp (Eugenia piriformis Cambess). Ciência Agrotecnol. 2012, 36, 78–85. [Google Scholar] [CrossRef] [Green Version]
  20. Telis, V.; Telis-Romero, J.; Sobral, P.; Gabas, A. Freezing Point and Thermal Conductivity of Tropical Fruit Pulps: Mango and Papaya. Int. J. Food Prop. 2007, 10, 73–84. [Google Scholar] [CrossRef] [Green Version]
  21. Groenewoud, W. Characterisation of Polymers by Thermal Analysis; Elsevier BV: New York, NY, USA, 2001. [Google Scholar]
  22. Rahman, M.; Guizani, N.; Al-Khaseibi, M.; Al-Hinai, S.A.; Al-Maskri, S.S.; Al-Hamhami, K. Analysis of cooling curve to determine the end point of freezing. Food Hydrocoll. 2002, 16, 653–659. [Google Scholar] [CrossRef]
  23. Stewart, M.I. Heat Transfer Theory. In Surface Production Operations; Gulf Professional Publishing: Boston, MA, USA, 2014; pp. 39–97. [Google Scholar]
  24. Louhenkilpi, S. Continuous Casting of Steel. In Treatise on Process; Metallurgy, S., Ed.; Elsevier: Boston, MA, USA, 2014; pp. 373–434. [Google Scholar]
  25. Srivastava, L.M. Plant. Growth and Development: Hormones and Environment; Elsevier: NewYork, NY, USA, 2002. [Google Scholar]
  26. Belch, A.C.; Berkowitz, M.; McCammon, J.A. Solvation structure of a sodium chloride ion pair in water. J. Am. Chem. Soc. 1986, 108, 1755–1761. [Google Scholar] [CrossRef]
  27. Kelley, M.; Donley, A.; Clark, S.; Clark, A. Structure and Dynamics of NaCl Ion Pairing in Solutions of Water and Methanol. J. Phys. Chem. B 2015, 119, 15652–15661. [Google Scholar] [CrossRef] [PubMed]
  28. Hui, Y.H.; Sherkat, F. Handbook of Food Science, Technology, and Engineering-4 Volume Set; CRC Press: Boca Raton, FL, USA, 2005. [Google Scholar]
  29. Pappas, L.S. Ice Creams & Sorbets: Cool Recipes; Chronicle Books LLC: Sanfrancisco, CA, USA, 2006. [Google Scholar]
  30. Jayawardena, J.; Vanniarachchi, M.; Wansapala, M. Freezing point depression of different Sucrose solutions and coconut water. Int. J. Food Sci. Nutr. 2017, 2, 68–71. [Google Scholar]
  31. Auleda, J.; Raventós, M.; Sánchez, J.; Hernández, E. Estimation of the freezing point of concentrated fruit juices for application in freeze concentration. J. Food Eng. 2011, 105, 289–294. [Google Scholar] [CrossRef]
Figure 1. Chemical structures of polyols (a) sorbitol [13,18], (b) maltitol [14,15], and (c) mannitol [16]. Redrawn by authors.
Sustainability 13 05765 g001
Figure 2. An in-house experimental setup employed in this study for evaluating the freezing point depression.
Sustainability 13 05765 g002
Figure 3. Typical freezing point depression curve obtained from in-house experimental setup used for determining the freezing point of aqueous solutions.
Sustainability 13 05765 g003
Figure 4. (a) A typical differential scanning calorimetry (DSC) thermogram and (b) the endothermic peak used for the determination of the freezing point depression. The units of heat flow and temperature are in W/g and °C.
Sustainability 13 05765 g004
Figure 5. Validation of freezing point depressions of the brine solution at different concentrations evaluated from the in-house experimental setup by comparing it with the values provided in the reference study [18]. Redrawn by authors.
Sustainability 13 05765 g005
Figure 6. Effect of different weight fractions of sorbitol on the freezing point depression of the brine solution (23.3% NaCl in water). (a) 7.14%, (b) 10.34%, (c) 16.13%, (d) 18.75%, (e) 23.52% and (f) 27.77%.
Sustainability 13 05765 g006
Figure 7. Influence of weight fractions of sorbitol on depressing the freezing point of brine (all experiments (7.14 wt% to 23.52 wt%) were performed in triplicate using an in-house experimental setup, except the one with 27.77 wt% of sorbitol in brine, as it was performed using DSC).
Sustainability 13 05765 g007
Figure 8. The effect of different weight fractions of maltitol on the freezing point depression of brine (23.3% NaCl in water). (a) 7.14%, (b) 10.34%, (c) 16.13%, (d) 18.75%, (e) 23.52% and (f) 27.77%.
Sustainability 13 05765 g008
Figure 9. The influence of the weight fractions of maltitol on depressing the freezing point of the brine solution (all experiments (7.14 wt% to 23.52 wt%) were performed in triplicate using an in-house experimental setup, except the one with 27.77 wt% of maltitol in brine solution, as it was performed using DSC).
Sustainability 13 05765 g009
Figure 10. The effect of different weight fractions of mannitol on the freezing point depression of the brine solution (23.3% NaCl in water). (a) 7.14%, (b) 10.34% and (c) 13.34%.
Sustainability 13 05765 g010
Figure 11. The influence of the weight fractions of mannitol on the freezing point depression of the brine solution.
Sustainability 13 05765 g011
Figure 12. (a) Onset of freezing in corn and beet juices with different weight concentrations and (b) °Brix value for different weight fractions of corn and beet juice concentrations.
Sustainability 13 05765 g012
Figure 13. (a) DSC thermogram of corn juice for 5% and 70% weight concentrations and (b) DSC thermogram of beet juice at 40% and 100% weight concentrations.
Sustainability 13 05765 g013
Figure 14. Freezing point depression of corn and beet juices in brine solution (23.3 wt%): (a) 70% corn juice and (b) pure beet juice (DSC).
Sustainability 13 05765 g014
Table 1. Physiochemical properties of polyols used in this study.
SorbitolMaltitolMannitol
Molecular formula C6H14O6C12H24O11 C6H14O6
Molecular weight (g/mol) 182.172 344.313 182.172
Water solubility (g/100 mL of water at 25 °C) [17] 246.6171.218.2
Publisher’s Note: MDPI stays neutral with regard to jurisdictional claims in published maps and institutional affiliations.

