Article

Dynamics and Drivers of Grasslands in the Eurasian Steppe during 2000–2014

1
Department of Ecology, School of Life Science, Nanjing University, Nanjing 210046, China
2
School of Environment and Planning, Liaocheng University, Liaocheng 252059, China
3
State Key Laboratory of Plateau Ecology and Agriculture, Qinghai University, Xining 810016, China
4
Institute of Geographic Sciences and Natural Resources Research, Chinese Academy of Sciences, Beijing 100101, China
*
Authors to whom correspondence should be addressed.
Sustainability 2021, 13(11), 5887; https://doi.org/10.3390/su13115887
Submission received: 19 April 2021 / Revised: 11 May 2021 / Accepted: 12 May 2021 / Published: 24 May 2021

Abstract

:
The Eurasian steppe (EAS) is the largest contiguous grassland worldwide. Quantitative evaluations of the relative impacts of climate change and human activities on grasslands are significant for understanding grassland degradation mechanisms and controlling degraded grasslands. In this study, we analyzed the grassland productivity based on multiple forms of net primary productivity (NPP), including climate NPP (CNPP), actual NPP (ANPP), and human-caused NPP (HNPP) during 2000–2014. The results demonstrate that the average value of annual ANPP in the EAS was 47.36 gC/(m2·year), with a weak decrease (−0.02 gC/(m2·year)) during the study period. The area of grassland degradation account for 48.52% of the total grassland area in EAS, while the area of grassland recovery account for 51.48%. Restorative grassland was mainly distributed in Mongolia and China, while worse grassland was mainly distributed in the Kazakh steppe regions. Grassland degradation in China was mainly caused by climate change, whereas it was mainly caused by human activities in Mongolia. Grassland recovery in Kazakh steppe regions was mainly caused by human activities, but in Mongolia, it was mainly caused by climate change. Compared with temperature, precipitation played a more significant role on grassland productivity.

1. Introduction

Global warming by an increased CO2 concentration is the major inhibition of the hydrological and carbon cycles [1,2]. The IPCC’s (Intergovernmental Panel on Climate Change) report showed a 95% certainty of global climate change results from human activities [3]. Therefore, quantitative analysis of the impacts of climate change and human activities on terrestrial ecosystems is necessary. The Eurasian steppe (EAS) is the largest grassland belt in the world (nearly 110 longitude lines), stretching through the eastern European plain, the western Siberian plain, the Kazakh hills, and the Mongolian Plateau [4] (Figure 1). This ecoregion plays an important role in the regional and global carbon cycle, and animal husbandry is the main economic production mode [5,6]. In EAS, disturbances induced by human activities and climate change exist widely across the landscape, and significantly affect vegetation productivity and carbon stock conditions [7,8].
Climate change and human activities are putting an enormous strain on the grassland ecosystems [9,10]. Due to the decrease of regional annual precipitation and surface water loss, the drought problem is becoming more and more serious [11]. Simultaneously, with the increasing human population and demands for animal products, animal husbandry has become a widespread human activity in EAS [12]. There are some methods that utilize modeling techniques base on remote sensing to distinguish grassland degradation caused by human activities and climate change, such as correlation analysis [13], factor analysis [14], and principal components analysis [15]. As a proxy for grassland carrying capacity, net primary productivity (NPP) is widely used to analysis grassland dynamic and its driving factors [16,17]. A residual analysis method based on actual and potential vegetation productivity for analyzing grassland degradation is very important [18]. These studies applied a slopes combination of multiple forms of NPP to distinguish between the contribution of climate change and human activities to grassland degradation [10]. During recent decades, EAS has experienced increasingly severe land degradation and desert expansion [19]. However, there have been few quantitative pieces of research on grassland degradation in the whole EA steppe.
Evaluations of the relative impacts of climate change and human activities on grasslands are significant for understanding grassland degradation mechanisms and containment of grassland degradation. It is also a key challenge for grassland ecosystem management to anticipate grassland conditions. Based on NPP from 2000 to 2014, we characterize the grassland degraded situation of EAS and distinguish between the relative contribution of climate change and human activities. The present study aimed to address the insufficiency of grassland degradation research in EAS. The results are also of great importance for pasture production and grassland management.

2. Materials and Methods
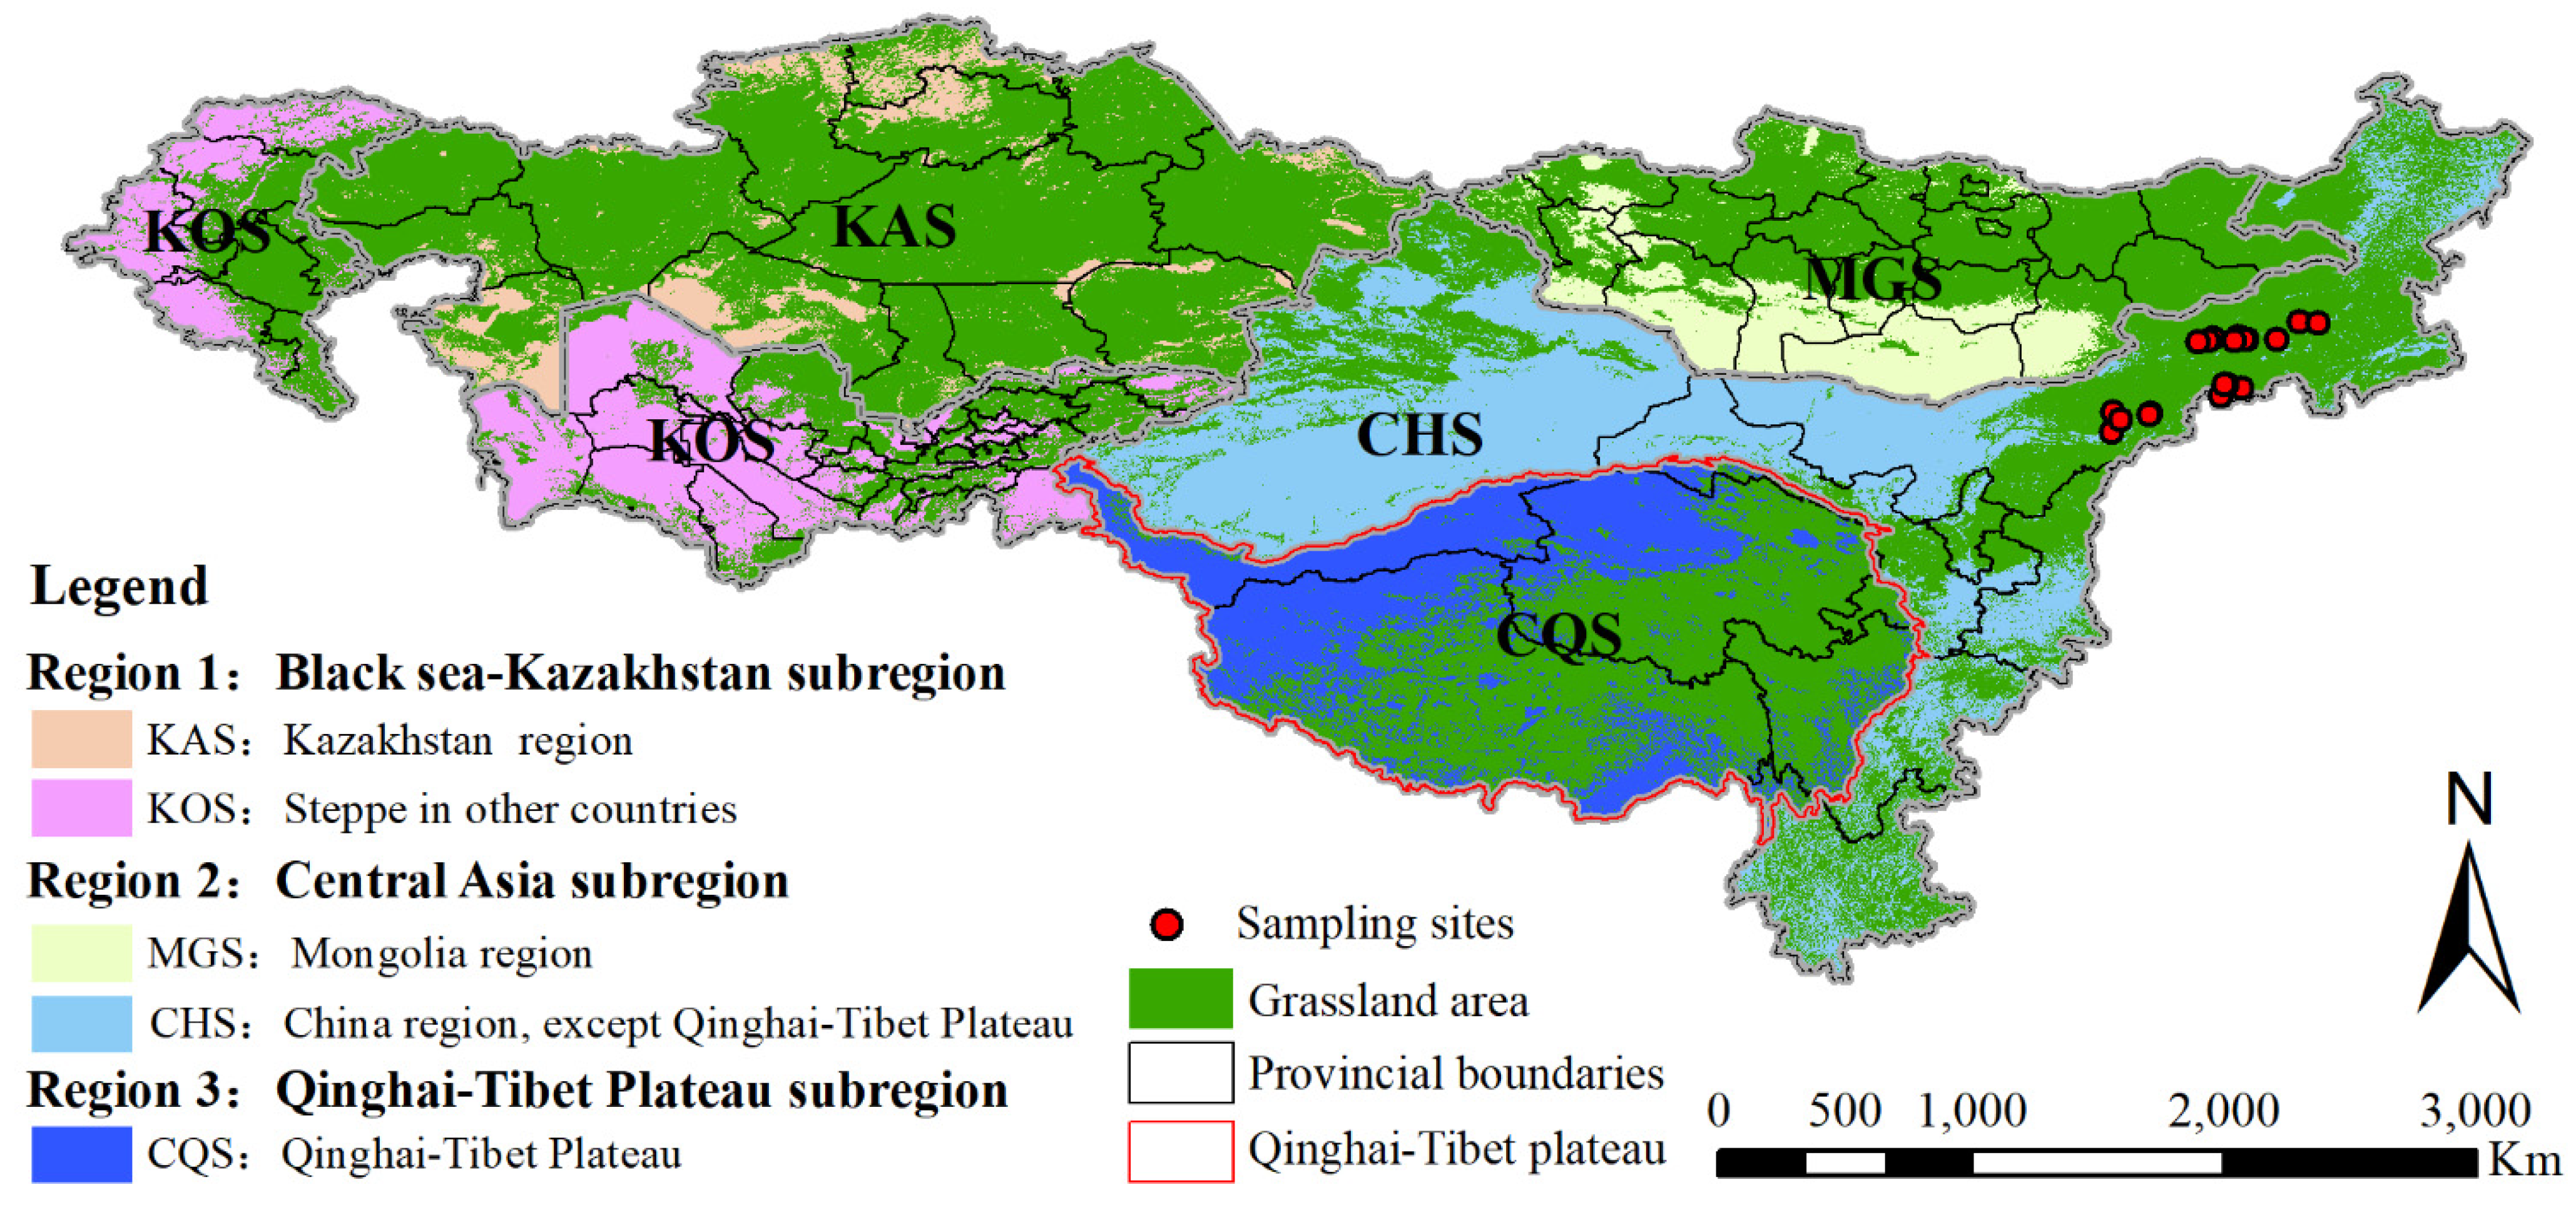
2.1. Study Area

The EAS is the largest natural steppe on the globe, located in the Europe and Asia plate (Figure 1). It stretches more than 8000 km, spanning from the Volgograd Oblast, Russia in the west to Mongolia and Inner Mongolia, China in the east, and the area is about 150 million hectares. The southernmost part is the Qinghai-Tibet plateau in China. The longitudinal and latitudinal extents are 39–125° E and 35–55° N, respectively [20]. The region is typically dominated by a temperate continental climate with different degrees of aridity, except for in the Qinghai-Tibetan Plateau. Due to high mountain barriers and unique environments, the Tibetan Plateau has a typical Tibetan Plateau climate that is cold and wet for most of the year. As a typical arid and semi-arid region, precipitation is unstable, ranging from 150 mm to 500 mm per year, while the mean annual precipitation is less than 400 mm. The mean annual temperature ranges from −5 °C to 15 °C with the latitude gradient except for the Tian Shan and Altai mountain ranges [21].
The EAS’s different environmental conditions also lead to zonal changes of grassland vegetation. The major parts of the EAS include the Black Sea-Kazakhstan grassland sub-region, the Mongolian plateau grassland sub-region, and the Qinghai-Tibet plateau grassland sub-region [22]. According to the regime division, this study separated the EAS into five sub-regions: they are Kazakhstan steppe region (KAS), steppe in other countries (KOS) in the west, the Mongolian plateau steppe region (MGS), the Qinghai-Tibet plateau steppe region (CQS), and other steppe regions in China (CHS, Figure 2).

2.2. Data Source and Processing

We obtained the grassland map of the year 2000 from the MODIS MCD12Q1 data products with the International Geosphere-biosphere Program (IGBP) classification system. The MCD12Q1 Version 6 data product comes from MODIS reflectance data obtained by Terra and Aqua using supervised classifications. The IGBP classification system defines 17 classes of primary land cover types. In this study, according to our need, we reclassified land cover types, and the grassland type comes from the combination of classes 6–11 (including closed shrublands, open shrublands, Woody Savannas, Savannas, Grasslands, and Permanent Wetlands in order).
The GIMMS NDVI3g v1.0 dataset is the longest time range of NDVI data products (https://ecocast.arc.nasa.gov/data/pub/gimms/3g.v1/ (accessed on 9 May 2020)). The spatial resolution is 8 km and the temporal resolution is 15 d. The dataset is the latest third generation global vegetation index product released by NASA’s global monitoring and modeling research group. It can improve the data quality in high latitudes, identify and remove the orbit drift caused by the solar zenith angle, and improve the inconsistency between different generations of sensors.
The global map version 3 product provides highly consistent long time series leaf area index (LAI) data (http://www.globalmapping.org/globalLAI/ (accessed on 22 December 2020)). The spatial resolution of the data is 0.08 degrees. The product is based on a quantitative fusion inversion of AVHRR (before the year 2000) and MODIS (after the year 2000). The global aggregation index map is used to calculate the dataset, and the vegetation aggregation effect is considered from the pixel scale. At the same time, the cloud detection algorithm based on time series surface reflectance inflection point is used, and the local adjustment cubic spline interpolation method LACC is used to smooth the missing values and noise to improve the data reliability.
Global monthly temperature and precipitation data were obtained from the British Atmospheric Data Centre. The dataset is the gridded Climatic Research Unit (CRU) version 4.02 (http://www.cru.uea.ac.uk/ (accessed on 21 December 2019)). Global monthly surface solar radiation data applied from the National Tibetan Plateau Data Center, Institute of Tibetan Plateau Research, Chinese Academy of Sciences, Beijing, China. The time scale is from July 1983 to December 2018, with resolutions of 3 h and 10 km (https://data.tpdc.ac.cn/zh-hans/data/ (accessed on 3 July 2021)). The livestock data were from 1992 to 2017 in different countries collected from the Food and Agriculture Organization of the United Nations and Statistical Yearbook. We resampled all data mentioned above to a 0.08° resolution with the Albers equal-area conic projection and the World Geodetic Systerm1984 (WGS1984) coordinate system.

2.3. Calculating Actual NPP (ANPP)

The CASA (Carnegie-Ames-Stanford Approach) model is a process model based on the principle of light energy utilization [23,24,25]. The main input factors of the model are photosynthetic active radiation (APAR) and light energy utilization (ε). Among them, the photosynthetic effective radiation (APAR) is estimated by the vegetation index extracted from remote sensing data, and the light energy utilization rate (ε) is the utilization efficiency of the vegetation for the photosynthetic effective radiation reaching the surface. The estimation formula is as follows:
NPP ( x , t ) = A P A R ( x , t ) × ε ( x , t )
where APAR(x, t) is the photosynthetically active radiation absorbed by pixel x in month t (g C·m−2·month−1), and ε(x, t) is the actual light energy utilization rate of pixel x in month t (g C·MJ−1):
A P A R ( x , t ) = S O L ( x , t ) × F P A R ( x , t ) × 0.5
where SOL(x, t) is the total solar radiation (gC·m−2·month−1) at pixel x in month t, FPAR(x,t) is the absorption ratio of the vegetation layer to the incident photosynthetically active radiation, and constant 0.5 is the ratio of the solar effective radiation (wavelength 0.4–0.7 μm) that the vegetation can use to the total solar radiation:
F P A R ( x , t ) = ( N D V I ( x , t ) N D V I i , m i n ) ( N D V I i , m a x N D V I i , m i n ) × ( F P A R m a x F P A R m i n ) + F P A R m i n
where NDVIi,max and NDVIi,min correspond to the maximum and minimum of NDVI of the ith vegetation type, respectively.
ε ( x , t ) = T z 1 ( x , t ) × T z 2 ( x , t ) × W z ( x , t ) × ε m a x
In the formula, Tε1(x, t) and Tε2(x, t) are the stress effects of low and high temperature on light utilization efficiency; Wz(x, t) is the influence coefficient of water stress, reflecting the influence of water conditions; εmax is the maximum light utilization efficiency (g C/MJ) under ideal conditions
T z 1 ( x , t ) = 0.8 + 0.02 × T o p t ( x ) 0.0005 × [ T o p t ( x ) ] 2
T z 2 ( x , t ) = 1.184 / { 1 + exp [ 0.2 × ( T o p t ( x ) 10 T ( x , t ) ) ] } × 1 / { 1 + exp [ 0.3 × ( T o p t ( x ) 10 + T ( x , t ) ) ] }
where, Topt(x) is the optimum temperature for plant growth, defined as the average temperature of the month when the NDVI value of a certain area reaches the highest in a year; when the average temperature of a certain month is less than or equal to −10 °C, the value is 0. The estimation of Tε2(x, t) indicates that when the environmental temperature changes from the optimal temperature Topt(x) to high or low temperature, the light utilization rate of plants will gradually decrease. When the average temperature Topt(x) in a month is 10 °C higher or 13 °C lower than the optimal temperature top (x), the Tε2(x, t) value of that month is equal to half of the Tε2(x, t) value when the average temperature T(x, t) is the optimal temperature Topt(x)
W z ( x , t ) = 0.5 + 0.5 × EET ( x , t ) / EPT ( x , t )
where: EET is the actual regional evapotranspiration (mm); EPT is the potential regional evapotranspiration (mm). The value of monthly maximum light use efficiency (εmax) varies with different vegetation types. In this study, we chose 0.542 gC/MJ as the maximum light use efficiency of grassland [26].

2.4. Calculating Climate NPP (CNPP)

In addition to the FPAR calculation, we also used the CASA model to estimate grassland CNPP. In this study, the leaf area index (LAI) was used to calculate the FPAR, since it can reduce a lot of uncertainty compared with the climate-driven model. The algorithm can be expressed as follows:
F P A R = 1 e k L A I
L A I = L A I min + f S W × f s t × ( L A I max L A I min )
f S t = ( T T min ) ( T T max ) ( T T min ) ( T T max ) ( T T o p t )
f S W = 1 + L S W I 1 + L S W I max
L S W I = ρ N I R ρ M I R ρ N I R + ρ M I R
where k = 0.5; LAImax and LAImin are the maximum and minimum values of LAI in a month; fSW is usually used to estimate the dynamic changes of water-based on remote sensing data; fSt represents the water and temperature stress. Tmax and Tmin represent the maximum and minimum air temperature in a month, respectively, Topt is the optimum air temperature when the vegetation biomass reaches the maximum value. LSWI can be where ρ N I R and ρ M I R are the albedo of the near-infrared and mid-infrared band of the MODIS product (MOD13A2).

2.5. Estimation of Human-Caused NPP (HNPP)

HNPP represents NPP that is caused by human activities. Previous studies showed that the proportion of HNPP can be calculated by comparing the difference between the PNPP and the ANPP [10]. Thus, it is expressed as follows:
H N P P = C N P P A N P P

2.6. Quantitative Assessment Method

In order to distinguish between the contribution of climate change and human activities to grassland degradation and recovery, three types of NPP were calculated. Actual NPP (ANPP) represents the real state of grassland productivity determined by climate and human factors. The positive changing trend of the ANPP means the recovery of grassland, while the negative trend of the ANPP means the degradation expansion. Climate NPP (CNPP) represent the grassland productivity only determined by climate condition, which is a hypothetical state. The positive value of CNPP indicates that climate change in this period is conducive to the growth of grassland, while negative values demonstrate that climate factors are not helpful in grassland growth. A positive value of CNPP indicates the climate change during this period is beneficial to grass growth, whereas a negative value demonstrates that climate change is harmful to grass growth. Human-caused NPP (HNPP) is estimated by the difference between CNPP and ANPP. A negative value of HNPP indicates the human activities are beneficial to grass growth, whereas a positive value demonstrates decline in grass and the occurrence of human-dominated degradation. Accordingly, there are six possible scenarios by the slopes of the ANPP, CNPP, and HNPP (Table 1). Some reported studies demonstrated the utility of this approach [10,27].

3. Results

3.1. Validation of NPP Model

The grassland ANPP simulated by the CASA model in this study was verified based on field survey data collected in August 2015. The detailed geographical information of field observation sites is displayed in Figure 3. The field survey data mainly included open grassland sample data and fenced grassland sample NPP data. The correlation analysis between grassland sample data and modeled ANPP data exhibited a satisfactory estimation (R2 = 0.7553, p < 0.001). The PNPP was validated using the fenced sample NPP data. The fenced observation data were collected from the grazing enclosure sites where grassland ecosystems were undisturbed and have barely been interfered with by humans. Comparisons of the results between simulated PNPP and observed fenced NPP indicated that the PNPP derived from the CASA model showed good agreements with field fenced NPP data (R2 = 0.7219, p < 0.001). This implies that the CASA model has high accuracy and reliability in a simulation of the grassland PNPP.

3.2. The Spatiotemporal Distribution of ANPP

The grassland ANPP of EAS maintain distinct regionalized expression due to its wide range of longitudes (Figure 4). For MGS, the grassland ANPP values was monotonically decreasing from north to south. The high-value areas of grassland ANPP in CHS were mainly distributed in the northeast and south, while the low-value areas were mainly distributed in the northwest and east regions. For CQS, the grassland ANPP values were decreasing gradually from southeast to northwest. In the Kazakh steppe region, the high-value areas of grassland ANPP were mainly distributed in the north and east border area of Kazakhstan, southern Mount Elbrus, and eastern Uzbekistan, while the low-value areas were mainly distributed in the North-Central of Uzbekistan in KOS regions. Histogram analysis was conducted for average annual grassland ANPP in EAS and five sub-regions (Figure 5). The annual ANPP ranged from 43.62 to 50.87 gC/(m2·year) during 2000–2014, with an annual average of 47.36 gC/(m2·year) in the whole EAS. The ANPP of EAS was decreasing, and the decreased ratio was −0.02 gC/(m2·year). Different subregions did not behave comparably. In terms of the overall Kazakh steppe, both KAS and KOS showed a downward trend, with values of −1.14 gC/(m2·year) and −0.26 gC/(m2·year), respectively. Conversely, the grassland in Mongolia China showed an increasing trend. The increasing value of the MGS was the highest (0.73 gC/(m2·year)), followed by CQS (0.33 gC/(m2·year)), and CHS is the lowest, with the value of (0.20 gC/(m2·year)).

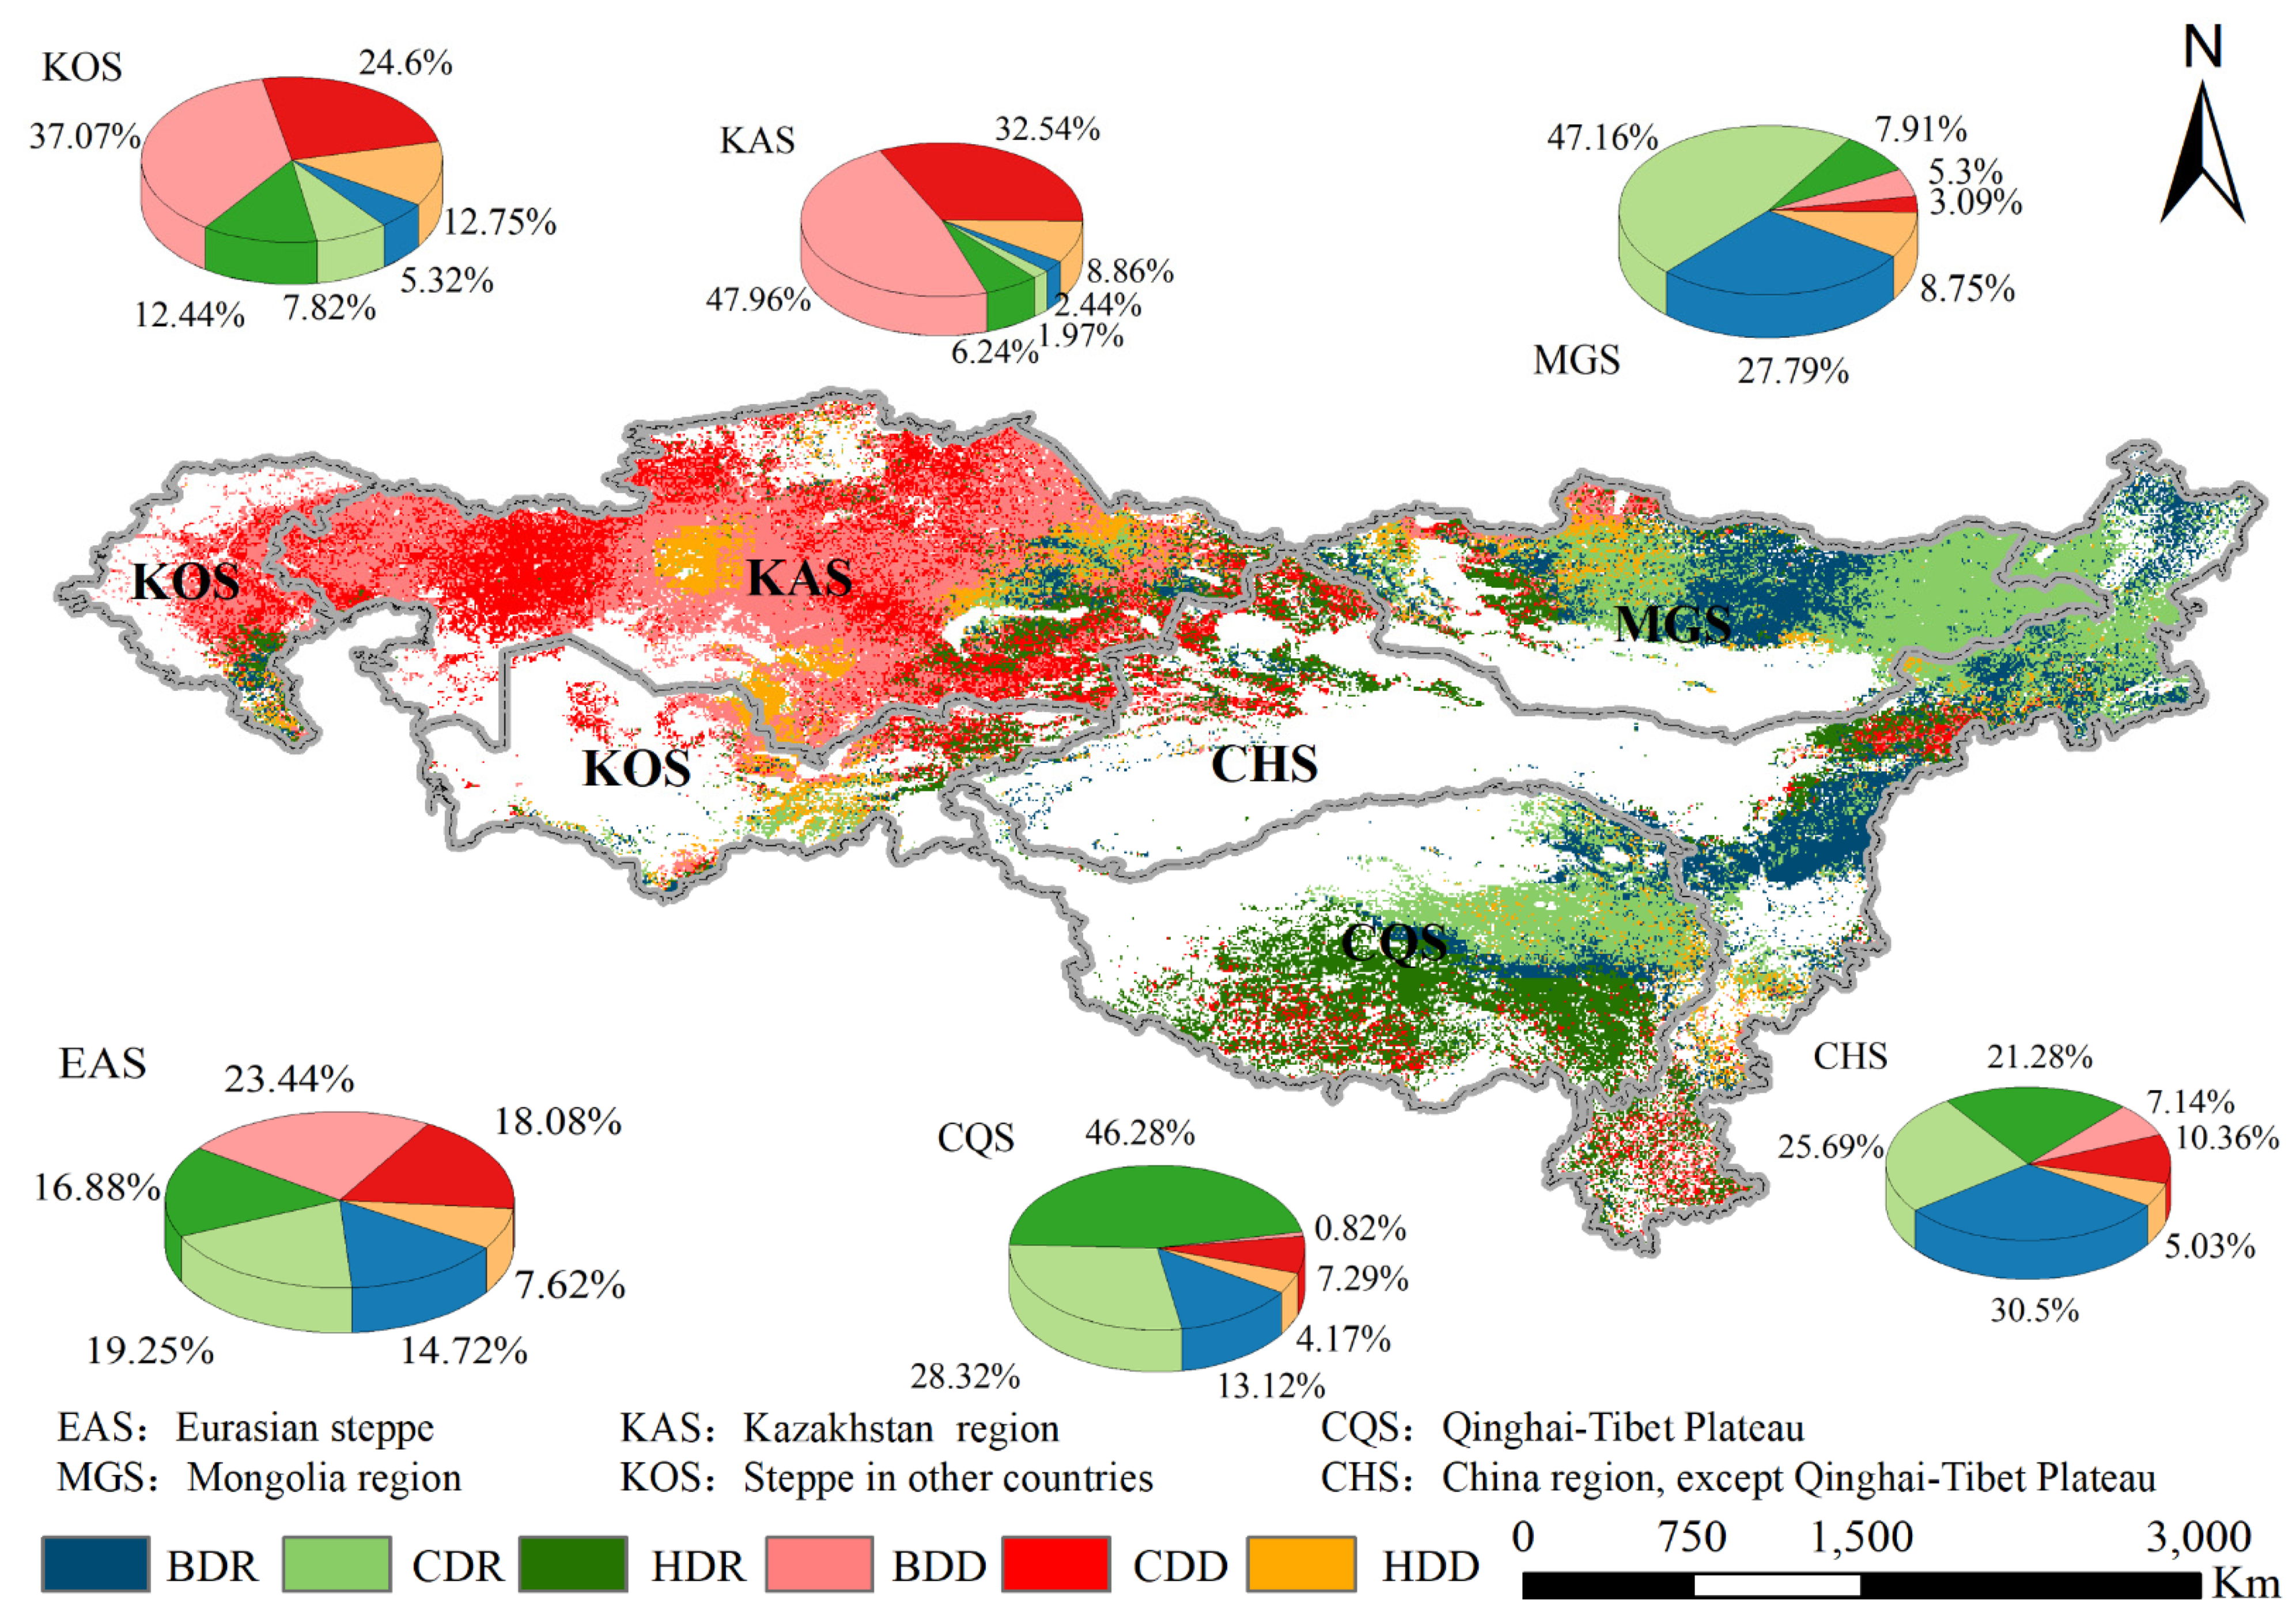
3.3. Analysis of Grassland Degradation and Recovery

The spatial distribution of grassland recovery and degradation in the EAS was assessed (Figure 6). Our findings show that grassland degradation remains a widespread environmental issue in the study area. Generally, restored grassland was extensively distributed in Mongolia and China, while degraded grassland was mainly distributed in Kazakh steppe regions. Degradation caused by human activities dominated distributed areas among north-western MGS, northern and central KAS, and eastern KOS. Degradation caused by climate change distribution was widespread in Kazakh steppe regions. In addition, there was a small grassland degradation section that was caused by human activities in western MGS, and both eastern and western CHS. Recovery grassland regions dominated by human activities were mainly located in central-southern CQS, central-eastern and western CHS, and western MGS. Recovery areas caused by climate change were concentrated in northeastern CQS, northeastern CHS, and eastern MGS. For grassland recovery in the EAS, climate change, human activities, and the combination of two factors accounted for 37.86%, 33.20%, and 28.95% in decreasing order. The grassland recovery in KAS, KOS, and CQS caused by major human activities accounted for 58.60%, 48.61%, and 52.76%, respectively. For MGS, climate change was the main factor that caused grassland recovery, with a value of 56.92%. The grassland recovery in CHS was caused by the combined factors of human and climate major and accounted for 39.37%. For grassland degradation in the EAS, combination, climate change, and human activities accounted for 47.71%, 36.79%, and 15.51% in decreasing order. The grassland degradation in CHS and CQS caused by climate change major accounted for 45.98% and 59.37%, respectively. For MGS, human activities were the main factor that caused grassland degradation, with the value of 51.04%. The grassland degradation in KAS and KOS was caused by the combined factors of human and climate major and accounted for 53.67% and 49.81%, respectively.

3.4. Effects of Climate Variation on Grassland NPP

To explore the effects of climate variables, we analyzed the average annual value of temperature and precipitation in EAS and its sub-regions (Figure 7). Temperature in the EAS showed a weak downward trend, with the value of −0.005 °C/per year. Precipitation has shown a declining trend (−0.373 mm/per year), too. The temporal change of temperature and precipitation in Monglia steppe and Kazakh steppe were less consistent. Specifically, the change trend of climate factors in KAS and KOS were consistent with that in EAS. However, MGS and CHS were experiencing decreasing trend in temperature while rising trend in precipitation. Since the annual average value may not reflect the real situation of the whole region, we perform the correlation analysis between ANPP to meteorological factors on a pixel scale (Figure 8). The results showed the effect of precipitation on productivity is greater than that of temperature (0.37 vs. −0.01). Areas with a positive correlation area between ANPP and temperature valued 11.69%, concentrated on CQS, northern Hovsgol in MGS, central and eastern KAS. Furthermore, areas with a positive correlation between ANPP and precipitation were about 91.24%. There were 12.02% and 8.14% of the grassland regions that showed a significant and extremely significant positive correlation between ANPP and precipitation.

4. Discussion

Natural climate variability and anthropogenic activities are affecting grassland ecosystems worldwide, which basically change regional biogeochemical cycles and ecosystem productivities [28]. This study investigated a general description of grassland degradation in EAS by using satellite, meteorology, and statistic data. Furthermore, we also quantitatively assessed the respective contributions of climate change and human activities. Since the loss of NPP is considered detrimental to the function and carbon sinks of terrestrial ecosystem, it has been widely used to represent the impact of climate change and human activities [10,29,30].
The present study demonstrated that nearly half (48.52 %) of grassland in EAS experienced degenerative processes, joint effects of climate change and human activities contributes most (47.70%), followed by climate change (36.79%), and human activities had the least contributions, with the value of 15.51%. Climate change causes important changes in weather patterns, precipitation distribution, and temperature changes [31]. There have been numerous studies demonstrating that temperature and precipitation are the major climatic factors that drive grassland dynamic change [10,32,33]. Changing of precipitation and temperature will affect distribution of water resources and nutrients, which in turn affect plant photosynthesis, soil respiration, growing status, and even plant distribution [34]. The most significant grassland degradation induced by climate change widely occurred in the Kazakh steppe area. The Kazakh steppe region is a typical arid area, which is sensitive and vulnerable towards climate changes. Because of westerlies and global warming, these regions become more arid with more intense rainfall [35]. In contrast, human activities are relegated in a dominant status of grassland degradation in south Turgay Basin, northwestern Shyghys Kazakhstan, and southeastern Kyzylorda of Kazakhstan. It has been shown that the extraction of mineral resources is the main cause of grassland degradation in south Turgay Basin [36]. Furthermore, grassland degradation in western and southern Kazakhstan was mainly affected by social institutional transformation, abandonment of large state-owned pastures, centralized restriction of grazing, and so on [37,38].
The grassland that presented recovery amounted to 51.48% of total grassland ecosystems in the EAS, mainly distributed in Asia. Climate change is the most important driving factor. Restored grassland was mainly distributed in northeastern Qinghai Tibet Plateau, eastern Mongolia, and northeastern China. It has been reported that grassland has recovered under the redistributed rainfall pattern in the Qinghai-Tibet Plateau and north China [27,30]. Human activities also contributed to grassland recovery in EAS. The effects of human modification in Inner Mongolia, Qinghai–Tibet Plateau in China. and western Mongolia were highlighted. Both Mongolia and China have implemented several effective projects since the beginning of the century to reverse the grassland degradation situation [39]. The primary measures of Mongolia are the Greenbelt Project, the Pastureland Law, and the National Desertification Control Plan. Similarly, China has been implementing the Grain for Green Program and the Returning Grazing Land to Grassland Project [10,40]. There is also a small part of grassland in Kazakh steppe region which shows the trend of human dominated recovery. This is primarily due to the reuse of abandoned state-owned pastures under the recovery of the local economy [41]. Simultaneously, effective ecological recovery measures by incessant effort of the scientific researchers in order to ameliorate the degraded land [42].

5. Conclusions

The relative effects of climate change and human activities on grassland degradation and recovery in EAS were evaluated from 2000 to 2014. Grassland recovery area is larger than that of degradation (51.48% vs. 48.52%). The overall recovery trend is dominated by far. Restored grassland was extensively distributed in Mongolia and China, while degraded grassland was mainly distributed in Kazakh steppe regions. Human activities positively contributed to NPP increases in Mongolia and China, while intensive management regimes and infrastructure development in in Kazakh steppe regions also contributed to grassland degradation. Simultaneously, climate factors positively contributed to NPP increases in Mongolia steppe regions, while it also had a negative influence in Kazakh steppe regions. Our results also showed that precipitation was much more influential on grassland productivity than annual temperature. This study investigated grassland health conditions by using satellite data and meteorology data. The results help provide a scientific basis for the development and modification of prevention and control strategies for climate change and the rational use of grassland.

Author Contributions

Conceptualization, Y.Z. and J.L.; Methodology, Z.W.; Software, Q.W.; Validation, Y.Z., Z.X., and Z.W.; Formal Analysis, J.L.; Data Curation, Y.Z.; Writing—Original Draft Preparation, Y.Z.; Visualization, Y.Z.; Supervision, J.L.; Project Administration, J.L. All authors have read and agreed to the published version of the manuscript.

Funding

This research was funded by the National Key Research and Development project (2018YFD0800201), the second Tibetan Plateau Scientific Expedition and Research Program (STEP), China (Grant No. 2019QZKK0603), the “APN Global Change Fund Project (No. ARCP2015-03CMY-Li & CAF2015-RR14-NMY-Odeh)”, Program by the Australian Agency for International Development (PSLP: No. 64828), the Public Sector Linkages, the project of National Ethnic Affairs Commission of the People’s Republic of China (2019-GMD-034), and the scientific research training program of College of Agriculture and Animal Husbandry, Qinghai University. We are grateful to the editor and anonymous reviewers. We appreciate the Oak Ridge National Laboratory Distributed Active Archive Center (ORNL DAAC) for sharing a series of original remote sensing dataset and Climatic Research Unit in University of East Anglia for sharing a climate dataset. We also appreciate the National Tibetan Plateau Data Center, Institute of Tibetan Plateau Research, Chinese Academy of Sciences in China for sharing global monthly surface solar radiation data.

Institutional Review Board Statement

Not applicable.

Informed Consent Statement

Not applicable.

Data Availability Statement

The data presented in this study are available on request from thecorresponding author. The data are not publicly available due to restrictions of privacy.

Conflicts of Interest

The authors declare no conflict of interest.

References

  1. Dairaku, K.; Emori, S.; Nozawa, T. Impacts of global warming on hydrological cycles in the Asian monsoon region. Adv. Atmos. Sci. 2008, 25, 960–973. [Google Scholar] [CrossRef]
  2. Piao, S.; Wang, X.; Wang, K.; Li, X.; Bastos, A.; Canadell, J.G.; Ciais, P.; Friedlingstein, P.; Sitch, S. Interannual variation of terrestrial carbon cycle: Issues and perspectives. Glob. Chang. Biol. 2020, 26, 300–318. [Google Scholar] [CrossRef] [Green Version]
  3. Voinov, A.; Seppelt, R.; Reis, S.; Nabel, J.E.M.S.; Shokravi, S. Values in socio-environmental modelling: Persuasion for action or excuse for inaction. Environ. Model. Softw. 2014, 53, 207–212. [Google Scholar] [CrossRef] [Green Version]
  4. Golosov, N.V.; Gennadiev, A.N.; Olson, K.R.; Markelov, M.V.; Zhidkin, A.P.; Chendev, Y.G.; Kovach, R.G. Spatial and temporal features of soil erosion in the forest-steppe zone of the East-European Plain. Eurasian Soil Sci. 2011, 44, 794–801. [Google Scholar] [CrossRef]
  5. Goldammer, G.J.; Stocks, B.J. Eurasian Perspective of Fire: Dimension, Management, Policies, and Scientific Requirements; Springer: New York, NY, USA, 2000. [Google Scholar]
  6. Wang, X.; Yang, X.; Liu, T.; Li, F.; Gao, R.; Duan, L.; Luo, Y. Trend and extreme occurrence of precipitation in a mid-latitude Eurasian steppe watershed at various time scales. Hydrol. Process. 2015, 28, 5547–5560. [Google Scholar] [CrossRef]
  7. Neumann, I.; Wigen, E. The importance of the Eurasian steppe to the study of international relations. J. Int. Relat. Dev. 2013, 16, 311–330. [Google Scholar] [CrossRef]
  8. Chen, Y.; Tao, Y.; Cheng, Y.; Ju, W.; Ye, J.; Hickler, T.; Liao, C.; Feng, L.; Ruan, H. Great uncertainties in modeling grazing impact on carbon sequestration: A multi-model inter-comparison in temperate Eurasian Steppe. Environ. Res. Lett. 2018, 13, 075005. [Google Scholar] [CrossRef]
  9. Sun, G.; Mu, M. Nonlinearly combined impacts of initial perturbation from human activities and parameter perturbation from climate change on the grassland ecosystem. Nonlinear Process. Geophys. 2011, 18, 883–893. [Google Scholar] [CrossRef] [Green Version]
  10. Gang, C.; Zhou, W.; Chen, Y.; Wang, Z.; Sun, Z.; Li, J.; Qi, J.; Odeh, I. Quantitative assessment of the contributions of climate change and human activities on global grassland degradation. Environ. Earth Sci. 2014, 72, 4273–4282. [Google Scholar] [CrossRef]
  11. Xu, L.; Samanta, A.; Costa, M.H.; Ganguly, S.; Nemani, R.R.; Myneni, R.B. Widespread decline in greenness of Amazonian vegetation due to the 2010 drought. Geophys. Res. Lett. 2011, 38, 1–4. [Google Scholar] [CrossRef] [Green Version]
  12. Sánchez-Zapata, J.; Carrete, M.; Gravilov, A.; Sklyarenko, S.; Ceballos, O.; Donázar, J.; Hiraldo, F. Land use changes and raptor conservation in steppe habitats of Eastern Kazakhstan. Biol. Conserv. 2003, 111, 71–77. [Google Scholar] [CrossRef] [Green Version]
  13. Chang, X.; Lu, C.; Gao, Y. Impacts of human economic activities on wind and sand environment in Kerqin sandy land. Resour. Sci. 2003, 25, 78–83. [Google Scholar]
  14. Ma, Y.; Fan, S.; Zhou, L.; Dong, Z.; Zhang, K.; Feng, J. The temporal change of driving factors during the course of land desertification in arid region of North China: The case of Minqin County. Environ. Geol. 2007, 51, 999–1008. [Google Scholar] [CrossRef]
  15. Zhang, C.; Wang, X.; Li, J.; Hua, T. Roles of climate changes and human interventions in land degradation: A case study by net primary productivity analysis in China′s Shiyanghe Basin. Environ. Earth Sci. 2011, 64, 2183–2193. [Google Scholar] [CrossRef]
  16. Zhou, W.; Gang, C.; Zhou, F.; Li, J.; Dong, X.; Zhao, C. Quantitative assessment of the individual contribution of climate and human factors to desertification in northwest China using net primary productivity as an indicator. Ecol. Indic. 2015, 48, 560–569. [Google Scholar] [CrossRef]
  17. Guo, B.; Han, B.; Yang, F.; Chen, S.; Liu, Y.; Yang, W. Determining the contributions of climate change and human activities to the vegetation NPP dynamics in the Qinghai-Tibet Plateau, China, from 2000 to 2015. Environ. Monit. Assess. 2020, 192, 663. [Google Scholar] [CrossRef] [PubMed]
  18. Yang, Y.; Wang, Z.; Li, J.; Gang, C.; Zhang, Y.; Zhang, Y.; Odeh, I.; Qi, J. Comparative assessment of grassland degradation dynamics in response to climate variation and human activities in China, Mongolia, Pakistan and Uzbekistan from 2000 to 2013. J. Arid Environ. 2016, 135, 164–172. [Google Scholar] [CrossRef]
  19. Tang, Z.; An, H.; Deng, L.; Wang, Y.; Zhu, G.; Shangguan, Z. Effect of desertification on productivity in a desert steppe. Sci. Rep. 2016, 6, 27839. [Google Scholar] [CrossRef]
  20. Chen, Y.; Ju, W.; Groisman, P.; Li, J.; Propastin, P.; Xu, X.; Zhou, W.; Ruan, H. Quantitative assessment of carbon sequestration reduction induced by disturbances in temperate Eurasian steppe. Environ. Res. Lett. 2017, 12, 115005. [Google Scholar] [CrossRef]
  21. Mohammat, A.; Wang, X.; Xu, X.; Peng, L.; Yang, Y.; Zhang, X.; Myneni, R.B.; Piao, S. Drought and spring cooling induced recent decrease in vegetation growth in Inner Asia. Agric. For. Meteorol. 2013, 178–179, 21–30. [Google Scholar] [CrossRef]
  22. Jiao, C.; Yu, G.; He, N.; Ma, A.; Ge, J.; Hu, Z. Spatial pattern of grassland aboveground biomass and its environmental controls in the Eurasian steppe. J. Geogr. Sci. 2016, 27, 3–22. [Google Scholar] [CrossRef]
  23. Potter, C.; Randerson, J.; Field, C.; Matson, P.; Klooster, S. Terrestrial Ecosystem Production: A Process Model Based on Global Satellite and Surface Data. Glob. Biogeochem. Cycles 1993, 7, 811–841. [Google Scholar] [CrossRef]
  24. Field, C.B. Global net primary production: Combining ecology and remote sensing. Remote Sens. Environ. 1995, 51, 74–88. [Google Scholar] [CrossRef] [Green Version]
  25. Potter, C.; Klooster, S.; Genovese, V. Net primary production of terrestrial ecosystems from 2000 to 2009. Clim. Chang. 2012, 115, 365–378. [Google Scholar] [CrossRef] [Green Version]
  26. Zhu, W.; Pan, Y.; Zhang, J. Estimation of net primary productivity of Chinese terrestrial vegetation based on remote sensing. J. Plant Ecol. 2007, 31, 413–424. [Google Scholar]
  27. Zhou, W.; Gang, C.; Zhou, L.; Chen, Y.; Li, J.; Ju, W.; Odeh, I. Dynamic of grassland vegetation degradation and its quantitative assessment in the northwest China. Acta Oecol. 2014, 55, 86–96. [Google Scholar] [CrossRef]
  28. Horion, S.; Cornet, Y.; Erpicum, M.; Tychon, B. Studying interactions between climate variability and vegetation dynamic using a phenology based approach. Int. J. Appl. Earth Obs. Geoinf. 2013, 20, 20–32. [Google Scholar] [CrossRef]
  29. Ma, T.; Zhou, C.; Tao, P. Simulating and estimating tempo-spatial patterns in global human appropriation of net primary production (HANPP): A consumption-based approach. Ecol. Indic. 2012, 23, 660–667. [Google Scholar] [CrossRef]
  30. Wang, Z.; Zhang, Y.; Yang, Y.; Zhou, W.; Gang, C.; Zhang, Y.; Li, J.; An, R.; Wang, K.; Odeh, I.; et al. Quantitative assess the driving forces on the grassland degradation in the Qinghai–Tibet Plateau, in China. Ecol. Inform. 2016, 33, 32–44. [Google Scholar] [CrossRef]
  31. Hegerl, G.; Zwiers, F.; Stott, P.; Kharin, V. Detectability of Anthropogenic Changes in Annual Temperature and Precipitation Extremes. J. Clim. 2004, 17, 3683–3700. [Google Scholar] [CrossRef] [Green Version]
  32. Gang, C.; Zhou, W.; Wang, Z.; Chen, Y.; Li, J.; Chen, J.; Qi, J.; Odeh, I.; Groisman, P.Y. Comparative Assessment of Grassland NPP Dynamics in Response to Climate Change in China, North America, Europe and Australia from 1981 to 2010. J. Agron. Crop Sci. 2015, 201, 57–68. [Google Scholar] [CrossRef]
  33. Huang, Z.; Yang, H.; Yang, D. Dominant climatic factors driving annual runoff changes at the catchment scale across China. Hydrol. Earth Syst. Sci. 2016, 20, 2573–2587. [Google Scholar] [CrossRef] [Green Version]
  34. Nunes, N.A.; Almeida, A.C.D.; Coelho, C.O.A. Impacts of land use and cover type on runoff and soil erosion in a marginal area of Portugal. Appl. Geogr. 2011, 31, 687–699. [Google Scholar] [CrossRef]
  35. Zhi, G.; Peng, D.; Wen, J.; Cai, Z.; Xu, J. Research on trend of warm-humid climate in Central Asia. IOP Conf. Ser. Earth Environ. Sci. 2017, 74, 012017. [Google Scholar]
  36. Karnieli, A.; Gilad, U.; Ponzet, M.; Svoray, T.; Mirzadinov, R.; Fedorina, O. Assessing land-cover change and degradation in the Central Asian deserts using satellite image processing and geostatistical methods. J. Arid Environ. 2008, 72, 2093–2105. [Google Scholar] [CrossRef]
  37. Megoran, N. Prospects for Pastoralism in Kazakstan and Turkmenistan: From State Farms to Private Flocks-Edited by Carol Kerven. Geogr. J. 2006, 172, 78. [Google Scholar] [CrossRef]
  38. Lai, C.; Yan, H.; Du, W.; Hu, Y. The Variations and Causes of Grassland Distribution in Kazakhstan from the Global Land Cover Datasets. J. Geo Inf. Sci. 2019, 21, 372–383. [Google Scholar]
  39. Zhang, Y.; Wang, Q.; Wang, Z.; Yang, Y.; Li, J. Impact of human activities and climate change on the grassland dynamics under different regime policies in the Mongolian Plateau. Sci. Total Environ. 2020, 698, 134304. [Google Scholar] [CrossRef]
  40. Shi, H.; Zhou, X.; Meng, F.; Bai, H. Mongolia and Inner Mongolia LUCC Regional Differentiation Over the Past 30 Years. J. Geo Inf. Sci. 2013, 15, 719–725. [Google Scholar] [CrossRef]
  41. Gupta, R.; Kienzler, K.; Martius, C.; Mirzabaev, A.; Ikramov, R. Research Prospectus: A Vision for Sustainable Land Management Research in Central Asia. ICARDA 2009, 1, 84. [Google Scholar]
  42. Mirzabaev, A. Land Degradation and Sustainable Land Management Innovations in Central Asia. In Technological and Institutional Innovations for Marginalized Smallholders in Agricultural Development; Springer: Cham, Switzerland, 2016. [Google Scholar]
Figure 1. Geographical location, elevation, and subregion division of the Eurasian steppe.
Sustainability 13 05887 g001
Figure 2. Map of the sub-region divisions, grassland distribution, and location of sampling sites.
Sustainability 13 05887 g002
Figure 3. Comparison of measured and estimated NPP and CASA model inversion in grassland.
Sustainability 13 05887 g003
Figure 4. Spatial distribution of mean actual NPP in Eurasian Steppe from 2000 to 2014.
Sustainability 13 05887 g004
Figure 5. Temporal distribution of mean ANPP in Eurasian Steppe from 2000 to 2014. (Green histogram represent average annual value of ANPP, Red lines represent linear equation trend of corresponding ANPP).
Sustainability 13 05887 g005
Figure 6. Spatial distribution of grassland degradation and recovery in Eurasian Steppe from 2000 to 2014. (BDR: Co-work of two factors dominated grassland recovery, CDR: Climate-dominated grassland recovery, HDR: Human activities-dominated grassland recovery, BDD: Co-work of two factors dominated grassland degradation, CDD: Climate-dominated grassland degradation, HDD: Human activities-dominated grassland degradation).
Sustainability 13 05887 g006
Figure 7. Temporal distribution of mean annual temperature and mean annual precipitation in different regions from 2000 to 2014.
Sustainability 13 05887 g007
Figure 8. Spatial distribution of the correlation coefficient between ANPP and meteorological factors (A) temperature, (B) precipitation from 2000 to 2014.
Sustainability 13 05887 g008
Table 1. Scenarios to assess the role of factors about climate and human activities in grassland healthy conditions.
ScenarioSlopeANPPSlopeCNPPSlopeHNPPGrassland ConditionRoles of Factors about Climate and Human Activities
S1+++RecoveryClimate-caused recovery (CDR)
S2Human activities-caused recovery (HDR)
S3+Both two factors caused recovery (BDR)
S4DegradationClimate-caused degradation (CDD)
S5++Human activities-caused degradation (HDD)
S6+Both two factors caused degradation (BDD)
Publisher’s Note: MDPI stays neutral with regard to jurisdictional claims in published maps and institutional affiliations.

