3.1. The Framework of Mining Dynamic Capital Structures and Company Performance
As shown in
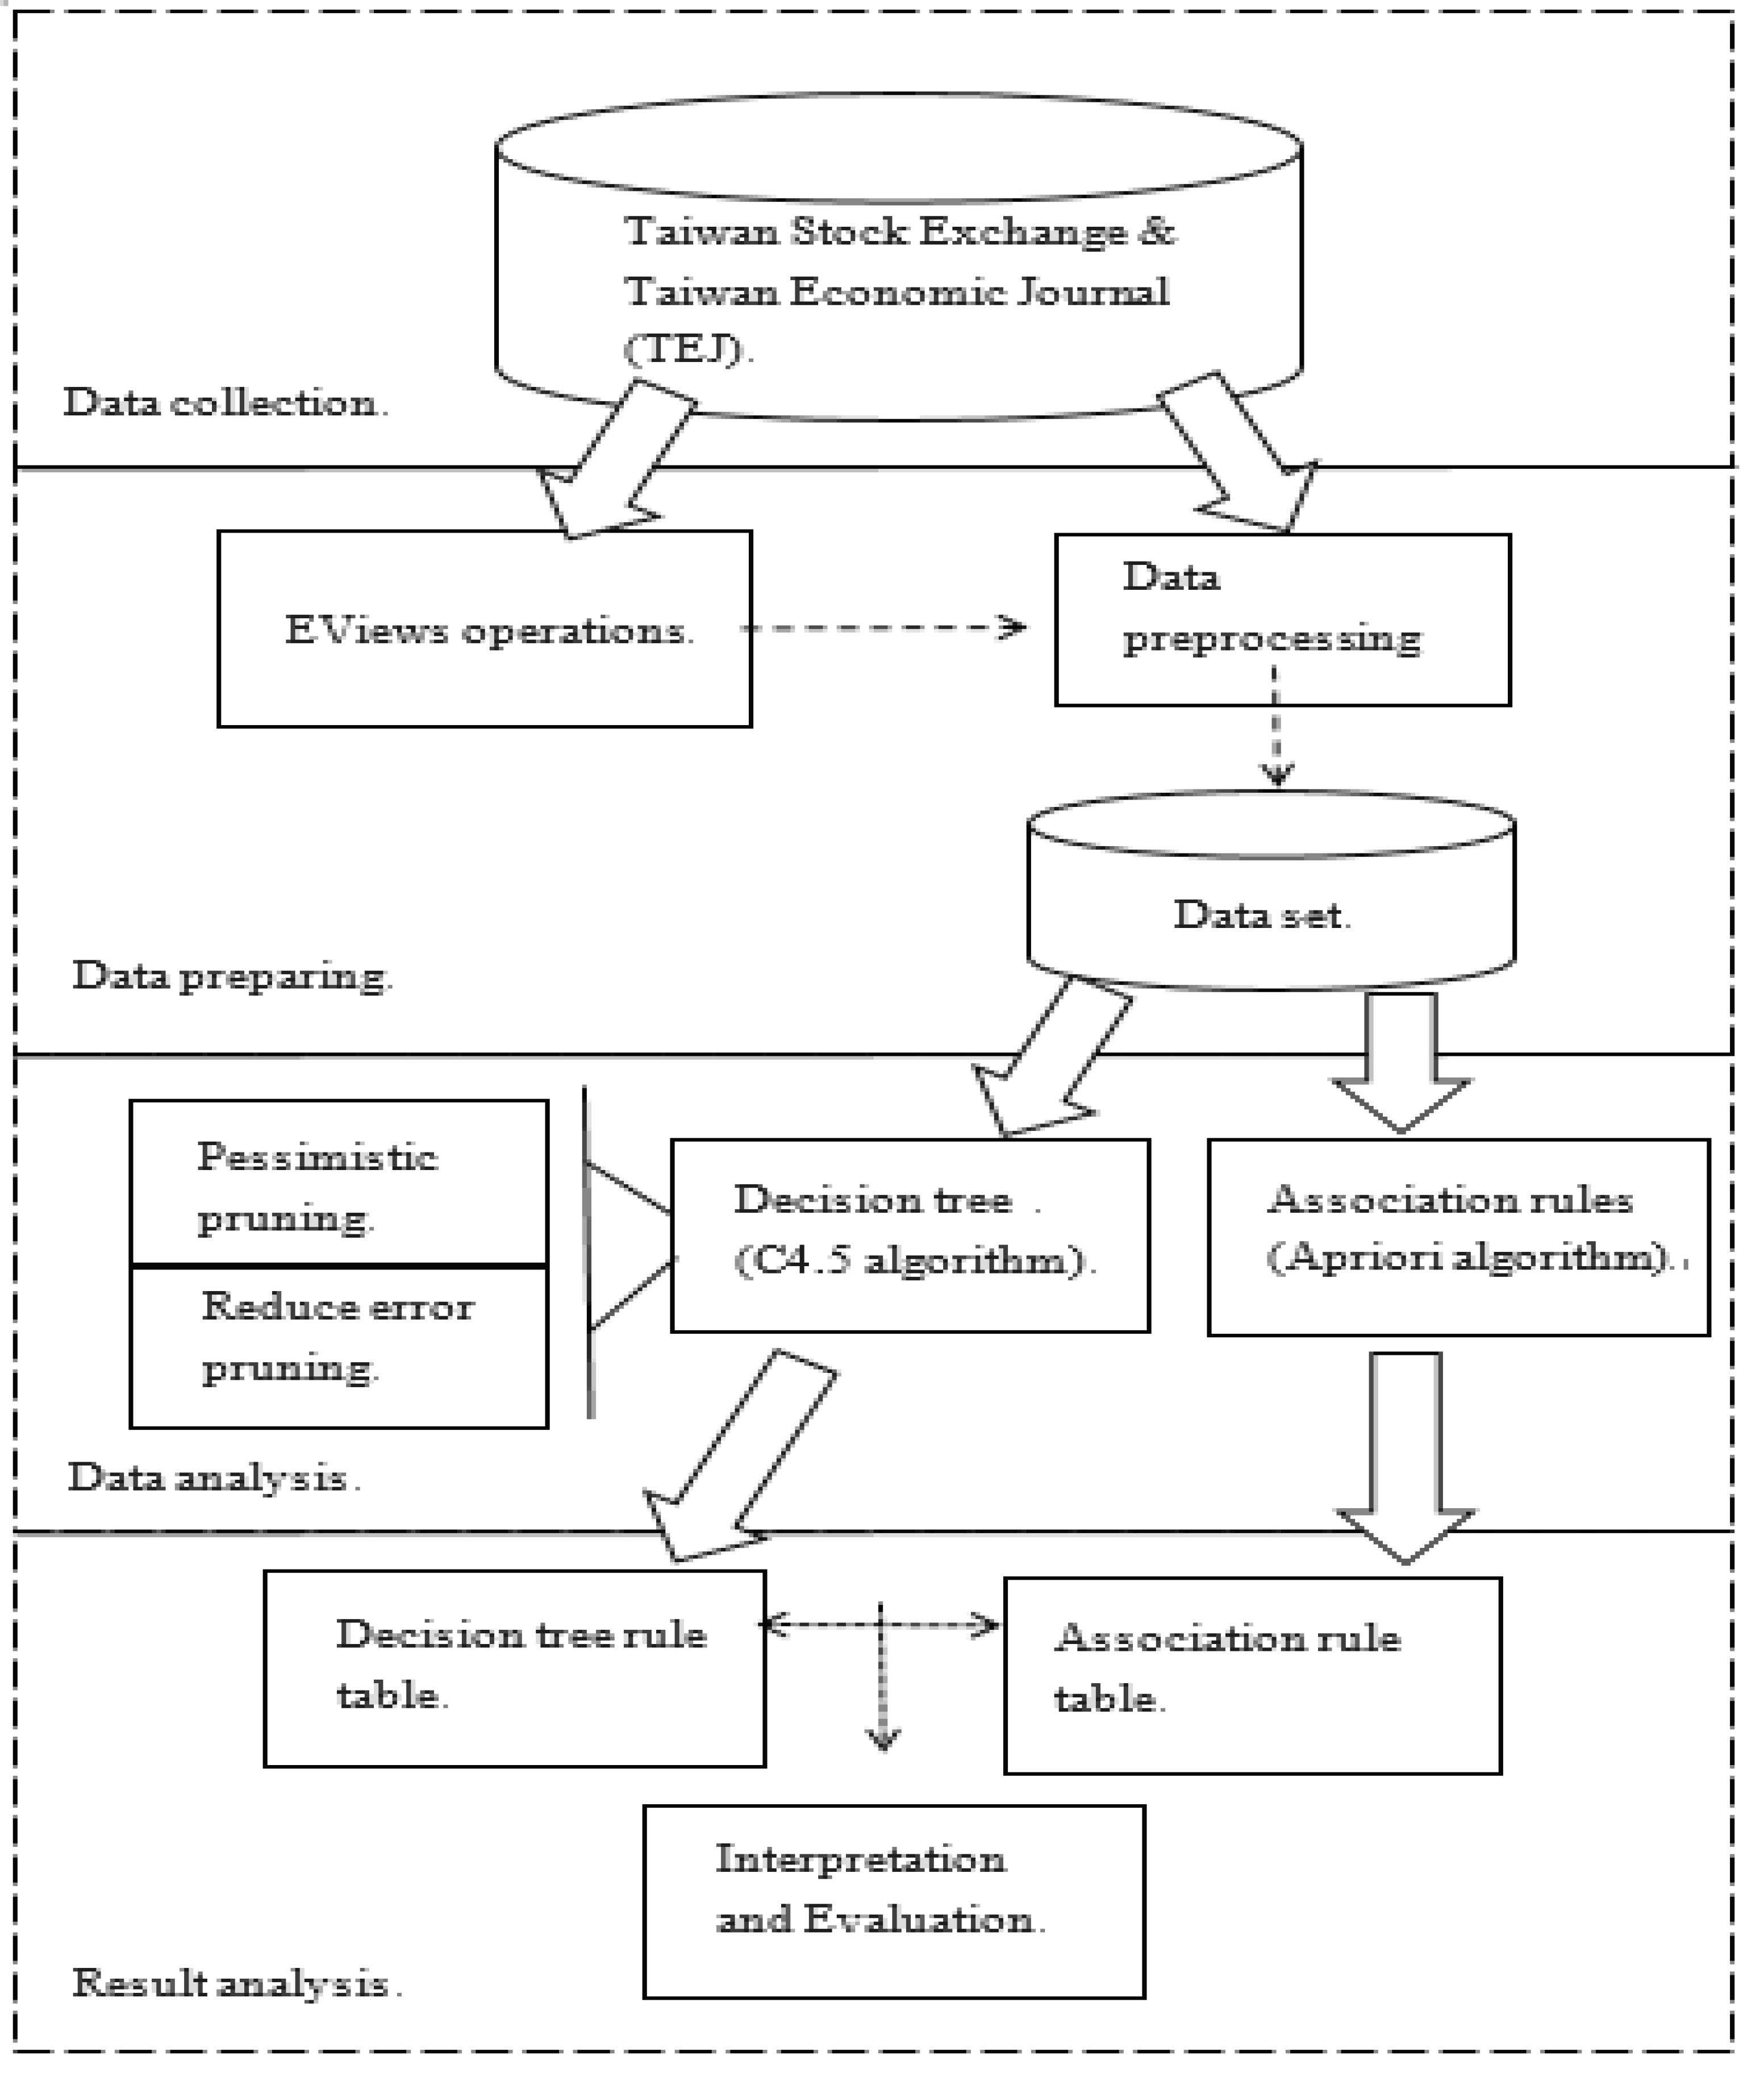
Figure 1, this study uses data mining techniques and algorithms in the software Weka 3.8 to study the relationship between the company’s dynamic capital structure and company performance. It is expected to provide companies with more efficient capital investment decisions and investors with investment decisions. The framework of this research mainly includes the following four parts:
1. Data preprocessing:
The collected data are filtered, and then the parts that do not meet the conditions or incomplete data are deleted. The data are converted into data types that can be used by subsequent analysis.
2. Decision tree analysis:
The pre-processed data is analyzed by using the J48 classifier established by the C4.5 algorithm [
29] in Weka 3.8, see the
Appendix A. Before performing decision tree analysis, the original data are divided into two parts. One part is used as a training set for building the model, and the other is used as the test set for testing the accuracy of the model.
3. Analysis of association rules:
Analysis of association rules is mainly used to mine rules hidden in huge data sets. In order to avoid generating a number of rules which is too large, or rules that do not have substantial meaning, association rules usually need to be performed according to coverage (support) and accuracy (confidence) to prune. In this study, Weka 3.8′s Apriori algorithm is used to set the threshold of support at 10% and the threshold of confidence at 85%. This algorithm is used to iteratively operate based on the threshold of support and the threshold of confidence.
4. Interpretation and evaluation of the results:
Interpreting the rules generated by the C4.5 algorithm or the Apriori algorithm [
30], if any rule that is generated by both the algorithms, it means that the value of the rule is high. Finally, it is evaluated whether each rule is useful.
3.2. Definition of Variables
The definitions of each variable are summarized in
Table 1.
First, dependent variables:
(1) Tobin’s Q
Because Tobin’s Q can better reflect the time value of intangible assets and money, it is commonly used to measure market performance and growth opportunities [
31,
32,
33]. Tobin’s Q refers to the ratio of the company’s equity and the market value of liabilities to the replacement cost of its assets. However, the market value of liabilities and the replacement cost of total assets are difficult to obtain [
19].
According to Tobin’s Q theory proposed by James Tobin [
19], when the ratio is greater than 1, it means that the company’s stock price is higher than the issue cost and investors have higher willingness to invest. Therefore, “1” is used as the classification standard.
(2) Return on assets (ROA)
Return on assets is often used as one of the indicators of a company’s operating performance and also represents the company’s own profitability. Compared to Tobin’s Q, the return on assets is more focused on the performance of internal operating capabilities. The rate of return on assets can be divided into an investment perspective and an accounting perspective. The former’s formula is the net profit before interest and taxes divided by the total assets, which represents the investor’s rate of return.
The economic meaning of the formula in
Table 1 is how much profit a company can create by using every 1 dollar of assets. Generally, the return on assets is regarded as a boundary of 5%, and more than 5% means that the company has a good competitive advantage. However, because the average return of the sample in this study is high, the average of 12% is used as the boundary.
(3) Return on equity (ROE)
Same as return on assets, return on equity is one of the indicators used to analyze profitability. The economic meaning of the above formula is how much profit a company can create by using every 1 dollar of capital.
Second, the independent variables:
(1) Debt ratio (DR)
In the relevant literature on capital structure, there are many different views on the measurement of debt ratios. For example, Titman and Wessels [
20] proposed that the book value should be used to measure debt ratios. The argument is that it is difficult to obtain market value data. There is a high correlation between book value and market value, so using book value does not make much difference.
(2) The speed of adjustment (δ)
If the company observes the difference between the debt ratio and the previous year’s debt ratio, and the target debt ratio and the previous year’s debt ratio are equal, the adjustment speed is 1. When the adjustment speed is greater than 1, it means that the company is over-adjusting. On the contrary, if the adjustment speed is less than 1, it means that the adjustment is insufficient. Its value can be used as the adjustment speed for each period. The average value of 0.1 is used as the boundary on the speed of adjustment in this study.
Third, control variables:
(1) Ages (AGE)
The year of establishment of a company (AGE) usually serves as a proxy for its life cycle. The life cycle of a company will not only indirectly affect the adjustment of the capital structure, but also affect the business performance of the company. With reference to the past literature’s method of distinguishing the life cycle stages, the growth period is less than 10 years, the mature period is 10 to 30 years, and the decline period is more than 30 years.
(2) R&D expense ratio (R&D)
The increase in R&D expenditure in a company has a positive relationship with Tobin’s Q. Therefore, this study takes the R&D expense ratio as the control variable.
(3) Dividend payment rate (DIVIDEND)
It is believed that the agency costs problem, the conflict of interest between shareholders and creditors and between shareholders and insiders, can be reduced through the distribution of dividends. The dividend distribution rate will indirectly affect company performance, so the dividend payment rate is included as one of the control variables.
(4) Price-earnings ratio (P/E ratio)
Price-earnings ratio is one of the benchmarks for investors to estimate the stock price. The concept is that the investor can expect to earn back the number of stocks purchased within the company’s profitability. This study uses the P/E ratio as one of the factors to explain company performance.
(5) Stock price-to-book-value ratio (PBR)
When a company’s profitability is unstable, investors cannot use the P/E ratio to measure the future profit or loss of the stocks purchased. Investors usually use the PBR as the basis for judgment. Generally speaking, when the PBR is less than 1, it means that it is cheaper and you can consider buying it.
(6) Economy boom indicator (ECON)
Since a company’s operating performance may be affected by the overall economy and boom cycle, the economic boom indicator is added as one of the control variables. This study uses the monthly average value in the changing rate of the stock price index as the economic boom indicator.


