1. Introduction
Urban forests and vegetation are of crucial importance for modern towns, because they provide a wide range of ecosystem services that increase citizens’ quality of life. They are also an important part of the urban ecological system, which plays an important role in protecting the urban ecological environment [
1]. Vegetation in general has a multitude of urban ecosystem functions [
2] and provides multiple benefits for city-dwellers. It makes cities more resilient to atmospheric conditions, sudden climate changes, and the occurrence of thermal islands [
3,
4,
5,
6]. The overall urban vegetation inside the city borders (individual trees, parks, and forest communities) affects the physical environment of the city. It aids the selective absorption and reflection of incident radiation and also regulates the exchange of permanent and sensible heat [
7,
8]. Urban vegetation reduces the potential for creating surface urban heat islands, while the removal of vegetation areas contributes to creating them [
9,
10]. Furthermore, the spatial distribution and density of forest and vegetation cover within city borders is recognized as a major factor influencing numerous biophysical processes in the urban environment [
11,
12].
In addition to conventional in situ measurement, which involves sampling by field measurement, satellite multispectral imagery and remote sensing methods can provide an effective, fast insight into the current state of urban vegetation [
13,
14] over a much larger area without physical contact. Identifying and monitoring the state of (urban) vegetation on land surfaces using remote sensing imagery depends on the spectral signatures of vegetation on multispectral images [
15,
16]. As a result, spectral variations provide fairly precise spatiotemporal information in monitoring changes in vegetation cover and conditions, often at quantitative levels [
17]. The increasing availability of high-resolution satellite images (for example, Sentinel-2) and remote sensing applications for monitoring and assessing urban forest and vegetation areas, provides different options. Remote sensing methods can provide good assessments of vegetation characteristics [
18,
19,
20]. Contemporary remote sensing methods are extremely convenient for forest and urban vegetation information acquisition [
21], analysis [
22,
23], and mapping [
24,
25]. The authors of [
25] concluded that high temporal satellite imagery (for example, Sentinel-2), proved to be an accurate solution for coarse scale vegetation identification and monitoring and showed good acquisition repetitiveness. The spatial resolution of the Sentinel-2 sensor is sufficient to detect significant spatial and temporal variations in urban vegetation [
20,
26]. It could therefore be useful in urban forest and vegetation management and for assessing its condition and health. Forest health, a more formal, scientific term, is normally used in forestry to describe the forest stand condition [
27]. The term appeared in the forestry literature between 1980 and 1990 [
28,
29], but there was no widely accepted definition for almost 10 years. The authors of [
30] integrated definitions of the forest, ecosystem, and health and finally defined forest health as the condition of forest ecosystems that sustains their complexity while providing for human needs [
27]. Monitoring urban forest health is very important at the present time, when increased urbanization, climate change, and natural disasters are impacting vegetation negatively [
31,
32].
While terrestrial evaluation of forest health is time consuming, satellite remote sensing allows low-cost, time effective, continuous monitoring and evaluation of vegetation conditions over large areas [
33,
34,
35]. Optical remote sensing of vegetation (in general) is based on the spectral response of the vegetation. Vegetation spectral characteristics arise from the interaction of solar radiation with cell structure, chlorophyll, and other pigments [
36]. The amounts of pigments reflect the damage level, and as the damage level increases, the amount of chlorophyll decreases [
37,
38,
39]. Based on these principles, calculations of vegetation indices have been developed to monitor vegetation condition [
40]. Rather than calculating single vegetation indices and their classifications, the current trend in this field favors applying time series and identifying trajectories or functions in datasets [
36]. A comprehensive utilization of eight forest change detection algorithms was published by [
41]. Landsat satellite scenes have been used for forestry monitoring and analysis for decades [
42,
43]. Their use increased significantly after the deployment of the free data policy in 2008 [
44]. Long-term Landsat missions have enabled the cheap development of long time-series of satellite products, suitable for change detection [
43,
45,
46]. The same data policy was adopted by the ESA for Sentinel data within the Copernicus program [
36]. Sentinel optical data, with an even higher spatial resolution, represent a unique data source suitable for forest vegetation monitoring and the assessment of vegetation conditions [
39,
47,
48,
49].
In a review paper by [
19], the authors stressed the need to recognize the importance of urban forest ecosystems. The need for appropriate installation and sustainable management of urban forests in order to maintain environmental health and improve the quality of urban life was also expressed [
50,
51]. Successful management of urban vegetation (especially forests) requires timely and accurate information on status, trends, and information on interactions between socio-economic and environmental processes. These processes refer to urban forests that occur in multiple temporal and spatial scales [
52,
53]. Such information can be obtained by random field sampling and visual interpretation of aerial photographs and in situ measurements. However, these are expensive and mostly labor-intensive and time-consuming procedures, and usually cannot provide full coverage of relatively large areas of interest [
54,
55]. In contrast, remote sensing (e.g., high-resolution satellite images) has become a useful observational and analytical tool that offers a fast, scalable, and cost-effective way to assess and quantify urban forest dynamics at different spatiotemporal scales [
56]. The most common method of remote sensing is the use of vegetation indices and supervised classifications to obtain substrates that are subsequently analyzed in a variety of ways [
57,
58,
59]. The authors of [
20] used vegetation indices and a map of LULC changes to isolate and display forest depletion areas in the Bosomtwe Range forest reserve. Similarly, [
60] used the classical image classification algorithms, K-mean and ISODATA, for unsupervised classification and the maximum likelihood classification for supervised classification for the purpose of vegetation extraction from remote sensing imagery. In [
26], a methodological framework for monitoring changes in the extent and canopy density of forest stands was presented. The supervised classification algorithm and normalized difference vegetation index (NDVI) were combined within a GIS environment to quantify the extent and density change of forest cover stands.
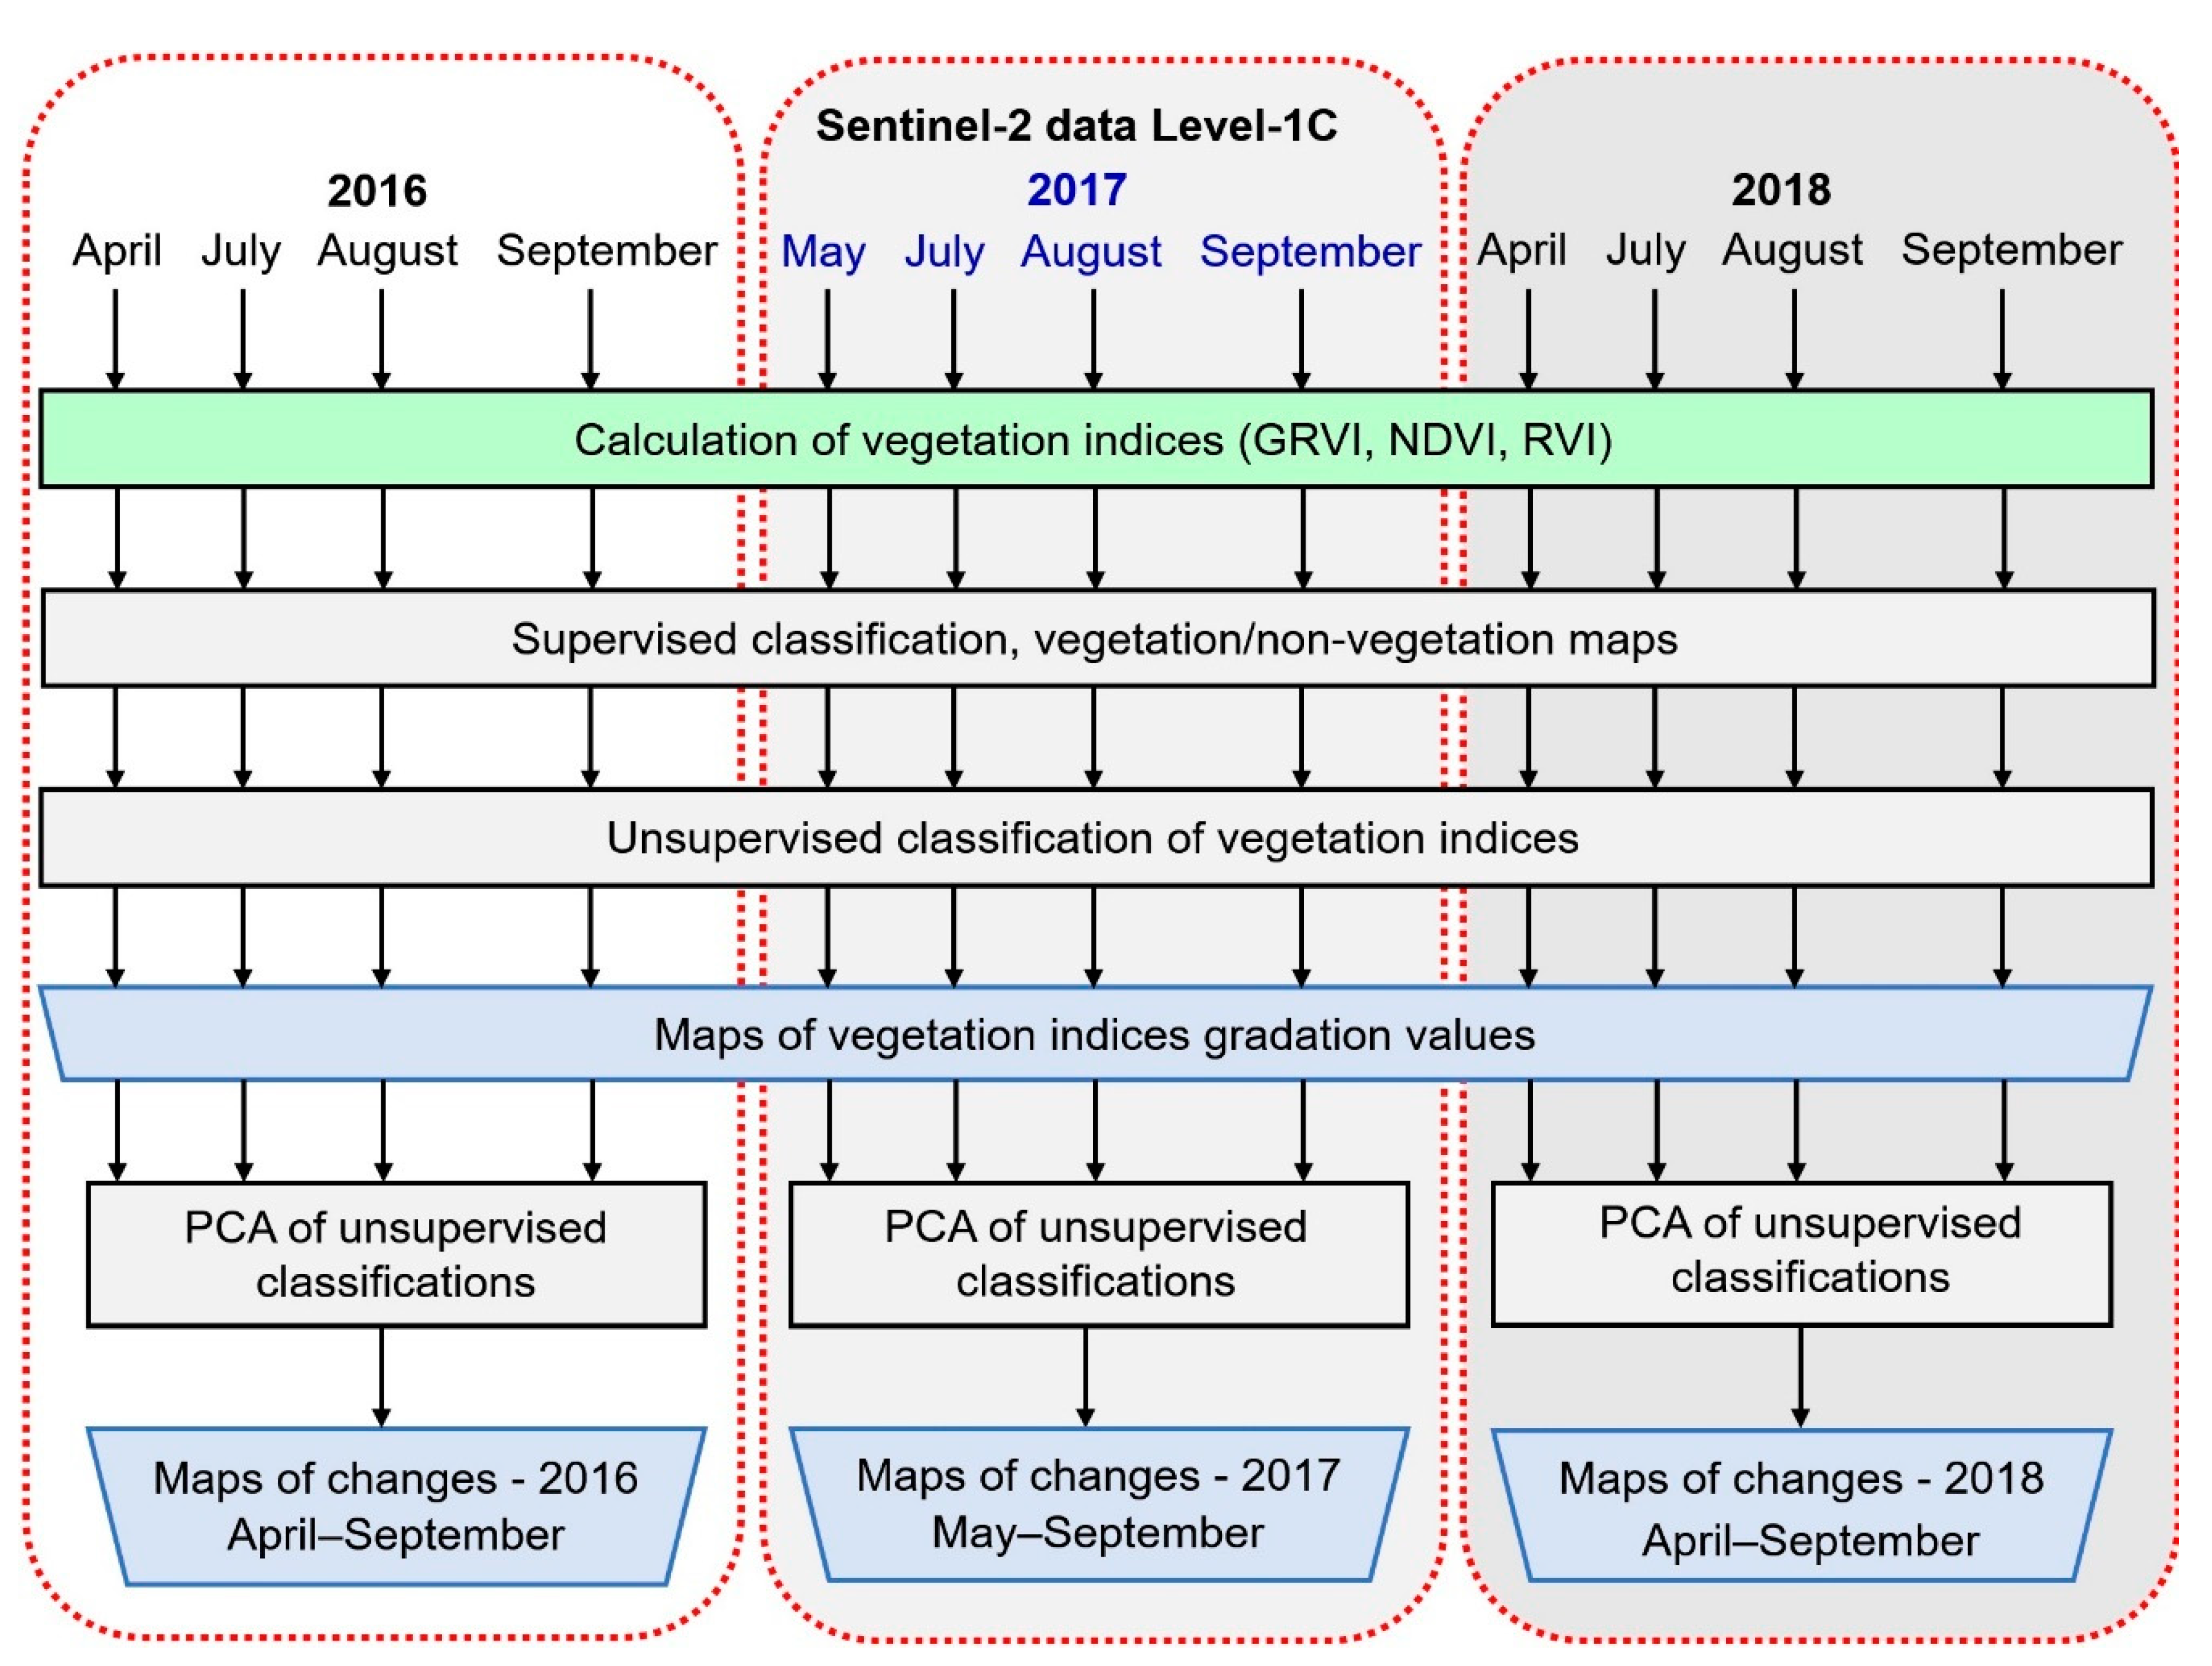
The objective of this paper is to present the framework for spatial and temporal monitoring of urban forest conditions, which relies exclusively on remote sensing methods and can be totally independent of in situ measurements and sensor type. The main idea is to monitor relative changes in the state of urban forest cover over time instead of determining annual changes over large areas using complicated methods [
61,
62,
63]. In this way, trends of the situation in a certain part of the year or the phenological calendar can be monitored and highlighted. In this paper, the preliminary results of the framework for spatiotemporal analysis of urban forest distribution and its condition in the city of Zagreb, Croatia are presented.
In order to detect changes in the state of urban forest cover more effectively, a PCA-based change detection of the results of the classifications was performed. Change detection implies recognizing differences in the representation (current state) of an object or phenomenon by observing it at different times [
64]. Timely change detection of features on the Earth’s surface (in our case, urban vegetation) provides a foundation for understanding better relationships and interactions between humans and natural phenomena, in order to obtain additional data and improve decision-making [
65].
3. Results and Discussion
The main idea of this framework is to fully rely on remote sensing methods for the purpose of monitoring urban forest cover, the dynamics of changes in it, and detecting areas with the lowest values of vegetation indices. In this way, trends in the condition of this cover can be followed over time. Compared to the in situ trait approach, remote sensing sensors are unable to detect all traits and trait variations [
89] except for some, such as biochemical–biophysical, physiognomic, morphological, structural, and functional traits at all levels of biotic organization, based on the principles of image spectroscopy across the electro-magnetic spectrum [
90,
91]. Remote sensing sensors can record the status, stress, disturbances, or resource limitations of vegetation over the short and long term on local and global scales [
91,
92]. These facts were used in creating this framework. The relative relations of the condition of the same species in the same time period are the main indicators for the work of experts in the field of agronomy, forestry, and urban planning. Namely, noticing bad trends in the state of urban forests is a trigger for experts in terms of taking action to prevent such a trend. After noticing such trends, they can go out into the field to perform in situ measurements and additional analyzes to gain insight into the absolute state of vegetation cover and take actions to mitigate or eliminate the problem.
The paper presents the unsupervised classification of vegetation indices as a novel way of presenting the values that can serve as an indicator for assessing vegetation health status. Since each of the spectral indices presents vegetation in a different way, it might be described as a kind of data fusion for improving their usage and information. This paper focuses on representations of remote sensing methods and their preliminary analysis. Forestry experts’ interpretations of the results were not included in this review and are necessary in further research.
3.1. Supervised Classification Outputs
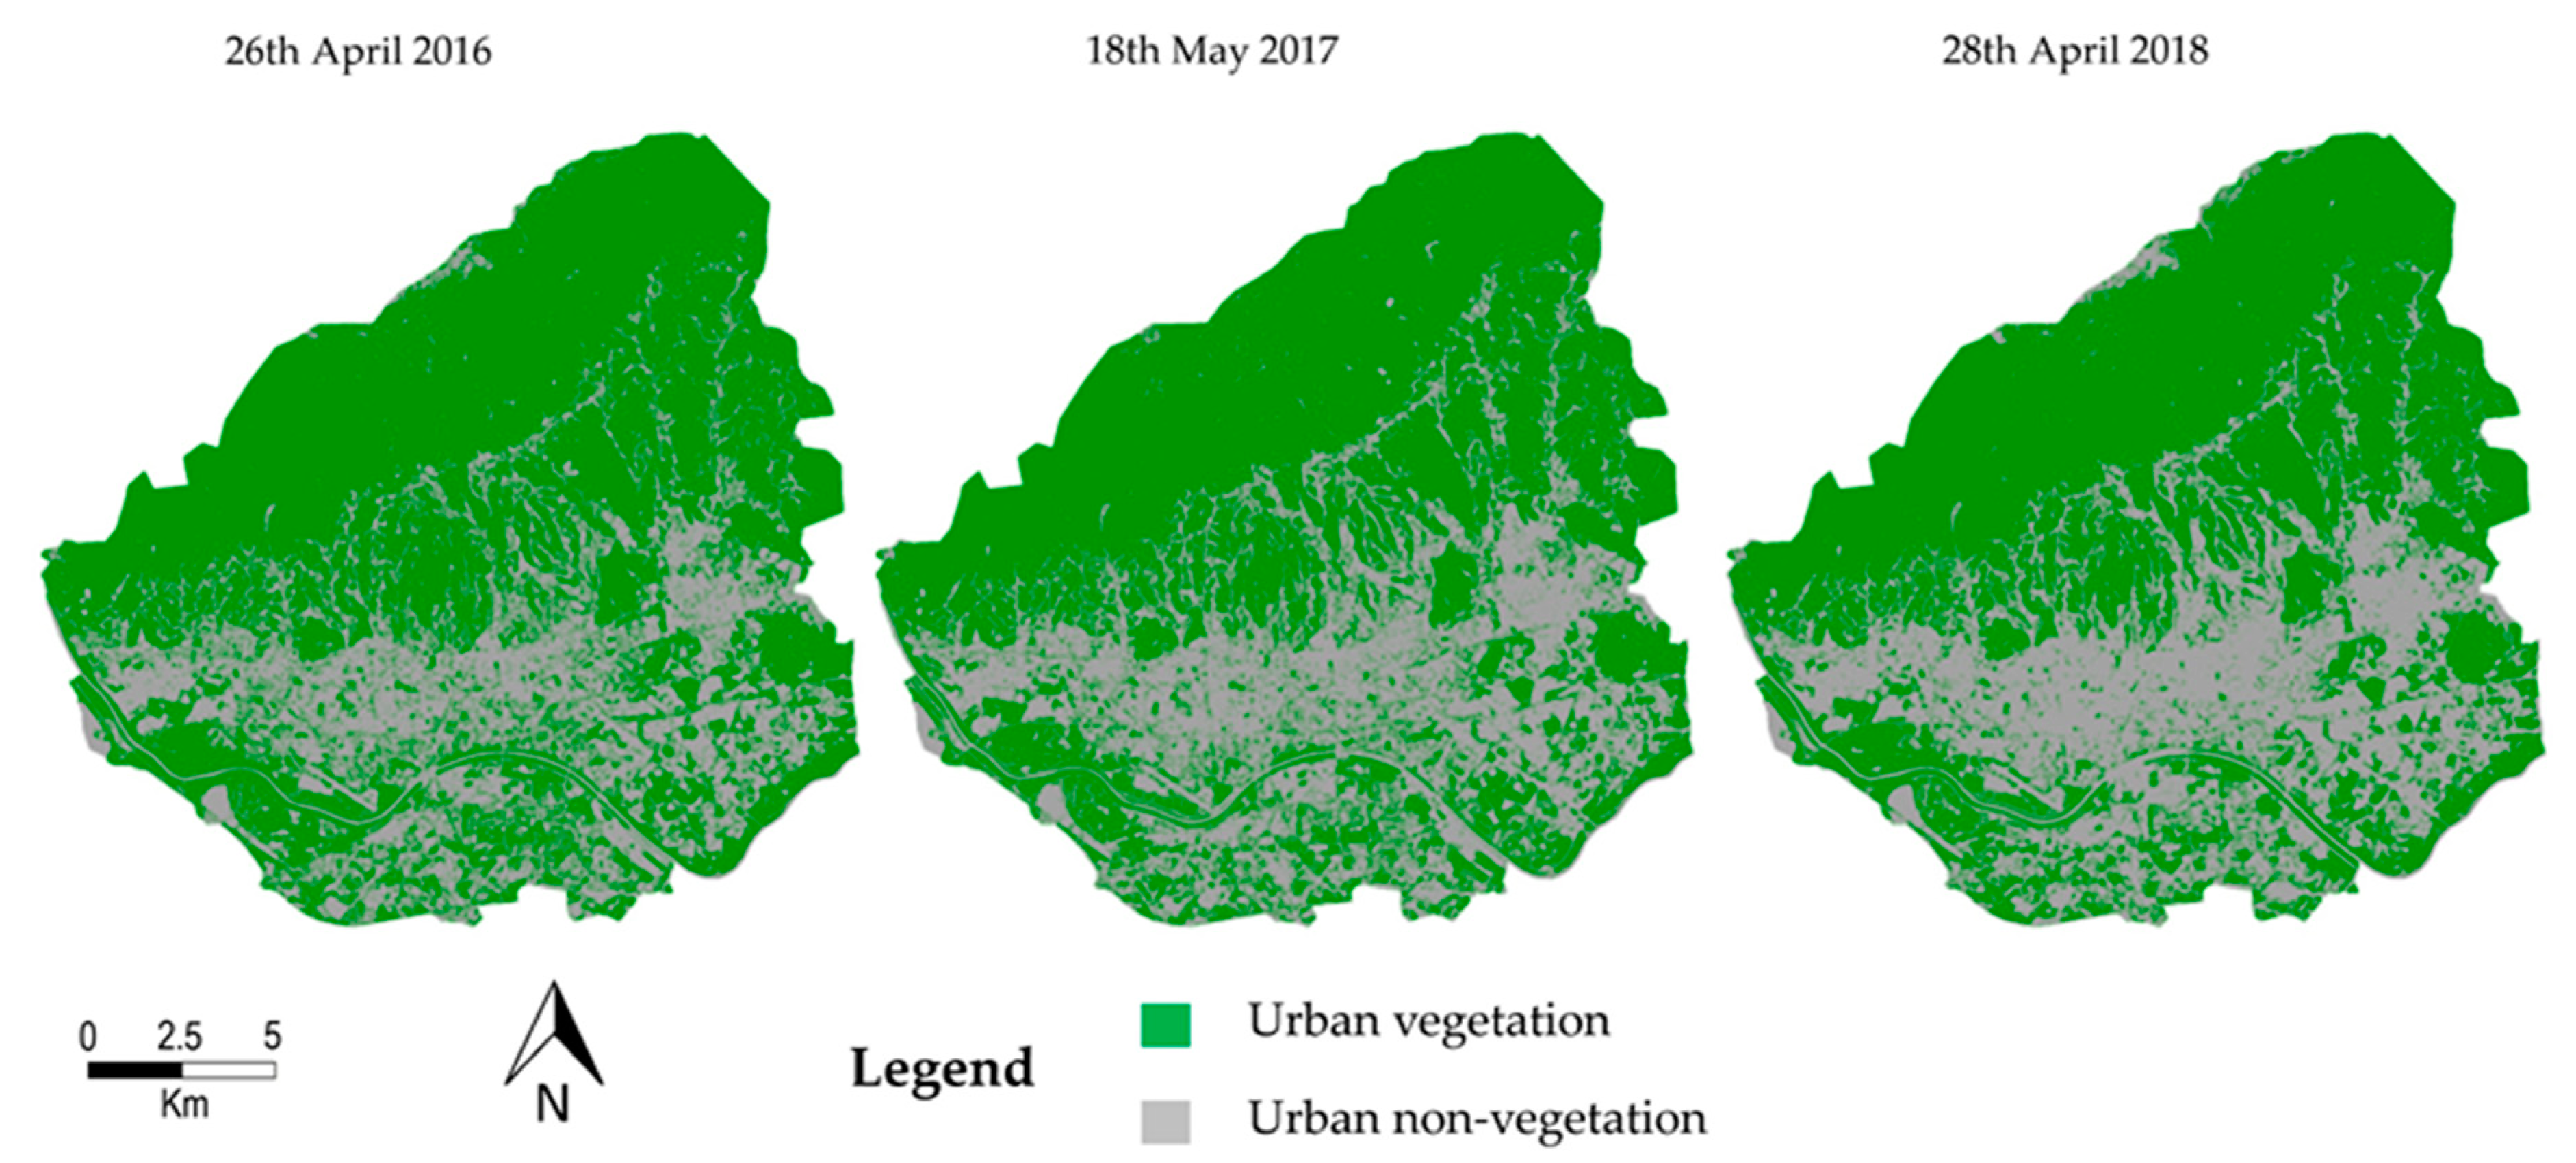
Class samples were visually selected urban vegetation (all types: grassed areas, shrubs, trees, agricultural land) and urban non-vegetation polygons (built-up areas, bare land, and water). The pixels inside the sample polygons were used to perform the classification of each Sentinel-2 set of bands (only bands 2, 3, 4, 5, 6, 7, 8, and 8a, with 10 and 20 m spatial resolution and all vegetation indices were used for supervised classification) and for each date (a total of 12 classifications). The accuracy of vegetation cover classification ranged from 95 to 97%. Selected time series Sentinel-2 imagery was then clipped to the city administrative boundary (
Figure 3). The urban vegetation cover was extracted by merging all vegetation classes in one class, and all other areas were merged in a second class (urban non-vegetation) with no data value attached. All further processing was carried out only on the surface covered by urban vegetation.
The results of the classifications were averaged over the years and showed the decrease in the urban vegetation and increase in the non-vegetation cover in the city of Zagreb from year to year (
Table 3).
3.2. Vegetation Indices Analysis
The value of NDVI ranged from −1 to 1; however, because the value ranges for RVI and GRVI depended on the pixel values in the channels used, there were no fixed ranges.
The NDVI (
Figure 4,
Table 4) scale varied within a range from 0.183 to 0.938, where the standard deviations were of the smallest scale in comparison to the three indices used; therefore, the smallest variable of the vegetative coverage at the scene is shown. Although the NDVI detected water bodies and bare soil (non-vegetation areas), it did not distinguish forest and domestic vegetation types, so it was not suitable for classifying areas with dense green vegetation. By analyzing the averaged mean values (
Figure 5a,b), it was confirmed that the NDVI had very similar seasonal variations along with the middle values of the RVI, because both depend on the values of the same spectral channels, i.e., red and near-infrared. By observing the mean values, it was noticeable that they continuously decreased in 2017 (May to September), whereas in 2016, the value was almost constant until August, when it radically decreased. In 2018, there was a significant decline in the value between July and August (
Figure 5c). Scrutinizing the absolute minimum, variation on a much bigger scale was noticeable, which points to the enlarged capability of the NDVI regarding the recognition and gradation of poor vegetation. In contrast, analyzing the maximum showed much less variation, which points to the familiar trait of satiation of the NDVI, i.e., its reduced ability to extract details from areas of thriving vegetation.
The span of RVI values (
Figure 4,
Table 4) was the highest in comparison to the two other indexes in the observed period from 2016 to 2018 (1.447–27.785). One consequence of this was the highest values of standard deviation, meaning that this index displayed the highest variability of vegetation cover. When analyzing the averaged mean values, it was noticeable that they continuously decreased in 2017 (although with a milder decline than NDVI). The values recorded in 2016 also produced similar results; the values were similar in April and August, while those in July were smaller. There was also a continuous drop of values in 2018, with a radical decrease between July and August (
Figure 5d). Minimum values were approximately constant during all the observed months. Maximum values, however, varied much more, with a radical increase in August 2016 (27.785). The maximum values of RVIs during 2018 followed a similar trend as the corresponding average values. Similar maximum values were recorded during April and July (about 27) and August and September (about 19). April, on average, represented the period of local maximum vegetation. As the months of May and June were not included in this survey, the exact appearance of the average curve could not be determined for the indicated period. However, there was a slight decrease in vegetation intensity between April and July. The annual decline in mean RVI began in August and was further compounded by the climatological arrival of autumn in September.
The value range of GRVI (
Figure 4,
Table 4) was slightly smaller than for RVI (1.459–21.262). The middle and extreme GRVI values were generally lower than the corresponding RVI values. This was a consequence of the fact that the leaves of healthy vegetation reflect green radiation more strongly than red. Accordingly, the ratio between reflected infrared and green radiation was lower than the ratio of reflected infrared and red radiation. With this index, mean values increased continuously from April to August 2016 and then rapidly decreased. The same was true in 2017, with growth from May to July and then a continuous decrease until September. In 2018, the decreases occurred in steps (
Figure 5e). At the maximum, greater variation was observed than at the minimum. The GRVI effectively diagnosed the distributions of agricultural vegetation and forest areas, but often failed to discern cropland (at the edges of the city’s southern borders).
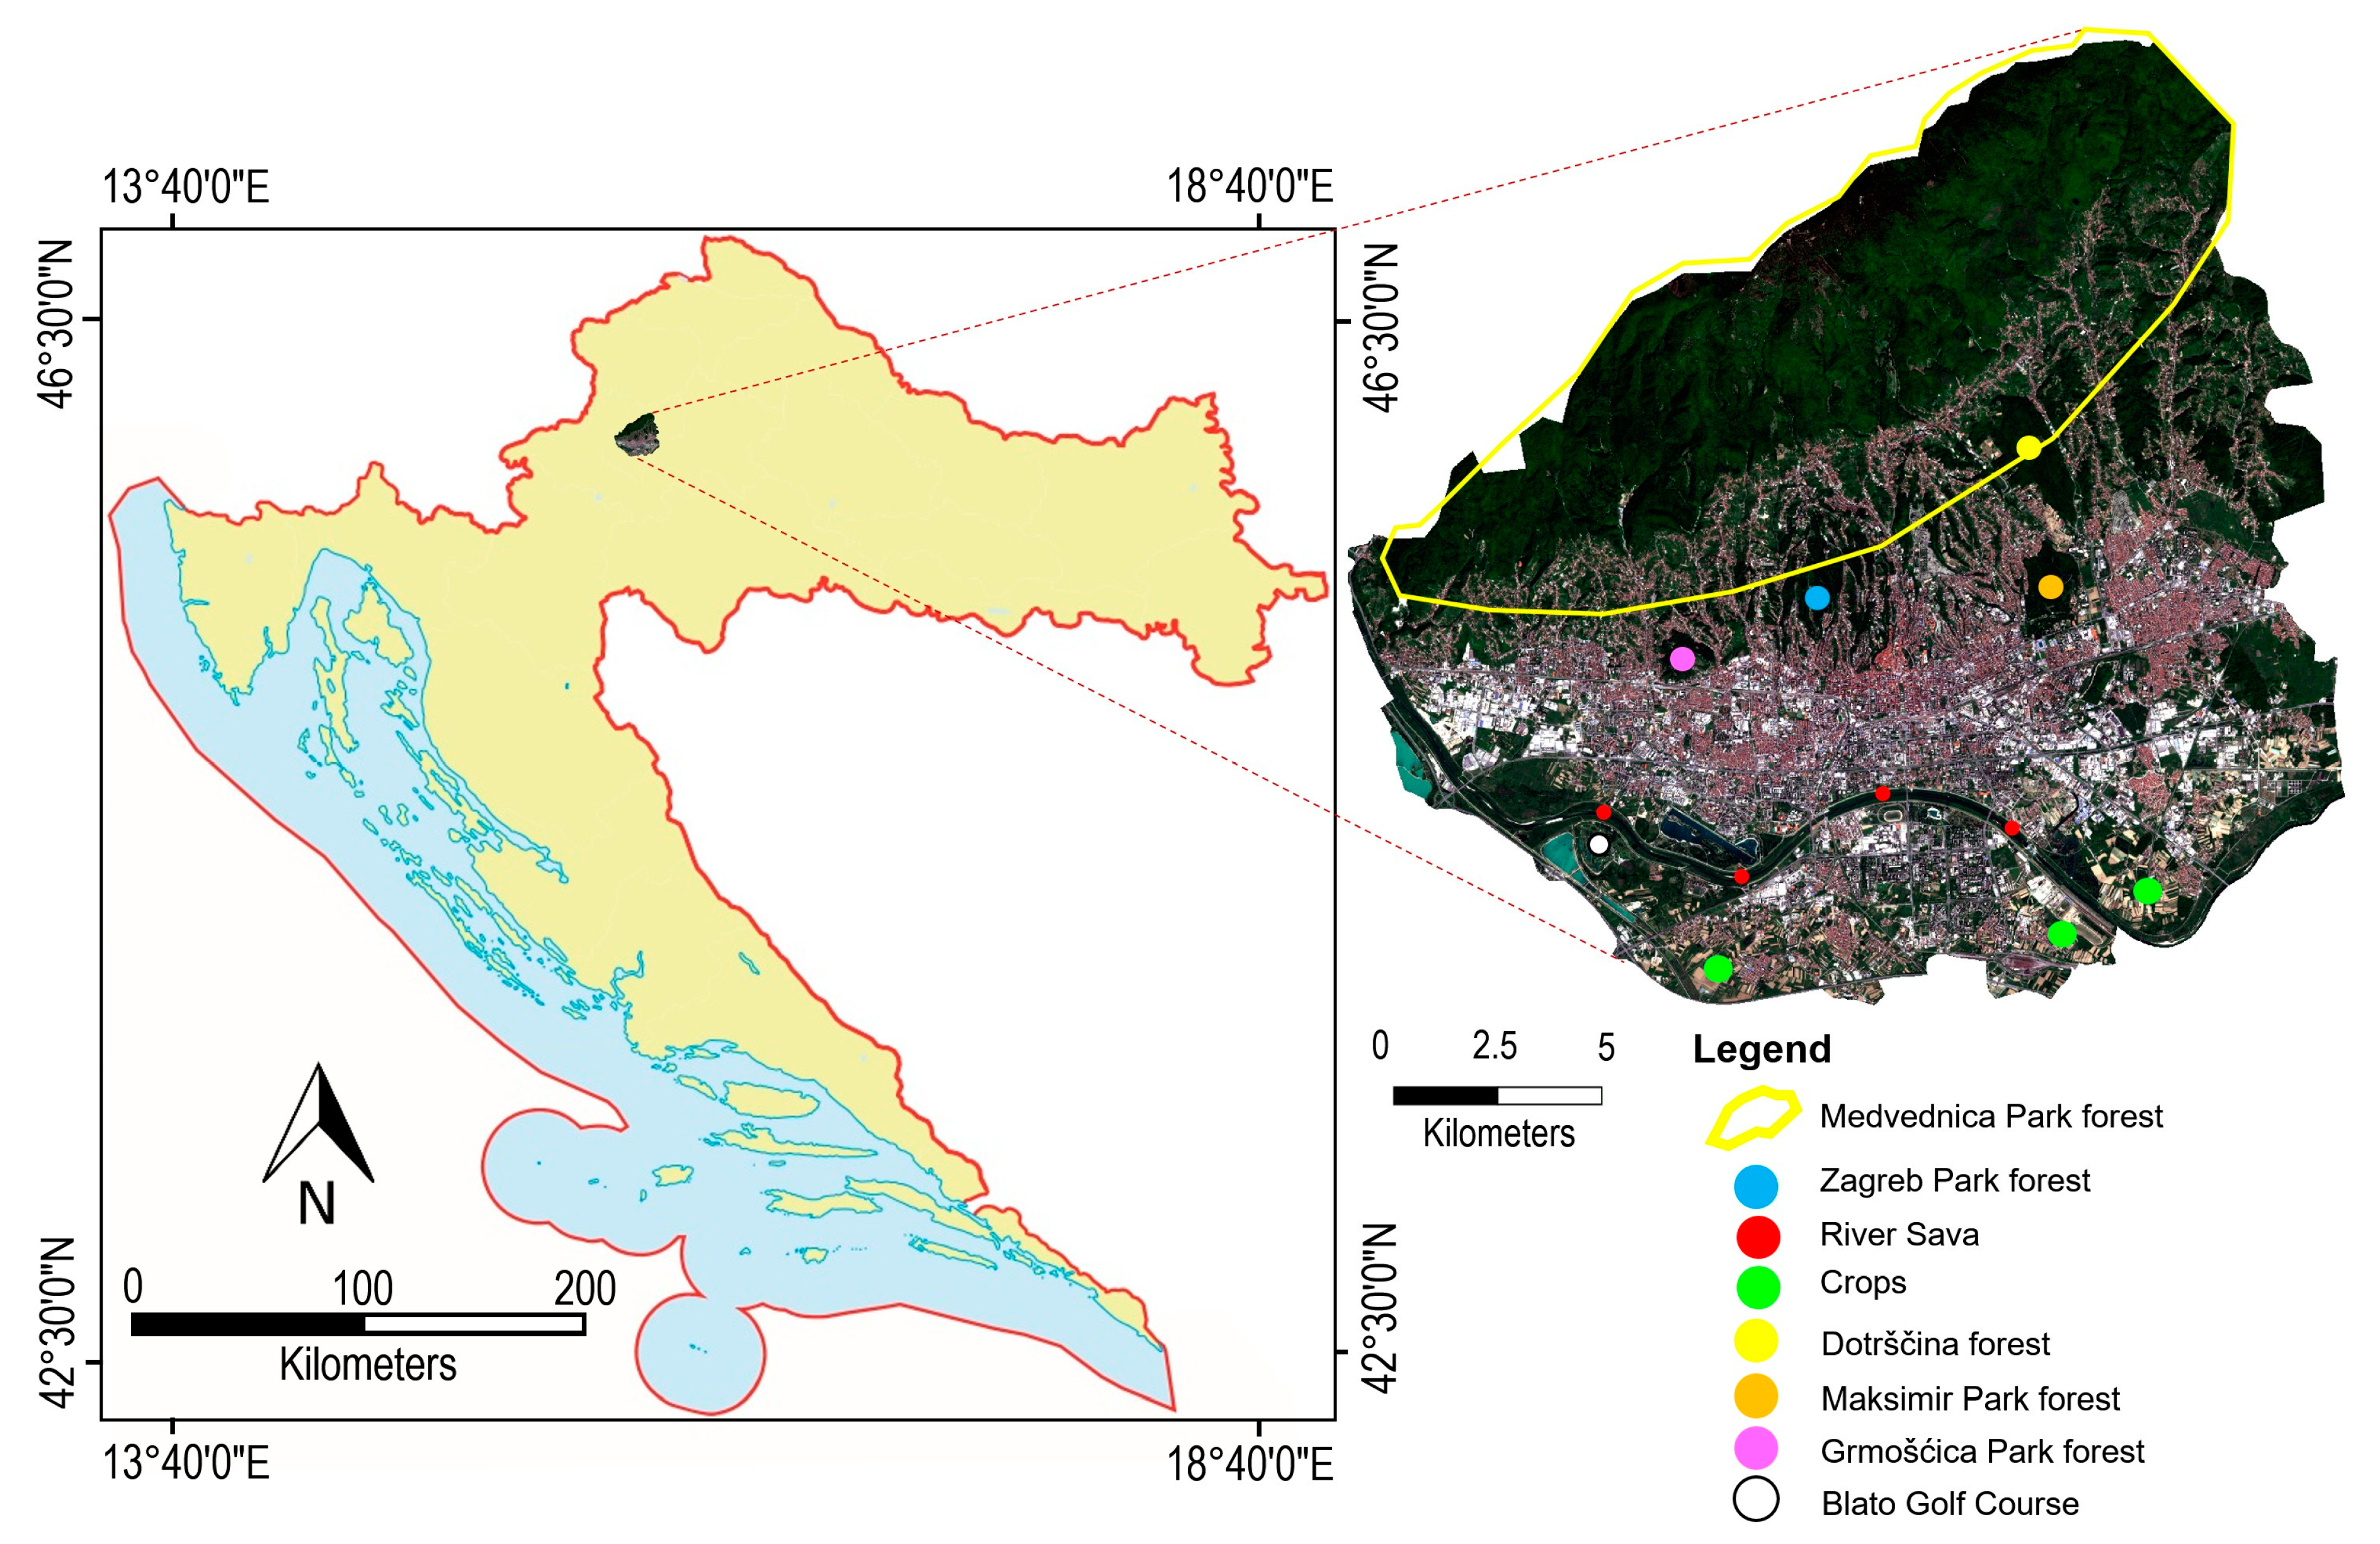
A more detailed analysis was conducted at two locations of special importance for the residents of the City of Zagreb: Maksimir Park (
Figure 1, ocher dot) and Dotrščina forest (
Figure 1, yellow dot). Maksimir Park is the most popular, oldest park in Zagreb. It is located in the Eastern part, not far from the city center. In addition to five lakes, it contains many plant species, among which are century-old oak trees, which were necessarily prominent. Maksimir Park is known as the ‘lungs of the city’ because it produces oxygen and acts as a natural air purifier. The dominant deciduous species in Maksimir Park are pedunculate oak (Quercus robur), sessile oak (Quercus petraea), and chestnut (Castanea sativa). The dominant coniferous species are white and black pine (Pinus sylvestris and Pinus nigra) and spruce (Picea excelsa) within the oak forests. Dotršćina forest is located north of Maksimir Park on the slopes of Mt. Medvednica. Thus, the analysis focused on predominantly forest vegetation in the lowland, densely populated city center and the hilly, sparsely populated part of the city.
The objects of the analysis were the vegetation indices values of GRVI, NDVI, and RVI for the forest areas in Maksimir Park and Dotrščina forest for May, July, August, and September 2017 (
Figure 6). The hypothesis was that RVI has the greatest variability in the presentation of vegetation conditions (largest standard deviations) and that NDVI has the smallest, and this was confirmed in these areas (
Figure 6). The highest values of GRVI were measured in July in Maksimir Park, and in May in Dotrščina forest. The highest values of RVI and NDVI were measured in May 2017 in both areas (
Figure 6).
These and similar analyzes can be found in the published articles mentioned in the Introduction. In contrast to such analyzes, in this framework, these results were used to produce new results, with existing tools (unsupervised classification and PCA method), which would indicate potential problems in urban vegetation cover. Unsupervised classification of vegetation indices provides insight into the spatial distribution of their values and conducts their gradation.
3.3. Unsupervised Classification Outputs
The input data for the unsupervised classification were vegetation index sets (NDVI, RVI, and GRVI) for each of the dates listed in
Table 1. A total of 12 classifications were conducted. The urban vegetation cover in the city of Zagreb was graded into four classes, whereby the class indicated by the lightest green (vegetation 1) represented the maximum value of vegetation indices, while the class indicated by the darkest green (vegetation 4) represented the minimum value of vegetation indices (
Figure 7). The unsupervised classification procedure was performed separately for each set of vegetation indices respectively. Therefore, the four classes within the vegetation were not absolutely defined, but rather represented the relative gradation of the index values for each individual set.
The relative maximum value of classified values of vegetation indices during April was found on the middle and low slopes of Medvednica and in the Zagreb forest park at the foot of the mountain. The maximum value of classified vegetation indices during this period also occurred on the banks of the River Sava and on certain cultivated vegetation areas. The minimum values during April usually occurred in the highest regions of Medvednica, in individual areas of arable land, and in the Blato golf course. Between April and July, the relative maximum of classified values of vegetation indices moved almost exclusively to the middle and high regions of Medvednica. The lowest parts of Medvednica and the Zagreb forest park (the sites of the most intensive vegetation in the middle of spring) were then predominantly allocated to vegetation class 2 (medium intensity vegetation class). The minimum value of classified values of vegetation indices during July mostly occurred in meadow areas, including the banks of the Sava. No major changes in the urban vegetation appearance of the city of Zagreb were detected between July and August in the analyzed period. Maximum values of classified values of vegetation indices continued to prevail in Medvednica, while minimum values occurred in areas of low vegetation within the inner city. In the Zagreb forest park areas, there was greater diversity during September, while in other vegetation areas (landscaped parks, low vegetation, cultivated areas), no significant changes were observed in this period regarding the results of unsupervised classification. Between August and September, an increasing number of changes in the results of unsupervised classification of vegetation indices began to occur. The maximum value of classified values of vegetation indices was still predominantly found on Medvednica; however, the overall picture changed or became more varied (different vegetation classes appeared). An increasing number of dark spots (islands of poor vegetation) began to appear in the area of the mountain within the area of stronger vegetation. During September, the value of classified vegetation indices in the forest areas in the highest parts of the mountain also decreased.
The analysis of the unsupervised classifications results of forest cover in the Maksimir and Dotrščina locations revealed that the highest values of vegetation indices were measured in May 2017, and the lowest were in September, for both areas (
Figure 8). Most of the forest cover in both locations was classified into class 2. However, apart from in May, when the ratio was almost 1: 1 (D = 69.2% and M = 70.9%), in all other months, the ratio was significantly in favor of the Dotrščina location (July 92.6/52.2%; August 81.9/68%; and September 76.8/36.3%,
Figure 9). Furthermore, at the Dotrščina location, significant values (apart from in May) classified into class 1 (maximum index values) appeared in each observed month, while those at the Maksimir location were insignificant, with the exception of May (
Table 5). The trend of the mean movement was very similar, and the standard deviations were inversely proportional to the mean values for both locations (
Figure 10). The standard deviations were similar in May and September, and differed significantly in July and August. While the standard deviations were uniform for the Dotrščina location, the standard deviations for the Maksimir location were significantly higher in July and August. Therefore, greater variability of the vegetation cover condition was detected in the Maksimir location (
Figure 10).
3.4. Principal Components Analysis of Unsupervised Classification Outputs
PCA was used to extract useful information from unsupervised classifications of vegetation indices and detect temporal changes in the current state of forest cover and creation of map changes. The principle of extracting information in this way is described for Maksimir Park and Dotrščina forest for May, July, August, and September 2017.
After transformation of the original images (unsupervised classifications), four principal components of each area were created. The first component showed the largest possible differences in variance (
Table 6). However, the other components also showed significant percentages of variance (
Table 6). The vegetation indices value change map derived by PCA is shown in
Figure 11. In the change maps, changes of vegetation indices values were detected and identified at the Maksimir and Dotrščina locations. These maps were created by merging the first three main components in an RGB display: R = PC3, G = PC2, B = PC1. Thus, the changes that occurred from May to September 2017 were highlighted (
Figure 11). Areas where changes occurred were marked from light pink to darker shades in both cases (
Figure 11). The observed changes are related, among other things, to significant damage to oak trees. Namely, during 2017, oak lace bug (Corythucha arcuata) spread throughout the entire area pedunculate oak and sessile oak (
Figure 11).
The data processed and presented by the maps of changes are intended for experts in forestry, agronomy, and urbanism for the purpose of monitoring the state of change in the urban forest/vegetation cover and making adequate decisions in the management of these fragile urban resources.
4. Conclusions
Urban and forest health assessments are very important in the formulation of ecosystem management strategies as well as managing the quality of life in cities. However, the lack of rapid, cost-effective, and quantitative analyses of the health of urban forests and vegetation hinders timely insights into the relative health status of urban vegetation. It was the motivation to create this framework entirely based on remote sensing. The described framework is a closed cost-effective system that uses free satellite images (funded by European states and free delivered by the European agency), free software (open source), and provides insight into the relative trends of the value of vegetation indices and shows their spatial distribution. In this way, spatial and temporal monitoring of changes within the urban forest and vegetation cover was performed, and insight into the trends of these changes was gained. Furthermore, the areas with the highest and lowest values of vegetation indices were also highlighted. The results of these analyses and assessments of these changes need to be delivered to the experts, and they can determine their impact on environmental and human health and take action based on them. Thus, the results of the methodology within this framework are the input data for decision support systems for the purpose of urban forest and vegetation management.
In this case study, Sentinel-2 time series data were used to derive combined vegetation indices for an urban forest and vegetation analysis. Variations in the values of three vegetation indices, NDVI, RVI, and GRVI, in the months of April, July, August, and September from 2016 to 2018, were analyzed. An analysis of the mean values revealed that the vegetation condition depended on the month of observation. All the vegetation indices had the highest mean values in April and increased from year to year. The RVI had the highest perennial average in April (11.4), and during July (10.7), August (9.2) and September (7.4), it recorded a gradual fall in mean values. The NDVI behaved similarly to the RVI, with mean values peaking in April (0.807) and declining in July (0.794), August (0.764), and September (0.735). The GRVI took into account the records of the green spectral channel and, therefore, provided a somewhat different insight into the annual course of vegetation. The GRVI perennial average rose between April (7.5) and July (8.1) and fell during August (7.1) and September (6.0). These data are numerical and represent the result of measurements, but they are still estimates because they were obtained from remote sensing data, without in situ measurements that would confirm or refute them. Therefore, visualizing these assessments gives a better insight into the situation on the scene and indicates problem areas. Temporal data, on the other hand, provide insight into the trends of these problems. In this way, changes in vegetation cover can be more easily detected and visualized. After that, the attention of experts can be focused on problem areas where in situ measurements can be performed and decisions can be made based on them.
The analysis of the unsupervised classification results of vegetation indices showed that the condition of urban vegetation in the city of Zagreb depended on vegetation type, altitude, and the location of the vegetation within the city. The values of 36 spectral indices were combined to yield 12 new results by unsupervised classification. Thus, the dimensionality of the input data was reduced, and all the data contained in the spectral indices were used to display their gradation values. These reduced data were further analyzed by the PCA method in order to determine the trend of changes in the urban vegetation cover. Therefore, this research presented a remote sensing-based monitoring source with the potential to analyze continuous changes in urban forests and vegetation, and assist expert decision-makers in agronomy and forestry to develop ecosystem services management plans. This framework of spectral indices provides indicators for the rapid, cost-effective, and quantitative assessment of forest health. For the operational assessment of the proposed framework of combining spectral indices by unsupervised classification, for the purpose of obtaining indicators for assessing the condition and health of urban forests and vegetation, the results obtained should be compared with reference field data, and their interpretation should involve agronomy and forestry. Further research should be directed in the direction of using other vegetation indices and professional (forester, agronomist) interpretation of the obtained results.


