Article

Feasibility Study of Transferring Shared Bicycle Users with Commuting Demand to Flex-Route Transit—A Case Study of Nanjing City, China

1
School of Transportation, Southeast University, Nanjing 211189, China
2
China Design Group Co., Ltd., Nanjing 210014, China
*
Author to whom correspondence should be addressed.
Sustainability 2021, 13(11), 6067; https://doi.org/10.3390/su13116067
Submission received: 9 May 2021 / Revised: 23 May 2021 / Accepted: 24 May 2021 / Published: 28 May 2021
(This article belongs to the Section Sustainable Transportation)

Abstract

:
Shared bicycle users with commuting purposes generally need to take a traditional public transit and then use the shared bicycle to complete the first/last mile transport. While shared bicycle provides convenient travel for travelers, it also brings a series of problems such as disorderly parking and road occupancy. Therefore, exploring the problem of travel mode shift between shared bicycle and public transit is of significance for improving the traffic environment and increasing the sharing rate of public transit. This paper introduces the flex-route transit system and quantitatively analyzes the rationality and feasibility of using flex-route transit to pick up and drop off shared bicycle users with commuting demand from the temporal perspectives. A flex-route transit route design model is established with the objective of minimizing the sum of vehicle driving time cost and passenger time cost, and the time cost models of the shared bicycle commuting system and the flex-route transit system are constructed, compared, and analyzed to explore the feasibility of flex-route transit picking up or dropping off shared bicycle users under different conditions. Through the subsequent sensitivity analysis, the influence of passenger demand density, fixed station spacing, and travel preference attributed to the two systems are analyzed separately. The results demonstrate that the flex-route transit can efficiently complete the picking up or dropping off for shared bicycle users under certain conditions.

1. Introduction

As a new mode of urban transportation system, shared bicycle provides a new travel option for travelers and provides new ideas for government departments in urban transportation planning. The smart unlocking and free parking functions of dockless shared bicycle greatly facilitate users. However, its rapid development has brought new challenges to urban traffic system management. The occupying-road phenomenon of idle shared bicycles and abandoned shared bicycles is gradually becoming more serious, which not only damages the image of city, but also wastes public space and hinders the normal operation of other means of transportation [1]. In order to better deal with the impact of shared bicycle and coordinate urban transportation system, exploring the relationship and interaction mechanism between shared bicycle and other public transit systems is of great significance.
Flex-route transit combines the characteristics of traditional fixed-route transit and dial-a-ride services, which not only meet the regular travel requirement of passengers, but also change the route to pick up and drop off passengers outside the fixed station. Practical operation experiences have shown that flex-route transit is regarded as more attractive than traditional fixed-route transit [2] and more cost-efficient than dial-a-ride services [3].
Shared bicycle is mostly used by travelers for commuting between companies and residences, and most of the shared bicycle users with commuting purposes generally need to take a traditional public transit and then use the shared bicycle to complete the first/last mile transport. The flexibility of shared bicycle provides convenience to travelers, but due to the complexity of road and the characteristics of bicycle, it is likely to reduce the safety, efficiency, and satisfaction of the travel. The travel demand characteristics of shared bicycle users are very similar to the service objects of flex-route transit. Therefore, this paper attempts to introduce the flex-route transit mode, analyzes the feasibility of the flex-route transit picking up or dropping off shared bicycle users (travelers do not need to ride shared bicycles and transfer, just take the bus directly), and examines the characteristics of the two modes under different conditions in order to provide a new choice for travel and traffic planning.
The remainder of this paper is organized as follows: In Section 2, the research literature on flex-route transit and shared bicycle is reviewed. In Section 3, the related background of flex-route transit is introduced, and its usage scenario is analyzed. The flex-route transit route planning model and a comparison model of the flex-route transit system and the shared bicycle system are proposed in Section 4. Case studies and sensitivity analysis are presented in Section 5 to illustrate the different effectiveness of the proposed models under different situations. Finally, a summary of our findings is concluded in Section 6.

2. Literature Review

This paper uses travel demand as the starting point for studying the feasibility and route design strategies of flex-route transit picking up or dropping off for shared bicycle users. This section mainly reviews the research contents of flex-route transit operation scheduling and relationship between shared bicycle and public transit and summarizes the current research status.
The flex-route transit operation scheduling problem mainly includes three aspects: service area, station selection, and route generation. In terms of flex-route transit service area, Chang and Lee used a simple rectangular service area to study two operation modes of fixed-route transit and flex-route transit; they also analyzed and compared the influence of ticket price, station distance, and departure interval on the two public transit modes, providing direction for the optimization of operation capacity in flex-route transit [4]. Li and Quadrifoglio studied how to divide a large rectangular service area into a series of small rectangular areas so that a single public transit line can independently operate services, thereby reducing operating costs while ensuring service quality [5]. Kim and Schonfeld conducted an in-depth study on hybrid public transit service scheduling methods, including fleet formation, vehicle running route optimization, and maximum net profit. It is found that sharing fleets of different service areas at different times can effectively reduce operating costs. For multiple service areas with different demand densities, hybrid public transit has significant advantages [6,7,8,9]. In terms of flex-route transit station selection and route generation, scholars generally choose one of three parts as the objective function from passenger [10,11,12], operator [13,14], and system [15,16,17]; they also take slack time and running speed as constraint conditions, establishing mixed-integer programming model. Through the optimization algorithm, the selection of stations and route planning are improved to optimize the objective function. Kirchler and Calvo and Masmoudi et al., respectively, proposed a Granular Tabu Search algorithm and a hybrid genetic algorithm to optimize the planning of flexible transit (dial-a-ride) route, which can effectively design vehicle driving path [18,19]. Tong et al. conducted research on customized bus to meet the commuting travel demand of passengers in high-density areas and established a vehicle path optimization model with the objective of optimal overall travel of passengers, which provides the possibility for flexible transit operation in high-density areas [20].
As a supplement mode of public transit, shared bicycle is embedded in the space where the original public transit is located. The integration of shared bicycle and traditional public transit has been studied previously and intensively. Jäppinen et al. used open data to analyze the potential impact of shared bicycles on public transportation travel time, modelled a hypothetical shared bicycle system, and quantified its spatial effect on public transport travel times [21]. Yang et al. used real spatial location data of the public shared bicycle system; considered geographical information on bus stations, bus routes, and public bicycle stations; and proposed a multi-layer coupling spatial network model to study the influence of bicycling between the short-distance bicycle station pairs and walking between the short-distance bus station pairs on the performance of the urban public transport networks [22]. Martin and Shaheen evaluated survey data from two U.S. cities to explore who is shifting toward and away from public transit as a result of shared bicycle. The results show that those shifting toward bus and rail transit generally live on the urban periphery, whereas those generally living in the urban core tend to use public transit less [23]. Guo and He studied the competition between shared bicycle and traditional public transit, concluding that public transit in areas with lower density of stations has higher attraction of use [24]. Kong et al. used real shared bicycle trip data in four cities to investigate when, where, and to what extent shared bicycle trips substitute, integrate with, and complement public transit. The results show that the relationship between shared bicycle and public transit usage is determined by the time that the trip happens (weekday or weekend; what time period during the day) and the person who is traveling (a subscriber or customer) [25]. Bronsvoort et al. analyzed the preference of travelers in the two travel modes of traditional public transit plus shared bicycle and flexible public transit, using a questionnaire; they found that time and cost are more important to users than reliability and flexibility [26,27].
At present, problems such as disorderly parking, occupation of roads, and uneven supply and demand of shared bicycle are more serious. Therefore, exploring the problem of travel mode shift between shared bicycle and public transit is of certain significance for improving the traffic environment and increasing the sharing rate of public transit. Existing studies have qualitatively analyzed the travel preferences and mode shift of shared bicycle and public transit under different temporal and spatial characteristics. However, there is no study that has quantitatively analyzed the rationality and feasibility of shared bicycle users to transfer to public transit system from a time perspective. At the same time, studies (e.g., [26,27]) have found that time is more important for travelers’ choice preferences, while existing flex-route transit path planning studies mainly take cost and benefit as the objective function, with only few studies considering passenger travel time. Therefore, the purpose of this paper is to analyze the spatio-temporal travel characteristics of shared bicycle users by mining multi-source data; to build a flex-route transit path planning model based on passenger travel time; and to explore whether the flex-route transit can be introduced to pick up and drop off shared bicycle users so as to ensure the travel efficiency of shared bicycle users, reducing the transfer time and uncertainty and improving convenience and comfort.

3. System Description

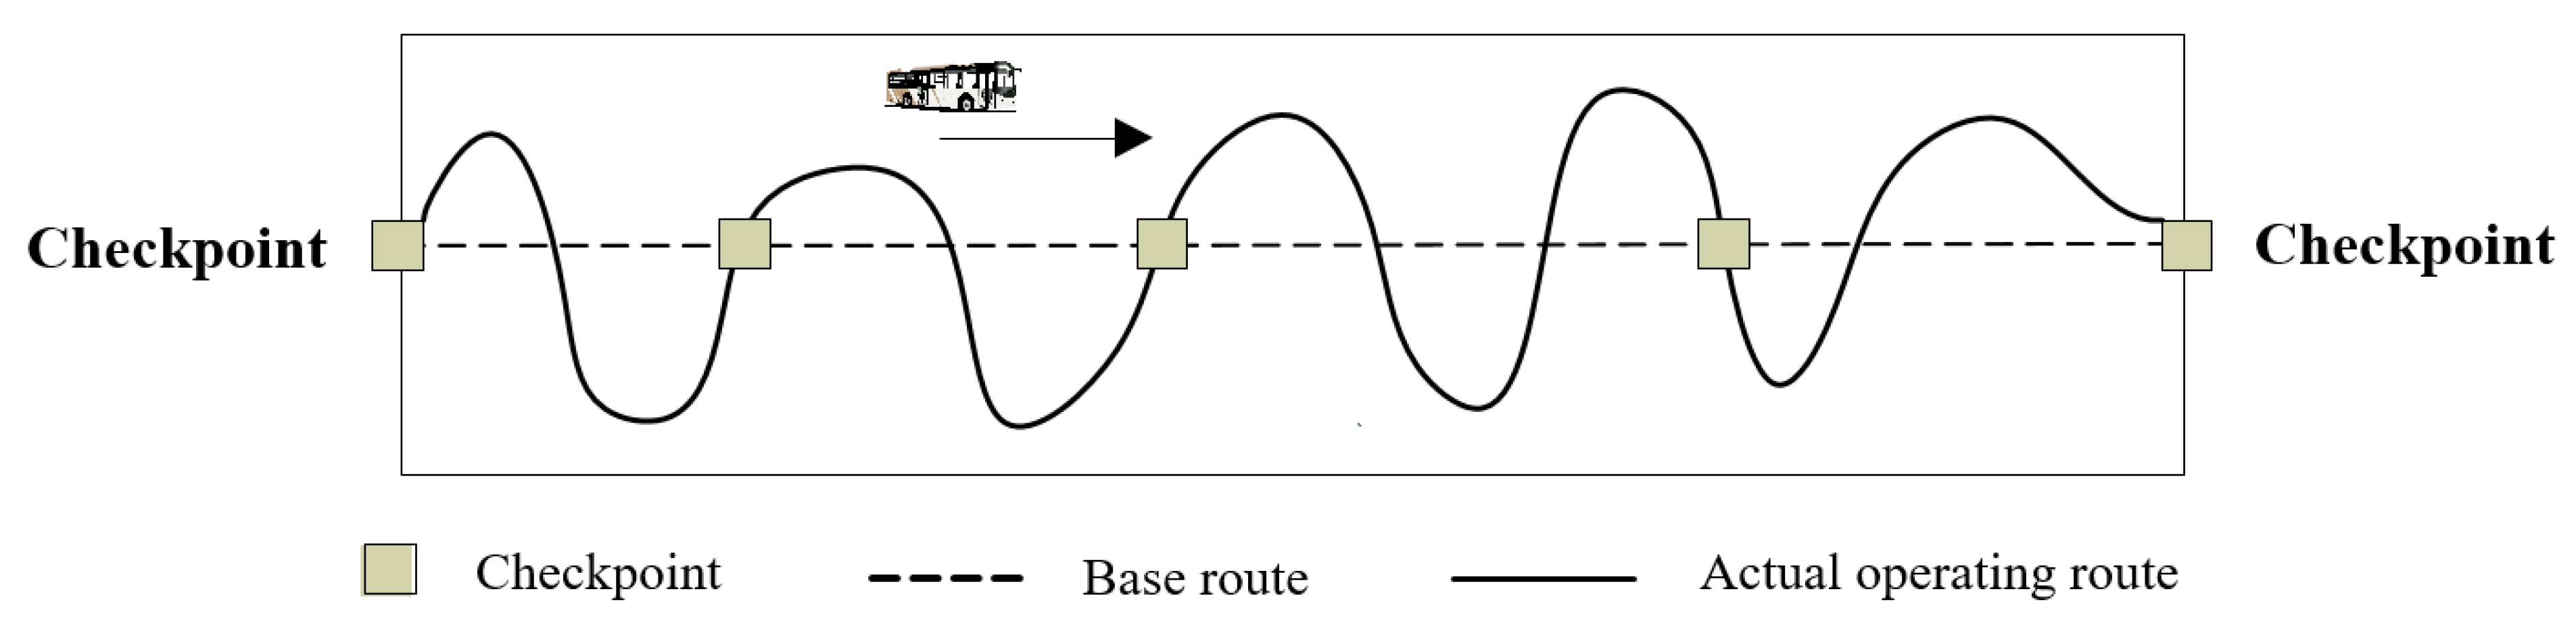
3.1. Service Characteristics of Flex-Route Transit System

3.1.1. Operating Characteristics of Flex-Route Transit

The flex-route transit system is a new type of public transit systems, which has the low cost of traditional fixed-route transit and the flexibility of demand responsive transit.
As shown in Figure 1, the flex-route transit service system includes service area, checkpoints (fixed stations), service vehicles, demand passengers, base route, and actual operating route (offset route).
The vehicle departs and arrives on time according to the departure time and arrival time of the fixed stations. When there is no passenger booking service, the vehicle travels along the base route. When there are reserved passengers in the interval, the vehicle can deviate a certain range from the base route to provide passengers with door-to-door boarding services. The first station among all fixed stations is called the starting station, and the last station is the terminal station. Vehicles must pass through fixed stations when driving from the starting point to the end and are strictly constrained by the fixed stations’ time window. Every time after serving the reserved passengers, the vehicle needs to return to the base route to continue driving.

3.1.2. Passenger Type of Flex-Route Transit

According to the characteristics of passengers’ pick-up and drop-off points, there are four types of passengers for flex-route transit services—Type I: the pick-up and drop-off points are both at checkpoints; Type II: the pick-up point is at a checkpoint, but the drop-off point is not at a checkpoint; Type III: the pick-up point is not at a checkpoint, but the drop-off point is at a checkpoint; Type IV: neither the pick-up nor the drop-off point is at a checkpoint.

3.2. Service Area and Demand

The existing flex-route transit research mainly uses simple rectangles to simulate the service area, which is far from the real scene and the real route, and it is difficult to apply it in practice. In terms of passenger demand, most of the existing research simulates and generates a certain number of demand points in a rectangular area to analyze the rationality and effectiveness of the research. The rest is to predict the OD travel by dividing the traffic area to determine the potential ride demand points of the flex-route transit. Either way, it is difficult to obtain real and effective travel data. Therefore, this section hopes to propose a flex-route transit demand point analysis method based on multi-source traffic data and real road networks to help the practical application of the flex-route transit.
Many passengers may choose to travel in private cars because the origin or destination is not near the fixed station area. In order to obtain the real potential travel demand of flex-route transit, multi-source traffic data can be analyzed, along with fully exploring the potential passengers of flex-route transit in transportation modes such as private cars, shared bicycles, taxis, and internet private hire vehicles. The data can help in attracting passengers to use public transportation while ensuring their travel efficiency and satisfaction.
In order to analyze multi-source data more efficiently, quickly, and accurately, the research scope of this paper is limited to the main areas of Nanjing city, as shown in Figure 2. Because the flex-route transit has similar characteristics to fixed-route transit, it needs to depart and arrive on time according to the departure time and arrival time of the fixed stations. The fixed-route transit routes and stations in the research area are shown in Figure 3.
Take shared bicycles as an example. As an effective solution for the last mile, shared bicycles can help passengers improve travel efficiency in areas not covered by public transit. However, at the same time, it will increase the number of transfers and cause inconvenience in bad weather. If the origin or destination of the shared bicycle ride is near a fixed station, in that way, the user most probably either requires taking a bus or has just completed a bus trip. Therefore, the users of this part of shared bicycles are likely to be potential users of flex-route transit. If the organization of flex-route transit operation is reasonable, these passengers can be connected to fixed stations or destinations by changing the operating routes, reducing the number of passenger transfers while improving travel efficiency and comfort.
This section analyzes the operating data of Mobike shared bicycles in Nanjing, in September 2017. Select the data of the 20th (working day) as the basic data, and extract the travel data of the origin or destination of the riding route near the fixed stations (this section is set to within 0.03 miles). Exclude night travel data (20:00–6:00) and the data with a long riding duration (more than 20 min). Eliminate the distance between the origin and destination of more than 1 mile. Subsequently, the riding OD pairs with the origin or destination in the fixed station area is obtained, as shown in Figure 4.
For each fixed-route transit, if the flex-route transit strategy is used, the route can be changed between the fixed stations according to the corresponding rules to either pick up or drop off the passengers whose origin or destination is not in the fixed station area; this is carried out in order to attract passengers who use other modes of travel to use public transit.

4. Mathematical Model

Passengers who use shared bicycles to complete the last mile generally travel as follows: (1) Taking traditional fixed-route transit to fixed station near the destination, and then using shared bicycles to the destination; (2) using shared bicycles to fixed station near the origin, and then taking traditional fixed-route transit to the destination; and (3) first using shared bicycles, then taking traditional fixed-route transit, and finally using shared bicycles to the destination. These three situations are exactly in line with the characteristics of Type II, Type III, and Type IV of flex-route transit passengers. Therefore, this paper introduces flex-route transit to pick up or drop off shared bicycle users who need to use public transit. The intention is to help passengers who no longer require riding bicycles to transfer, making their travel more convenient, comfortable, and efficient.
In this section, the optimization research on the routing problem of flex-route transit pick-ups or drop-offs for shared bicycle users is carried out, and the routing design model of the flex-route transit and the travel time cost model of the shared bicycle system are established. By comparing the time cost of the two travel modes, the feasibility of flex-route transit picking up or dropping off for shared bicycle users is analyzed.

4.1. Model Assumptions

Flex-route transit is affected by many factors in the operation process. In order to establish a vehicle routing design model, this paper makes the following assumptions regarding the operation process of flex-route transit: (1) For the convenience of analysis, this section only considers passengers in one of the up and down directions; (2) the vehicle maintains a constant speed while driving; (3) passengers will definitely complete the trip according to the reservation information; (4) according to the research by Quadrifoglio et al. [28], the virtual grid road network can better simulate the actual road network; this section adopts a grid road network, that is, the vehicle drives straight in the X direction or the Y direction; and (5) the pick-up and drop-off points and the scheduled pick-up time of the passengers who reserved in advance are known. Though these may be viewed as controversial in some circles, all of the assumptions have been adopted in previous works, e.g., see [5,10,28]. The advantage of our approach lies in the general insights that it produces.
Shared bicycle is also affected by many factors in the operation process. In order to establish a travel cost model of shared bicycle users, this paper makes the following assumptions regarding the operation process: (1) The traditional fixed-route transit always runs on the fixed (base) route and maintains a constant speed; (2) shared bicycle users will ride to the nearest fixed station when taking a bus; (3) shared bicycle users will get on the bus on time when the bus arrives at the fixed station, regardless of the waiting time; (4) shared bicycle drives straight in the X direction or the Y direction in the grid road network; (5) shared bicycle maintains a constant speed during the ride; and (6) only considering passengers in one of the up and down directions.

4.2. Symbol Description

In order to facilitate understanding, the parameters and variables in the models are summarized as follows:
  • Z = total cost of flex-route transit system
  • Z′ = total cost of shared bicycle plus traditional fixed-route transit
  • F = system time cost of the flex-route transit system and the shared bicycle system
  • F1, F2, F3, F4 = vehicle driving time cost, passenger in-vehicle time cost, passenger waiting time cost, and shared bicycle riding time cost of the flex-route transit system and the shared bicycle system, respectively
  • λ1, λ2, λ3 = respective cost function weight coefficient of vehicle driving time, passenger in-vehicle time, and passenger waiting time
  • μ1, μ2, μ3 = respective cost function weight coefficient of vehicle driving time, passenger in-vehicle time, and shared bicycle riding time
  • ω1, ω2, ω3, ω4 = respective performance index weight coefficient of vehicle driving time cost, passenger in-vehicle time cost, passenger waiting time cost, and shared bicycle riding time cost
  • P = number of passengers in the flex-route transit system
  • ψ = number of fixed stations of traditional fixed-route transit
  • v = driving speed of the vehicle
  • δ = riding speed of the shared bicycle
  • ξ = shared bicycle unlock/lock time
  • σt = number of passengers on the bus at time t
  • θ = rated passenger capacity of bus
  • dij = Manhattan distance between point i and point j
  • d = Manhattan distance between point i and the nearest fixed station α
  • dφ = total length of base line of traditional fixed-route transit
  • tui(q) = passenger q pick-up time at point i
  • toj(q) = passenger q drop-off time at point j
  • t(q) = passenger q pick-up time at fixed station α
  • t(q) = passenger q drop-off time at fixed station β
  • rtq = reserved pick-up time of passenger q outside the checkpoints
  • mtq = most evening pick-up time of passenger q outside the checkpoints
  • TC = set of checkpoints, where TC = {1, 2, …, P}
  • NT = set of non-fixed stations (demand points), where NT = {P + 1, P + 2, …, P + P}
  • A = set of all points on the route, where A = TCNT
  • φ = set of fixed stations of traditional fixed-route transit, where φ = {1, 2, …, ψ}
  • xij = {0,1}, if there is a path from i to j, then xij = 1, otherwise xij = 0
  • ti = scheduled departure time of vehicle at checkpoint i
  • ci = arrive time of vehicle at checkpoint i
  • tc = service time of vehicle at checkpoint
  • T = maximum single-trip time allowed for flex-route transit
  • N1, N2, N3, N4 = respective numbers of passengers in the I, II, III, and IV categories
  • Q = set of passengers, where Q = N1N2N3N4
  • db = maximum distance that the vehicle can drive backward in x-axis direction
  • xi, xj = abscissa of point i and point j, respectively
  • t = waiting time that passengers can tolerate

4.3. Model Construction

4.3.1. Routing Design Model of Flex-Route Transit

The performance of the public transportation system is closely related to the operating costs of enterprises, vehicle costs, and passenger travel costs. This section studies the route design problem of a single-vehicle system. For different routes, there is little difference in vehicle cost. Therefore, the total cost of the system in this section is composed of two parts: the one-way driving time cost of vehicle and the passenger time cost. Passenger time cost includes in-vehicle time cost and waiting time cost. The in-vehicle time cost is introduced here because the flex-route transit deviates from base route to pick up or drop off passengers, which will inevitably increase the in-vehicle time of passengers. Adding this part can reflect the time cost of flex-route transit more reasonably and accurately, thus making the comparison result more convincing. Considering constraints such as slack time constraints, vehicle operation rule, and passenger time windows, a flex-route transit route design model is established with the objective of minimizing the total cost of the system.
min   Z = λ 1 i A j A x i j d i j / v + λ 2 i A j A q Q ( t o j ( q ) t u i ( q ) ) + λ 3 i N T q N 3 N 4 ( t u i ( q ) r t q )
Subject to
i A j A x i j d i j / v T
t o j ( q ) t u i ( q ) + x i j d i j / v ,     ( i , j ) A
t u i ( q ) < t o j ( q ) ,     q Q
r t q t u i ( q ) m t q ,     q ( N 3   N 4 )
m t q = r t q + Δ t
t i c i + t c ,     i T C
i = 1 A x i j = 1 ,       j A / { 1 }
j = 1 A x i j = 1 ,       i A / { P }
σ t θ ,     t ( 0 , T )
x i x j d b
In the above formulation, the objective function (1) takes the minimum weighted sum of the passenger’s total travel time and vehicle running time as the target. The passenger’s total travel time is composed of two parts, namely, the waiting time and the in-vehicle time. Equation (2) means that single-trip time of flex-route transit cannot exceed the maximum allowed (considering the overall timetable of public transit system). Equation (3) means that when the vehicle is driving on the road segment (i,j), the time when the vehicle arrives at point j will not be earlier than the departure time from point i plus the travel time of the road segment. Equation (4) means that the pick-up time of passenger q is earlier than the drop-off time. Equation (5) indicates that the pick-up time of passengers at non-fixed station is between the reserved pick-up time rtq and the most evening pick-up time mtq. Equation (6) means the most evening pick-up time that the passenger can accept is equal to the sum of the time the passenger arrives at the point and the tolerable waiting time ∆t. Equation (7) means that the scheduled departure time of the checkpoint is no earlier than the time when the vehicle reaches the checkpoint plus the time of service pick up or drop off. Equations (8) and (9) restrict vehicles. Vehicles cannot reach the same demand point or checkpoint more than once in the same shift. Equation (10) means that the number of passengers on the bus at any time will not be greater than the rated passenger capacity of the bus. Equation (11) represents the retrograde distance constraint, and the retrograde distance of the vehicle in the x direction shall not exceed the maximum allowable retrograde distance db.

4.3.2. Travel Cost Model of Shared Bicycle System

The total system cost of shared bicycle plus traditional fixed-route transit is also composed of two parts: the one-way driving time cost of vehicle and the passenger time cost. The one-way driving time cost of vehicle is the time cost for traditional fixed-route transit to drive from departure station to terminal station along the base route. Passenger time cost includes riding time cost of shared bicycle and in-vehicle time cost.
Z = μ 1 d φ / v + μ 2 α φ β φ q Q ( t o β ( q ) t u α ( q ) ) + μ 3 i N T α φ ( d i α / δ + ξ 2 )
Equation (12) indicates that the total cost of the shared bicycle system in this paper is equal to the weighted sum of driving time cost of vehicle, in-vehicle time cost of passenger, and riding time cost of passenger.

4.3.3. Time Cost Comparison Model

In order to compare the time cost performance index of the systems, this section defines the time cost performance index F of the systems as follows:
F = ω 1 F 1 + ω 2 F 2 + ω 3 F 3 + ω 4 F 4
F 1 = { λ 1 i A j A x i j d i j / v ,   in flex-route transit system μ 1 d φ / v ,   in shared bicycle system
F 2 = { λ 2 i A j A q Q ( t o j ( q ) t u i ( q ) ) ,   in flex-route transit system μ 2 α φ β φ q Q ( t o β ( q ) t u α ( q ) ) ,   in shared bicycle system
F 3 = { λ 3 i N T q N 3 N 4 ( t u i ( q ) r t q ) ,   in flex-route transit system 0 ,   in shared bicycle system
F 4 = { 0 ,   in flex-route transit system μ 3 i N T α φ ( d i α / δ + ξ 2 ) ,   in shared bicycle system
Equation (13) indicates that the total time cost of the systems is equal to the weighted sum of driving time cost of vehicle, in-vehicle time cost of passenger, waiting time cost of passenger, and riding time cost of passenger. The smaller the value of the time cost performance index F, the lower the total time cost of the systems, the higher the travel efficiency, and the better the service capacity. Equations (14)–(17) represent the driving time cost of vehicle, the in-vehicle time cost of passenger, the waiting time cost of passenger, and the riding time cost of passenger in the systems, respectively. In the flex-route transit system, F1 is the sum of travel time between demand points. In the shared bicycle system, since the traditional fixed-route transit always runs on the base line, there is no situation that deviates from the base line to connect passengers, so F1 is a fixed value. F2 in the systems is the sum of the in-vehicle time experienced by each passenger from getting on the bus to getting off the bus. F3 in the flex-route transit system is the sum of the waiting time of each passenger before getting on the bus at the demand point. Demand-responsive passengers will get the estimated boarding time as feedback from the system when booking services. Therefore, the waiting time of passengers is defined as the time difference between the actual boarding time and the expected boarding time. In the shared bicycle system, since there is no passenger waiting at the demand point outside the fixed station, F3 is 0. F4 in the shared bicycle system is the sum of the riding time of each passenger between the demand point and the nearest fixed bus station. There is no cycling in the flex-route transit system, so F4 is 0.

4.4. Simulation Design

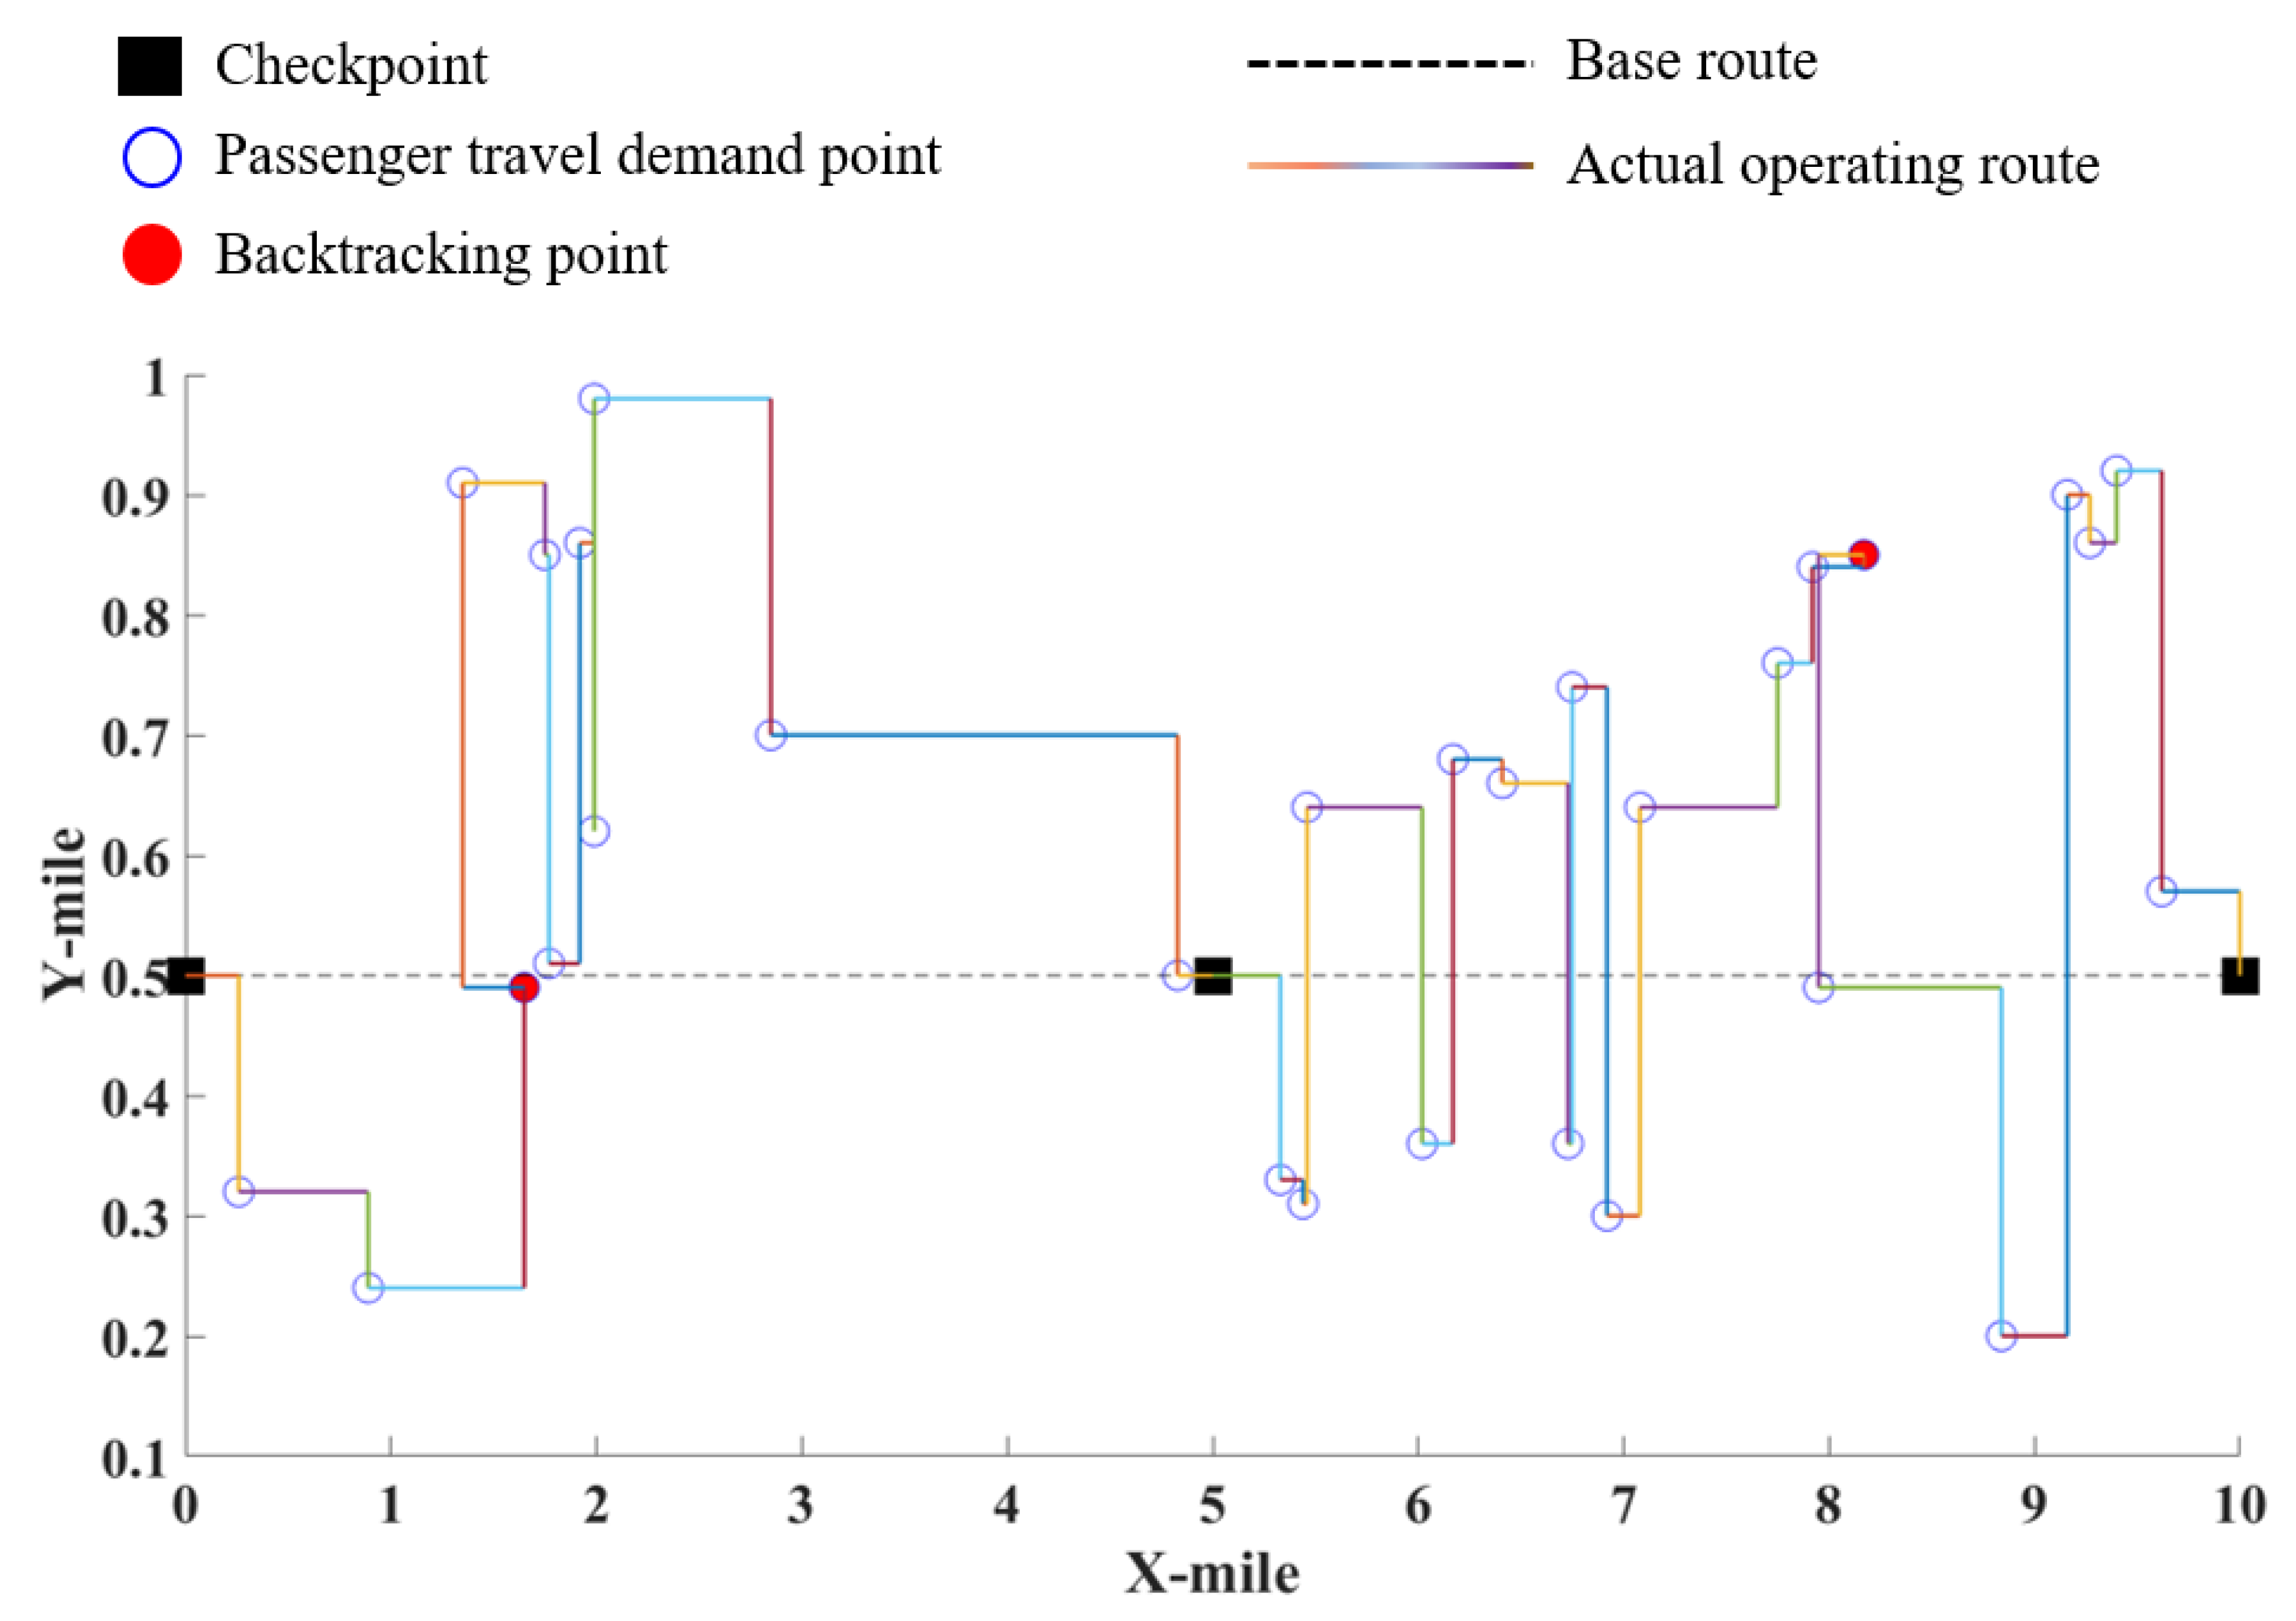
4.4.1. Simulation Design of Flex-Route Transit System

In the scheduling model of the flex-route transit system, the model aims to solve the scheduling plan of reservation demand (four types of passengers). Due to the limitation of factors such as slack time and station departure time, the scheduling problem of flex-route transit can be regarded as one kind of special NP-C problem. Simulation replicates vehicle scheduling with the help of an insertion algorithm, which is generally regarded as a classical and efficient resolution for scheduling demand responsive transit services or dial-a-ride problems. The scheduling model algorithm steps are as follows:
Step 1: Let Q1, Q2, Q3, …, QP denote P passengers in a service ride. Set the initial driving route according to the location and number of checkpoint TC.
Step 2: According to the first-come, first-served rule, the passenger OD demand points are sequentially inserted, and the routing plan is regenerated. First, insert Q1 and determine the type of Q1. If Q1 belongs to Type I, the routing plan will not be updated. If Q1 belongs to Type II, Type III, or Type IV, conditional judgment is made according to Equations (2)–(10), so as to be inserted in the corresponding flex-route segments. If the insertion process is successful, the vehicle routing plan will be updated. For example, when the vehicle is driving between checkpoint TC1 to TCn, if Q1 (for example Type IV) gets on the bus between TC1 and TC2 and gets off the bus between TCn−1 and TCn, the vehicle will deviate from the baseline service Q1 and the routing plan will update to TC1, …, Q1 (picking up), …, TC2, …, TCn−1, …, Q1 (dropping off), …, TCn.
Step 3: Subsequently, insert Q2 and determine the type of Q2. If Q2 belongs to Type I, it will be directly included in the routing plan. If Q2 belongs to Type II, Type III, or Type IV, assign OD demand points to each segment, check the constraint conditions in segments, select the minimum additional distance for possible insertion, and update the vehicle routing plan. For example, the routing plan will update to TC1, …, Q1 (picking up), …, TC2, …, TCk, …, Q2 (picking up), …, TCk+1, …, TCl−1, …, Q2 (dropping off), …, TCl, …, TCn−1, …, Q1 (dropping off), …, TCn.
Step 4: Finally, insert Q3, …, Qn in order, and update the routing plan.

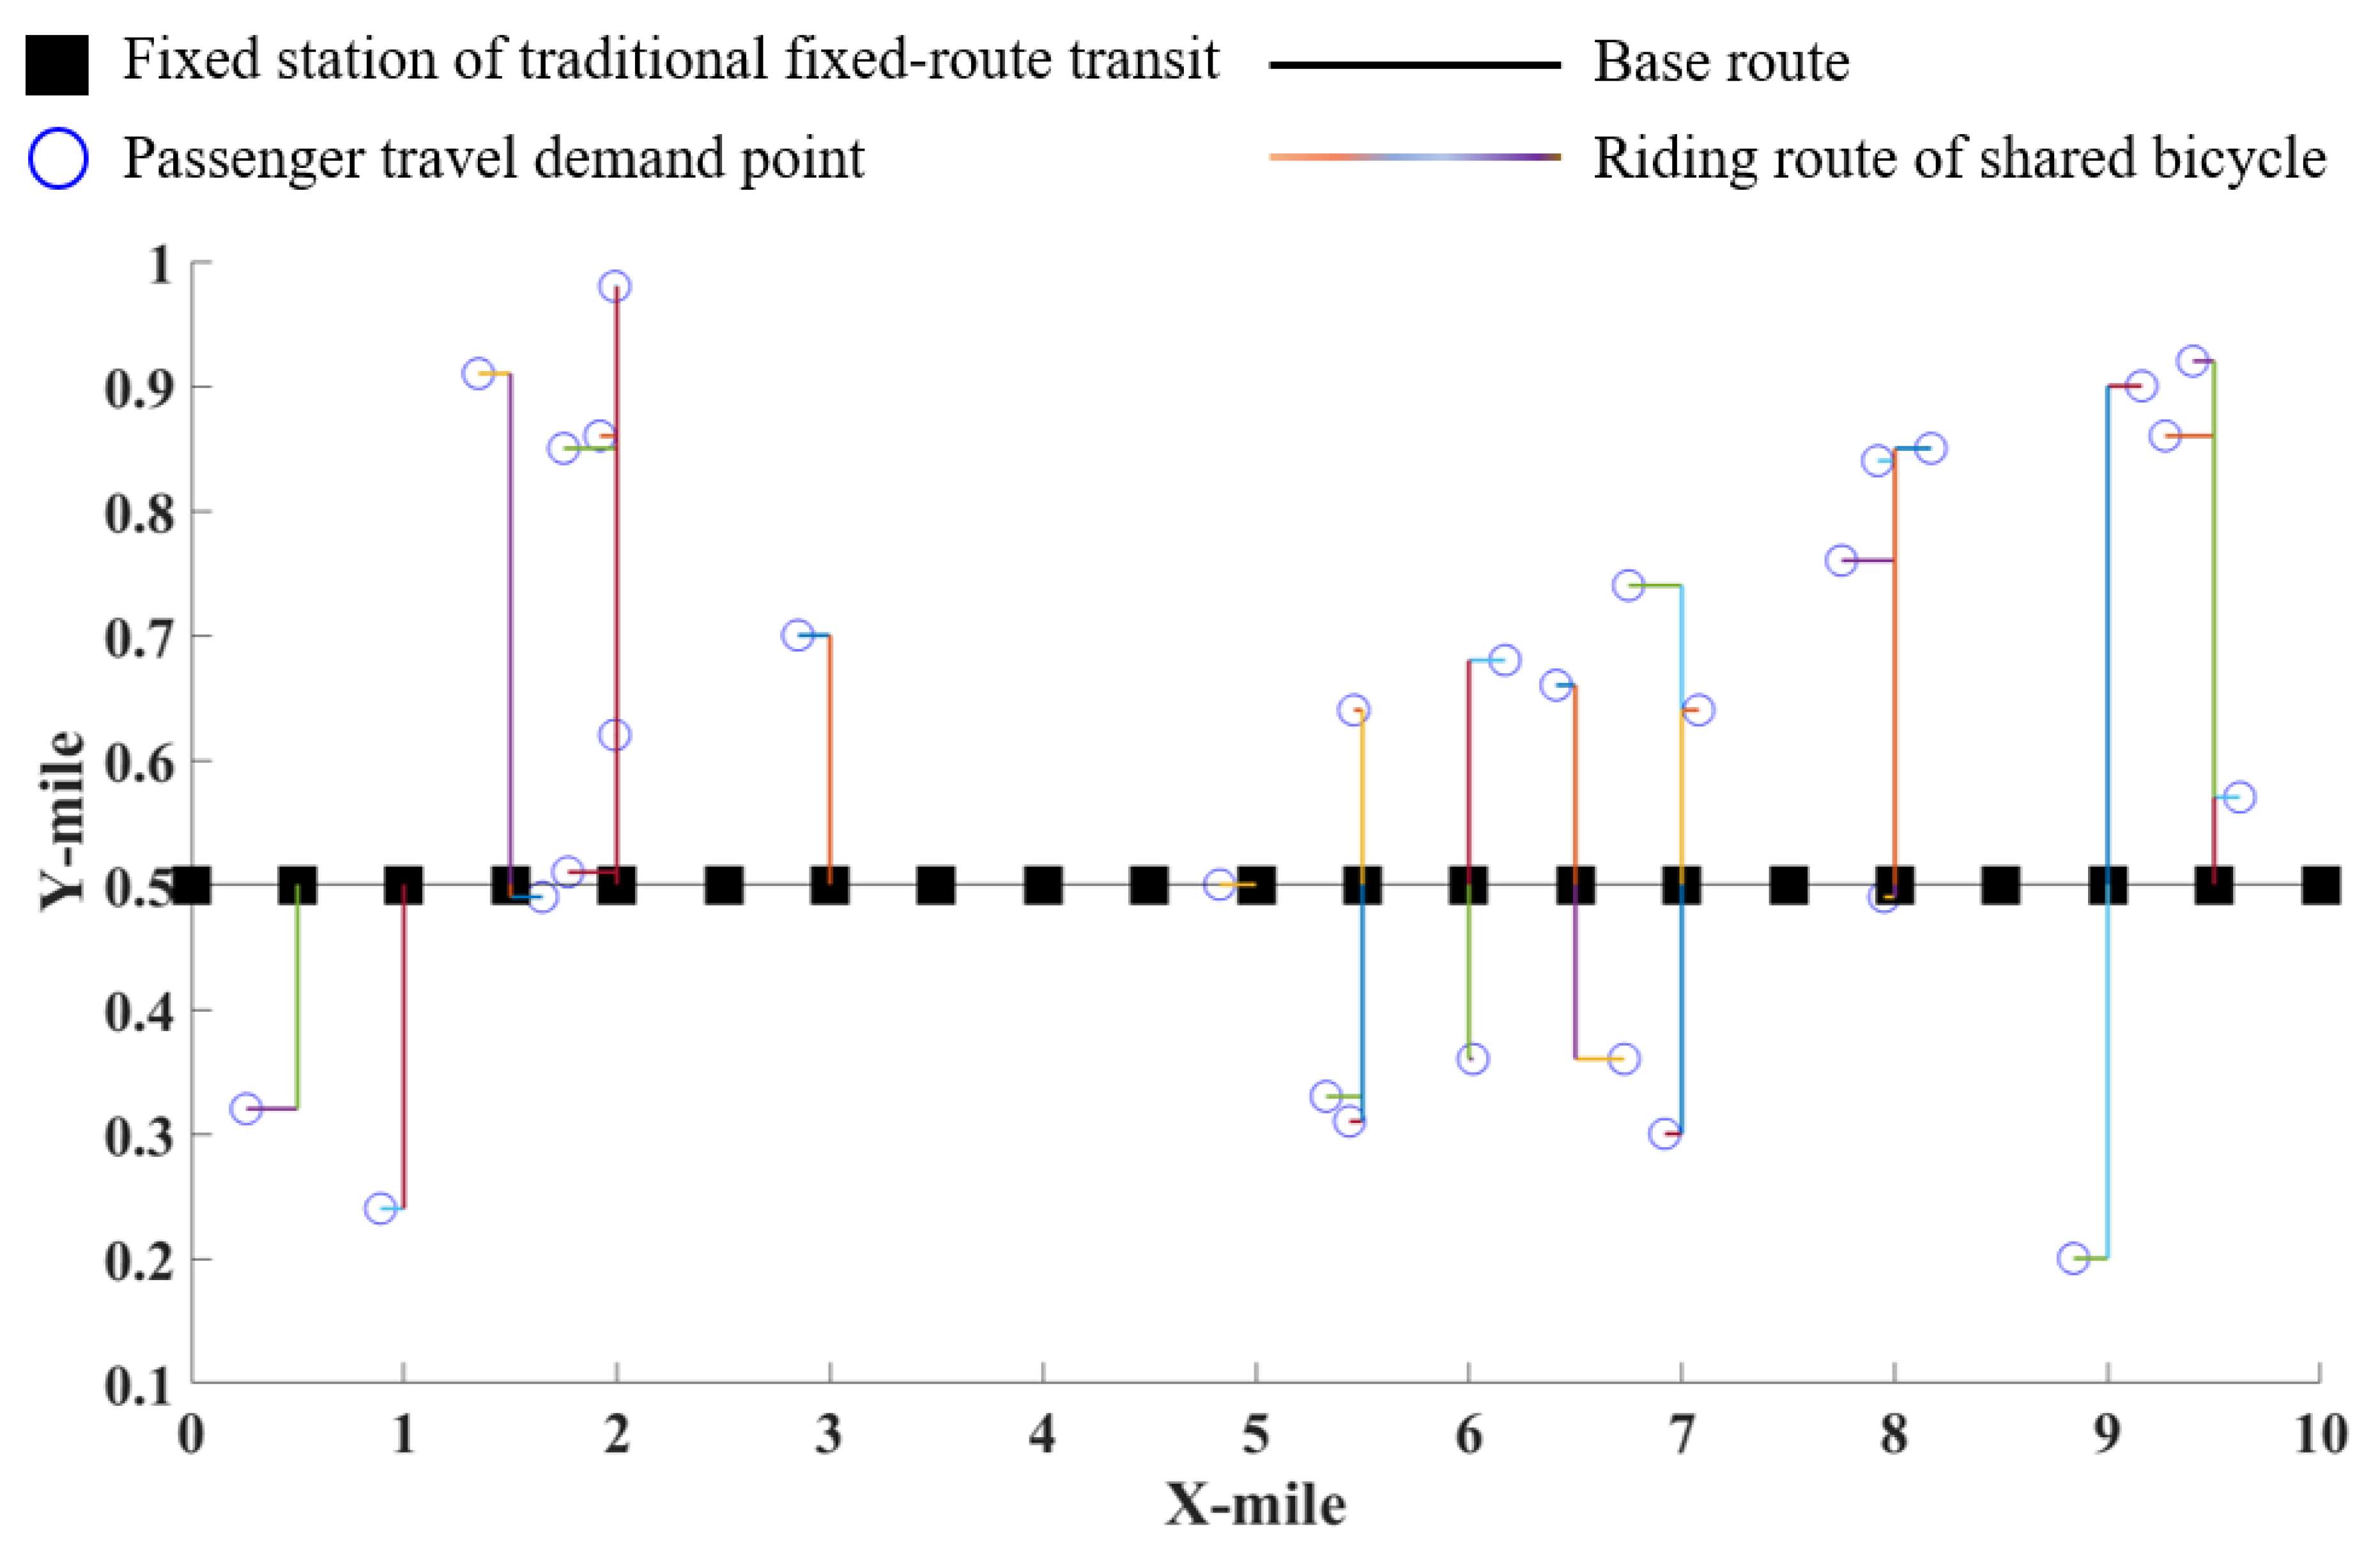
4.4.2. Simulation Design of Shared Bicycle System

When calculating the time cost of the shared bicycle system, each time cost should be calculated separately and weighted. The specific steps are as follows:
Step 1: Calculating driving time cost. The driving time cost F1 of traditional fixed-route transit can be calculated according to the actual fixed route length dφ and vehicle speed v.
Step 2: Calculating riding time cost. Calculating the riding time cost F4 of Q1, Q2, Q3, …, QP in turn. When d < di-α, the riding time cost of passengers from demand point i to fixed station α is less than from i to other fixed points, determine iα as the riding path and calculate F4. If d = d, the riding time cost from the demand point i to the fixed station α is equal to that from the demand point i to the fixed station β, then it is necessary to judge the driving direction of the vehicle and riding direction of shared bicycle, determine the riding path consistent with the driving direction of the vehicle as the actual riding path, and calculate F4.
Step 3: Calculating in-vehicle time cost. Passengers get on the bus at the fixed station α and get off at the fixed station γ, then the in-vehicle time cost F2 of αγ is calculated.
Step 4: Judgment and comparison. If the distance of passenger demand OD is relatively short, there is a situation of cycling directly without taking the traditional fixed-route transit. Therefore, it is necessary to determine the magnitude of μ2 (t(q)t(q)) + μ3 (d/δ + ξ*2) + μ3 (dβj/δ + ξ*2) and μ3 (dαβ/δ + ξ*2); select the smaller value as the actual travel path and calculate the time cost.

5. Result Analysis

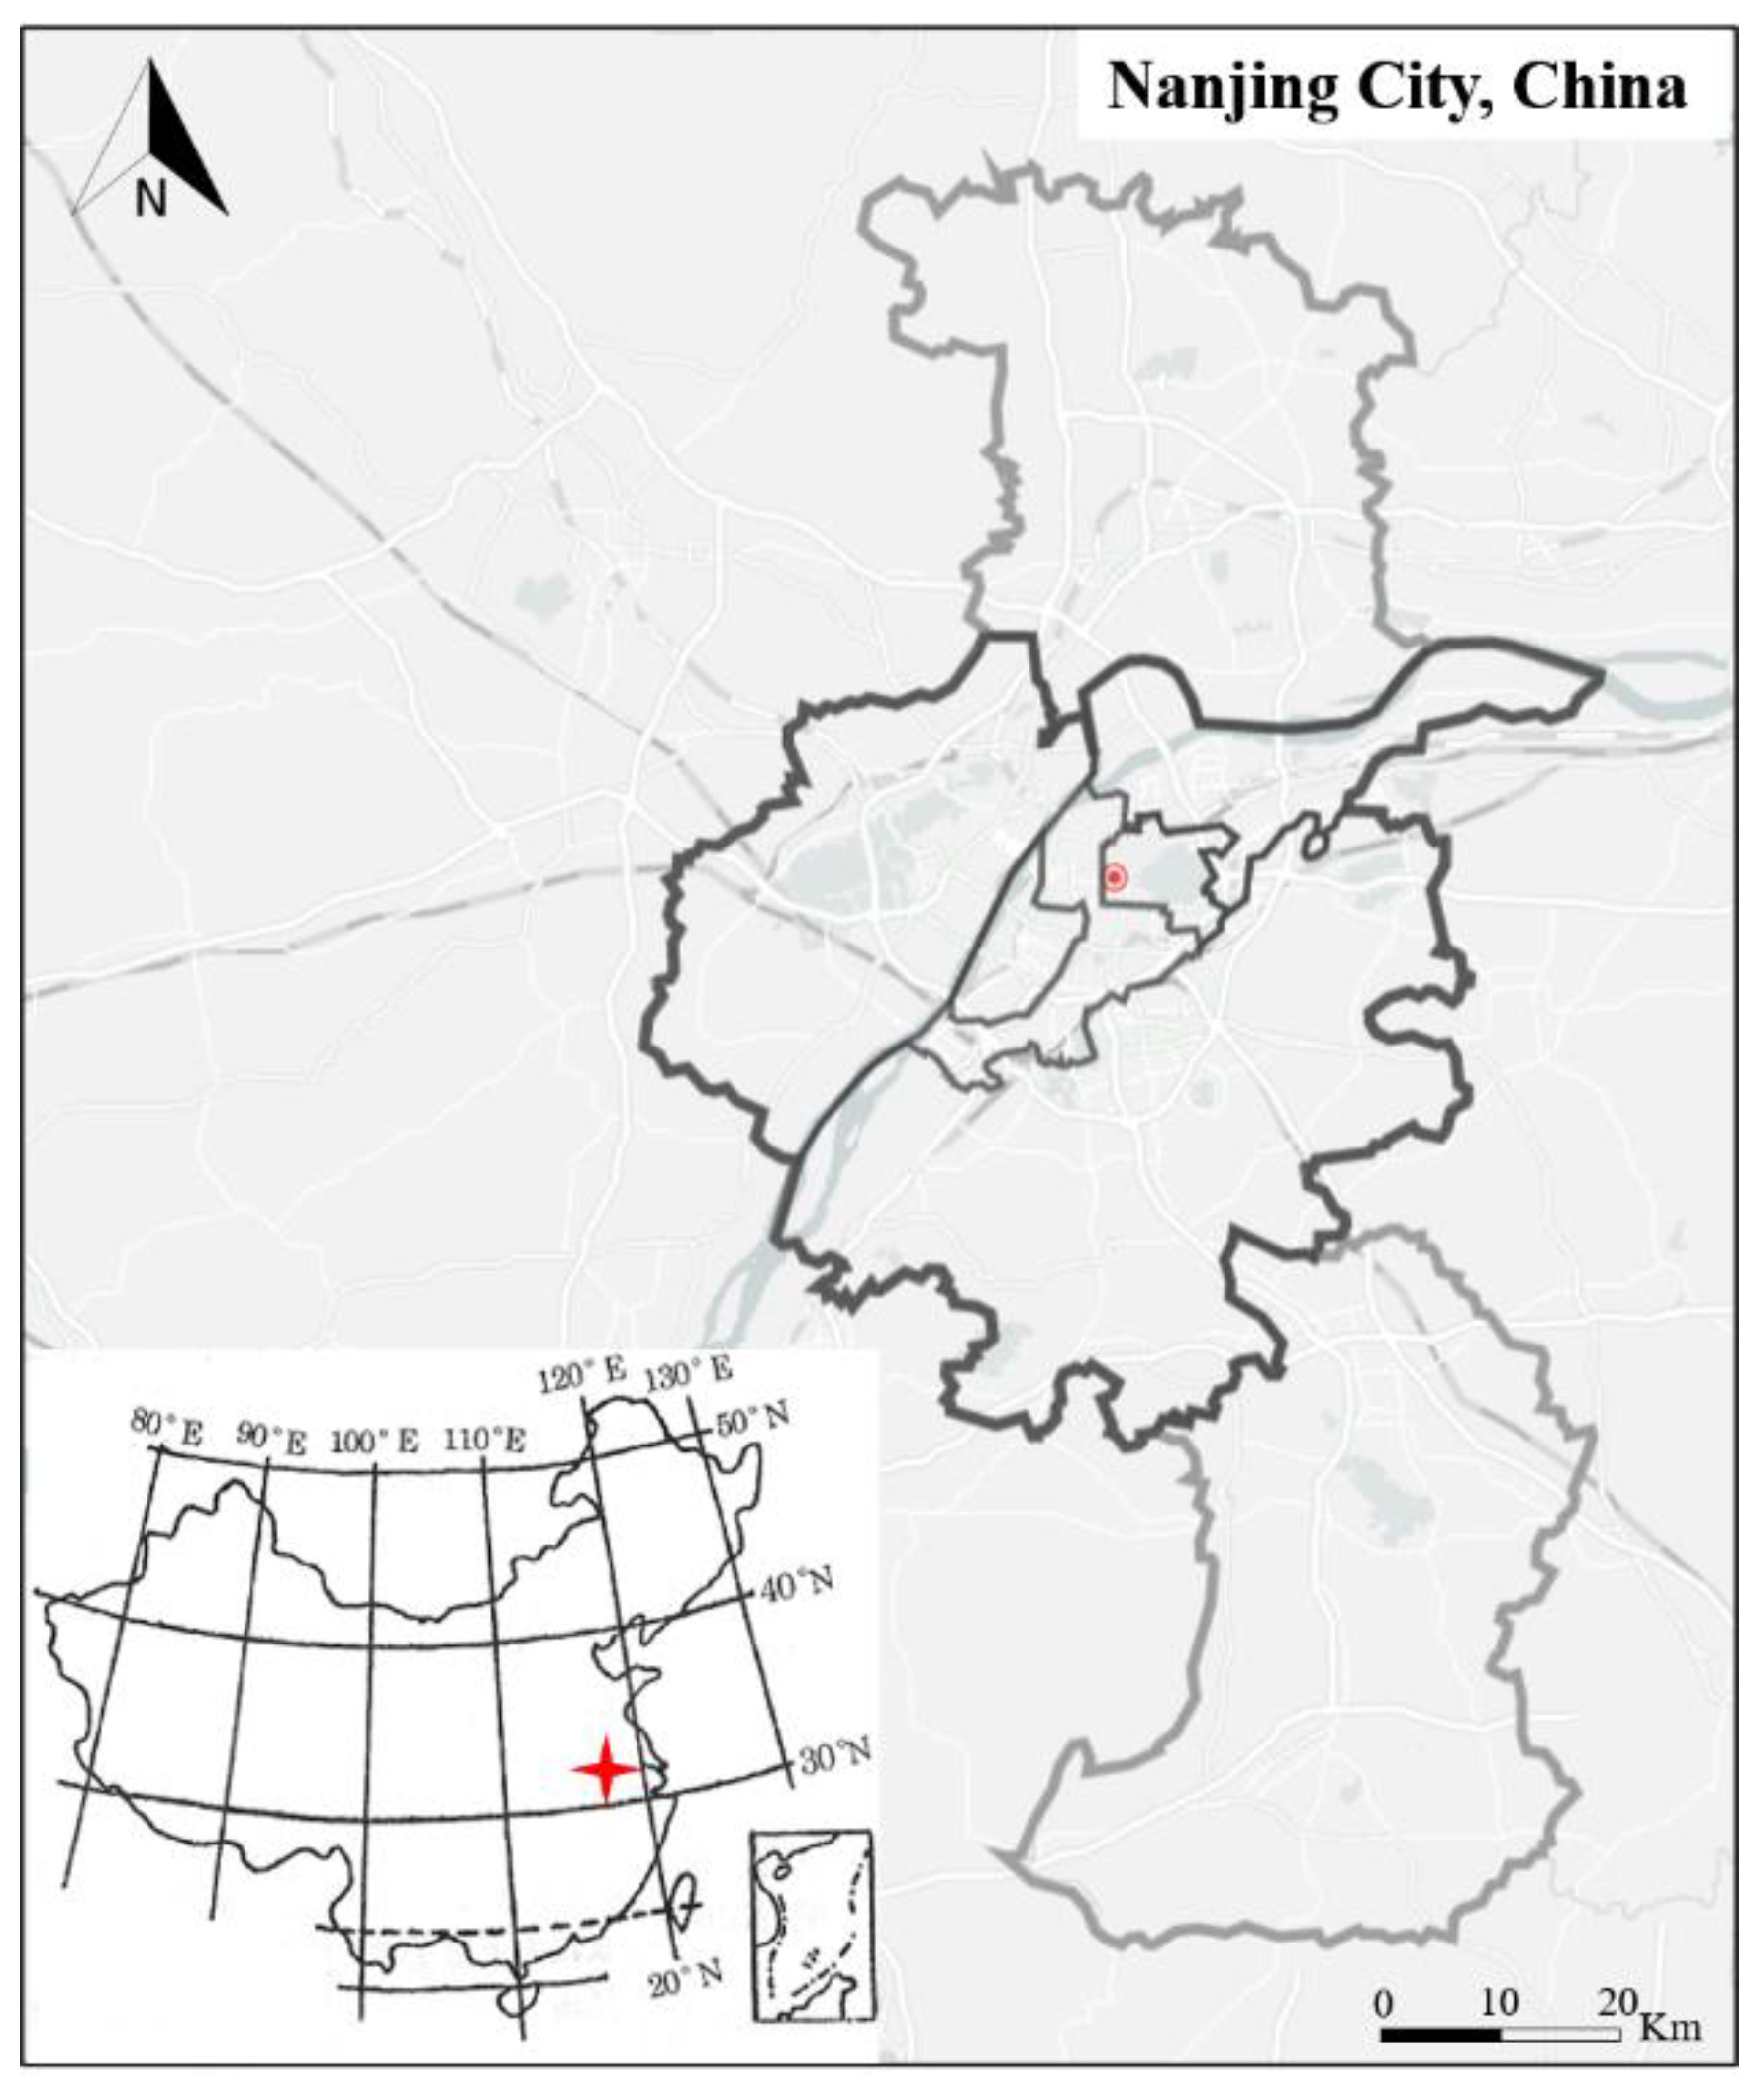
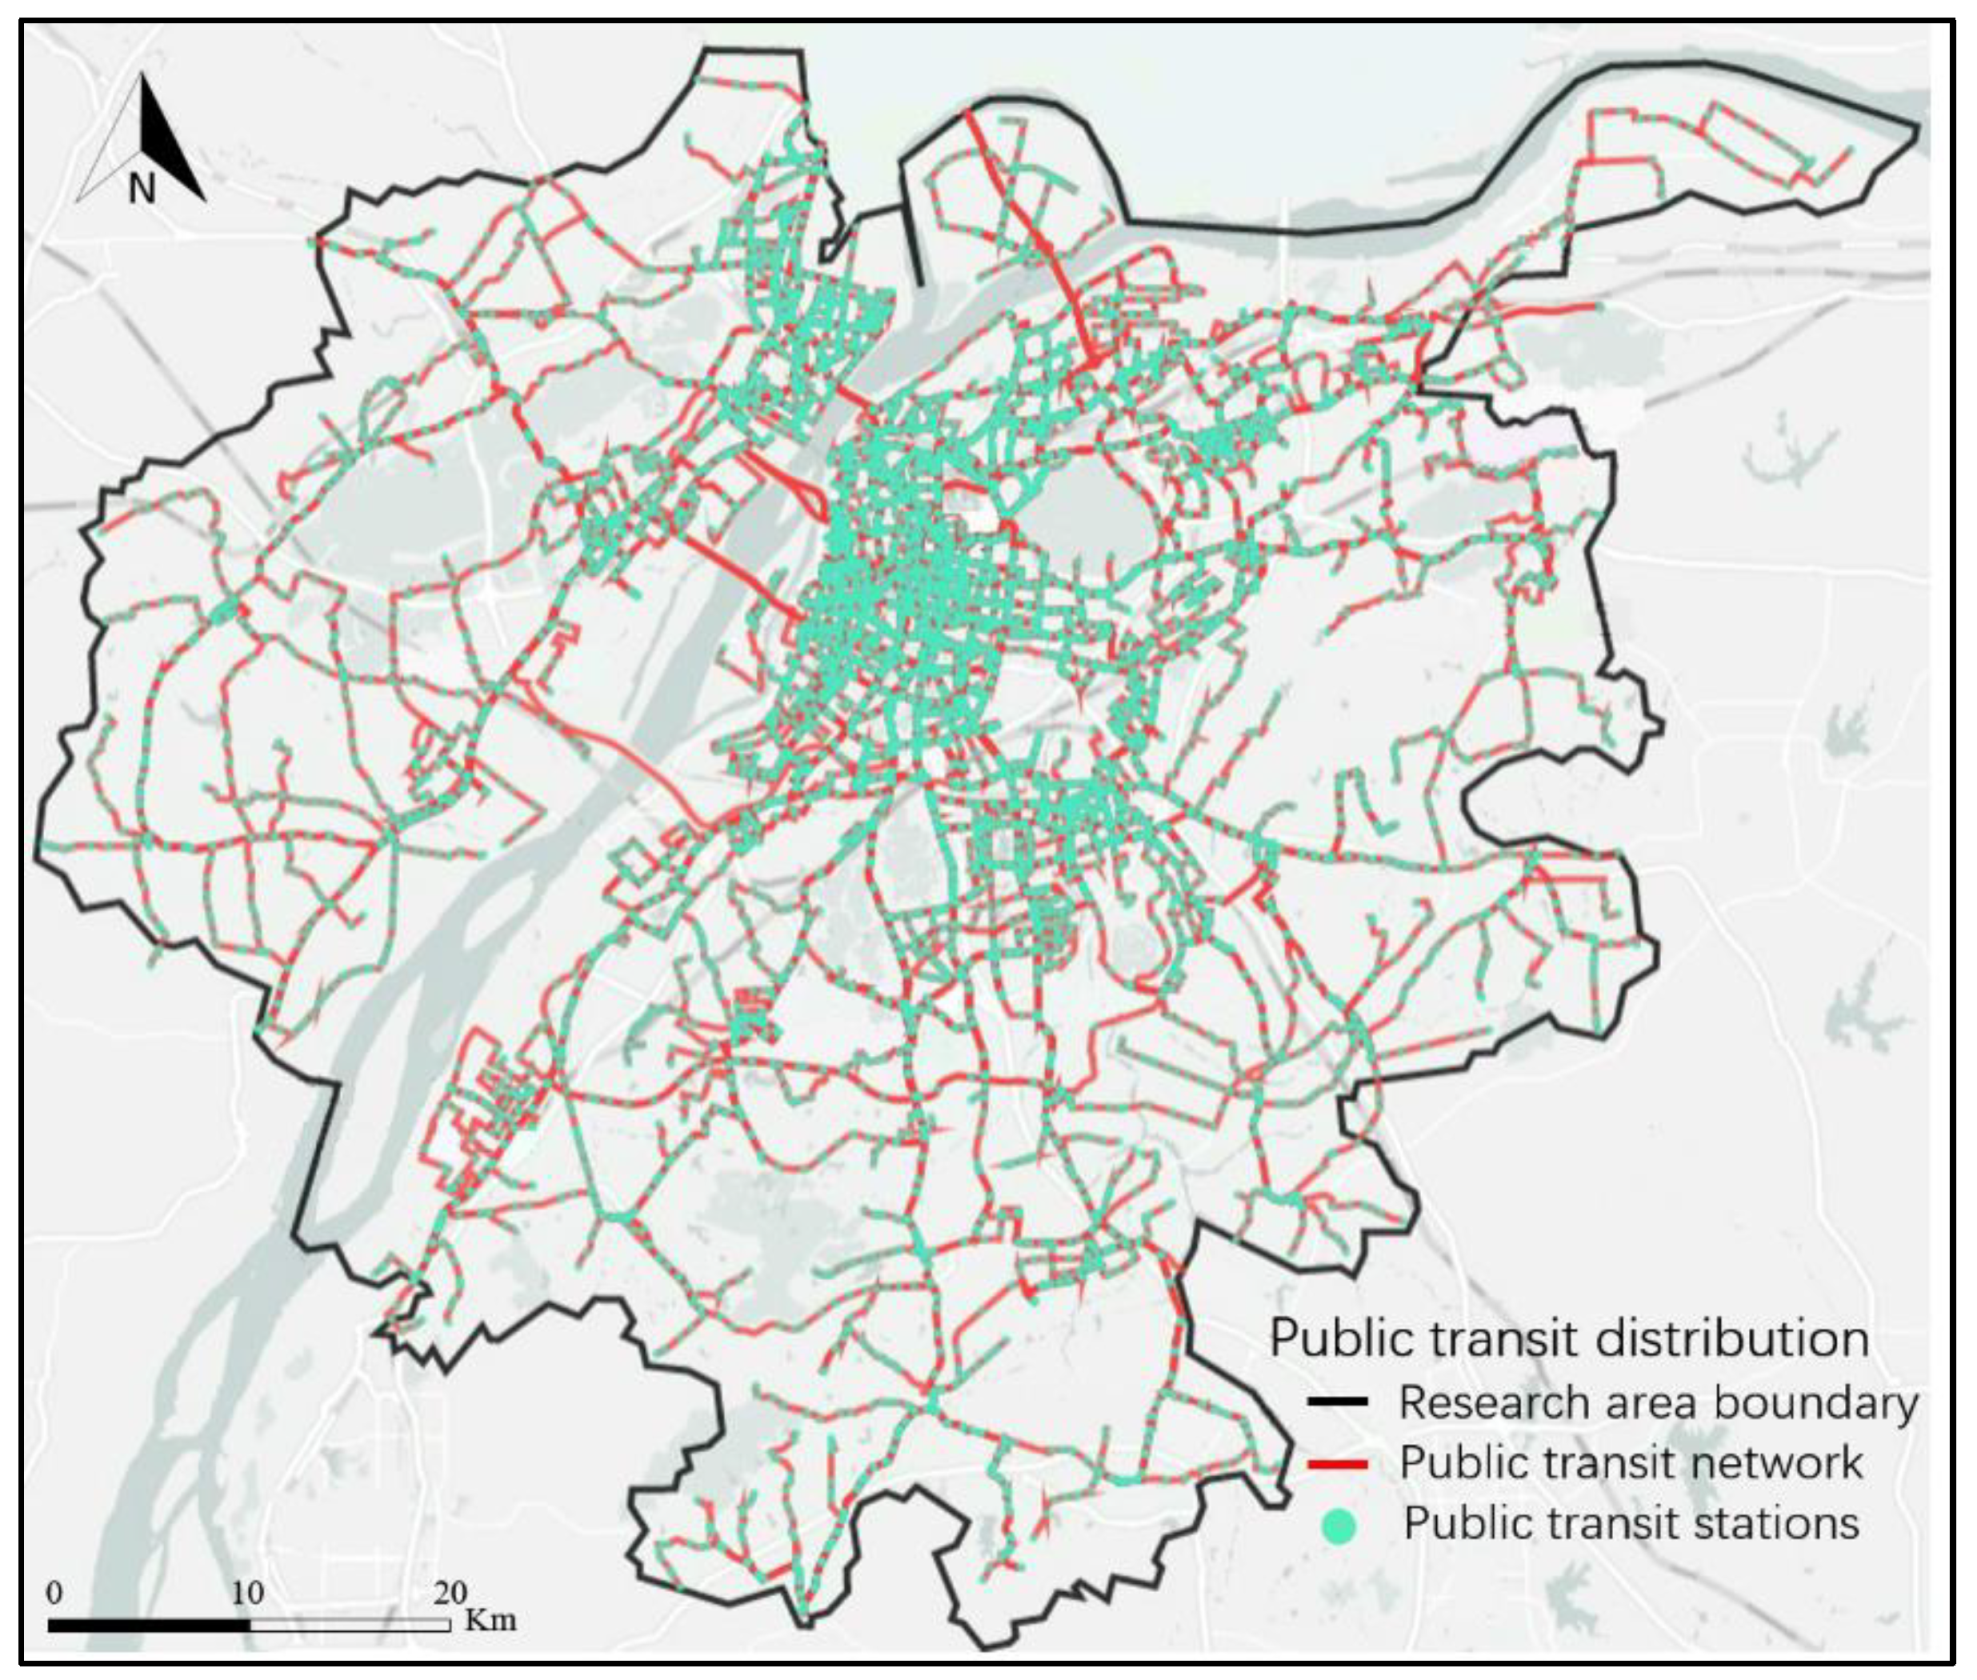
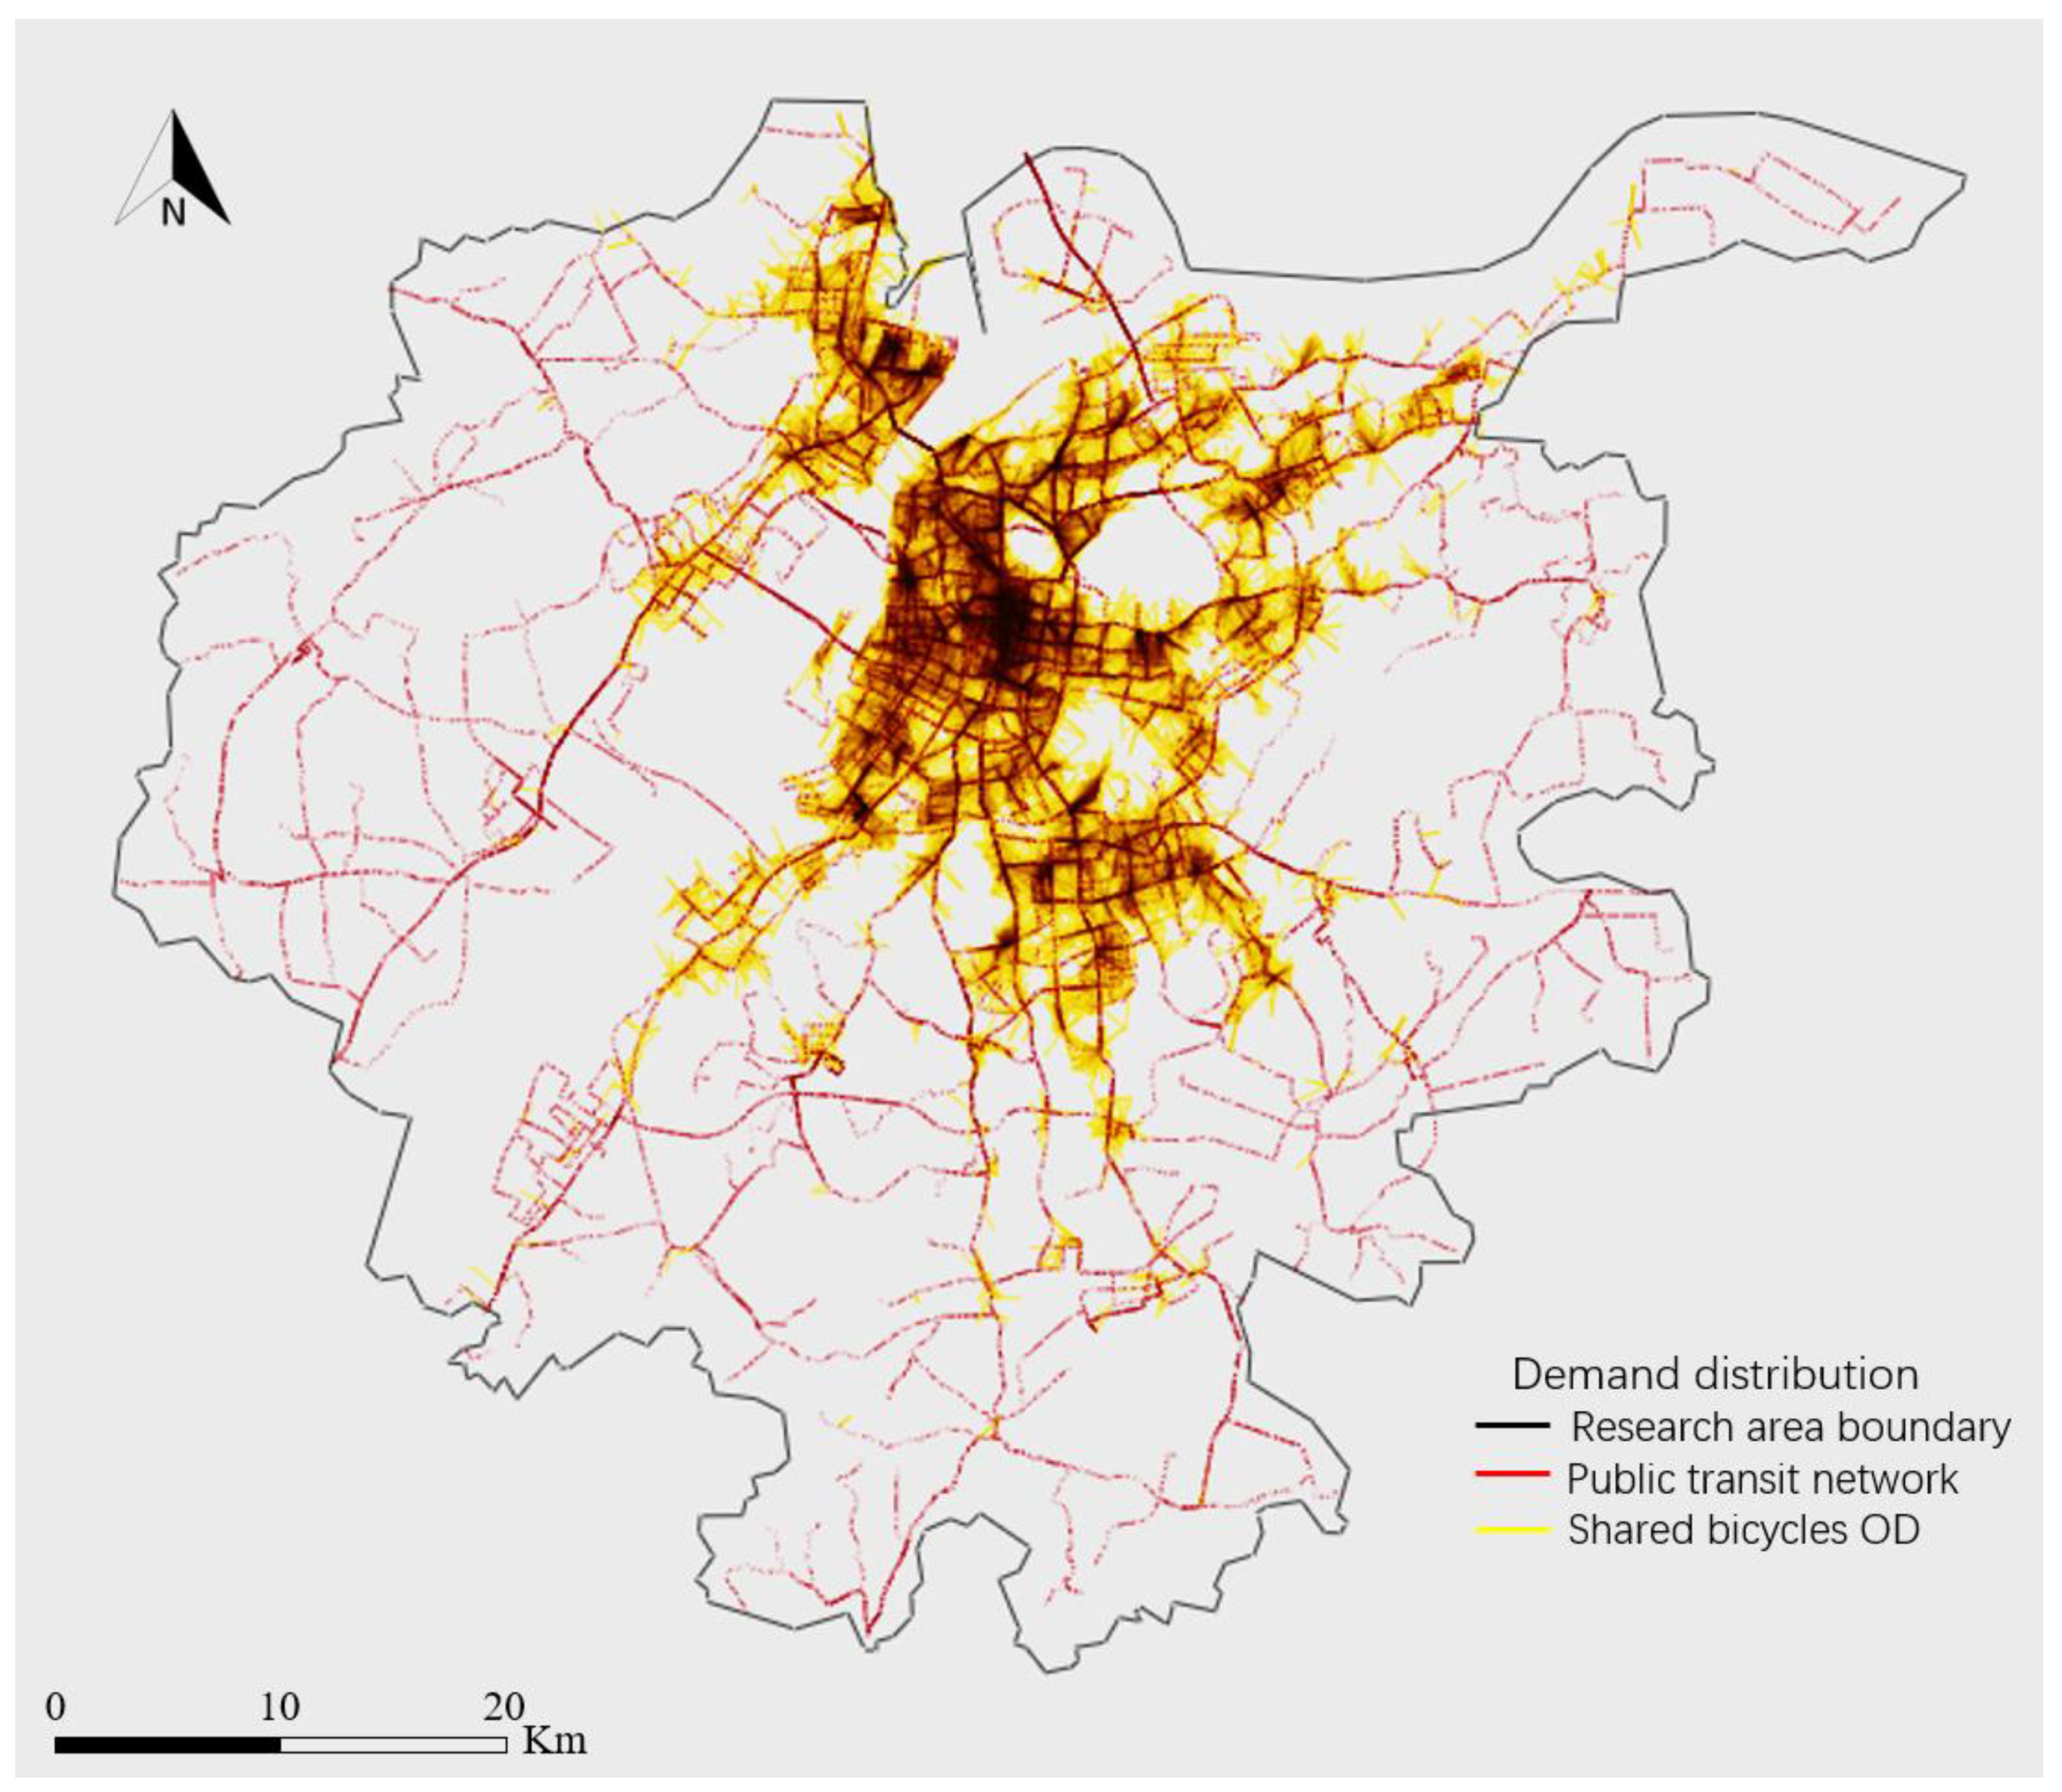
5.1. Research Area and Parameter Values

According to the characteristics of public transit and the regular travel pattern of shared bicycle users, a case is designed to compare and analyze the time cost of the flex-route transit system and that of the shared bicycle system. The case study area is Nanjing No. 100 bus route (one-way total length 9.57 miles), as shown in Figure 5. The OD pairs (the origin and destination of the riding are represented by straight line connection) of shared bicycles in the No. 100 bus station area, on 20 September, are also shown in the figure.
In the following analysis, the research area will be abstracted as a service area with a length of 10 miles and a width of 1 mile, assuming the vehicle and bicycle keep a constant speed in the service area. The other basic parameter values are shown in Table 1.

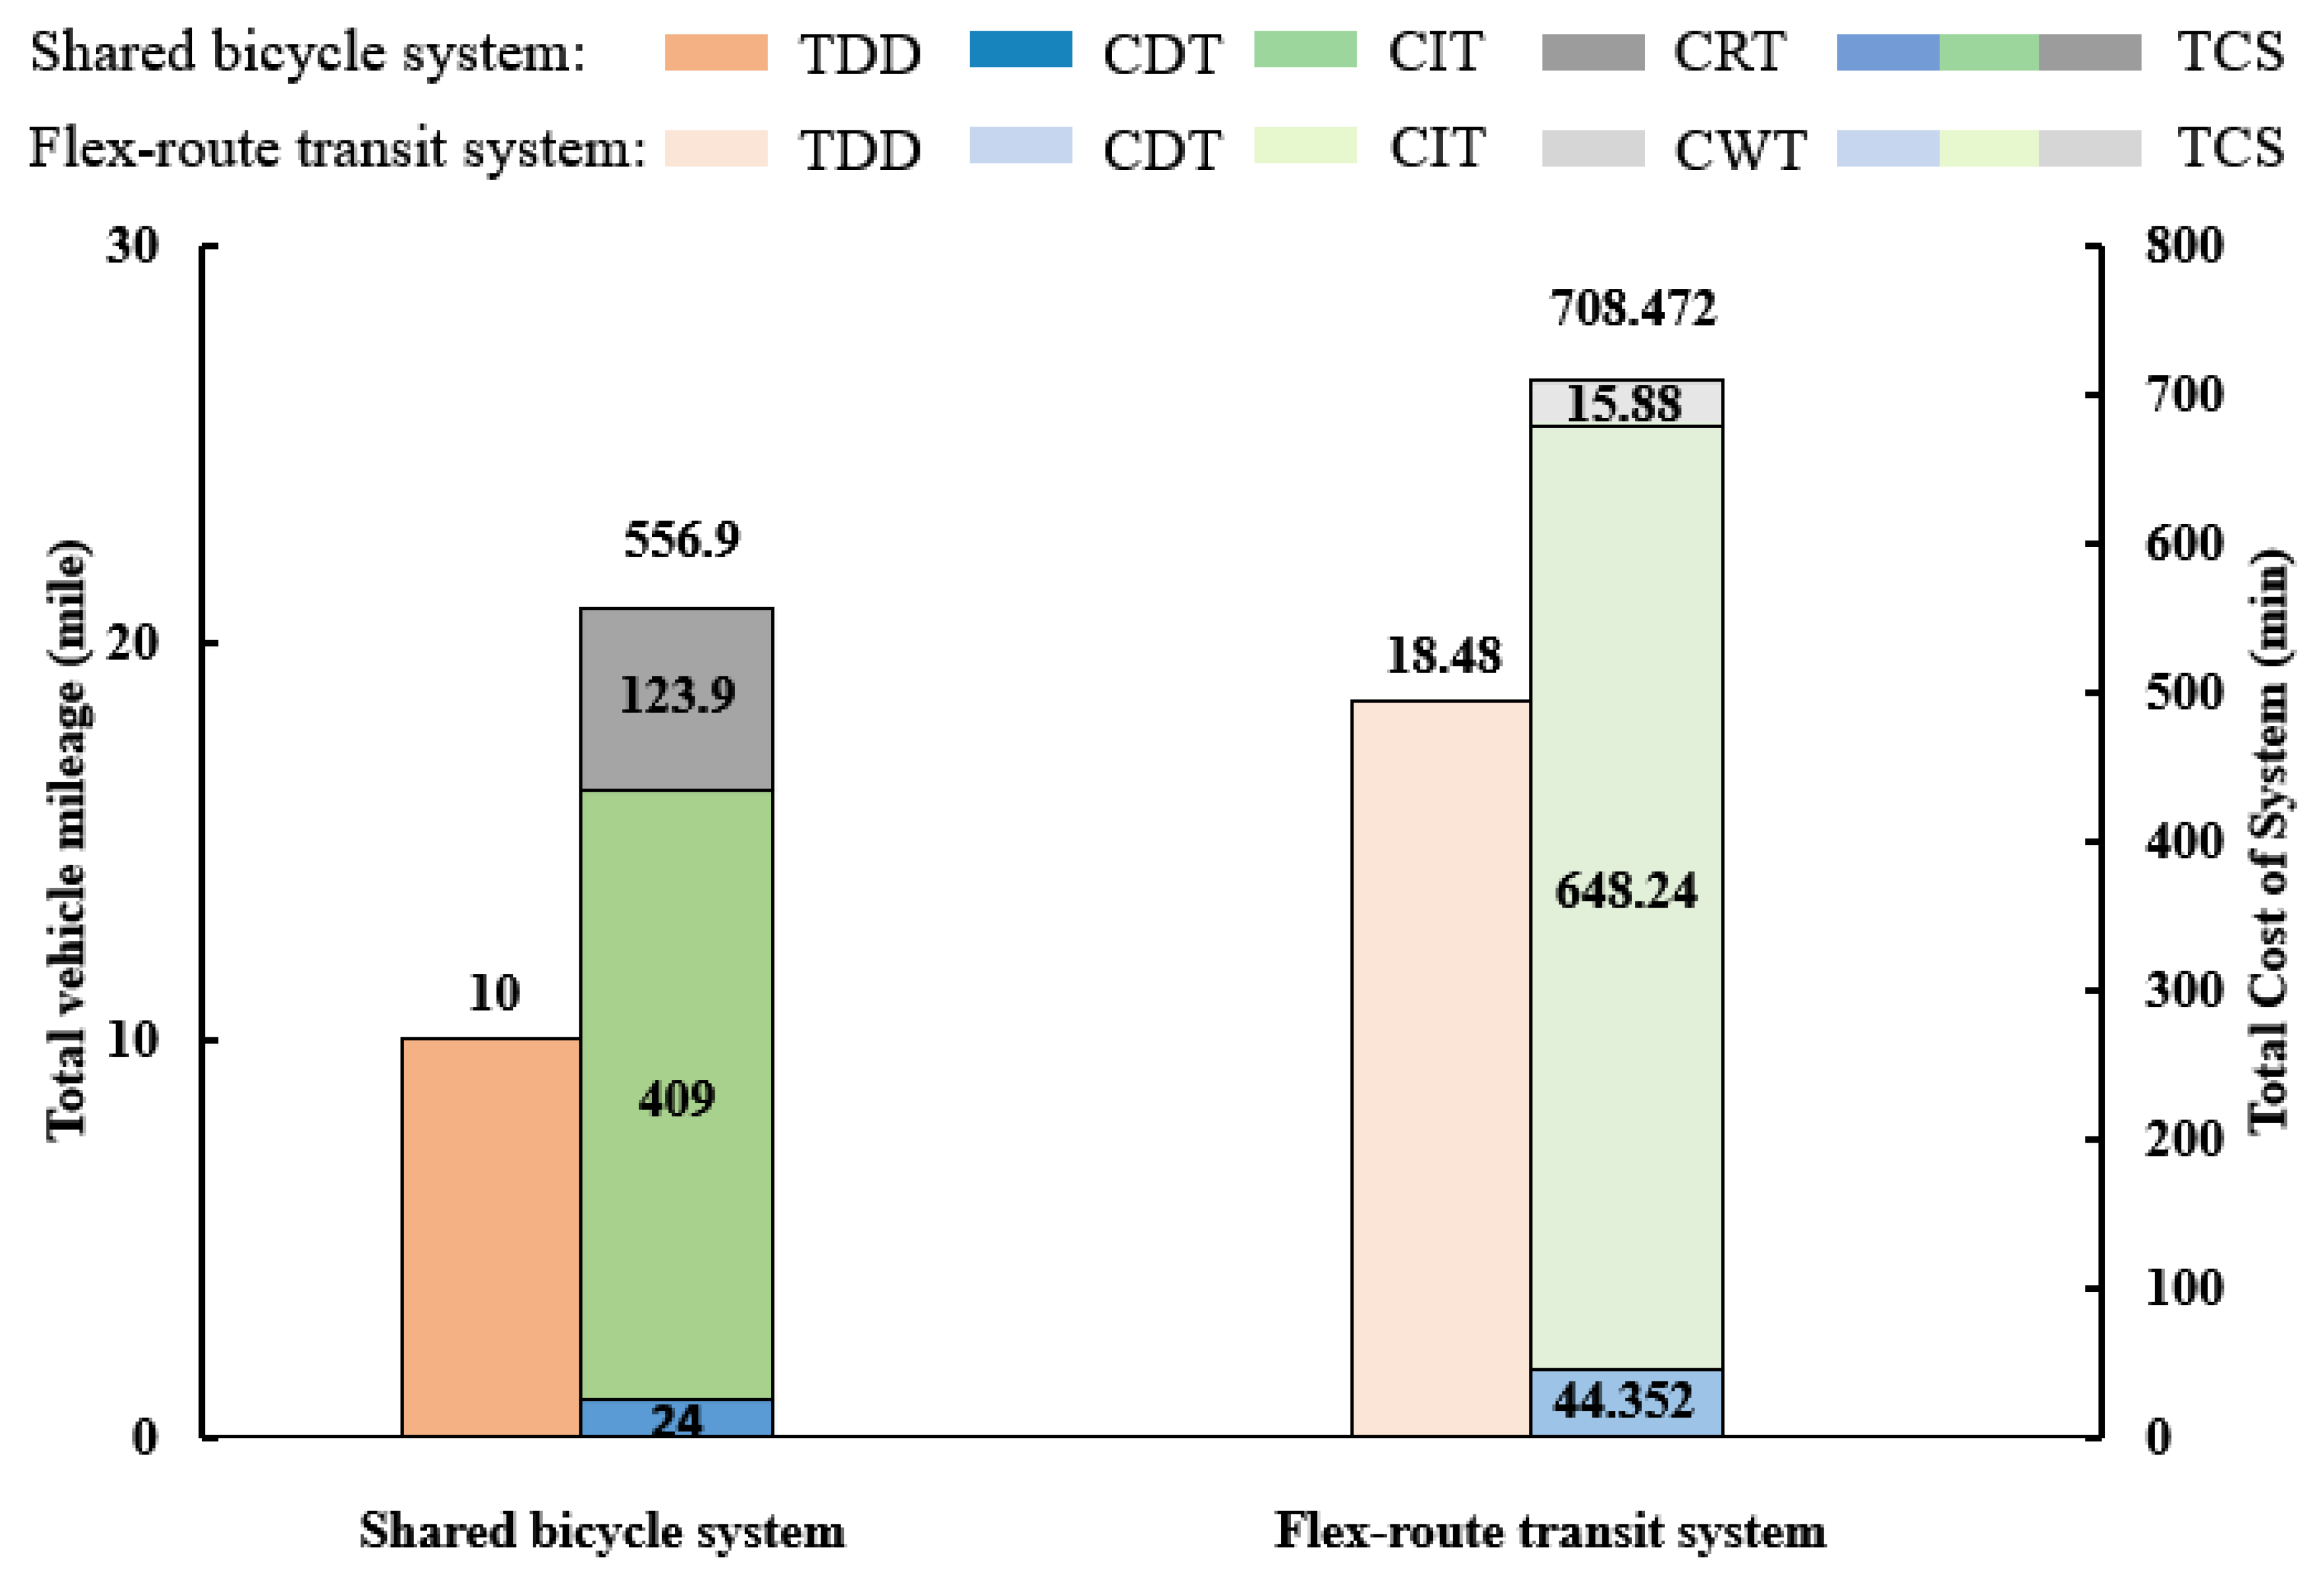
5.2. Comparison of Flex-Route Transit System and Shared Bicycle System

Taking into account the travel demand during daytime, the travel demand density of the single-line single-vehicle one-way in this area is initially set to 30/trip. In order to reflect the characteristics of the flex-route transit, the ratio of four types of passengers (N1, N2, N3 and N4) is set to 1:4:4:1. Therefore, 27 groups are randomly selected from the actual shared bicycle OD pairs (the shared bicycle OD pairs are all N2, N3 and N4 passengers), and three groups of N1 passengers are randomly generated. The relative position information of passenger travel demand is shown in Appendix A.
Taking into account the complexity of the model and the large amount of calculation involved, this paper develops a simulation model based on the MATLAB R2020a platform to analyze and evaluate the time cost index of the flex-route transit system and the shared bicycle system.
In the shared bicycle system of this paper, passengers need to ride shared bicycles and take the traditional fixed-route transit to travel. The traditional fixed-route transit includes base route and fixed stations. In this section, based on the actual situation, the station spacing is initially set to 0.5 miles, so the abstract research area contains 21 fixed stations. The travel route of passengers in the shared bicycle system is shown in Figure 6.
In the flex-route transit system of this paper, the flex-route transit mode is introduced to pick up or drop off shared bicycle users. The abstract research area contains a base route, and there are three checkpoints (generally, the stations with large passenger flow are selected as the checkpoints; the model in this paper takes the intermediate station as the checkpoint as an example) on the base route, including a starting station, a terminal station, and a control station; that is, the horizontal distance between two adjacent control stations (the starting and terminal stations can also be regarded as control stations) is 5 miles. The travel route of passengers in the flex-route transit system is shown in Figure 7.
In order to prevent accidents during the simulation process, a total of 500 simulation experiments were carried out, and the obtained results were averaged. Two travel modes are adopted; the driving route and Total Driving Distance (TDD) of the vehicle is different due to the different operating rule. At the same time, the Cost of Waiting Time (CWT), the Cost of In-vehicle Time (CIT), the Cost of Driving Time (CDT), and the Total Cost of System (TCS) are also different. The specific results are shown in Figure 8.
According to the results, it can be seen that the vehicle mileage is a small fixed value because the traditional fixed-route transit in the shared bicycle system always follows a base route. Flex-route transit needs to deviate from the base route to pick up or drop off passengers, so the vehicle mileage is relatively large. At the same time, the deviation of flex-route transit from base route will cause the detour of in-vehicle passengers, resulting in a longer in-vehicle time. On the whole, although passengers in the shared bicycle system do not need to detour, they need to generate a longer riding time. Therefore, the difference between the sums of the total time cost of the two systems is not too large (when passengers take the flex-route transit, each passenger will only spend about 5 min more, on average), indicating that the flex-route transit is feasible for picking up or dropping off shared bicycle users to a certain extent. Considering that flex-route transit can provide better comfort and convenience, it can help urban traffic organization to be more orderly. Thus, the introduction of flex-route for picking up or dropping off shared bicycle users has a certain positive effect on the improvement of passenger travel mode and the improvement of urban traffic management control.

5.3. Sensitivity Analysis

This section focuses on the sensitivity analysis of the relevant factors of the model. Sensitivity analysis is mainly used for exploring the influence of factors such as passenger demand density, fixed station spacing, and travel preference on the travel models of the flex-route transit system and shared bicycle system. During the simulation analysis of the models in this section, in order to ensure the stability of the results, 500 simulation experiments were performed each time. Multiple random times generated passenger demand points for 10/trip, 20/trip, 30/trip, 40/trip, and 50/trip in the service area and the average value was calculated. According to the existing literature [29], the average one way commuting distance of residents in most large and medium-sized cities is more than 5 miles. Therefore, in order to avoid randomly generating OD distances that are too short when generating demand in simulation, which is inconsistent with the real situation, the OD distance of a certain proportion should be more than 5 miles. The other basic parameter values are shown in Table 1.

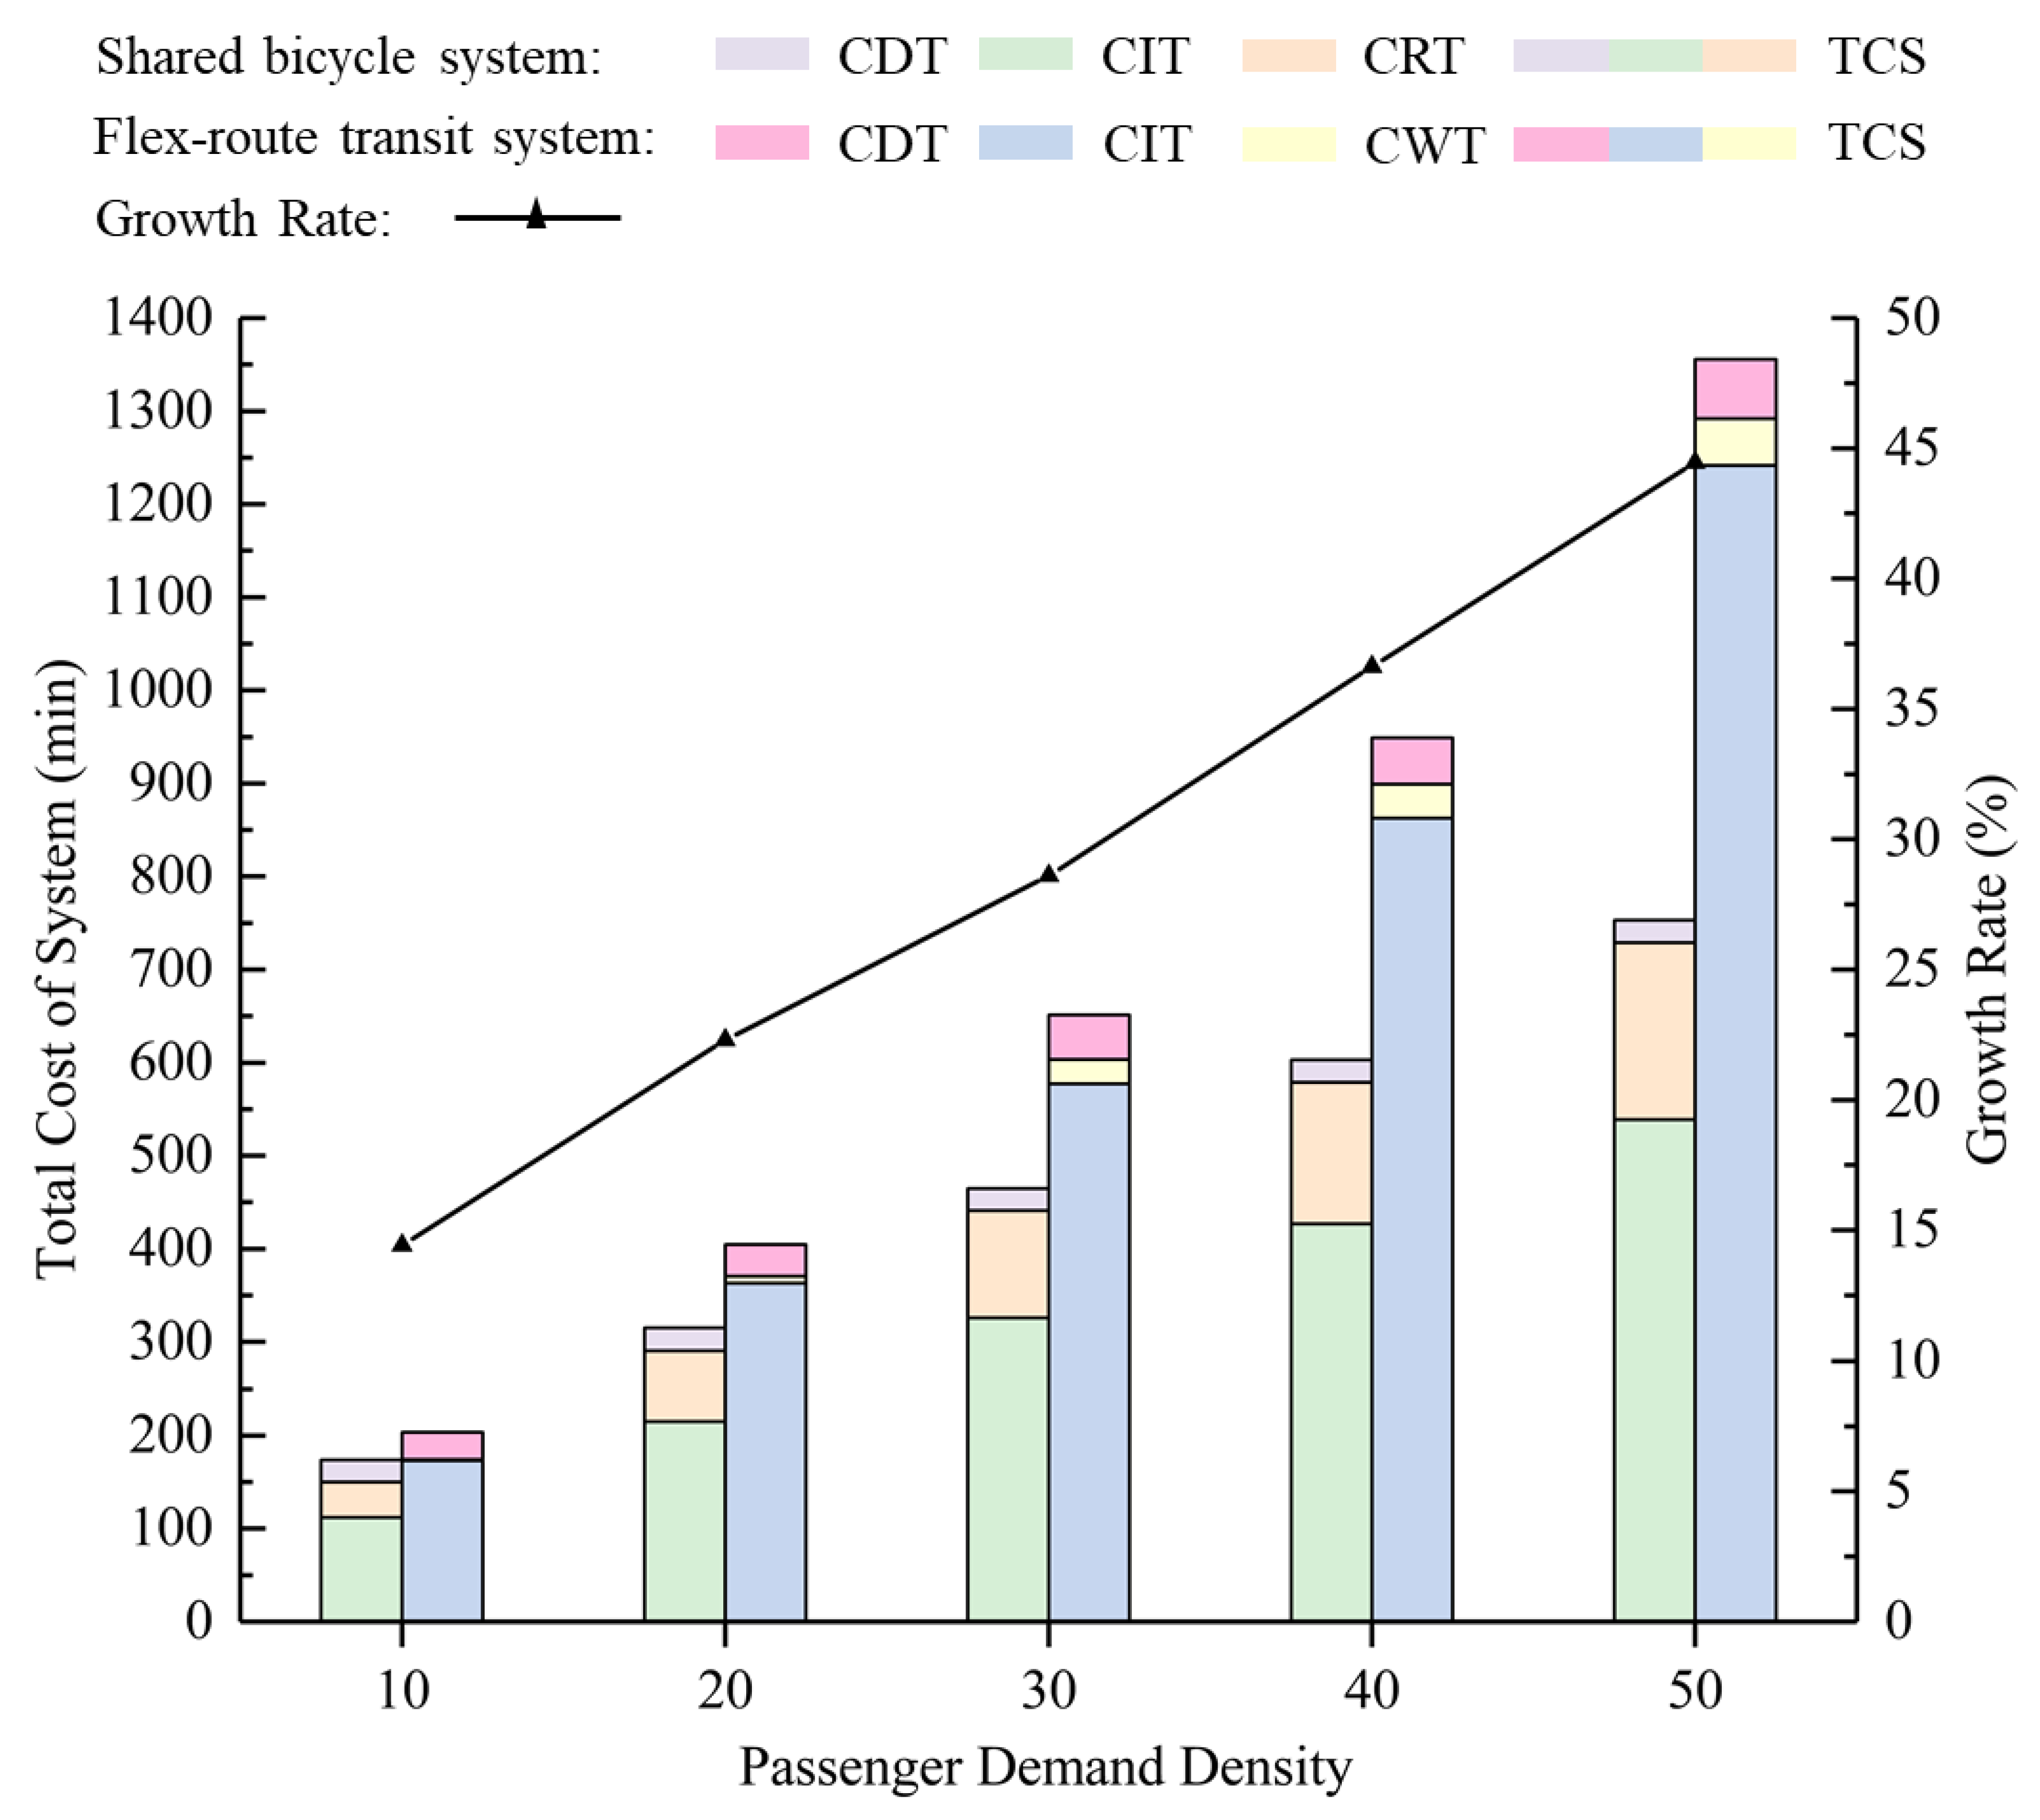
5.3.1. Impact Analysis of Passenger Demand Densities

In order to compare and analyze the impact of passenger demand densities on the shared bicycle system and the flex-route transit system, under the premise of keeping other parameters the same, five demand densities of 10/trip, 20/trip, 30/trip, 40/trip, and 50/trip are used to simulate the various time cost of systems under different demand conditions. Figure 9 shows the changing trend of the indicators of different systems under different passenger demand densities.
In the case of the same passenger demand density, the time cost of the shared bicycle system is lower than that of the flex-route transit system. Because the passengers in the shared bicycle system take the fixed-route transit, there is no detour. The flex-route transit needs to deviate from the base route to connect passengers, resulting in detour, which results in a greater time cost of passengers in the bus. With the increase in passenger demand densities, the increasing range in time cost of the flex-route transit system compared with the time cost of the shared bicycle system is shown in Figure 9. It can be seen from the growth rate that when the demand densities are low, the difference values of time cost between the two systems are small. As the demand densities increase, the difference values of time cost become larger and larger. When the densities are low, the difference values between the two systems are small because the shared bicycle users do not have detours when taking a fixed-route transit, and the CIT is small; however, a higher CRT will be generated, resulting in the relatively close total time costs of the two systems. When the demand densities are high, the difference values are larger because, as the number of passengers’ increases, the excess in-vehicle time also increases, and the rate of increase becomes faster. Therefore, considering safety and comfort, flex-route transit can be introduced to connect users when demand density is low, such as during suburban or off-peak periods. In the city center or peak periods with high demand densities, the shared bicycle system can help users travel more conveniently and efficiently. In order to attract more passengers to choose public transit in areas or time periods with high demand densities, the relevant departments can start with the aspects of right of way allocation of bus, bus lane setting, bus scheduling, and so on; these can be carried out so as to reduce the time cost of the public transit system and to improve the travel efficiency of passengers.

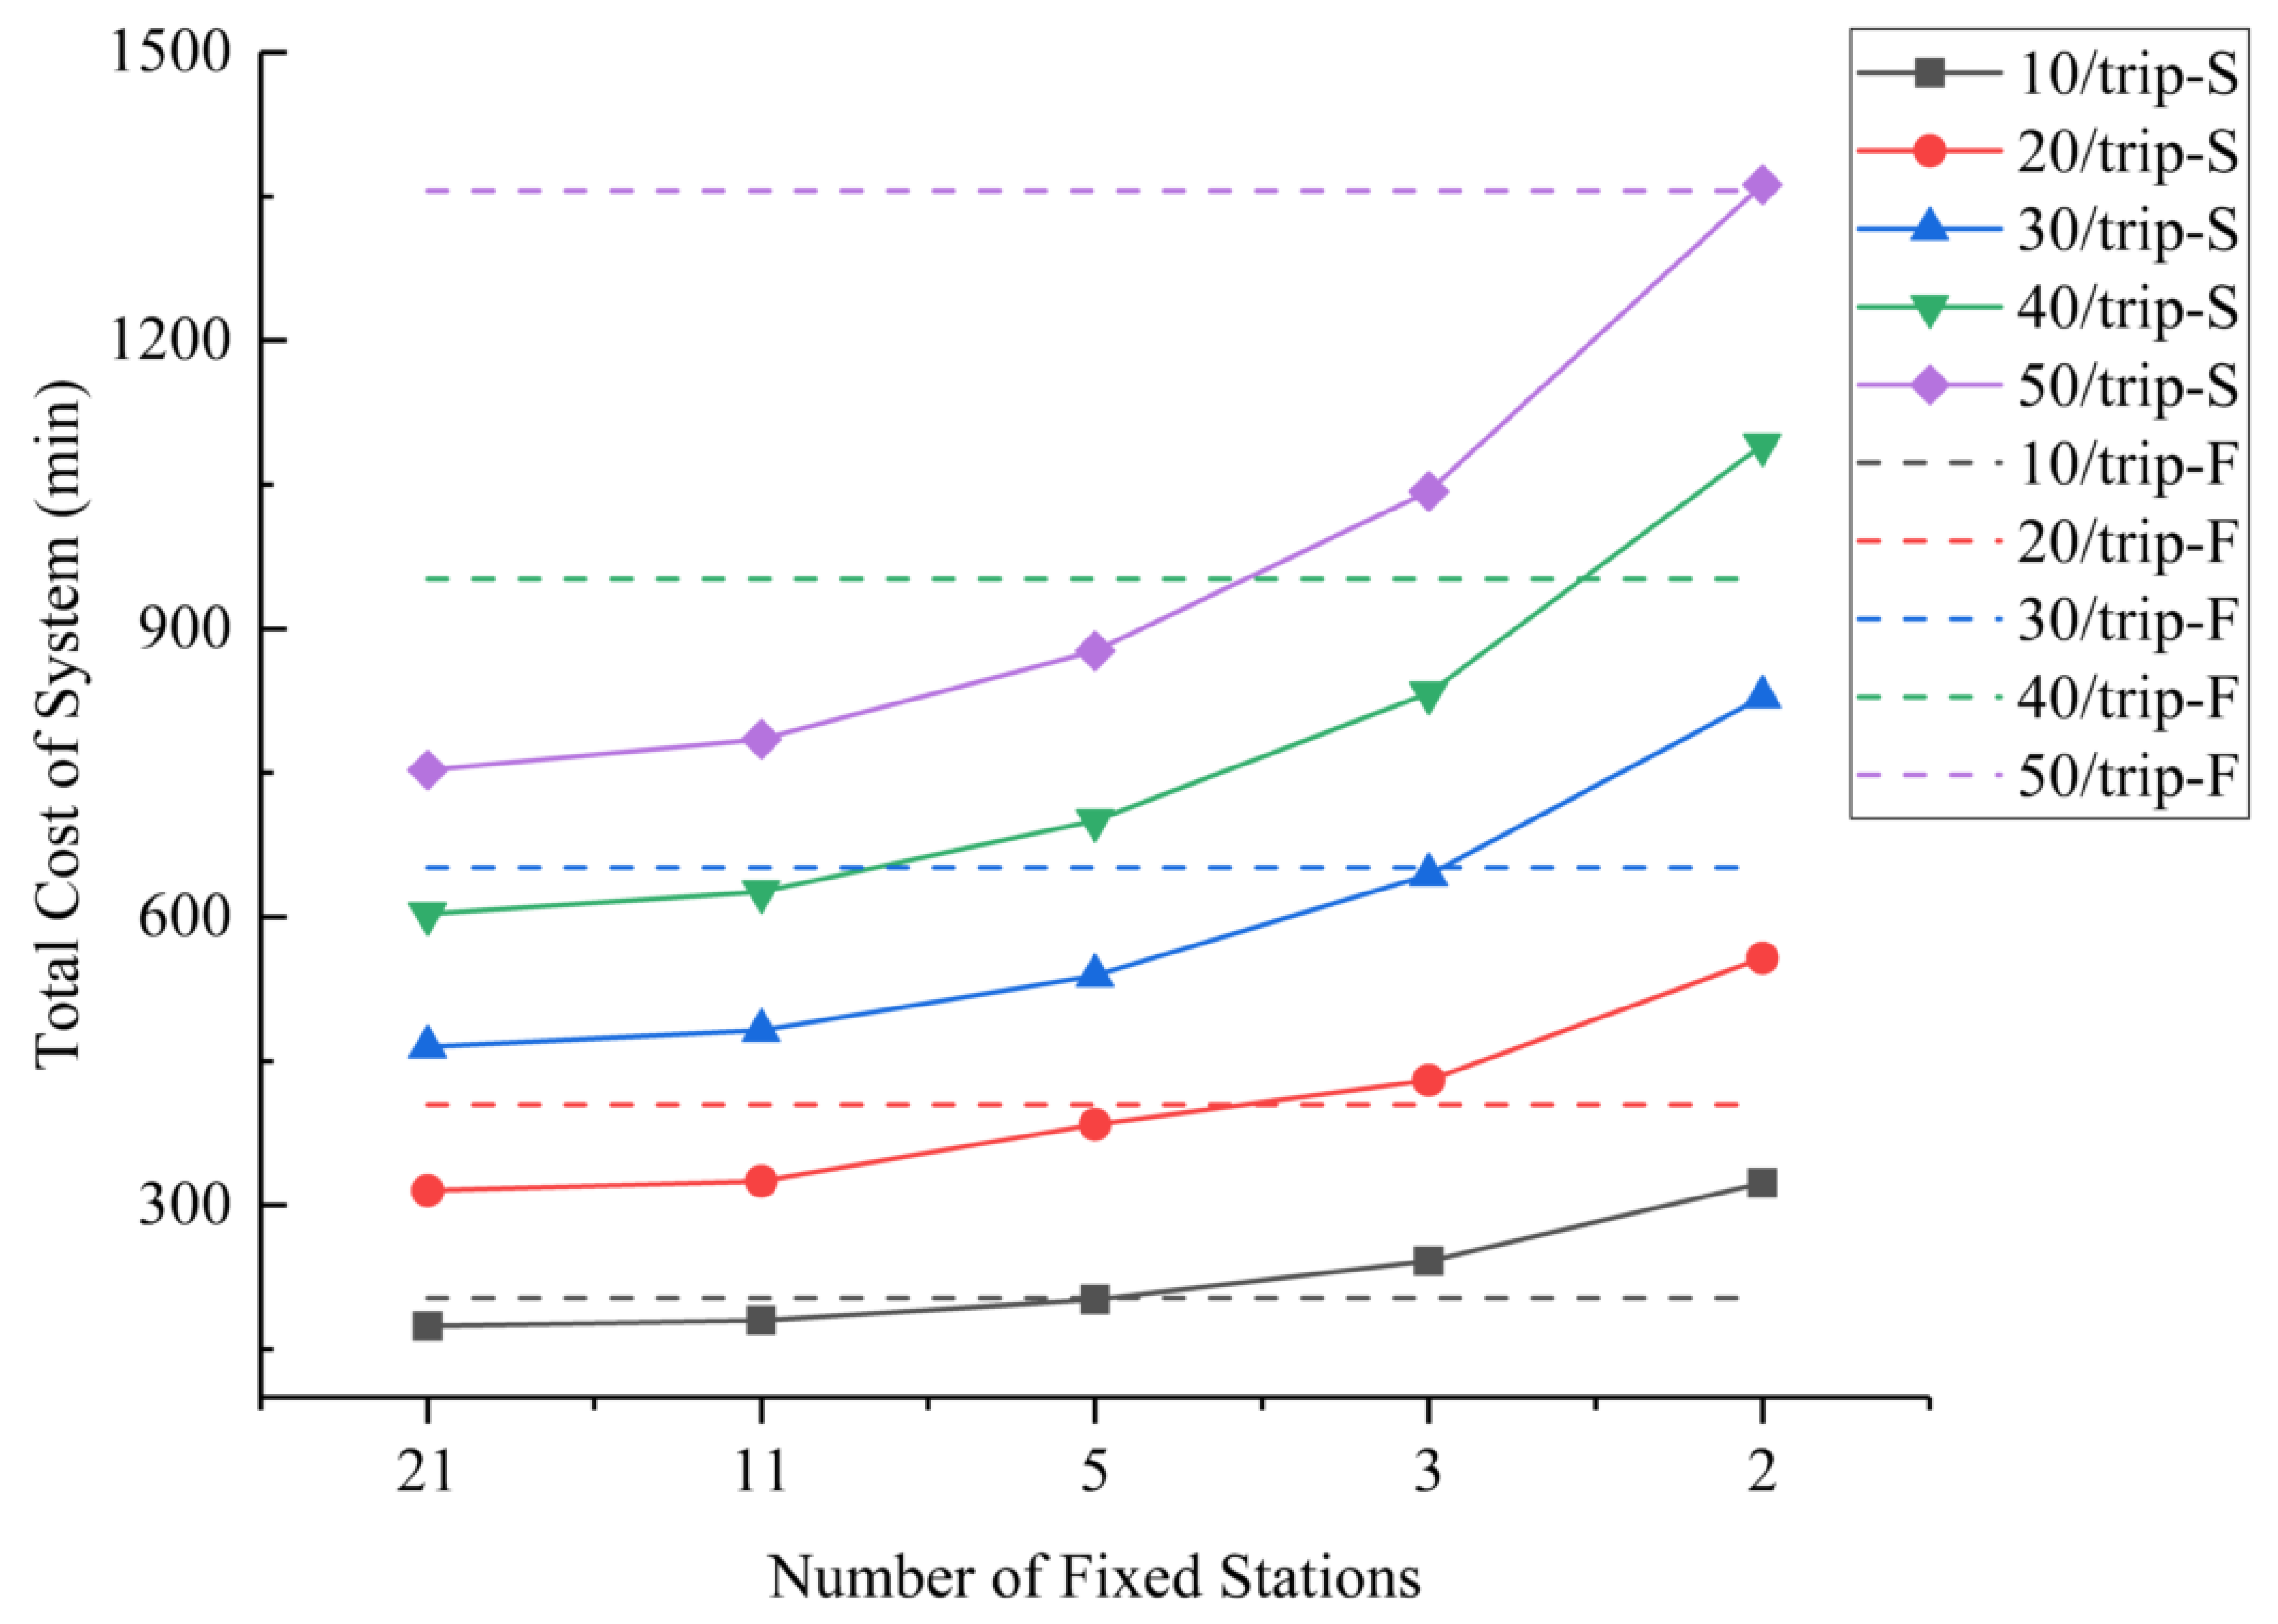
5.3.2. Impact Analysis of Fixed Station Spacing

In order to compare and analyze the impact of station spacing on the time cost of the shared bicycle system, different numbers of fixed station (different equal station spacing) were set to analyze the changes of time cost of the shared bicycle system under different demand densities and different station spacing. In this section, according to the scope of the case area, the numbers of fixed station are initially set to 21, 11, 5, 3, and 2, and the corresponding station spacing is 0.5 miles, 1 mile, 2.5 miles, 5 miles, and 10 miles, respectively. Figure 10 shows the changing trend of system indicators under different station spacing. The solid line indicates the shared bicycle system, and the dotted line indicates the flex-route transit system.
When the flex-route transit system deviates from the base route to connect passengers, its time cost is not affected by the number of fixed stations, so the time cost is relatively unchanged. The time cost of the shared bicycle system will increase with the increase of station spacing. This is because, as station spacing increases, users need to ride longer to reach the fixed station on the required bus route, and at the same time, the travel distance of passengers in the vehicle will increase, and the in-vehicle time will also increase. When the station spacing is too large, the time cost of the shared bicycle system will exceed the time cost of the flex-route transit, and the shared bicycle system will be lower in terms of safety, comfort, and convenience. Therefore, in suburbs or other areas with fewer public transit vehicles and large station spacing, the mode of flex-route transit can be introduced to pick up or drop off shared bicycle users who need to take traditional public transit.

5.3.3. Impact Analysis of Travel Preference

Passengers have different perceptions of time under different conditions. When riding a bicycle, commuters need to ride or walk to the bus station in order to take the bus. The purpose and state of riding and walking are similar. As there is no research on the specific parameters of riding time perception, this paper refers to the research on walking time perception [30]) or waiting for bus [28,31]; accordingly, the passenger will feel a slower time compared to an in-vehicle situation, due to fatigue, anxiety, and other emotions. This section introduces passenger travel preference attributes to study the impact of various situations on passenger time perception, which in turn affects passengers’ travel choices. Because passengers have different perceptions of time when riding a bicycle or taking a bus, the ratio of ω1/ω2 and ω3/ω4 is divided into 1:1 and 1:2, and the variation of time cost of the systems at different ω ratios is analyzed. When the ratio of ω1, ω2, and ω3 (ω4) is 1:1:1, set ω1, ω2, and ω3 (ω4) to 1/3, 1/3, and 1/3, respectively. When the ratio of ω1, ω2, and ω3 (ω4) is 1:1:2, set ω1, ω2, and ω3 (ω4) to 0.25, 0.25, and 0.5, respectively. Figure 11 shows the changing trend of system indicators under different passenger demand densities, different station spacing, and different ω ratios. The black solid line between the two black dots in the figure represents the time cost value range of the shared bicycle system under different demand densities and different station spacing when the ω ratio is 1:1. The red dotted line between the two red dots represents the time cost value range of the shared bicycle system under different demand densities and different station spacing when the ω ratio is 1:2. The blue solid line represents the variation trend of the time cost of the flex-route transit system under different demand densities when the ω ratio is 1:1. The blue dotted line represents the variation trend of the time cost of the flex-route transit system under different demand densities when the ω ratio is 1:2.
Flexible features, cycling culture, and energy-saving awareness will increase passengers’ choices for shared bicycle. The increase of bicycle station facilities near public transit stations can promote the use of shared bicycle, while the inaccurate real-time arrival information of buses and the crowded interior environment will also promote the use of shared bicycle. The availability of preferential information for shared bicycle will also increase its selection rate. All these situations will promote the use of shared bicycle [1,32,33,34,35]. Users will not feel extra anxiety when riding a bicycle, making the ω ratio to 1:1. The time cost of the shared bicycle system in areas with high travel demand and high-density public transit network is lower than that of the flex-route transit system, which can provide passengers with faster and more efficient travel. It shows that shared bicycle has a good complement to urban traffic. In the travel environment, the larger the distance between the OD and the public transit transfer station, the less shared bicycle will be used. Extreme weather such as precipitation, snowfall, and high temperature will reduce the use of shared bicycle. Insufficient safety barriers, narrow lane width, and excessive number of intersections all reduce the comfort and safety of riding, so the negative effect is significant. Carrying elderly or children will reduce the use of shared bicycle. Insufficient delivery of shared bicycle and high damage rate will reduce the selection rate of shared bicycle. Tiredness or the desire to relax will also reduce the use of shared bicycle. All these situations will inhibit the use of shared bicycle [1,32,33,34,35]. These conditions cause users to feel anxious when riding a bicycle, making the ω ratio to 1:2 (due to the lack of research on the time-awareness parameters, the ω ratio is tentatively set to 1:2 according to the relevant descriptions and values in the literature [1,28]). The time cost of the shared bicycle system is obviously higher than that of the flex-route transit system, indicating that it is feasible and preferable to introduce flex-route transit to pick up or drop off shared bicycle users at this time.

6. Conclusions

Based on the current situation of urban traffic and the characteristics of shared bicycle and its users, this paper introduced flex-route transit to pick up or drop off shared bicycle users, so as to coordinate the urban traffic system while meeting the diverse and high-quality travel needs of passengers. This paper took the demand analysis of flex-route transit as the starting point, analyzed the potential users of flex-route transit, as well as the travel demand and the selection of flexible stations by mining shared bicycle data and the public transit data. The time cost models of the shared bicycle system and the flex-route transit system were constructed, compared, and analyzed to explore the feasibility of flex-route transit picking up or dropping off shared bicycle users under different conditions. Regarding route design, in order to optimize the driving route of the vehicle connecting users, and to compare the total time cost between systems more intuitively and reasonably, this paper comprehensively considers the characteristics of passenger location distribution, passenger in-vehicle time, and vehicle driving distance, and establishes a flex-route transit route design model under objective of minimizing the sum of vehicle driving time cost and passenger time cost.
Through the subsequent sensitivity analysis, the influence of passenger demand density, fixed station spacing, and travel preference attribute on the two systems were analyzed separately. Firstly, this paper compared the various time costs of the two systems under different demand densities, and found that it is feasible to introduce flex-route transit picking up or dropping off shared bicycle users in low passenger demand such as suburban villages or off-peak period; however, in core areas with heavy traffic or during peak period, shared bicycle can help users travel more efficiently. Secondly, this paper compared and analyzed the impact of station spacing on the time cost of shared bicycle system. It was found that when the station spacing is too large, the time cost of the shared bicycle system will exceed the time cost of the flex-route transit system. Therefore, flex-route transit mode can be introduced in suburban areas with less public transit vehicles and larger fixed station spacing to pick up or drop off shared bicycle users who need to take traditional public transit. Thirdly, the passenger travel preference attribute was introduced in order to study the impact of various situations on the time cost of the two systems. It was found that, in some cases that are not conducive to the use of shared bicycle, flex-route transit can help shared bicycle users to better complete their travel.
The analyses and results of this paper are only one of the attempts to reveal the influence and attraction of flex-route transit on shared bicycle users. We hope that these results will inspire more research on travel mode conversion, especially on how to formulate specific strategies to increase the attractiveness of public transit. It is a research direction to study passenger travel preferences for the transformation of travel mode, as well as studying the psychology of passengers in different situations and formulating corresponding policies that will attract them to use public transit more often. Considering the high cost of flex-route transit in high-density areas or peak periods, it is possible to consider multi-vehicles to pick up or drop off passengers in coordination. Based on the characteristics of shared bicycle users in different areas at different times, multi-vehicle scheduling and route planning can be studied to reduce system operating cost while properly meeting passenger travel needs.

Author Contributions

Methodology, software, validation, data curation, writing—original draft preparation, visualization, J.Z.; conceptualization, formal analysis, writing—review & editing, supervision, project administration, funding acquisition, W.L.; software, validation, visualization, G.W.; data curation, J.Y. All authors have read and agreed to the published version of the manuscript.

Funding

This research is supported by National Key Research and Development Program in China (Grant No. 2018YFB1601001).

Institutional Review Board Statement

Not applicable.

Informed Consent Statement

Not applicable.

Data Availability Statement

Data sharing not applicable.

Conflicts of Interest

The authors declare no potential conflict of interests.

Appendix A

Table A1. Relative location information of passenger travel demand.
TypeOrigin xOrigin yDestination xDestination yReserved TimeID
N100.5100.501
N100.550.502
N100.550.503
N250.59.160.9204
N250.56.920.3205
N250.59.40.92206
N200.54.830.507
N200.58.840.208
N200.55.440.3109
N200.57.920.84010
N250.57.080.642011
N200.56.170.68012
N250.56.730.362013
N200.57.950.49014
N200.57.750.76015
N38.170.85100.53316
N31.920.8650.5917
N32.850.750.51318
N35.460.64100.52119
N39.270.86100.54020
N30.890.2450.5221
N31.990.98100.51022
N31.750.85100.5823
N39.620.57100.54124
N31.770.51100.5825
N31.650.49100.5526
N31.990.62100.5927
N40.260.325.330.33128
N41.350.916.020.36629
N46.410.666.750.742630

References

  1. Zhou, H.; Zhang, C.; Li, H. Influencing factors on the coopetition relationship between public bus and bike sharing based on traveler’s choice. J. Chang’an Univ. 2020, 22, 48–61. [Google Scholar]
  2. Becker, J.; Teal, R.; Mossige, R. Metropolitan Transit Agency’s Experience Operating General-Public Demand-Responsive Transit. Transp. Res. Rec. J. Transp. Res. Board 2013, 2352, 136–145. [Google Scholar] [CrossRef]
  3. Fittante, S.R.; Lubin, A. Adapting the Swedish Service Route Model to Suburban Transit in the United States. Transp. Res. Rec. J. Transp. Res. Board 2016, 2563, 52–59. [Google Scholar] [CrossRef]
  4. Chang, S.K.; Lee, C.J. Welfare comparison of fixed-and flexible-route bus systems. Transportation Research Record. J. Trans. Res. Board. 1993, 1390, 16–22. [Google Scholar]
  5. Li, X.; Quadrifoglio, L. Optimal Zone Design for Feeder Transit Services. Transp. Res. Rec. J. Transp. Res. Board 2009, 2111, 100–108. [Google Scholar] [CrossRef] [Green Version]
  6. Kim, M.; Schonfeld, P. Conventional, Flexible, and Variable-Type Bus Services. J. Transp. Eng. 2012, 138, 263–273. [Google Scholar] [CrossRef]
  7. Kim, M.; Schonfeld, P. Integrating bus services with mixed fleets. Transp. Res. Part B Methodol. 2013, 55, 227–244. [Google Scholar] [CrossRef]
  8. Kim, M.; Schonfeld, P. Integration of conventional and flexible bus services with timed transfers. Transp. Res. Part B Methodol. 2014, 68, 76–97. [Google Scholar] [CrossRef]
  9. Kim, M.; Schonfeld, P. Maximizing net benefits for conventional and flexible bus services. Transp. Res. Part A Policy Pract. 2015, 80, 116–133. [Google Scholar] [CrossRef]
  10. Zheng, Y.; Li, W.; Qiu, F.; Wei, H. The benefits of introducing meeting points into flex-route transit services. Transp. Res. Part C Emerg. Technol. 2019, 106, 98–112. [Google Scholar] [CrossRef]
  11. Chandra, S.; Quadrifoglio, L. A model for estimating the optimal cycle length of demand responsive feeder transit services. Transp. Res. Part B Methodol. 2013, 51, 1–16. [Google Scholar] [CrossRef]
  12. Saeed, K.; Kurauchi, F. Enhancing the Service Quality of Transit Systems in Rural Areas by Flexible Transport Services. Transp. Res. Procedia 2015, 10, 514–523. [Google Scholar] [CrossRef] [Green Version]
  13. Fu, L. Planning and Design of Flex-Route Transit Services. Transp. Res. Rec. J. Transp. Res. Board 2002, 1791, 59–66. [Google Scholar] [CrossRef] [Green Version]
  14. Zhu, H.; Kennedy, T.; Ma, H.; Zhang, H.; Leil, B.; Gningue, Y. A simulation system for flexible transit services based on E-CARGO. In Proceedings of the 2018 IEEE 15th International Conference on Networking, Sensing and Control (ICNSC), Zhuhai, China, 27–29 March 2018; Institute of Electrical and Electronics Engineers (IEEE): New York, NY, USA, 2018; pp. 1–6. [Google Scholar]
  15. Zheng, Y.; Li, W.; Qiu, F. A slack arrival strategy to promote flex-route transit services. Trans. Res. Part C Emerg. Technol. 2018, 92, 442–455. [Google Scholar] [CrossRef]
  16. Babak, M.; Yongzhe, Y.; Sushreeta, M. Analytical models for comparing operational cost of regular bus and semi flexible transit services. Public Trans. 2020, 12, 147–169. [Google Scholar]
  17. Marković, N.; Nair, R.; Schonfeld, P.; Miller-Hooks, E.; Mohebbi, M. Optimizing dial-a-ride services in Maryland: Benefits of computerized routing and scheduling. Transp. Res. Part C Emerg. Technol. 2015, 55, 156–165. [Google Scholar] [CrossRef]
  18. Kirchler, D.; Calvo, R.W. A Granular Tabu Search algorithm for the DialaRide Problem. Transp. Res. Part B Methodol. 2013, 56, 120–135. [Google Scholar] [CrossRef]
  19. Masmoudi, M.A.; Braekers, K.; Masmoudi, M.; Dammak, A. A hybrid genetic algorithm for the heterogeneous dial-a-ride problem. Comput. Oper. Res. 2017, 81, 1–13. [Google Scholar] [CrossRef]
  20. Tong, L.; Zhou, L.; Liu, J.; Zhou, X. Customized bus service design for jointly optimizing passenger-to-vehicle assignment and vehicle routing. Transp. Res. Part C Emerg. Technol. 2017, 85, 451–475. [Google Scholar] [CrossRef]
  21. Jäppinen, S.; Toivonen, T.; Salonen, M. Modelling the potential effect of shared bicycles on public transport travel times in Greater Helsinki: An open data approach. Appl. Geogr. 2013, 43, 13–24. [Google Scholar] [CrossRef]
  22. Yang, X.-H.; Cheng, Z.; Chen, G.; Wang, L.; Ruan, Z.-Y.; Zheng, Y.-J. The impact of a public bicycle-sharing system on urban public transport networks. Transp. Res. Part A Policy Pract. 2018, 107, 246–256. [Google Scholar] [CrossRef]
  23. Martin, E.W.; Shaheen, S.A. Evaluating public transit modal shift dynamics in response to bikesharing: A tale of two U.S. cities. J. Transp. Geogr. 2014, 41, 315–324. [Google Scholar] [CrossRef] [Green Version]
  24. Guo, Y.; He, S.Y. Built environment effects on the integration of dockless bike-sharing and the metro. Transp. Res. Part D Transp. Environ. 2020, 83, 102335. [Google Scholar] [CrossRef]
  25. Kong, H.; Jin, S.T.; Sui, D.Z. Deciphering the relationship between bikesharing and public transit: Modal substitution, integration, and complementation. Transp. Res. Part D Transp. Environ. 2020, 85, 102392. [Google Scholar] [CrossRef]
  26. Bronsvoort, K. Exploring Alternative Public Transport in Rural Areas. Master’s Thesis, Delft University of Technology, Delft, The Netherlands, 2019. [Google Scholar]
  27. Bronsvoort, K.A.; Alonso-Gonz’alez, M.J.; van Oort, N.; Molin, E.J.E.; Hoogendoorn, S.P. Preferences towards Bus Alternatives in Rural Areas of the Netherlands: A Stated Choice Experiment; Transportation Research Board: Washington, DC, USA, 2020. [Google Scholar]
  28. Quadrifoglio, L.; Dessouky, M.M.; Palmer, K. An insertion heuristic for scheduling Mobility Allowance Shuttle Transit (MAST) services. J. Sched. 2007, 10, 25–40. [Google Scholar] [CrossRef]
  29. China Academy of Urban Planning & Design; Baidu Map Huiyan. 2020 National Commuting Monitoring Report in Major Cities-Commute Time Consumption Supplement (Research Report). Available online: http://huiyan.baidu.com/reports/landing?id=76 (accessed on 24 May 2021).
  30. Paulley, N.; Balcombe, R.; Mackett, R.; Preston, J.; White, P. The Demand for Public Transport. In Proceedings of the World Conference on Transport Research, Istanbul, Turkey, 4–8 July 2004. [Google Scholar]
  31. Beirão, G.; Cabral, J.S. Understanding attitudes towards public transport and private car: A qualitative study. Transp. Policy 2007, 14, 478–489. [Google Scholar] [CrossRef]
  32. El-Assi, W.; Mahmoud, M.S.; Habib, K.N. Effects of built environment and weather on bike sharing demand: A station level analysis of commercial bike sharing in Toronto. Transportation 2017, 44, 589–613. [Google Scholar] [CrossRef]
  33. Hu, L.; Schneider, R.J. Shifts between Automobile, Bus, and Bicycle Commuting in an Urban Setting. J. Urban Plan. Dev. 2015, 141, 04014025. [Google Scholar] [CrossRef] [Green Version]
  34. Sun, Y.; Mobasheri, A.; Hu, X.; Wang, W. Investigating Impacts of Environmental Factors on the Cycling Behavior of Bicy-cle-Sharing Users. Sustainability 2017, 9, 1060. [Google Scholar] [CrossRef] [Green Version]
  35. Ye, R.; Titheridge, H. Satisfaction with the commute: The role of travel mode choice, built environment and attitudes. Transp. Res. Part D Transp. Environ. 2017, 52, 535–547. [Google Scholar] [CrossRef]
Figure 1. Flex-route transit service.
Sustainability 13 06067 g001
Figure 2. Research area.
Sustainability 13 06067 g002
Figure 3. Fixed-route transit routes and stations.
Sustainability 13 06067 g003
Figure 4. OD pairs of shared bicycle riding in the fixed station area.
Sustainability 13 06067 g004
Figure 5. Bus route and shared bicycle OD in case area.
Sustainability 13 06067 g005
Figure 6. Travel route of passengers in the shared bicycle system.
Sustainability 13 06067 g006
Figure 7. Travel route of passengers in the flex-route transit system.
Sustainability 13 06067 g007
Figure 8. Comparison of cost under two travel modes.
Sustainability 13 06067 g008
Figure 9. The indicators under different passenger demand densities.
Sustainability 13 06067 g009
Figure 10. The indicators under different fixed station spacing.
Sustainability 13 06067 g010
Figure 11. The indicators under different passenger travel preference.
Sustainability 13 06067 g011
Table 1. Basic parameters.
ParametersValuesUnit
T60min
t5min
v25mile/h
δ10mile/h
ξ1min
tc1min
db0.3mile
θ50
PN110%
PN240%
PN340%
PN410%
λ1/λ2/λ31/1/1
μ1/μ2/μ31/1/1
ω1/ω2/ω3/ω41/1/1/1
Publisher’s Note: MDPI stays neutral with regard to jurisdictional claims in published maps and institutional affiliations.

