Article

Impact of Industry 4.0 on Corporate Financial Performance: A Moderated Mediation Model

Department of Business and Management, National University of Tainan, No. 33, Sec. 2, Shu-Lin St., Tainan 700, Taiwan
Sustainability 2021, 13(11), 6069; https://doi.org/10.3390/su13116069
Submission received: 26 April 2021 / Revised: 20 May 2021 / Accepted: 24 May 2021 / Published: 28 May 2021
(This article belongs to the Section Economic and Business Aspects of Sustainability)

Abstract

:
Many studies advance the contemporary technologies of Industry 4.0. However, relatively little is known about how Industry 4.0 affects corporate financial performance. Using a survey, bootstrap sampling, and structural-equation modeling, this study evaluates the moderated mediation effects of Industry 4.0 maturity on financial performance. The results show that Industry 4.0 maturity significantly affects internal business process performance (IBPP), which influences customer performance through the mediating effect of supply chain performance (SCP), and IBPP and SCP affect financial performance fully through the mediating effect of customer performance. The results also show that Industry 4.0 maturity moderates the positive relationship between customer performance and financial performance. Customer performance and IBPP have the largest direct and total effects on financial performance in the context of Industry 4.0 implementation, respectively. The results indicate that Industry 4.0 magnifies the potential returns to companies mainly through IBPP, SCP, and customer performance. This study offers an enhanced understanding of the financial implications of Industry 4.0 implementation and provides insights into the factors through which Industry 4.0 maturity influences financial performance.

1. Introduction

The increasing integration of the internet of things (IoT) into the industrial value chain is laying the groundwork for the next industrial revolution, called the fourth industrial revolution, or Industry 4.0 [1]. Industry 4.0 is reshaping corporate strategies, supply chains, value chains, business operations and processes, and stakeholder relationships. This is generating not only new business opportunities but also vulnerabilities that require effective management and governance for sustainable business performance [2]. Not surprisingly, this subject receives considerable attention not only in business but also in engineering, sciences, and social sciences [3,4].
One recent research development, for example, is that Majeed and Rupasinghe [5], who propose a conceptual framework for process automation through radio frequency identification (RFID) and business application programming interface (BAPI) technology to restructure business information technology in the context of Industry 4.0. Another more recent development is that Wang et al. [6], who propose a fog nodes deployment system based on space–time characteristics (STC) for minimizing computing response time and load balancing in production lines to enhance the performance of intelligent manufacturing.
Although an extensive amount of literature exists on Industry 4.0 and its related problems and issues, relatively few researchers investigate the links between Industry 4.0 implementation and company financial performance [7,8,9,10]. Little is therefore known about how Industry 4.0 maturity affects corporate financial performance. Understanding how Industry 4.0 maturity influences financial performance is essential to enhance Industry 4.0 implementation and its impact on company financial performance.
The primary objective of this study is, hence, to assess how Industry 4.0 maturity affects financial performance. This study employs the survey method, the bootstrap-sampling method, and structural-equation modeling to examine the hypothesized five-dimension research model. The rest of this paper is organized as follows: Section 2 reviews related studies of Industry 4.0. Section 3 provides a theoretical background for this study’s research hypotheses. Section 4 explains the research methods, including research participants, data-collection procedures, construct measurement, and analysis. Section 5 details the statistical tests of the hypotheses. Section 6 concludes this study.

2. Research Background

Technological advances, especially in communication and information technology, are changing the ways businesses create value, how and where employees work, and how people communicate [11]. Together, these advances are hurtling businesses and manufacturing enterprises toward a new industrial revolution based on a cyber–physical system—a revolution known as Industry 4.0, Production 4.0, Future of Manufacturing, or Advanced Manufacturing [2]. Shrewd leaders must either learn how these technological advances can transform their businesses or face competition from those who figure it out first [12]. Not surprisingly, the subject receives significant attention from both practitioners and researchers [13,14].
Extensive research seeks to understand how to enforce Industry 4.0 effectively and/or how Industry 4.0 affects production processes/operations (e.g., Hermann et al. [1]; Liao et al. [3]; Shrouf et al. [15]; Ungurean et al. [16]). For example, Imtiaz and Jasperneite [17] show that a key to enabling IoT successfully for industrial automation applications is to scale down the open platform communications–unified architecture (OPC-UA) into low-end resource-limited devices, allowing IoT integration in the smallest devices. They propose a method to bring the OPC-UA down to a chip level while retaining its prominent functions.
In addition, Shrouf et al. [15] describe the main characteristics of IoT-based smart factories. In particular, they focus on sustainability perspectives. Through their reviews and analyses of Industry 4.0 studies and initiatives, they develop an architecture for IoT-based energy management in sustainable smart factories. Ungurean et al. [16] present an IoT architecture based on the open platform communications NET (OPC.NET) specifications from Gaitan et al. [18] to enhance industrial environments and smart buildings.
Subsequent work by Mazak and Huemer [19] addresses the importance of interoperability in the seamless exchange of data and information among different parties (e.g., manufacturing companies, suppliers, and specialist contractors) in value networks. They develop a standards framework for highlighting how existing standards intertwine to establish value networks in an Industry 4.0 context. Furthermore, Lee et al. [20] propose a unified five-level architecture (i.e., smart connection, data-to-information conversation, cyber, cognition, and configuration) as a guideline for implementing cyber–physical systems (CPS) in Industry 4.0 manufacturing systems.
Based on the development concept of a communication gateway and an information server, Schlechtendahl et al. [21] further demonstrate an approach to enhance production systems that are not Industry 4.0 ready, for use in an Industry 4.0 factory. In addition, Ivanov et al. [22] develop a dynamic algorithm for short-term supply chain scheduling in smart factories. The algorithm simultaneously considers machine-structure selection and job assignments according to an adjusted version of the continuous maximum principle.
Liao et al. [3] systematically review academic articles about Industry 4.0 and identify deficiencies and potential research directions. Shiue et al. [23] develop a reinforcement learning (RL)-based real-time scheduling algorithm from multiple dispatching rules (MDRs) for smart factor manufacturing. They claim the algorithm outperforms the machine-learning-based multiple dispatching rules.
Recently, Rossit et al. [9] propose a schema of scheduling operations on machines, called Smart Scheduling, to enhance production efficiency in Industry 4.0 manufacturing systems. Based on a systematic literature review and case studies, Ivanov et al. [4] suggest directions for future research on the Industry 4.0 ripple effect and disruption risk-control analytics in supply chains.
More recently, Büchi et al. [2] employed regression analysis to examine how Industry 4.0 affects smart factory manufacturing performance. Using data from 231 manufacturing units, they conclude that Industry 4.0 (measured by the breadth and depth of technologies the company adopts) significantly influences company performance (measured by the extent of business opportunities the company obtains).
Despite the panoply of studies on Industry 4.0, most studies focus on advancing the contemporary technologies of Industry 4.0, such as big data and analytics, simulation, horizontal and vertical system integration, the industrial internet of things, cybersecurity, the cloud, and additive manufacturing (e.g., Imtiaz and Jasperneite, [17]; Rossit et al. [9]; Shrouf et al. [15]; Ungurean et al. [16]) or understanding how Industry 4.0 affects production processes and operations performance (e.g., Büchi et al. [2]; Lee et al. [20]; Mazak and Huemer, [19]; Schlechtendahl et al. [21]). Relatively little research explores how Industry 4.0 affects corporate financial outcomes.
Although few studies (e.g., Lin and Song [24]; Michna and Kmieciak [25]) investigate the relationship between Industry 4.0 and financial outcomes, they only provide empirical evidence of the link between Industry 4.0 implementation and financial performance. For example, Lin and Song [24] assess the effect of Industry 4.0 on company financial performance using probit analysis. Based on data from 460 firms, they show that implementing Industry 4.0 increases return on equity. Michna and Kmieciak [25] examine 562 small- and medium-sized enterprises. Using partial least squares path modeling, they find that a company’s financial performance predicts its willingness to implement Industry 4.0.
Consequently, little is known about how Industry 4.0 maturity affects financial performance. Understanding this is important for Industry 4.0 implementation, as one of its primary objectives is to increase economic/financial benefits [26].

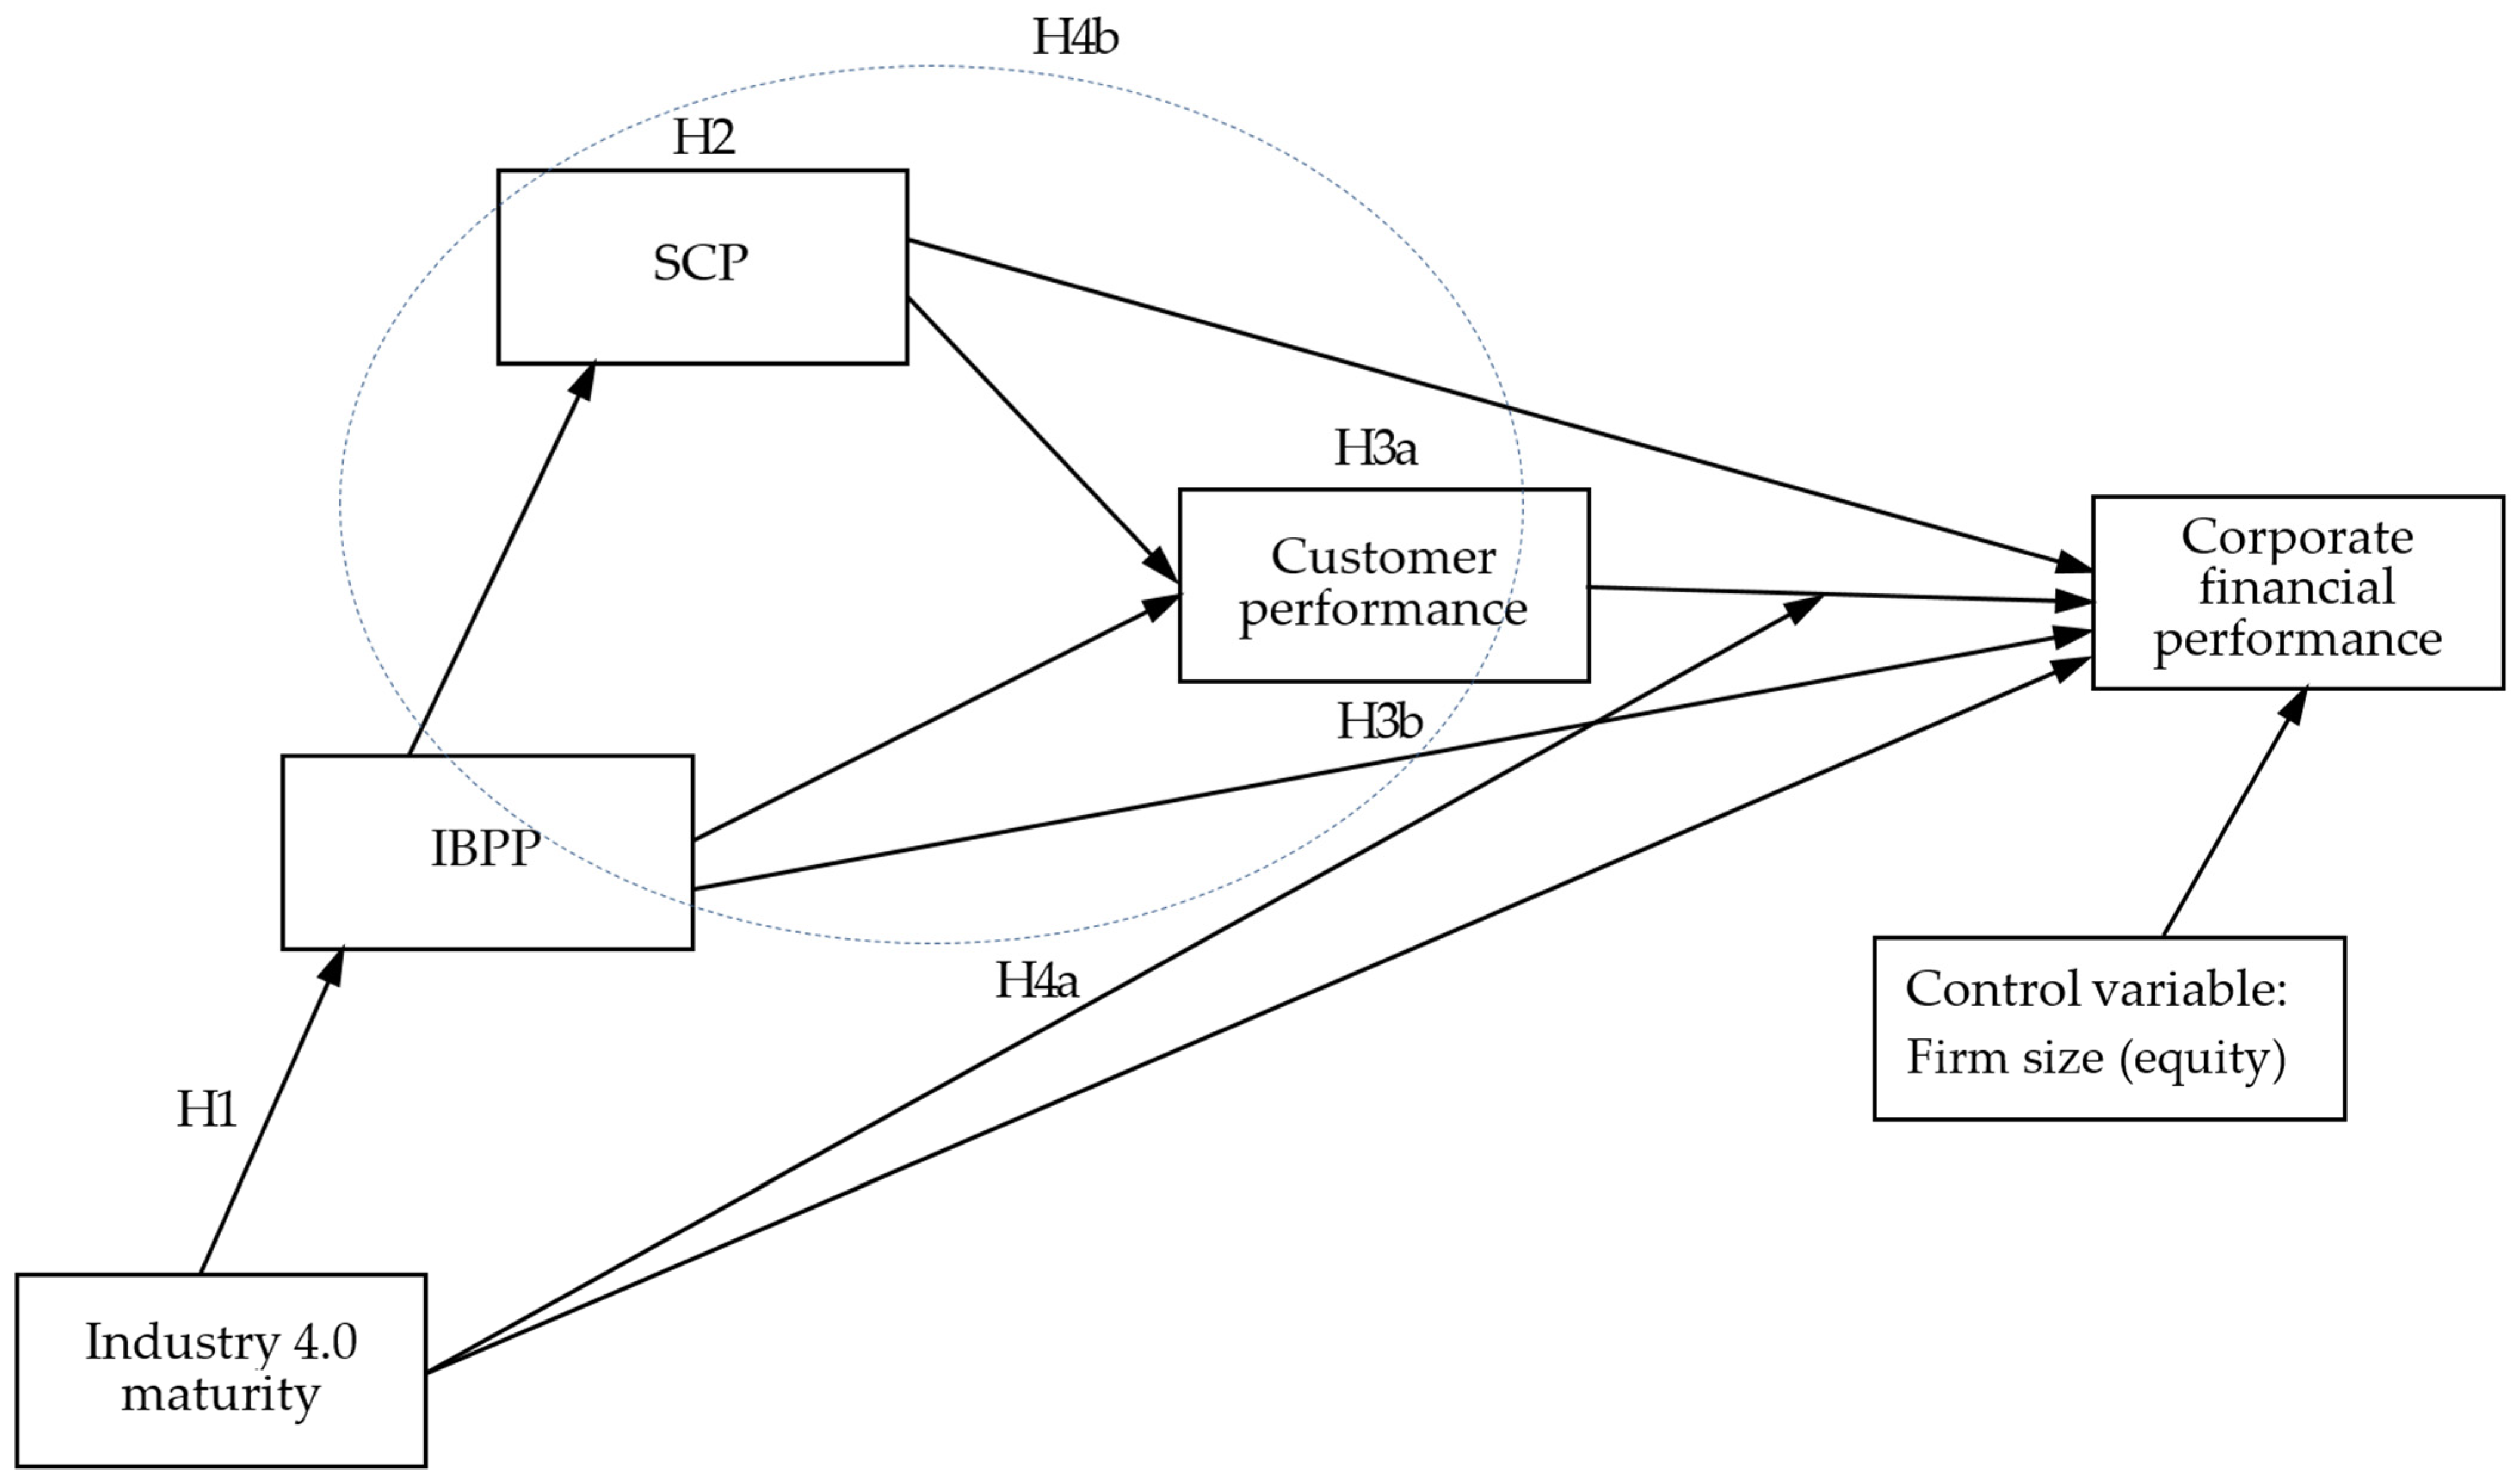
3. Research Hypotheses

To investigate how Industry 4.0 maturity influences corporate financial performance, this study proposes a moderated mediation model, shown in Figure 1. The model extensively reviews the interdisciplinary literature and consults several academics and experienced practitioners. It revolves around the notion that Industry 4.0 affects financial returns through IBPP, SCP, and customer performance. Industry 4.0 also magnifies the positive influence of customer performance on financial returns.
Specifically, considering the multimediating effects of IBPP, SCP, and customer performance, the model highlights the indirect effects of Industry 4.0 maturity on corporate financial performance. In addition, it highlights the moderating effect of Industry 4.0 maturity on the relationship between customer performance and corporate financial performance. This study further builds the moderated mediation model using AMOS software, shown in Figure 2, to examine Hypotheses 1, 2, 3a, 3b, 4a, and 4b.
Internal business process is a strategic planning and performance management concerning how to manage functional areas to satisfy customer needs as well as align business activities with the company’s vision [27]. A supply chain is an integrated manufacturing process that turns raw materials into final goods and services delivered to customers through distribution networks, retail outlets, or both [28]. Customer performance is the extent to which the company attracts, retains, and deepens relationships with customers [29].
Corporate financial performance is the extent to which a company achieves its economic goals [30]. There is no consensus about the best way to measure corporate financial performance [31]. Different methods have emerged, including market, accounting, and survey measurements [25,31,32]. This study uses six-item scales to measure financial performance (see Section 4.2). Because firms do not readily disclose accurate financial data, this study asks survey respondents to indicate performance via seven-point Likert scales ranging from “well below the industry average” to “well above the industry average.”
In Industry 4.0, physical production plants are linked in open networks where machine communication enables efficient data exchanges among parties providing internal and crossorganizational services in value-chain networks [22]. It is conceivable that the maturity of a company’s Industry 4.0 implementation (i.e., Industry 4.0 maturity) has important implications in today’s business environments of ever-increasing competition and customer expectations.
This study proposes that Industry 4.0 maturity significantly affects IBPP. That is, companies with high Industry 4.0 maturity are more likely to improve internal and external communications and collaborations and effectively monitor company performance against strategic objectives [33,34], which in turn improves IBPP. Thus, this study hypothesizes:
Hypothesis 1.
Industry 4.0 maturity is positively related to IBPP.
Studies suggest that SCP may mediate the link between IBPP and customer performance, given that it reflects the degree of competence in coordinating or collaborating with supply chain partners and managing intra- and inter-organization business processes [35]. High-quality IBPP implies that both internal process integration and internal crossfunctional integration improve.
In fact, when a business’s internal integration increases, its external integration increases accordingly, which in turn directly and indirectly influences SCP [36]. High SCP increases a company’s capacity to respond to customer demands, which subsequently affects customer performance [37]. Similarly, high IBPP increases the potency of internal operations management to deliver high-quality products and customer service [38], which in turn enhances customer performance. This study therefore hypothesizes:
Hypothesis 2.
IBPP is positively related to customer performance through the mediating influence of SCP.
Studies also suggest that better IBPP, SCP, and customer performance are more likely to produce favorable corporate financial outcomes [39,40,41]. For example, Van Looy and Shafagatova [42] use a structured literature review to examine 76 performance-measurement papers in the ISI Web of Science database. They conclude that an increase in IBPP positively affects the quality of products and services, which in turn improves company financial outcomes.
Furthermore, Liu et al. [40] employ the resource-orchestration theory and fit-assessment methodologies to analyze data from 196 companies concerning how information technology (IT) competency affects corporations’ supply chain integration and performance. They conclude that deploying appropriate IT competency reinforces the relationship between supply chain integration and operational and financial performance. Based on a structural-equation modeling (SEM) analysis of 106 large manufacturing companies across 20 industries, Chen [43] concludes that risks in supply chains affect SCP, which in turn influences company financial performance.
Rajapathirana and Hui [41] use the SEM technique to analyze data on 379 senior managers of insurance companies. They find that process innovation enhances innovation performance and IBPP, which in turn improve firm financial performance. Concurrently, Ambroise et al. [39] examine 184 CEOs from 184 manufacturing firms. They conclude, using partial least squares (PLS) modeling analysis, that servitization, which is the process by which a manufacturing firm creates value by adding services to products that improve customer performance, has a direct impact on firm profitability.
Subsequent work by Delic et al. [44] employs SEM to examine how additive manufacturing adoption affects supply chain integration. Using data from 124 automotive manufacturers, they claim that supply chain integration mediates the relationship between additive manufacturing adoption and SCP, which in turn improves company financial performance. In addition, based on hierarchical linear modeling analyses of 264 companies across 15 industries, Feng et al. [45] show that humane leadership and moderation leadership help corporations enhance customer performance and financial outcomes.
Hutahayan [46] assesses 135 medium and large manufacturing companies using SEM analysis. That study concludes that IBPP mediates the relationship between innovation strategy and company financial outcomes. Together with Hypothesis 2, this study thus proposes:
Hypothesis 3a.
SCP is positively related to financial performance through the mediating influence of customer performance.
Hypothesis 3b.
IBPP is positively related to financial performance through the mediating influence of customer performance.
Industry 4.0 implementation creates “smart factory manufacturing” [15]. Within the smart factory, cyber–physical systems talk to and coordinate with one another and with humans in real time. Value-chain participants provide and use internal and crossorganizational services, enabling them to monitor their environments and promptly take action [1,11]. To this end, Industry 4.0 maturity’s effects on corporate operations performance have important implications for financial outcomes.
First, companies with high Industry 4.0 maturity may promote producer–customer integration and, hence, produce effective and efficient flows of products and services to customers [2]. This in turn improves the extent to which a company attracts, maintains, and grows relationships with customers, leading to higher customer performance and better financial outcomes [39]. Thus, high Industry 4.0 maturity may affect the strength of the relationship between customer performance and financial performance.
Second, companies with high Industry 4.0 maturity may enhance communications and collaborations across different parties. They are thus more likely to increase the linkage of operations processes within and across organizations, as well as remove duplicate or redundant supply chain processes [35,47]. This improves supply chain and customer performance [44]. To this end, companies with high Industry 4.0 maturity may not only reinforce the relationship between customer performance and financial performance but also produce favorable financial outcomes. Taken together, these reasons indicate that Industry 4.0 maturity moderates the relationship between customer performance and financial performance. It also influences corporate financial outcomes through IBPP, SCP, and customer performance. This study proposes:
Hypothesis 4a.
Industry 4.0 maturity moderates the positive relationship between customer performance and financial performance.
Hypothesis 4b.
Industry 4.0 maturity affects financial performance through the multimediating effects of IBPP, SCP, and customer performance.

4. Research Methodology

4.1. Participants and Procedures

In order to explore the hypotheses, this study employs a survey research design. This study focuses on manufacturing companies because Industry 4.0 solutions are primarily intended for production and manufacturing processes [25]. This study randomly selected and contacted 834 potential participants from the databases of the Ministry of Economic Affairs. Of the 834 companies, 230 that are implementing or planning to implement Industry 4.0 agreed to participate. In total, 110 completed the survey—a 47.83% response rate.
This study solicited collaboration from human resource managers at the 110 companies. Each company assigned a manager with experience or knowledge in Industry 4.0 to evaluate the current status of the company’s Industry 4.0 maturity. Prior to collecting the data, academic and industry experts reviewed the survey questionnaires for structure, readability, clarity, and thoroughness. The questionnaires are based on established item scales from an extensive review of literature in Industry 4.0, as well as in the supply chain and organization management fields.
The final survey instrument comprises two sections. Section 1 consists of open-ended questions that collect background information on the respondents and companies, such as gender, work experience, company size, and the industries in which the company belongs. The second section is composed of multiple-choice questions in which respondents answer based on a five-point or a seven-point Likert scale.
To decrease potential common-method variance (CMV), this study incorporates a number of recommendations from Podsakoff and Organ [48]. This includes using survey measures from prior research to create quality scales, as well as mixing the order of the questions and confirming to respondents that their identities and responses are confidential.
Excluding survey responses with missing data results in 93 useful sample companies in 14 different industry sectors. These sectors include chemicals, biotechnology, petrochemical, automotive, textiles, food, rubber, optoelectronic, semiconductor, electrical distribution, electronics, iron and steel, electric machinery, and construction and building materials. Table 1 reports the characteristics of the participants.

4.2. Measures and Analysis

Industry 4.0 maturity. Ten-item scales in Agca et al. [49] and Veza et al. [50] measure the maturity level of a company’s Industry 4.0. Sample item scales are “In1: Choose the best description of product development phase in the company”, “In3: Choose the best description of work-order management in the company’s production system”, and “In5: Choose the best description of materials inventory management (raw materials and work in progress) in the company’s production system.” The Cronbach’s α for Industry 4.0 maturity is 0.95.
Specifically, the Industry 4.0 maturity construct is based on an average score of its measures. When the best description of the company’s the production system is based on oral communication (i.e., managers verbally explain work orders to employees), it is the first industrial generation; when it is based on written communication (i.e., managers give written work orders to employees), it is the second industrial generation. When communication is man to machine (i.e., programming), it is the third industrial generation. When communication is machine to machine, it is between the third and fourth industrial generations (or 3.5 industrial generation), and when communication is on a cloud-based intranet, it is the fourth industrial generation [48,51].
Financial performance. Six-item scales in Chen [43] and Grigoroudis et al. [52] measure corporate financial performance. Items are “FP1: Our firm’s return on sales over the last 12 months”, “FP2: Our firm’s ability to cost control of goods sold over the last 12 months”, “FP3: Our firm’s earnings per share over the last 12 months”, “FP4: Our firm’s return on investment over the last 12 months”, “FP5: Our firm’s return on assets over the last 12 months”, and “FP6: Our firm’s return on equity over the last 12 months.” The Cronbach’s α for Financial performance is 0.95.
Customer performance. Six-item scales in Chen [43] and Grigoroudis et al. [52] measure corporate financial performance. Sample items are “CP1: Our firm’s ability to attract and maintain relationships with customers”, “CP3: Our firm’s ability to handle customer complaints and to minimize the adverse impact on our business”, and “CP5: Rate of customer retention.” The Cronbach’s α for Customer performance is 0.89.
IBPP. Four-item scales in Butler et al. [51], Kaplan and Norton [27], and Kerssens-van Drongelen and Bilderbeek [53] measure IBPP. Sample items are “IBPP1: Continuous improvement of production costs and cycle time of our products” and “IBPP3: Efficiency of time to market of new products/services.” The Cronbach’s α for Customer performance is 0.87.
SCP. Eight-item scales in Agca et al. [49], Lee and Billington [54], and Noordewier et al. [55] measure SCP. Sample items are “SCP1: Our suppliers’ ability to handle our volume demand changes”, “SCP3: Our suppliers’ ability to meet our quality requirements”, and “SCP5: Ability of our production system to handle customers’ volume demand changes.” The Cronbach’s α for Customer performance is 0.93.
To make sure no one general factor explains most of the covariance between the forecast and criterion variables, this study applies Harman’s single-factor test [56] to evaluate how common-method variance (CMV) affects the sample data. This study enters Industry 4.0 maturity, financial performance, customer performance, IBPP, and SCP into the exploratory factor analysis, producing a single factor that only accounts for 22.78% of the total variance. This falls well below the threshold value of 50%, indicating that CMV is not a significant problem in this study.
In addition, company size may affect company financial performance because size may reflect a variety of organizational attributes, as well as resource deployment [57]. This study controls company size by using the market value of equity, which is one of the most popular size proxies in corporate finance [58]. Market cap is also more forward-looking [58] and reflects a firm’s expected performance [43]. Likewise, implementation of Industry 4.0 generates future business opportunities [2], which in turn are forward looking.
The methodology to examine the hypothesized moderated mediation model is threefold. Analyses of this study are based on AMOS software. In the first stage, this study develops and validates the measurement model using confirmatory factor analysis (CFA) with the bootstrap-sampling method [59] for testing the hypothesized model. In the second stage, this study employs the SEM technique [59] with the bootstrap-sampling technique to examine the hypothesized model. In the third stage, based on the hypotheses testing results, this study refines and concludes the model to estimate the effects of Industry 4.0 maturity, customer performance, IBPP, and SCP on corporate financial performance.

5. Research Results

5.1. Measurement Results

This study’s measurement model is congeneric, where the model’s constructs correlate with one another. The model’s constructs include Industry 4.0 maturity, financial performance, customer performance, IBPP, and SCP. To examine the convergent validity of the measurement model, this study uses the standardized factoring loadings, average variance extracted (AVE), and composite creditability (CR) to assess the relative convergence among measures. The results of CFA with 1000 bootstrap samples reveal that all the standardized factor loadings range from 0.59 to 0.94 (shown in Table 2), larger than the recommended threshold (0.5) and significant at p < 0.001. The significance of the factor loadings is further confirmed by the respective bootstrapping bias-corrected 95% CIs excluding zero, indicating the existence of convergent validity.
Table 3 reports the measurement model’s descriptive statistics, CRs, AVEs, and average shared squared variances (ASVs). As reported in Table 2, the respective CR values of Industry 4.0 maturity, financial performance, customer performance, IBPP, and SCP are 0.91, 0.86, 0.83, 0.80, and 0.89, which are all greater than the threshold values (0.60 [59]. Table 2 also shows the AVE values for each construct ranges from 0.60 to 0.74, all above the recommended threshold (0.50) [59]. This further confirms the existence of convergent validity for all the constructs.
In addition, Table 2 shows that the respective ASV values of Industry 4.0 maturity, financial performance, customer performance, IBPP, and SCP are 0.02, 0.21, 0.33, 0.40, and 0.38. They are all smaller than their corresponding AVE values of 0.64, 0.74, 0.60, 0.64, and 0.68, suggesting discriminant validity among these constructs [60]. The measurement model’s overall fit with 1000 bootstrap samples also suggests an adequate fit with the data, where the model chi-square/degrees of freedom = 1.425, incremental fit index = 0.95, comparative fit index = 0.94, Tucker–Lewis index = 0.93, standardized root mean square residual = 0.07, and root mean square error of approximation = 0.07 [59].

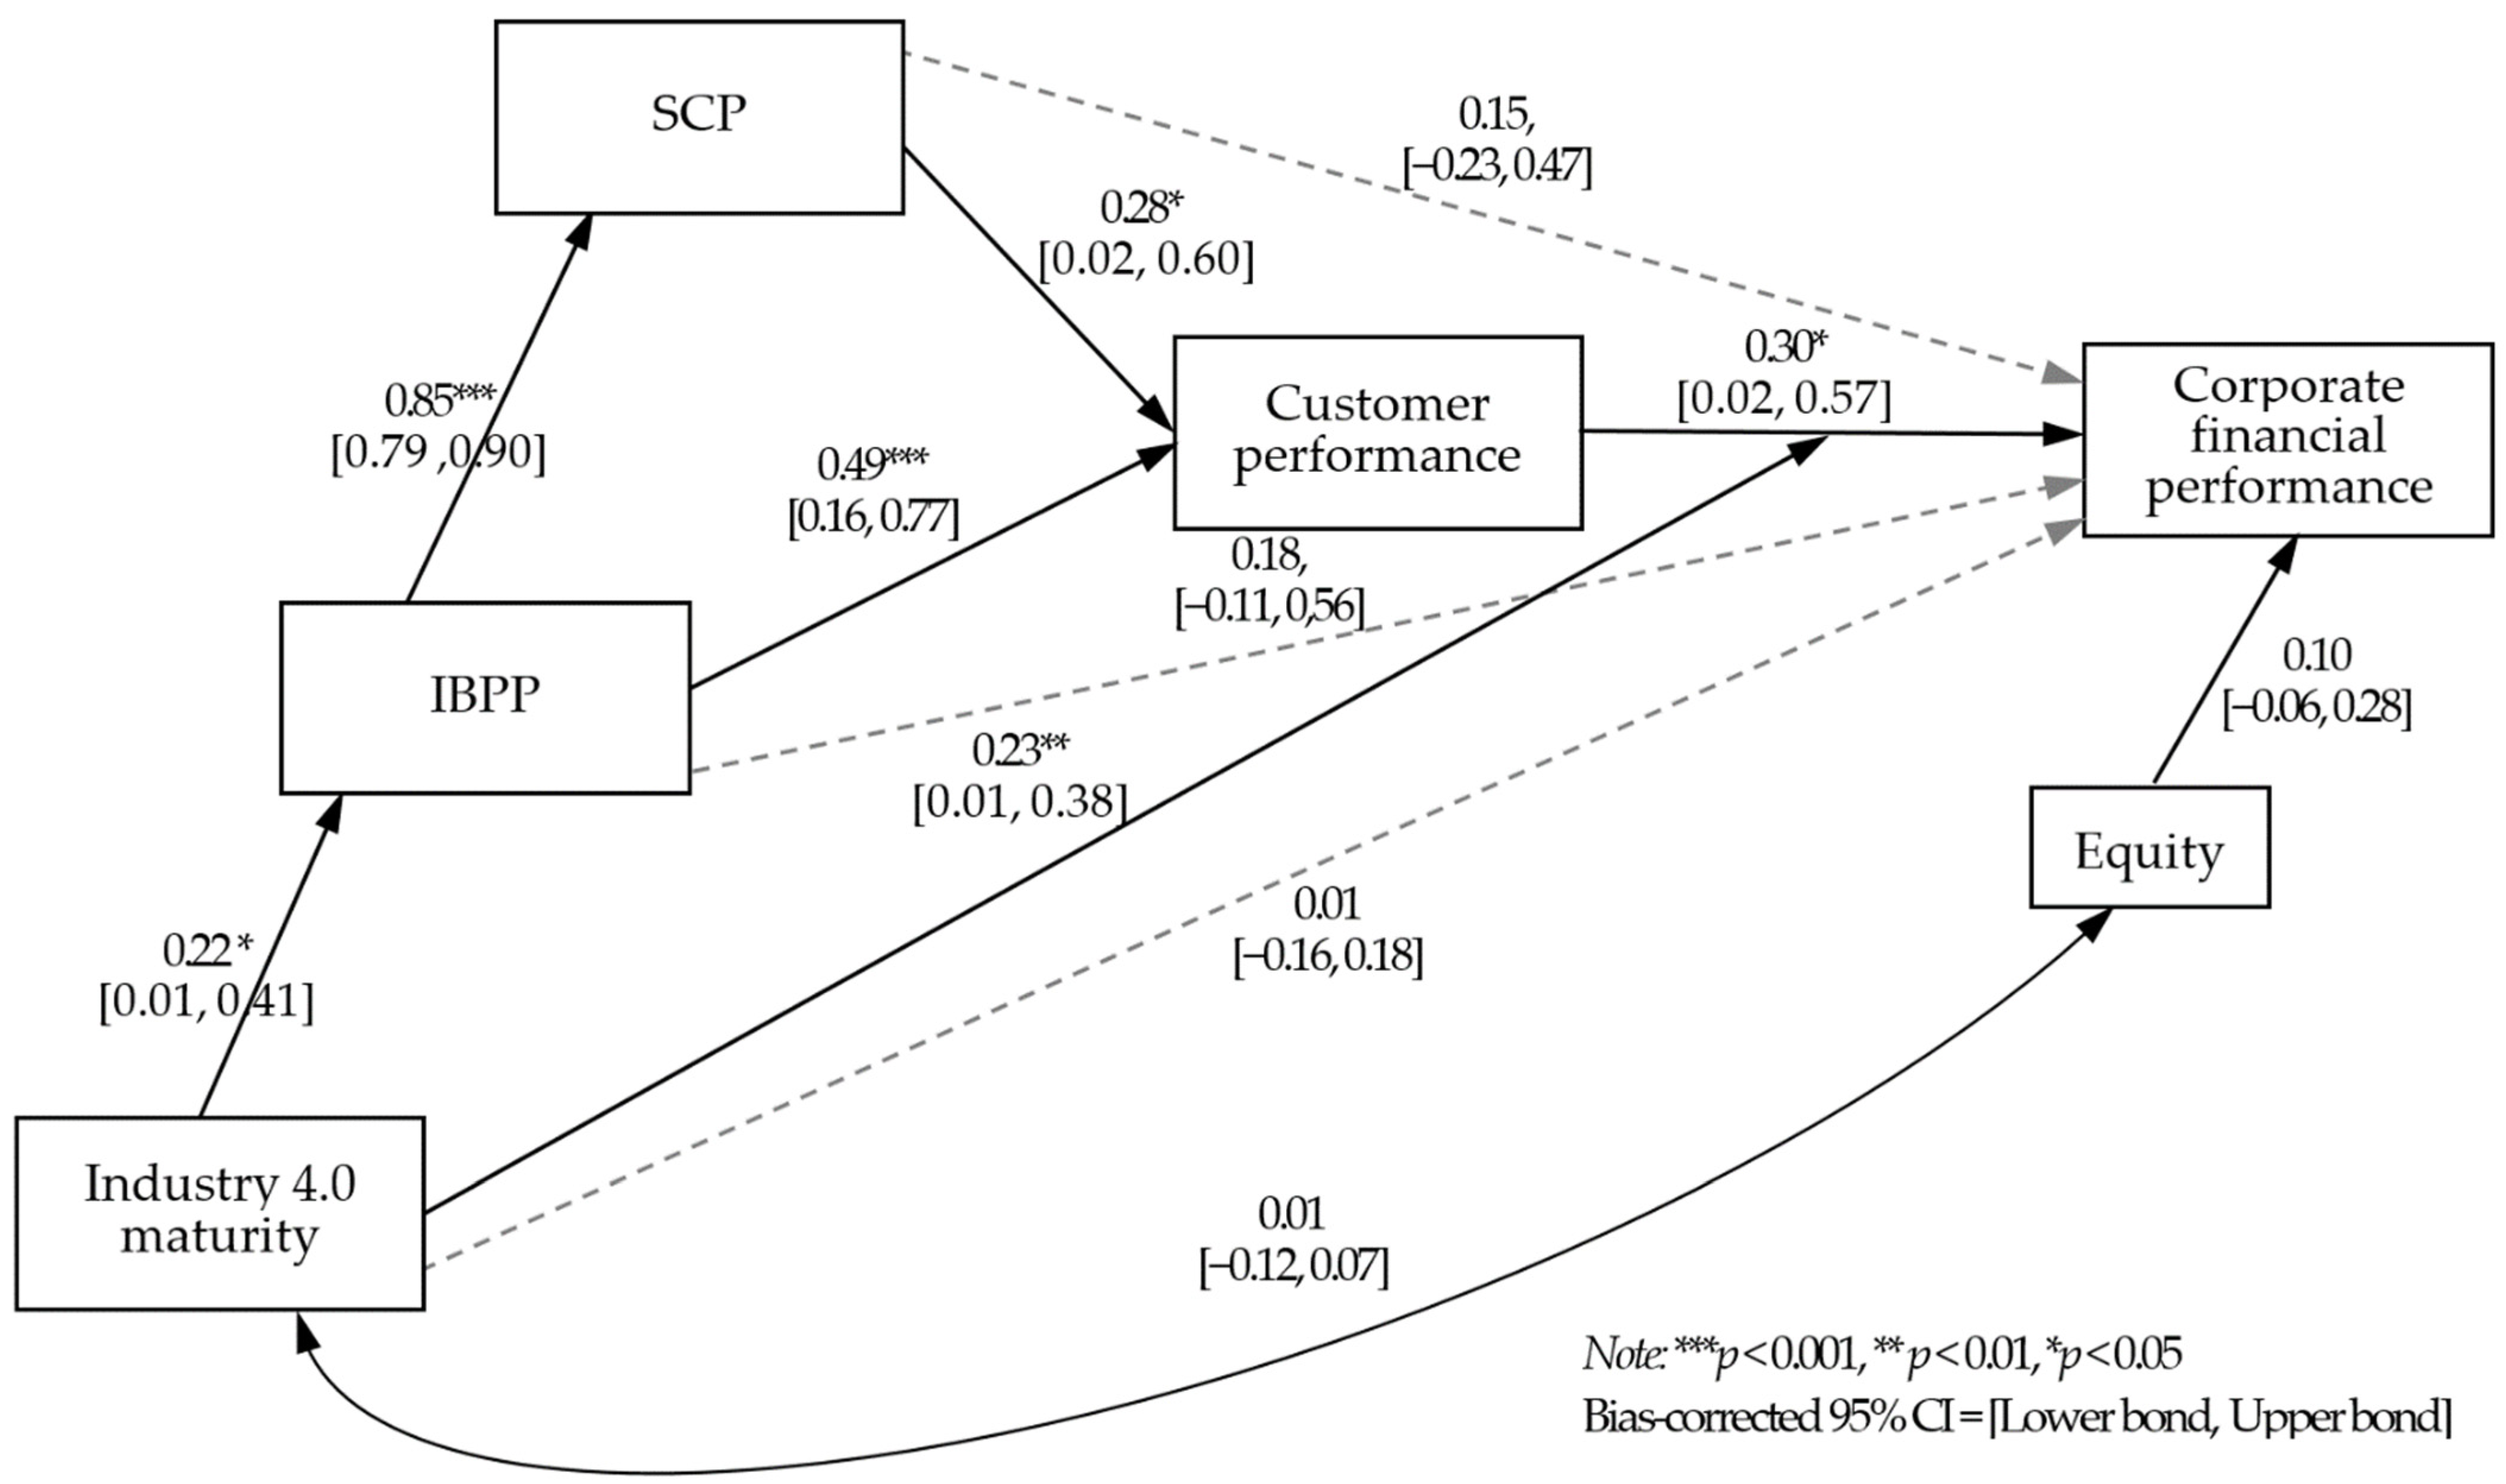
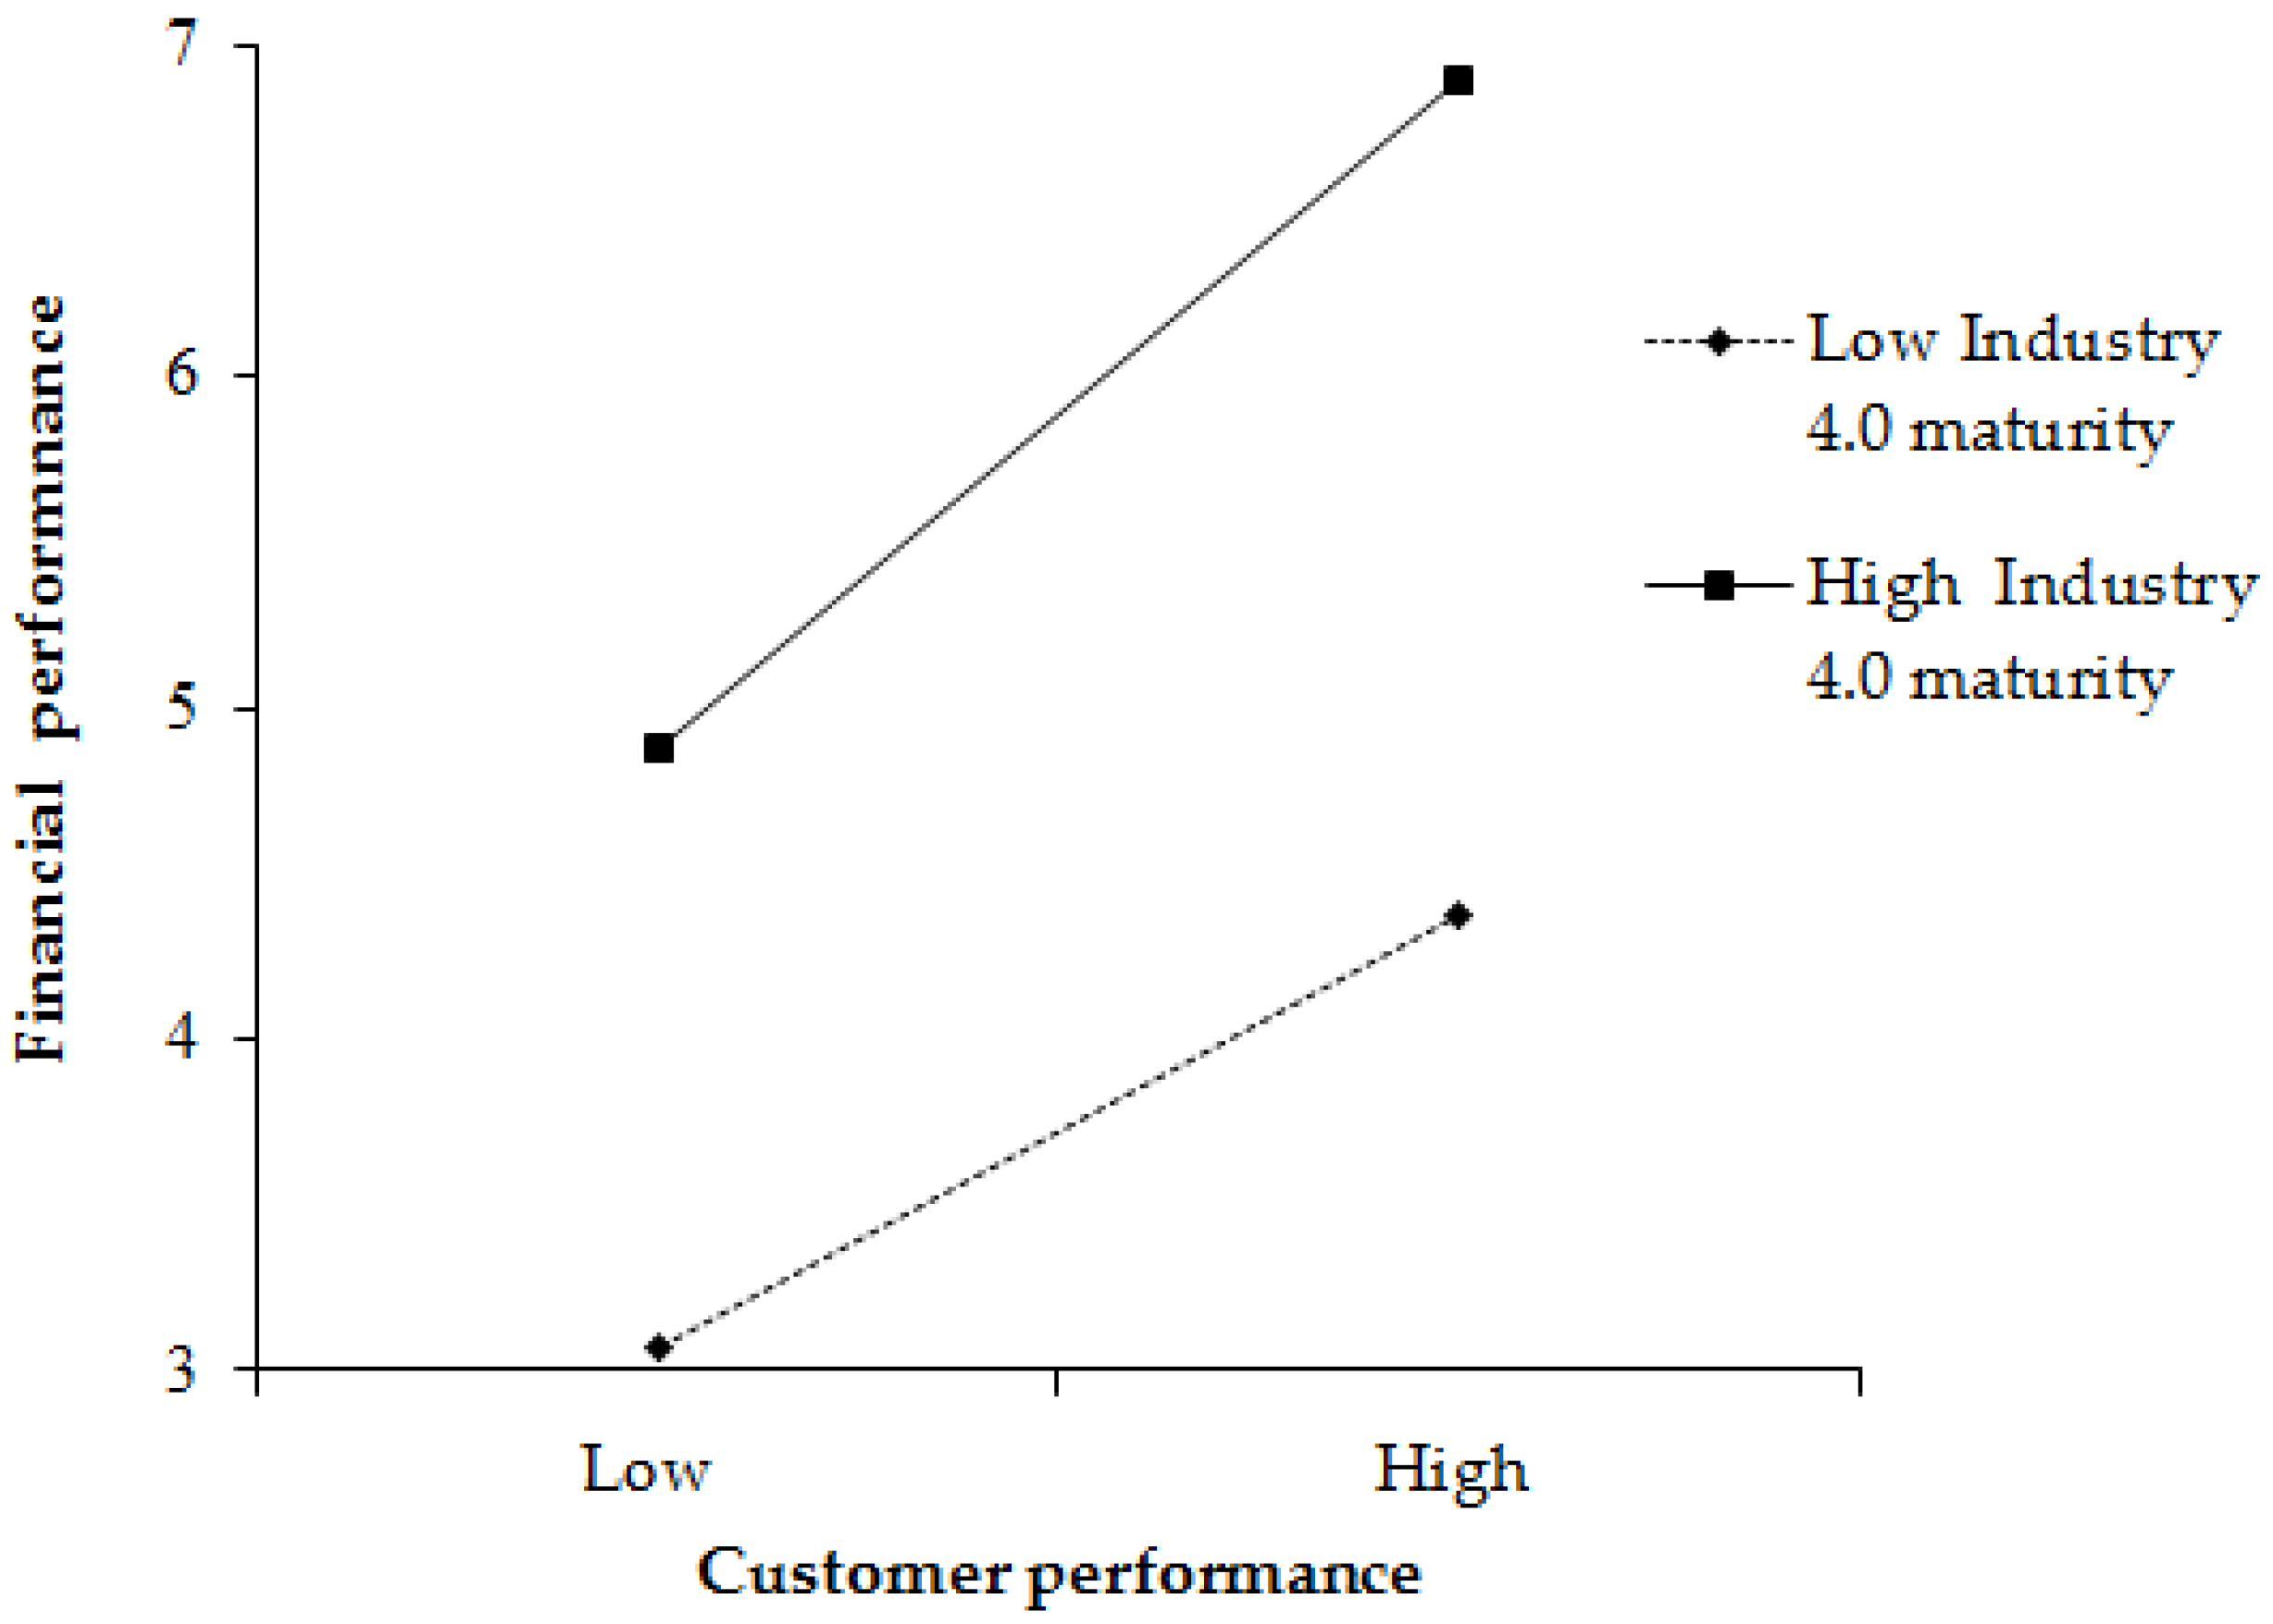
5.2. Hypotheses Testing

Subsequent to the measurement model’s validation, this study converts the item scales in each construct into a single composite score, following Kim and Schoenherr [61], Srinivasan and Swink [62], and Williams et al. [63]. The validity of these five constructs is supported by the fact that their AVEs exceed 0.50, and the standardized factor loadings of all items within each construct exceed 0.5 [59]. The Cronbach’s α values for the five constructs surpass the threshold value of 0.70, suggesting reliability in each construct [59].
Table 3 reports the results of the hypothesized moderated mediation model’s unstandardized regression weights using the bootstrap-based SEM [59] with 1000 bootstrap samples. Figure 2 structurally illustrates the moderated mediation model with 1000 bootstrap samples; path values are standardized coefficients. The RMSEA for the model is 0.01, and the respective Chi-square/DF, IFI, TLI, and CFI are 0.39, 1.00, 1.00, and 1.00, indicating a good fit [59].
As Table 3 shows, the unstandardized path coefficient (i.e., direct effect) of Industry 4.0 maturity to IBPP is significant at p < 0.05, implying that Industry 4.0 maturity considerably influences IBPP. Additionally, the bootstrapping bias-corrected 95% CI excludes zero, which confirms a statistically significant direct effect [64]. This supports Hypothesis 1, which states that Industry 4.0 maturity is positively related to IBPP.
This study makes similar conclusions about the significant direct effects of IBPP on SCP at p < 0.001, IBPP on customer performance at p < 0.001, SCP on customer performance at p < 0.05, and customer performance on financial performance at p < 0.05. The nonsignificant direct effects of Industry 4.0 maturity, IBPP, and SCP on financial performance are also confirmed by the bootstrapping bias-corrected 95% CIs that contain zero.
As also shown in Table 3, the unstandardized path coefficient for the interaction term (Industry 4.0 maturity*Customer performance) is statistically different from zero at p < 0.01. The bootstrapping test produces a bias-corrected 95% CI of 0.01–0.32, confirming that the interaction term is significant by excluding zero. These results support Hypothesis 4a, which states that Industry 4.0 maturity moderates the positive relationship between customer performance and financial performance.
Table 4 reports the results of bootstrap-based SEM analysis for the mediations with 1000 bootstraps. As the table shows, the indirect effects of IBPP on customer performance (B = 0.23, bias-corrected 95% CI = [0.01, 0.52], excluding zero), SCP on financial performance (B = 0.10, bias-corrected 95% CI = [0.01, 0.33], excluding zero), IBPP on financial performance (B = 0.18, bias-corrected 95% CI = [0.03, 0.42], excluding zero), and Industry 4.0 maturity on financial performance (B = 0.17, bias-corrected 95% CI = [0.03, 0.37], excluding zero), are all significant at the p < 0.05 level. The results support this study’s hypotheses that SCP mediates the positive relationship between IBPP and customer performance (Hypothesis 2), customer performance mediates the positive relationship between SCP and financial performance (Hypothesis 3a) and between IBPP and financial performance (Hypothesis 3b), and Industry 4.0 maturity influences financial performance via the multimediating effects of IBPP, SCP, and customer performance (Hypothesis 4b).
In addition, the nonsignificant direct effects of SCP and IBPP on financial performance (see Table 3 and Figure 3) suggest that customer performance fully mediates the positive relationship between SCP and financial performance, as well as the relationship between IBPP and financial performance, respectively. Likewise, the nonsignificant direct effect of Industry 4.0 maturity on financial performance implies that IBPP, SCP, and customer performance have full-mediating effects on the relationship between Industry 4.0 maturity and financial performance.
As also shown in the table, further analyzing the indirect effect paths of Hypothesis 4b reveals that only path two (i.e., Industry 4.0 maturity → IBPP → customer performance → financial performance; B = 0.05, bias-corrected 95% CI = [0.01, 0.20], excluding zero) and path three (i.e., Industry 4.0 maturity → IBPP → SCP → customer performance → financial performance; B = 0.02, bias-corrected 95% CI = [0.01, 0.11], excluding zero) are significant at p < 0.05.

6. Conclusions

This study extends the knowledge of how Industry 4.0 maturity influences corporate financial performance. The findings regarding the importance of IBPP, SCP, and customer performance on corporate financial outcomes are consistent with prior research (e.g., Ambroise et al. [36]; Rajapathirana and Hui [38]; Delic et al. [44]; Hutahayan [46]).
Specifically, previous studies of Industry 4.0 focus on how to advance the contemporary technologies necessary for developing Industry 4.0 (e.g., Imtiaz and Jasperneite, [17]; Rossit et al. [9]; Shrouf et al. [15]; Ungurean et al. [16]) or understanding how Industry 4.0 affects production processes (e.g., Büchi et al. [2]; Ivanov et al. [4]; Mazak and Huemer, [19]; Schlechtendahl et al. [21]). Relatively few studies focus on how Industry 4.0 maturity influences corporate financial performance.
This study develops and examines the theory that Industry 4.0 maturity affects corporate financial performance via IBPP, SCP, and customer performance, and it amplifies the positive effect of customer performance on financial performance. The results show that Industry 4.0 maturity significantly affects IBPP and SCP partially mediates the relationship between IBPP and customer performance. The results also reveal that customer performance fully mediates the relationships between SCP and financial performance and between IBPP and financial performance.
In particular, the presence of full mediation indicates that IBPP and SCP only indirectly influence corporate financial performance through customer performance. A direct managerial implication is, therefore, that managers who want to enhance financial performance by improving IBPP and SCP in the context of Industry 4.0 implementation should also target improving consumer performance to amplify their impact.
Further, the results show that a combination of IBPP, SCP, and customer performance fully mediates the relationship between Industry 4.0 maturity and financial performance. This indicates that Industry 4.0 maturity affects financial performance fully through IBPP, SCP, and customer performance. A direct managerial implication is that managers should recognize the critical roles of IBPP, SCP, and customer performance in realizing the value of Industry 4.0 implementation and its impact on financial returns. In particular, analysis of the multimediating effect paths reveals that only paths two and three (Table 4), which include customer performance, are significant. This implies that effective management of customer performance is the key to realizing the expected financial returns of Industry 4.0 implementation.
Furthermore, the results show that Industry 4.0 maturity positively moderates the relationship between customer performance and financial performance, suggesting that Industry 4.0 maturity strengthens that relationship. A graphical representation of the moderating role of Industry 4.0 maturity in Figure 4 reveals interesting nuances in the relationship. Company financial performance is lowest when there is poor customer performance and low Industry 4.0 maturity. High Industry 4.0 maturity has a relatively steep slope compared to low Industry 4.0 maturity. This indicates that the positive relationship between customer performance and financial performance strengthens when Industry 4.0 maturity increases. In addition, the figure reveals a large difference in financial performance between low and high Industry 4.0 maturity, demonstrating significant effects of Industry 4.0 maturity on company financial performance.
Finally, this study’s research methodology offers a practical way to understand the potential quantitative impacts of Industry 4.0 implementation. Table 5 summarizes the results for marginal effects, defined as the percentage change per input and the resulting percentage change in output. As shown in the table, for example, a 1% increase in Industry 4.0 maturity results in 0.22%, 0.19%, and 0.16% increases in IBPP, SCP, and customer performance, respectively, producing a combined marginal total effect (MTE) increase of 0.13% in financial performance. A 1% increase in IBPP results, respective, in 0.85% and 0.73% increases in SCP and customer performance, which further generates a MTE increase of 0.53% in financial performance, the largest MTE on financial performance. In addition, a 1% increase in SCP produces a 0.28% increase in customer performance, generating a 0.23% increase in financial performance. A 1% increase in customer performance results in a 0.30% increase in financial performance, which is the largest marginal direct effect (MTE) on financial performance.
As with any research, the current study has some limitations. First, although this study contacts 834 potential companies, only 110 completed the survey, providing 93 useful samples. Although this study integrates the bootstrap-based method with the analyses to ensure better generalization [64,65], future research should triangulate the research findings by using more samples.
Second, although this study’s hypotheses are based on an extensive review of the interdisciplinary literature, and the findings regarding the importance of IBPP, SCP, and customer performance on corporate financial performance are consistent with prior studies (e.g., Ambroise et al. [36]; Rajapathirana and Hui [38]; Delic et al. [44]; Hutahayan [46]), it is possible that the endogeneity problem exists in the research setting. For example, it is possible that Industry 4.0 maturity, IBPP, and SCP at time 1 influence customer performance at time 2, which in turn affects corporate financial performance at time 3.
Li [66] suggests a number of remedies for mitigating the endogeneity problem, such as lagged dependent variables, lagged independent variables, control variables, fixed effects, and GMM for dynamic models. Future research could gather additional longitudinal data (i.e., collecting data over time from the same individuals) and use a combination of methods (e.g., lagged independent and dependent methods) to explore further the cause-and-effect relationships established in this study.
Third, it is possible that factors such as a company’s organizational climate and structure influence its Industry 4.0 implementation [67]. This study does not explicitly explore these mediational paths. Future research could investigate the effects on Industry 4.0 maturity and thereby on corporate financial performance.
In sum, Industry 4.0 maturity significantly affects IBPP, and IBPP influences customer performance partially through SCP. IBPP and SCP affect financial performance fully through customer performance. The relationship between customer performance and financial performance is significantly stronger when Industry 4.0 maturity is higher. The findings indicate that Industry 4.0 magnifies the potential financial returns to companies mainly through IBPP, SCP, and customer performance.
This study addresses some of the fundamental issues of Industry 4.0 and adds to the literature’s understanding of how Industry 4.0 maturity influences corporate financial performance. Nevertheless, the direct effect of IBPP on customer performance is significant, suggesting the existence of potential mediators. This calls for more research on those possible mediators. In addition, more research on resolving or alleviating the research limitations will provide a comprehensive picture of how Industry 4.0 behaves and influences corporate performance.

Funding

The research is supported by the Ministry of Science and Technology (MOST Taiwan) under Grant No. MOST 107-2410-H-024-004. The APC was funded by MOST 109-2410-H-024 -013 -MY2.

Institutional Review Board Statement

Not applicable.

Informed Consent Statement

Not applicable.

Data Availability Statement

Data is contained within the paper.

Conflicts of Interest

The author declares no conflict of interest.

References

  1. Hermann, M.; Pentek, T.; Otto, B. Design principles for Industry 4.0 scenarios. In Proceedings of the 49th Hawaii International Conference on System Sciences (HICSS), Koloa, HI, USA, 5–8 January 2016; pp. 3928–3937. [Google Scholar]
  2. Büchi, G.; Cugno, M.; Castagnoli, R. Smart factory performance and Industry 4.0. Technol. Forecast. Soc. Chang. 2020, 150, 119790. [Google Scholar] [CrossRef]
  3. Liao, Y.; Deschamps, F.; Loures, E.D.F.R.; Ramos, L.F.P. Past, present and future of Industry 4.0—A systematic literature review and research agenda proposal. Int. J. Prod. Res. 2017, 55, 3609–3629. [Google Scholar] [CrossRef]
  4. Ivanov, D.; Dolgui, A.; Sokolov, B. The impact of digital technology and Industry 4.0 on the ripple effect and supply chain risk analytics. Int. J. Prod. Res. 2019, 57, 829–846. [Google Scholar] [CrossRef]
  5. Majeed, A.A.; Rupasinghe, T.D. Internet of things (IoT) embedded future supply chains for Industry 4.0: An assessment from an ERP-based fashion apparel and footwear industry. Int. J. Supply Chain Manag. 2017, 6, 25–40. [Google Scholar]
  6. Wang, J.; Li, D.; Hu, M.Y. Fog Nodes Deployment Based on Space-Time Characteristics in Smart Factory. IEEE Trans. Ind. Inform. 2021, 17, 3534–3543. [Google Scholar] [CrossRef]
  7. Marcucci, G.; Antomarioni, S.; Ciarapica, F.E.; Bevilacqua, M. The impact of Operations and IT-related Industry 4.0 key technologies on organizational resilience. Prod. Plan. Control 2021, 1–15. [Google Scholar] [CrossRef]
  8. Neumann, W.P.; Winkelhaus, S.; Grosse, E.H.; Glock, C.H. Industry 4.0 and the human factor—A systems framework and analysis methodology for successful development. Int. J. Prod. Econ. 2021, 233, 107992. [Google Scholar] [CrossRef]
  9. Rossit, D.A.; Tohmé, F.; Frutos, M. Industry 4.0: Smart Scheduling. Int. J. Prod. Res. 2019, 57, 3802–3813. [Google Scholar] [CrossRef]
  10. Vrchota, J.; Pech, M. Readiness of Enterprises in Czech Republic to Implement Industry 4.0: Index of Industry 4.0. Appl. Sci. 2019, 9, 5405. [Google Scholar] [CrossRef] [Green Version]
  11. Cascio, W.F.; Montealegre, R. How Technology Is Changing Work and Organizations. Annu. Rev. Organ. Psychol. Organ. Behav. 2016, 3, 349–375. [Google Scholar] [CrossRef]
  12. Murray, A. The New Industrial Revolution. Fortune 2015, 1, 6. [Google Scholar]
  13. Brougham, D.; Haar, J. Smart technology, artificial intelligence, robotics, and algorithms (STARA): Employees’ perceptions of our future workplace. J. Manag. Organ. 2017, 24, 239–257. [Google Scholar] [CrossRef] [Green Version]
  14. Yin, Y.; Stecke, K.E.; Li, D. The evolution of production systems from Industry 2.0 through Industry 4.0. Int. J. Prod. Res. 2018, 56, 848–861. [Google Scholar] [CrossRef] [Green Version]
  15. Shrouf, F.; Ordieres, J.; Miragliotta, G. Smart factories in Industry 4.0: A review of the concept and of energy management approached in production based on the Internet of Things paradigm. In Proceedings of the 2014 IEEE International Conference on Industrial Engineering and Engineering Management, Selangor, Malaysia, 9–12 December 2014; pp. 697–701. [Google Scholar]
  16. Ungurean, I.; Gaitan, N.C.; Gaitan, V.G. An IoT architecture for things from industrial environment. In Proceedings of the 10th International Conference on Communications (COMM), Bucharest, Romania, 29–31 May 2014; pp. 1–4. [Google Scholar]
  17. Imtiaz, J.; Jasperneite, J. Scalability of OPC-UA down to the chip level enables Internet of Things. In Proceedings of the 2013 11th IEEE International Conference on Industrial Informatics (INDIN), Bochum, Germany, 29–31 July 2013; pp. 500–505. [Google Scholar]
  18. Găitan, V.G.; Popa, V.; Turcu, C.; Gaitan, N.C.; Ungureanu, I.; Cristina, G.N. The Uniform Engineering of Distributed Control Systems Using the OPC Specification. Adv. Electr. Comput. Eng. 2008, 8, 71–77. [Google Scholar] [CrossRef]
  19. Mazak, A.; Huemer, C. A standards framework for value networks in the context of Industry 4.0. In Proceedings of the IEEE International Conference on Industrial Engineering and Engineering Management (IEEM), Singapore, 6–9 December 2015; pp. 1342–1346. [Google Scholar]
  20. Lee, J.; Bagheri, B.; Kao, H.-A. A Cyber-Physical Systems architecture for Industry 4.0-based manufacturing systems. Manuf. Lett. 2015, 3, 18–23. [Google Scholar] [CrossRef]
  21. Schlechtendahl, J.; Keinert, M.; Kretschmer, F.; Lechler, A.; Verl, A. Making existing production systems Industry 4.0-ready. Prod. Eng. 2015, 9, 143–148. [Google Scholar] [CrossRef]
  22. Ivanov, D.; Dolgui, A.; Sokolov, B.; Werner, F.; Ivanova, M. A dynamic model and an algorithm for short-term supply chain scheduling in the smart factory industry 4.0. Int. J. Prod. Res. 2016, 54, 386–402. [Google Scholar] [CrossRef] [Green Version]
  23. Shiue, Y.-R.; Lee, K.-C.; Su, C.-T. Real-time scheduling for a smart factory using a reinforcement learning approach. Comput. Ind. Eng. 2018, 125, 604–614. [Google Scholar] [CrossRef]
  24. Lin, B.; Wu, W.; Song, M. Industry 4.0: Driving factors and impacts on firm’s performance: An empirical study on China’s manufacturing industry. Ann. Oper. Res. 2019, 186, 1–21. [Google Scholar] [CrossRef]
  25. Michna, A.; Kmieciak, R. Open-Mindedness Culture, Knowledge-Sharing, Financial Performance, and Industry 4.0 in SMEs. Sustainability 2020, 12, 9041. [Google Scholar] [CrossRef]
  26. Birkel, H.S.; Hartmann, E. Impact of IoT challenges and risks for SCM. Supply Chain Manag. Int. J. 2019, 24, 39–61. [Google Scholar] [CrossRef]
  27. Kaplan, R.S.; Norton, D.P. Using the balance scorecard as a strategic management system. Harv. Bus. Rev. 1996, 74, 75–85. [Google Scholar]
  28. Beamon, B.M. Designing the green supply chain. Logist. Inf. Manag. 1999, 12, 332–342. [Google Scholar] [CrossRef] [Green Version]
  29. Kaplan, R.S.; Norton, D.P. Having trouble with your strategy? Then map it. Harv. Bus. Rev. 2001, 78, 167–176. [Google Scholar]
  30. Fischer, T.M.; Sawczyn, A.A. The relationship between corporate social performance and corporate financial performance and the role of innovation: Evidence from German listed firms. J. Manag. Control 2013, 24, 27–52. [Google Scholar] [CrossRef]
  31. Cochran, P.L.; Wood, R.A. Corporate Social Responsibility and Financial Performance. Acad. Manag. J. 1984, 27, 42–56. [Google Scholar] [CrossRef]
  32. Orlitzky, M.; Schmidt, F.L.; Rynes, S.L. Corporate Social and Financial Performance: A Meta-Analysis. Organ. Stud. 2003, 24, 403–441. [Google Scholar] [CrossRef]
  33. Moeuf, A.; Pellerin, R.; Lamouri, S.; Tamayo-Giraldo, S.; Barbaray, R. The industrial management of SMEs in the era of Industry 4.0. Int. J. Prod. Res. 2018, 56, 1118–1136. [Google Scholar] [CrossRef] [Green Version]
  34. Won, J.Y.; Park, M.J. Smart factory adoption in small and medium-sized enterprises: Empirical evidence of manufacturing industry in Korea. Technol. Forecast. Soc. Chang. 2020, 157, 120117. [Google Scholar] [CrossRef]
  35. Flynn, B.B.; Koufteros, X.; Lu, G. On Theory in Supply Chain Uncertainty and Its Implications for Supply Chain Integration. J. Supply Chain Manag. 2016, 52, 3–27. [Google Scholar] [CrossRef] [Green Version]
  36. Huo, B. The impact of supply chain integration on company performance: An organizational capability perspective. Supply Chain Manag. Int. J. 2012, 17, 596–610. [Google Scholar] [CrossRef]
  37. Ralston, P.M.; Blackhurst, J.; Cantor, D.E.; Crum, M.R. A Structure-Conduct-Performance Perspective of How Strategic Supply Chain Integration Affects Firm Performance. J. Supply Chain Manag. 2015, 51, 47–64. [Google Scholar] [CrossRef]
  38. Peng, J.; Quan, J.; Zhang, G.; Dubinsky, A.J. Mediation effect of business process and supply chain management capabilities on the impact of IT on firm performance: Evidence from Chinese firms. Int. J. Inf. Manag. 2016, 36, 89–96. [Google Scholar] [CrossRef]
  39. Ambroise, L.; Prim-Allaz, I.; Teyssier, C. Financial performance of servitized manufacturing firms: A configuration issue between servitization strategies and customer-oriented organizational design. Ind. Market Manag. 2018, 71, 54–68. [Google Scholar] [CrossRef]
  40. Liu, H.; Wei, S.; Ke, W.; Wei, K.K.; Hua, Z. The configuration between supply chain integration and information technology competency: A resource orchestration perspective. J. Oper. Manag. 2016, 44, 13–29. [Google Scholar] [CrossRef]
  41. Rajapathirana, R.J.; Hui, Y. Relationship between innovation capability, innovation type, and firm performance. J. Innov. Knowl. 2018, 3, 44–55. [Google Scholar] [CrossRef]
  42. Van Looy, A.; Shafagatova, A. Business process performance measurement: A structured literature review of indicators, measures and metrics. SpringerPlus 2016, 5, 1797. [Google Scholar] [CrossRef] [PubMed] [Green Version]
  43. Chen, H.L. Supply chain risk’s impact on corporate financial performance. Int. J. Oper. Prod. Manag. 2018, 38, 713–731. [Google Scholar] [CrossRef]
  44. Delic, M.; Eyers, D.R.; Mikulic, J. Additive manufacturing: Empirical evidence for supply chain integration and performance from the automotive industry. Supply Chain Manag. Int. J. 2019, 24, 604–621. [Google Scholar] [CrossRef]
  45. Feng, T.; Wang, D.; Lawton, A.; Luo, B.N. Customer orientation and firm performance: The joint moderating effects of ethical leadership and competitive intensity. J. Bus. Res. 2019, 100, 111–121. [Google Scholar] [CrossRef]
  46. Hutahayan, B. The mediating role of human capital and management accounting information system in the relationship between innovation strategy and internal process performance and the impact on corporate financial performance. Benchmarking Int. J. 2020, 27, 1289–1318. [Google Scholar] [CrossRef]
  47. Napoleone, A.; Macchi, M.; Pozzetti, A. A review on the characteristics of cyber-physical systems for the future smart factories. J. Manuf. Syst. 2020, 54, 305–335. [Google Scholar] [CrossRef]
  48. Podsakoff, P.M.; Organ, D.W. Self-Reports in Organizational Research: Problems and Prospects. J. Manag. 1986, 12, 531–544. [Google Scholar] [CrossRef]
  49. Agca, O.; Gibson, J.; Godsell, J.; Ignatius, J.; Davies, C.W.; Xu, O. An Industry 4 Readiness Assessment Tool; WMG-The University of Warwick: Coventry, UK, 2017. [Google Scholar]
  50. Veza, I.; Mladineo, M.; Peko, I. Analysis of the current state of Croatian manufacturing industry with regard to industry 4.0. In Proceedings of the 15th International Scientific Conference on Production Engineering—CIM’2015: Computer Integrated Manufacturing and High Speed Machining, Vodice, Croatia, 10–13 June 2015; pp. 249–254. [Google Scholar]
  51. Butler, A.; Letza, S.R.; Neale, B. Linking the balanced scorecard to strategy. Long Range Plan. 1997, 30, 242–253. [Google Scholar] [CrossRef]
  52. Grigoroudis, E.; Orfanoudaki, E.; Zopounidis, C. Strategic performance measurement in a healthcare organisation: A multiple criteria approach based on balanced scorecard. Omega 2012, 40, 104–119. [Google Scholar] [CrossRef]
  53. Drongelen, I.C.K.; Bilderbeek, J. R&D performance measurement: More than choosing a set of metrics. R&D Manag. 1999, 29, 35–46. [Google Scholar] [CrossRef]
  54. Lee, H.L.; Billington, C. Material Management in Decentralized Supply Chains. Oper. Res. 1993, 41, 835–847. [Google Scholar] [CrossRef] [Green Version]
  55. Noordewier, T.; John, G.; Nevin, J. Performance outcomes of purchasing arrangement in industrial buyer-vendor relationships. J. Mark. 1990, 54, 80–93. [Google Scholar] [CrossRef]
  56. Podsakoff, P.M.; Mackenzie, S.B.; Lee, J.Y.; Podsakoff, N.P. Common method biases in behavioral research: A critical review of the literature and recommended remedies. J. Appl. Psychol. 2003, 88, 879–903. [Google Scholar] [CrossRef]
  57. Aral, S.; Weill, P. IT assets, organizational capabilities and firm performance: How resource allocations and organisational differences explain performance variation. Organ. Sci. 2007, 18, 763–780. [Google Scholar] [CrossRef]
  58. Dang, C.; Li, Z.; Yang, C. Measuring firm size in empirical corporate finance. J. Bank. Financ. 2018, 86, 159–176. [Google Scholar] [CrossRef]
  59. Kline, R.B. Principles and Practice of Structural Equation Modeling; The Guilford Press: New York, NY, USA, 2015. [Google Scholar]
  60. Olya, H.G.; Altinay, L. Asymmetric modeling of intention to purchase tourism weather insurance and loyalty. J. Bus. Res. 2016, 69, 2791–2800. [Google Scholar] [CrossRef]
  61. Kim, Y.H.; Schoenherr, T. The Effects of Supply Chain Integration on the Cost Efficiency of Contract Manufacturing. J. Supply Chain Manag. 2018, 54, 42–64. [Google Scholar] [CrossRef]
  62. Srinivasan, R.; Swink, M. An investigation of visibility and flexibility as complements to supply chain analytics: An organizational information processing theory perspective. Prod. Oper. Manag. 2018, 27, 1849–1867. [Google Scholar] [CrossRef]
  63. Williams, B.D.; Roh, J.; Tokar, T.; Swink, M. Leveraging supply chain visibility for responsiveness: The moderating role of internal integration. J. Oper. Manag. 2013, 31, 543–554. [Google Scholar] [CrossRef]
  64. Preacher, K.J.; Hayes, A.F. Asymptotic and resampling strategies for assessing and comparing indirect effects in multiple mediator models. Behav. Res. Methods 2008, 40, 879–891. [Google Scholar] [CrossRef] [PubMed]
  65. Chen, H.L.; Lin, Y.L. Goal orientations, leader-leader exchange, trust, and the outcomes of project performance. Int. J. Proj. Manag. 2018, 36, 716–729. [Google Scholar] [CrossRef]
  66. Li, F. Endogeneity in CEO power: A survey and experiment. Invest. Anal. J. 2016, 45, 149–162. [Google Scholar] [CrossRef]
  67. Zwikael, O.; Meredith, J.R. The role of organizational climate in setting project goals. Int. J. Oper. Prod. Manag. 2019, 39, 1281–1294. [Google Scholar] [CrossRef]
Figure 1. Hypothesized moderated mediation model.
Sustainability 13 06069 g001
Figure 2. Hypothesized moderated mediation model statistical diagram.
Sustainability 13 06069 g002
Figure 3. Bootstrap-based SEM analysis results of the model with 1000 bootstraps. Path values are standardized coefficients.
Sustainability 13 06069 g003
Figure 4. Relationship between customer performance and financial performance at low and high Industry 4.0 maturity (1000 bootstraps).
Sustainability 13 06069 g004
Table 1. Sample demographic characteristics.
VariablesTotal ResponsesPercentageCumulative Percentage
Industry
Chemicals33.23.2
Biotechnology77.410.6
Petrochemical22.112.8
Automotive66.419.1
Textiles44.323.4
Food44.327.7
Rubber22.129.8
Optoelectronic77.437.2
Semiconductor55.342.6
Electrical distribution22.144.7
Electronics2021.366.0
Iron and steel44.370.2
Electric machinery1313.884.0
Construction and building materials22.186.2
Miscellaneous1313.8100.0
Firm size (Equity: $ millions)
1.00–10.001111.811.8
10.01–50.571516.128.0
50.58–892.141415.143.0
892.15–1871.431314.057.0
1871.44–4254.291415.172.0
4254.30–14,764.001314.086.0
14,764.00+1314.0100.0
Job title
CEOs/General managers99.79.7
Senior managers4144.153.8
Managers1516.169.9
Directors2223.793.5
Others66.5100.0
Table 2. Results of convergent and discriminant validity.
ConstructMeanMin.Max.SDCRAVEASV
Industry 4.0 maturity2.58140.660.910.640.02
Financial performance4.98370.940.860.740.21
Customer performance5.23470.740.830.600.33
IBPP5.21470.770.800.640.40
SCP5.29470.740.890.680.38
Note: SD = standard deviation; CR = composite reliability; AVE = average variance extracted; and ASV = average shared squared variance.
Table 3. Bootstrap-based structural model: unstandardized regression weights with 1000 bootstraps.
SourcesParameter EstimatesBootstrapping Bias-Corrected 95% CI
DependentIndependentBSECRpLowerUpper
IBPPIndustry 4.0 maturity0.260.122.210.0270.010.51
SCPIBPP0.820.0515.73<0.0010.710.91
Customer performanceIBPP0.470.133.68<0.0010.160.75
Customer performanceSCP0.280.132.060.0400.0160.62
Financial performanceSCP0.190.200.960.335−0.290.59
Financial performanceCustomer performance0.380.152.470.0140.020.71
Financial performanceIBPP0.220.201.070.285−0.130.70
Financial performanceIndustry 4.0 maturity0.020.120.180.860−0.230.27
Financial performanceIndustry 4.0 maturity*Customer performance0.190.072.890.0040.010.32
Financial performanceEquity0.090.081.200.234−0.070.29
Chi-square 3.89
Degree of freedom (DF) 10.00
Incremental fit index (IFI) 1.00
Tucker–Lewis index (TLI) 1.00
Comparative fit index (CFI) 1.00
Standardized root mean square residual (SRMR) 0.03
Root mean square error of approximation (RMSEA) 0.01
Note: The unit of a corporation’s equity is millions. B = coefficient, SE = standard error, CR = critical ratio, p = probability, and CI = confidence interval.
Table 4. Results of bootstrap-based SEM analysis for the mediations with 1000 bootstraps.
Theoretical RelationshipIndirect EffectBootstrapping Bias-Corrected 95% CI
BSELowerUpperp
Hypothesis 2
IBPP → SCP → customer performance0.230.120.010.520.041
Hypothesis 3a
SCP → customer performance → financial performance0.100.100.010.330.042
Hypothesis 3b
IBPP → customer performance → financial performance0.180.080.030.420.023
Hypothesis 4b
Industry 4.0 maturity → IBPP + SCP + customer performance → financial performance0.170.090.030.370.025
Hypothesis 4b’s indirect effect paths
Path 1: Industry 4.0 maturity → IBPP → financial performance0.060.06−0.020.270.145
Path 2: Industry 4.0 maturity → IBPP → customer performance → financial performance0.050.040.010.200.028
Path 3: Industry 4.0 maturity → IBPP → SCP → customer performance → financial performance0.020.030.010.110.042
Path 4: Industry 4.0 maturity → IBPP → SCP → financial performance0.040.06−0.040.200.244
Note: B = coefficient, SE = standard error, p = probability, and CI = confidence interval.
Table 5. Bootstrap-based SEM analysis of standardized marginal direct, indirect, and total effects.
VariableIndustry 4.0 MaturityIBPPSCPCustomer Performance
MDEMIEMTEMDEMIEMTEMDEMIEMTEMDEMIEMTE
IBPP0.22 0.22
SCP 0.190.190.85 0.85
Customer performance 0.160.160.490.240.730.28 0.28
Financial performance0.010.120.130.180.350.530.150.080.230.30 0.30
Note: 1000 bootstraps. MDE = marginal direct effect, MIE = marginal indirect effect, and MTE = marginal total effect.
Publisher’s Note: MDPI stays neutral with regard to jurisdictional claims in published maps and institutional affiliations.

